PowerShell for Dummies - GSX | Office 365 End-User ... Folder Database ..... 7...
19
White Paper White Paper PowerShell for Dummies Project: Supervision Targeted Product: GSX Monitor & Analyzer
Transcript of PowerShell for Dummies - GSX | Office 365 End-User ... Folder Database ..... 7...
White Paper
White Paper
PowerShell for Dummies
Project: Supervision
Targeted Product: GSX Monitor & Analyzer
White Paper
Introduction: A Bit of History ................................................ 3
Starting with PowerShell ..................................................... 4
Prerequisites .................................................................... 5
Exchange Management Shell ................................................. 5
Remote Power Shell ............................................................ 5
First Syntax ...................................................................... 6
Get Information and configure your environment ......................... 7
Get Exchange server .......................................................... 7
Get-mailbox ..................................................................... 7
Get-Active Sync Device ........................................................ 7
Get-Public Folder Database ................................................... 7
Get-MailboxDatabase........................................................... 7
Monitor and troubleshoot your environment ............................... 8
Testing Autodiscover Testing the mailbox server core functionalities… 8
Get-MailboxDatabaseCopyStatus.............................................. 8
Test-Mapi Connectivity ........................................................ 9
Testing the HUB queues ....................................................... 9
Content
1
White Paper
Get-Queue ....................................................................... 9
Testing the Client access Server ............................................ 10
Test-Owa Connectivity ....................................................... 10
Active Sync Connectivity ..................................................... 11
Test-Outlook connectivity ................................................... 12
Reports on Usage of Your Environment .................................... 13
First command: Get-mailbox ................................................ 13
Second one: Get-Mailbox Statistics ......................................... 13
Get-Logon Statistics .......................................................... 14
PowerShell limitations ........................................................ 14
Maintainability ................................................................. 14
Automating and alerting ..................................................... 14
Storing the information ...................................................... 15
Trending availability and usage statistics ................................. 15
One Solution: GSX Monitor & Analyzer ..................................... 16
Your Next Action .............................................................. 17
2
White Paper
At first it was a project: A code name Monad. Why Monad? The name came from a book written by Leibniz called “Monadologie.” It explained that reality is composed of fundamental elements (Monades), which are all integrated into a predefined harmony. Well, it’s a beautiful origin and a good analogy here would be that PowerShell is a set of tasks executed by a set of component all integrated into what we call PowerShell. Previously named Microsoft Command Shell (MSH), PowerShell is a script language, and a shell, that has been created with Microsoft .NET Framework. The first beta appeared on Nov. 9, 2005, with a final version available on Nov. 14, 2006. To focus on Exchange, PowerShell has been integrated to Exchange since 2007. The problem there is that this first version of PowerShell did not integrate remote capabilities. Thus, every command had to be run directly on the Exchange server. Since PowerShell v2, which came with the Exchange 2007 Service Pack 2, the remote session is now available. This means that now you can run PowerShell script from any computer that has a remote access to the Exchange server. And, as you will see in this White Paper, it’s a big deal! Since the 2010 wave of Microsoft products, PowerShell is at the heart of administrative capabilities. This technology is becoming more powerful than ever, and it will not cease to grow in the future. So, it is important to start becoming familiar with it. Using PowerShell scripting to monitor an Exchange environment can be a daunting task for Exchange administrators, especially when they do not know how to automate the main cmdlets. This White Paper deals with the utilization of basic PowerShell commands that will enable the user to monitor, troubleshoot and get some statistics from your environment. Finally, we will focus on PowerShell limitations, and how to easily they can be solved, thanks to GSX Monitor & Analyzer.
Introduction: A Bit of History
3
White Paper
First, let’s describe some basic components of this Shell: The cmdlets execute the tasks, for which they are designed. PowerShell uses a system of syntax that allows commands to be piped. This means that the output of a cmdlet can be the entry of another one, without any change needing to occur. It is called “Piping.” Think about an assembly line, where the object is operated in different ways through each phase, just like a car (welding doors, adding windows, installing seats). For Example: Get-Service | Sort-Object Status. Simplified navigation in the operation system allows the user to browse the registry and other data pools, like one would do inside a file system.
• Powerful features can manipulate objects that will be sent to other databases tools, if needed. • Easy integration into third-party tools can be used in the PowerShell to help administrators automate tasks.
For Example: GSX Monitor & Analyzer! So, now that we’ve seen the philosophy and the main characteristics of the “tool,” let’s go into its utilization.
Starting with PowerShell
4
White Paper
PowerShell has been part of every operating system since it was first implemented in Windows 7, and Windows Server 2008 R2. However, it is possible to install it on Windows XP and Windows Server 2003. When PowerShell is installed, launch “powershell.exe” and use the basic cmdlets to access the system. However, it is important to notice that specific sets of cmdlets, such as those for Exchange 2010, are stored in a “snappin,” or module. A snappin/module is installed with the technology, and it is possible to import such snappin/module into another session. In order to execute PowerShell cmdlets on an Exchange servers, there are different ways to proceed.
Exchange Management Shell The easiest way to start with Exchange cmdlets is to remote the desktop into one Exchange servers and launch the “Exchange Management Shell.” This is the equivalent of the Management Console for managing Exchange, but without the interface. It is also possible to install the “Management tools” that include the Management shell on remote computers.
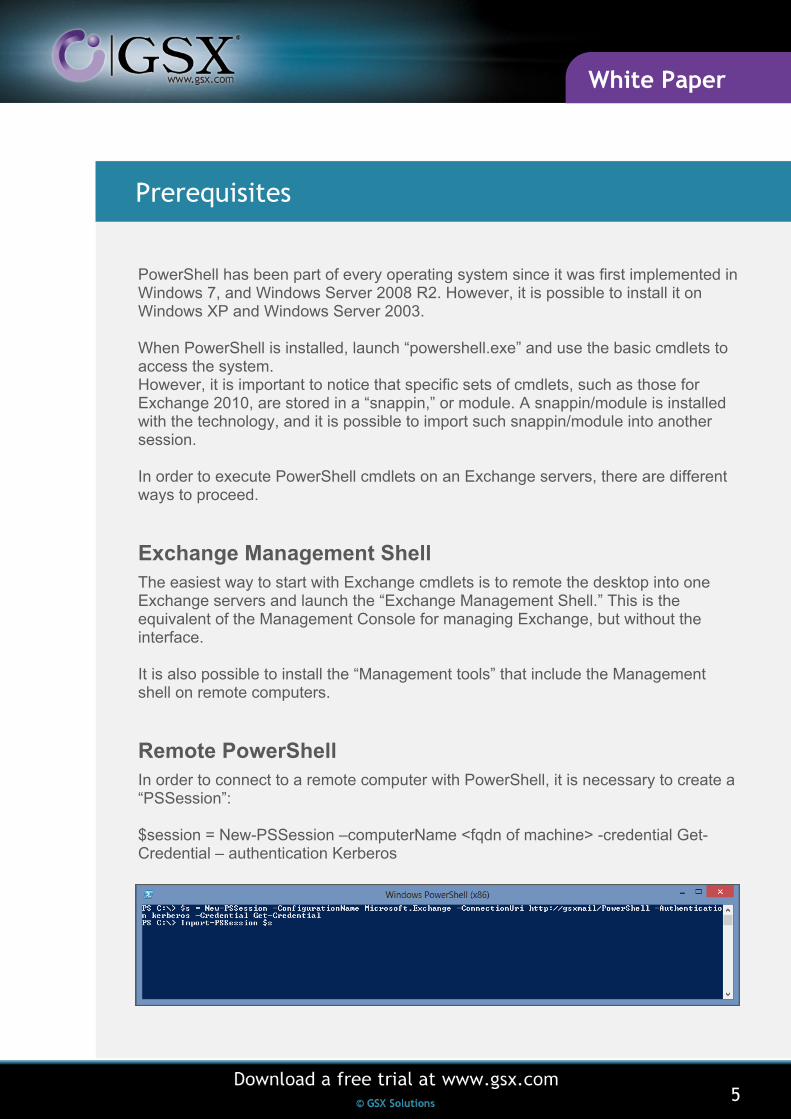
Remote PowerShell In order to connect to a remote computer with PowerShell, it is necessary to create a “PSSession”: $session = New-PSSession –computerName <fqdn of machine> -credential Get-Credential – authentication Kerberos
Prerequisites
5
White Paper
For connecting to Exchange directly: $session = New-PSSession -credential Get-Credential –authentication Kerberos –connectionURI http://<FQDN of Exc server>/PowerShell –configurationName Microsoft.Exchange
First Syntax Let’s cover the Syntax very quickly. PowerShell cmdlets are always written following the syntax “verb-resource”. Action verbs like “new,” “get,” “remove,” and “set” can be used. For instance, to receive a service you would use “Get-Service”. There are two cmdlets that are specifically important: Get-Help and Get-Command. These will give you the list of commands and attributes that you are able to execute on your environment. For all the common cmdlets, there are aliases that allow you to call them. For example:
• Get Help with the aliases “man” or “help” • Get Command with the alias “gcm”
Note: For the command “get-help,” you can use the parameters “-full” or “-online” to getmore details. Using “-full” will display the full help along with examples. Meanwhile, “- online” will display the TechNet article on the cmdlet. Coming back to Exchange, once a session is created, you can either:
• Import the session, and then work as if you were on the remote computer with thecommand: Import-PSSession $session => Implicit remoting.
• Enter the session with the command: Enter-PSSession $session => Explicit remoting.
• Invoke the commands on the remote computer with: Invoke-Command { any cmdlet here} –session $session.
While remoting onto multiple computers at the same time, using implicit remoting with prefixes or invoking commands will be easier to use. The cmdlet “Invoke-Command” contains a parameter “computername” that accepts a list of computer names (separated by commas).
6
White Paper
Now that we have a grasp of the basics, let’s focus on the commands that will help you directly with the administration of your Exchange environment.
Get Exchange server It retrieves all the server parts of the current organization, with their name, site, roles, version and edition, AD server. To view all the Exchange server attributes that this cmdlet returns, you must pipe the command to the Format-List cmdlet.
Get-mailbox The Get-Mailbox cmdlet retrieves attributes and objects for a mailbox. No parameters are required. If the cmdlet is used without a parameter, all mailboxes in the organization are listed. You can use the Get-Mailbox cmdlet to view mailbox objects and attributes, populate property pages, or supply mailbox information to other tasks.
Get-ActiveSyncDevice You can use the Get-ActiveSyncDevice cmdlet to retrieve the list of devices in your organization that have active Microsoft Exchange ActiveSync partnerships. The Get- ActiveSyncDevice cmdlet returns identification, configuration, and status information for each device.
Get-PublicFolderDatabase For those who still have “Public folder,” this command returns attributes of all of the public folder databases in the Exchange organization.
Get-MailboxDatabase You can use the Get-MailboxDatabase cmdlet to retrieve one or more mailbox database objects from a server or organization. If you use the Get-MailboxDatabase cmdlet with no parameters, it gets information about all mailbox databases in the Exchange organization. If you use the Get-MailboxDatabase cmdlet with the Server parameter, it gets information about all mailbox databases on the server that you specify. To return specific database properties (including backup and mount status information), make sure you use the “Status” parameter.
Get Information and configure your environment
7
White Paper
Now that you have all the information you need about your environment, let’s try to monitor it and troubleshoot problems. For that, a bunch of commandlets exist. We will focus on a very small part of them for you to follow.
Testing Autodiscover Autodiscover is a central point in the CAS infrastructure. This configures user profile settings for Outlook clients automatically and provides access to Exchange features. Hence, constantly checking its health is critical. The OutlookWebServices test performs several PowerShell tests to measure the availability and performance of the Autodiscover service. It tries to retrieve the configuration parameters of a test mailbox for multiple services. These include:
• Availability Service: This is a free busy calendar service. • Offline Address Book: This is used to synchronize remote clients. • Outlook Anywhere: This was formerly known as RPC/HTTP. • Unified Messaging: This checks if everything is well configured to access
this key service.
Testing the mailbox server core functionalities
Get-MailboxDatabaseCopyStatus This command retrieves current statuses of the mailbox databases of the current server,along with the copyQueueLength, the ReplayQueueLength, the ContentIndexState and the server hosting the active Database copy. If a database is specified by using a command with the Identity parameter, the status of all copies of the database is returned. If a server is specified by using a command with the Server parameter, information on all database copies on the server is returned.
Monitor and troubleshoot your environment
8
White Paper
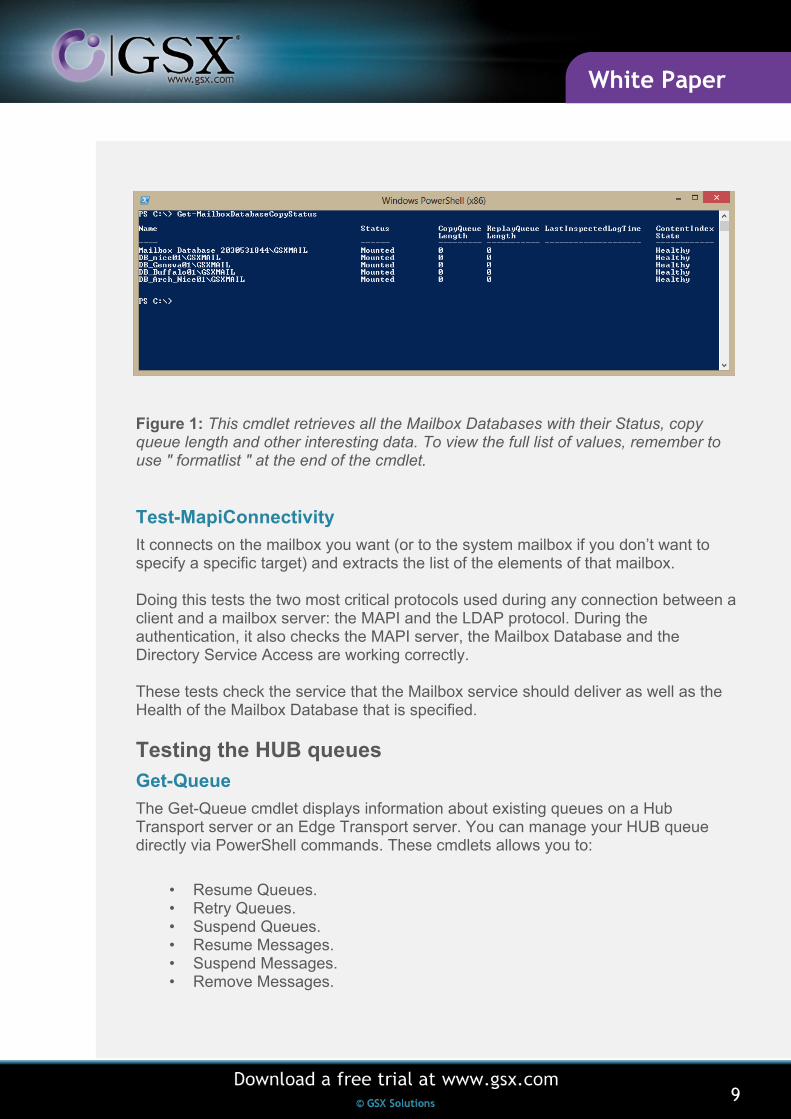
Figure 1: This cmdlet retrieves all the Mailbox Databases with their Status, copy queue length and other interesting data. To view the full list of values, remember to use " formatlist " at the end of the cmdlet. Test-MapiConnectivity
It connects on the mailbox you want (or to the system mailbox if you don’t want to specify a specific target) and extracts the list of the elements of that mailbox. Doing this tests the two most critical protocols used during any connection between a client and a mailbox server: the MAPI and the LDAP protocol. During the authentication, it also checks the MAPI server, the Mailbox Database and the Directory Service Access are working correctly. These tests check the service that the Mailbox service should deliver as well as the Health of the Mailbox Database that is specified.
Testing the HUB queues
Get-Queue
The Get-Queue cmdlet displays information about existing queues on a Hub Transport server or an Edge Transport server. You can manage your HUB queue directly via PowerShell commands. These cmdlets allows you to:
• Resume Queues. • Retry Queues. • Suspend Queues. • Resume Messages. • Suspend Messages. • Remove Messages.
9
White Paper
Testing the Client access Server Regarding the Client Access Server, you should use commands that test configured protocols. These commands include:
• Test OWA Connectivity. • Test POP and IMAP Connectivity. • Test Active Sync Connectivity. • Test Outlook Connectivity.
Next, let’s describe the most useful tests: OWA, Active Sync and Outlook Connectivity:
Test-OwaConnectivity
You can use the Test-OwaConnectivity cmdlet to verify that Microsoft Office Outlook Web App is running as expected. The Test-OwaConnectivity cmdlet can be used to test Outlook Web App connectivity for all Microsoft Exchange Server 2010 virtual directories on a specified Client Access server. The Test-Owa-Connectivity can also be used for all mailboxes on servers running Exchange within the same Active Directory site.
The Test-OwaConnectivity cmdlet can also be used to test the connectivity of an individual Exchange Outlook Web App URL.
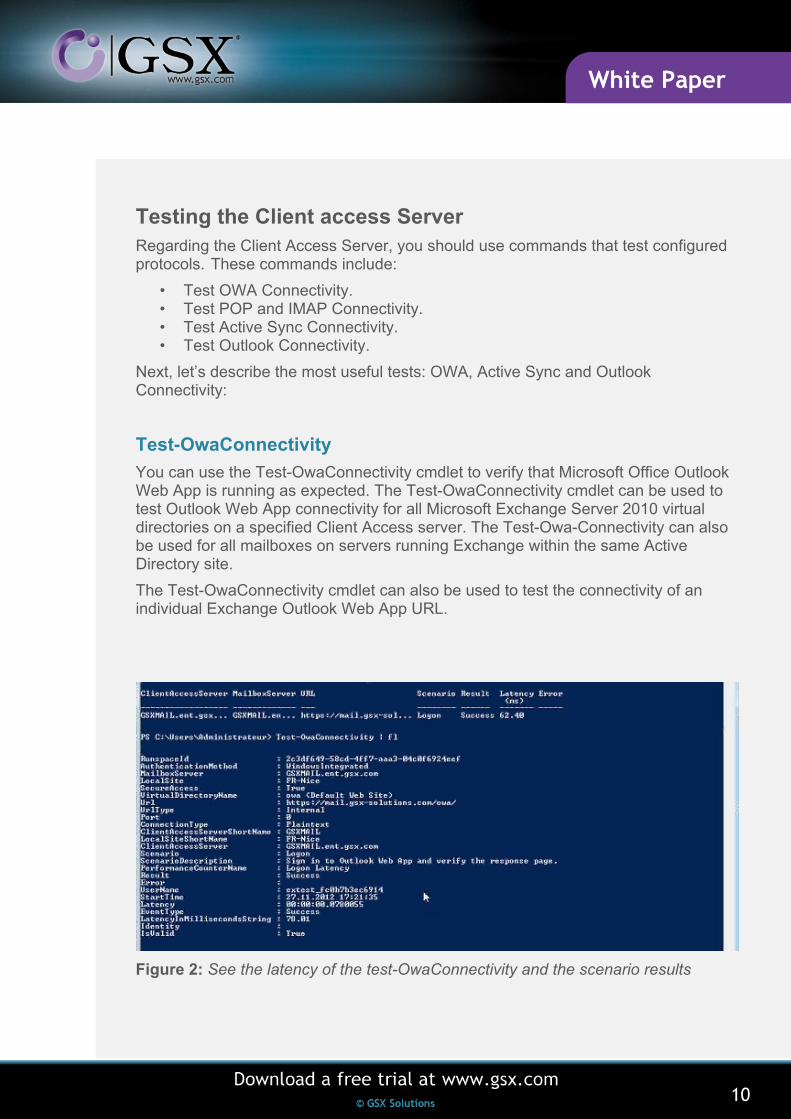
Figure 2: See the latency of the test-OwaConnectivity and the scenario results
10
White Paper
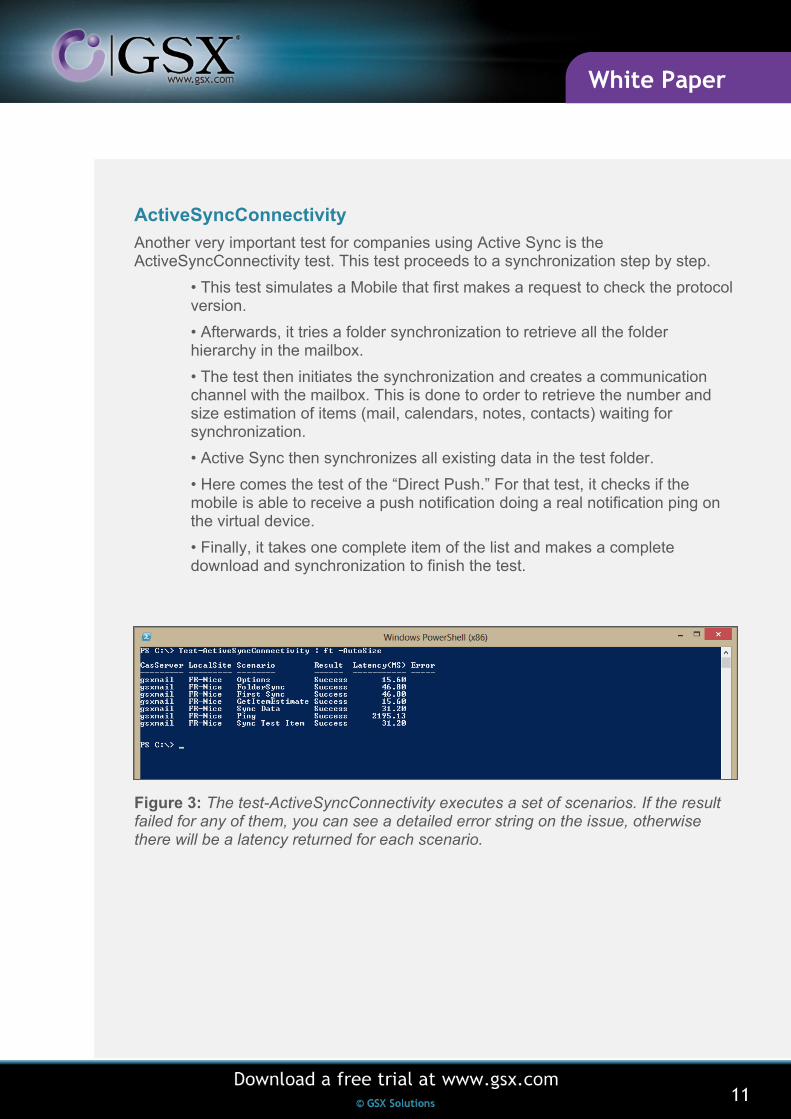
ActiveSyncConnectivity
Another very important test for companies using Active Sync is the ActiveSyncConnectivity test. This test proceeds to a synchronization step by step.
• This test simulates a Mobile that first makes a request to check the protocol version.
• Afterwards, it tries a folder synchronization to retrieve all the folder hierarchy in the mailbox.
• The test then initiates the synchronization and creates a communication channel with the mailbox. This is done to order to retrieve the number and size estimation of items (mail, calendars, notes, contacts) waiting for synchronization.
• Active Sync then synchronizes all existing data in the test folder.
• Here comes the test of the “Direct Push.” For that test, it checks if the mobile is able to receive a push notification doing a real notification ping on the virtual device.
• Finally, it takes one complete item of the list and makes a complete download and synchronization to finish the test.
Figure 3: The test-ActiveSyncConnectivity executes a set of scenarios. If the result failed for any of them, you can see a detailed error string on the issue, otherwise there will be a latency returned for each scenario.
11
White Paper
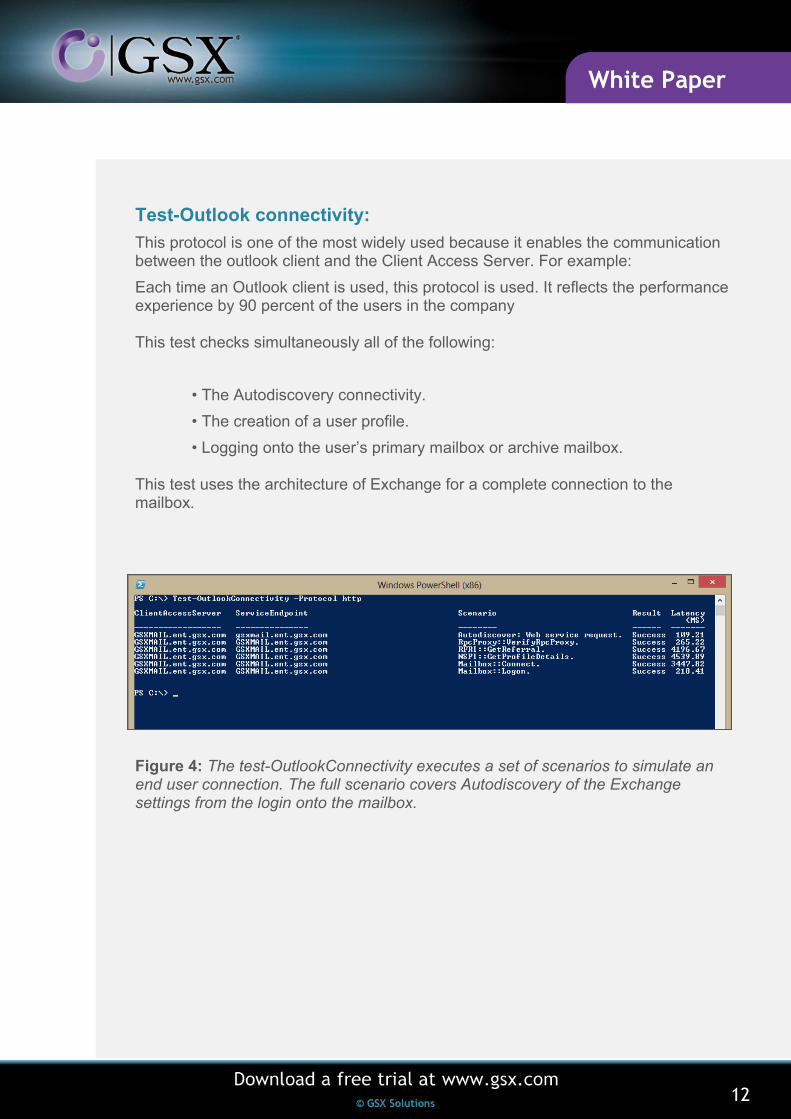
Test-Outlook connectivity:
This protocol is one of the most widely used because it enables the communication between the outlook client and the Client Access Server. For example:
Each time an Outlook client is used, this protocol is used. It reflects the performance experience by 90 percent of the users in the company This test checks simultaneously all of the following:
• The Autodiscovery connectivity.
• The creation of a user profile.
• Logging onto the user’s primary mailbox or archive mailbox. This test uses the architecture of Exchange for a complete connection to the mailbox.
Figure 4: The test-OutlookConnectivity executes a set of scenarios to simulate an end user connection. The full scenario covers Autodiscovery of the Exchange settings from the login onto the mailbox.
12
White Paper
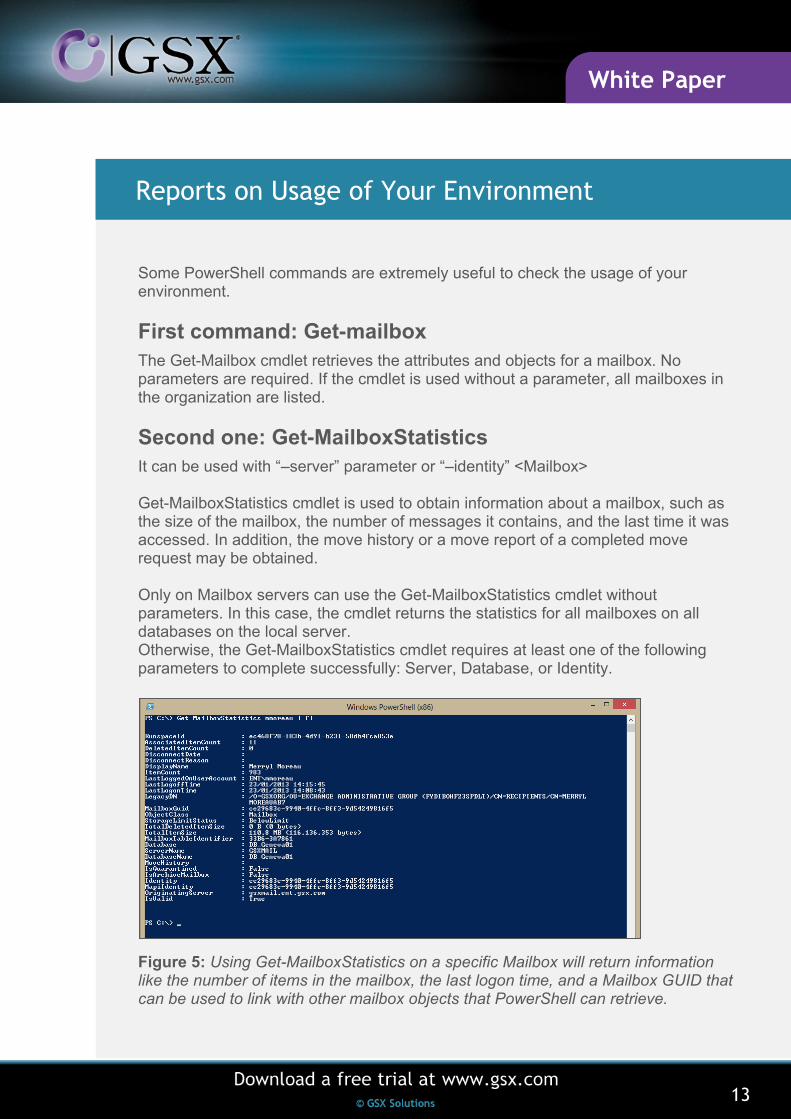
Some PowerShell commands are extremely useful to check the usage of your environment.
First command: Get-mailbox The Get-Mailbox cmdlet retrieves the attributes and objects for a mailbox. No parameters are required. If the cmdlet is used without a parameter, all mailboxes in the organization are listed.
Second one: Get-MailboxStatistics It can be used with “–server” parameter or “–identity” <Mailbox> Get-MailboxStatistics cmdlet is used to obtain information about a mailbox, such as the size of the mailbox, the number of messages it contains, and the last time it was accessed. In addition, the move history or a move report of a completed move request may be obtained. Only on Mailbox servers can use the Get-MailboxStatistics cmdlet without parameters. In this case, the cmdlet returns the statistics for all mailboxes on all databases on the local server. Otherwise, the Get-MailboxStatistics cmdlet requires at least one of the following parameters to complete successfully: Server, Database, or Identity. Figure 5: Using Get-MailboxStatistics on a specific Mailbox will return information like the number of items in the mailbox, the last logon time, and a Mailbox GUID that can be used to link with other mailbox objects that PowerShell can retrieve.
Reports on Usage of Your Environment
13
White Paper
Get-LogonStatistics The Get-LogonStatistics cmdlet retrieves logon information about currently active session. Usually, you can only use Get-LogonStatistics cmdlets on Mailbox servers without parameters.In that case, the cmdlet returns the logon statistics for all mailboxes on all databases within the local server. Of course, there are many other PowerShell commands that exist to retrieve additional useful statistics. Now that we have seen how PowerShell is powerful, let speak about its limitations…
As we’ve just seen, you can run multiple commands in PowerShell, build a pipe of commands to perform complex actions, and you can get information, monitor your environment or see instant statistics. Hence, you can create multiple scripts to make checks in your environment. But, the first limitation that comes with any script is maintainability.
Maintainability Any script that runs into your environment may cause this same issue. Scripts are made by people and dedicated to a particular environment. As soon as people or the environment changes, you may have problems to maintaining them. So in most cases, you are forced to do it again and again. Avoiding script allows you to have a clean environment, but in this case you cannot check your environment as thoroughly as you probably should. So, you need a tool that runs and maintains all the scripts for you.
Automating and alerting It is fine to be able to test your environment every once in a while, but if this action is not done on a regular basis you cannot anticipate or detect problems. You will only become aware of problems when your users start complaining. That’s when PowerShell is manually utilized; it is more for troubleshooting purposes rather than real monitoring. Of course, you could have several people running the script every five minutes to detect problem, but it is not the best solution to be taken.
PowerShell limitations
14
White Paper
Monitoring without an alerting procedure is not recommended. PowerShell’s purpose does not including sending mail, popups or even alerts to SCOM when the performance is slow or fails to work. That is also a reason why it’s so difficult to conduct monitoring with PowerShell.
Storing the information Another point that comes with the lack of automation is the storage of the information. After each test, the result is erased. There isn’t any way to store the information into a databaseautomatically. That is why PowerShell tests do not allow you to see historical trends about performance and availabilities within your environment.
Trending availability and usage statistics This problem is even more sensitive when it comes to reporting. Reports are made of historical data. Thus, getting historical data through PowerShell isn’t easy… If you want to calculate SLAs, or have an overview of the availability, performance and usage of your environment within the last seven days, four months or two years, it will be very, very difficult. Even with SCOM, you’ll need a SQL expert to use a Report Builder, which isn’t the best tool choice. Hopefully, there is a solution to all these problems.
15
White Paper
GSX Monitor & Analyzer offers a simple solution to all these problems. GSX Monitor & Analyzer is a monitoring and reporting tool made of a remote PowerShell.Without any code on servers, it performs all the tests we have seen earlier, in addition to a lot of other tests that check the availability and performance of your environment. Basically, you can consider it as a machine that performs multiple PowerShell tests on all your servers regularly, displays the results in a graphical interface and stores the performance and availability statistics in real time, gives historical or forecasting trends and alerts you in case of performance slow down or system unavailability. It is not a problem anymore maintaining script, because the tool is made of this and automatically adapts to new environments. It is not a problem to store each of the results stored into its database for immediate availability concerning that information, or trending capability. It is not a problem anymore to be alerted before your users, because many of the alerts are based on performance counters that you define on the results of these tests. PowerShell is used by GSX because it enables the best tests possible on your Exchange servers using the Exchange components as a user and understands the way Exchange works. GSX Monitor and Analyzer is based on the following:
• A scanning engine to automate PowerShell tests. • An Alert system to alert on PowerShell tests. • A PowerShell discovery of the environment. • Servers’ role PowerShell availability and performance tests. • DAG performance and availability tests as an entity. • CAS Array performance and availability test as an entity. • Mail Routing test from and an end user’s perspective. • PowerShell tests performance statistics on display and storage. • PowerShell tests performance statistics on trending and forecasting.
GSX has over 600 large customers with huge and complex infrastructures worldwide. Our philosophy has always been to improve our products with our customers, working closely with them on their expectations.
One Solution: GSX Monitor & Analyzer
16
White Paper
All of our products also follow several philosophies, which include the following:
• They are Agentless with a quick learning curve. • They are simple to maintain. • They automate all the monitoring and reporting tasks. • A single product is able to monitor and report on Exchange, SharePoint, BlackBerry and IBM with the same key point.
• Watch a live demo of our GSX Monitor & Analyzer solution at http://www.gsx.com/GSX-Podcast-Webinar-PowerShell-Cmdlets-Automation/
• Ask for a live demo of our GSX Monitor & Analyzer solution and fill out the format http://web.gsx.com/request-a-demonstration-microsoft-exchange-and-sharepoint
• Contact us at [email protected]
Your Next Action
17
White Paper
GSX Solutions [email protected]
BLOG
GSX-Solutions www.gsx.com/ blog
GSX_Solutions GSX-Groupware-Solutions
GSXSolutions


![[Webinar] PowerShell series part 3 – PowerShell and WMI](https://static.fdocuments.net/doc/165x107/559b61c31a28ab125f8b47a2/webinar-powershell-series-part-3-powershell-and-wmi.jpg)