PowerPoint Presentationeorganic.info/sites/eorganic.info/files/u461/Management to Reduce... ·...
18
2/27/2014 1 Management to Reduce N2O Emissions in Organic Vegetable Production Ann-Marie Fortuna North Dakota State University Douglas Collins, Washington State University February 25, 2014 Welcome to the webinar! • The webinar will start at the top of the hour. • If you’d like to type in a question, use the question box on your control panel and we will read the questions aloud after the c. 45 minute presentation • The webinar will be recorded and you can find the recording and a pdf handout of the slides at http://www.extension.org/pages/70280 Craig Cogger Douglas Collins Ann-Marie Fortuna
Transcript of PowerPoint Presentationeorganic.info/sites/eorganic.info/files/u461/Management to Reduce... ·...

2/27/2014
1
Management to Reduce N2O Emissions in Organic Vegetable
Production
Ann-Marie FortunaNorth Dakota State University
Douglas Collins, Washington State University
February 25, 2014
Welcome to the webinar!
• The webinar will start at the top of the hour.
• If you’d like to type in a question, use the question box on your control panel and we will read the questions aloud after the c. 45 minute presentation
• The webinar will be recorded and you can find the recording and a pdf handout of the slides at http://www.extension.org/pages/70280
Craig Cogger Douglas CollinsAnn-Marie Fortuna
2/27/2014
2
Management to reduce N2O emissions in
Organic Vegetable Production Systems
Part 2:
Current research on alternative
organic farming systems
Ann-Marie Fortuna, NDSU
Doug Collins, WSU
Craig Cogger, WSU
4 x 7.5” image
OutlinePart A – Doug Collins
• History and development of organic farming
systems research in Western Washington
• Review our sampling strategy for trace gases,
including CO2 and NO2
• Preliminary flux analyses
OutlinePart B – Ann-Marie Fortuna
• Understanding the fundamental processes
that drive the release of N from organic
sources.
• Identify and quantify, key microbial
community members that control nitrification
and denitrification in different organic farming
systems.
• Link best management practices to soil
quality and the microbiology underpinning C
and N cycling.
2/27/2014
3
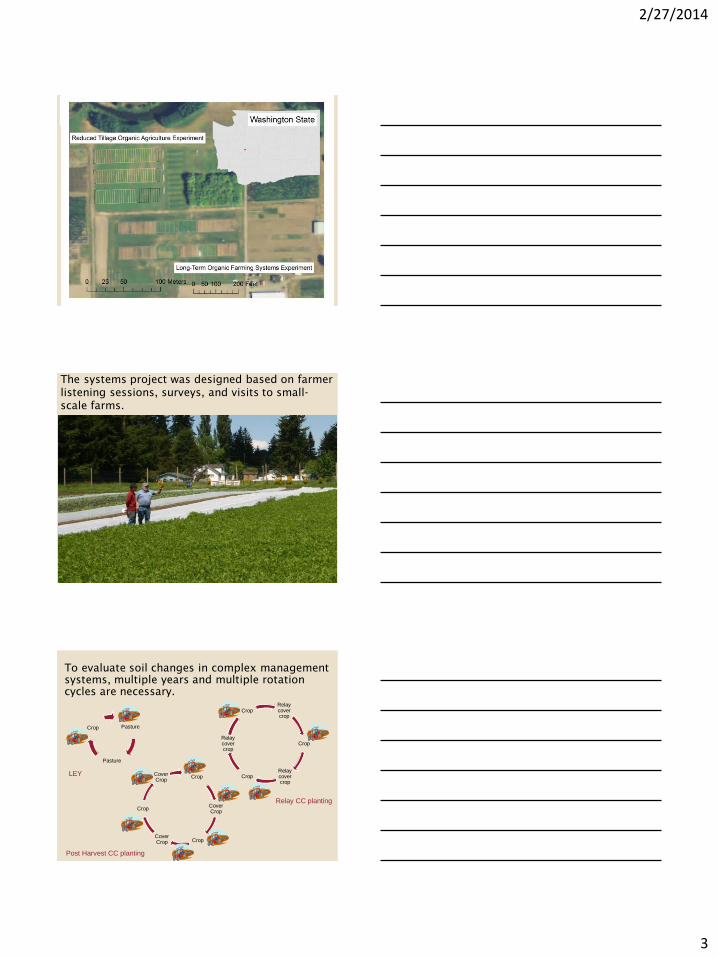
The Long-Term Organic Vegetable Farming
Systems and Reduced Tillage Organic Plots
The systems project was designed based on farmer
listening sessions, surveys, and visits to small-
scale farms.
To evaluate soil changes in complex management
systems, multiple years and multiple rotation
cycles are necessary.
Pasture
Pasture
Crop
Relay cover crop
Crop
Relay cover crop
Crop
Relay cover crop
Crop
Crop
Cover Crop
CropCover Crop
Crop
Cover Crop
LEY
Post Harvest CC planting
Relay CC planting

2/27/2014
4
Three Cover Crop Treatments
Relay planted
Legume
(RLY)
Post-Harvest
Cereal & legume
(PH)
Short-term
Grass-legume
Pasture (LEY)
Pastured poultry (Freedom Rangers) in traveling cages
Sheep in plots during ley rotation

2/27/2014
5
Soil amendments include High-C
compost and Low-C broiler litter.
Chicken (Broiler) litter: (CKN)
Low C application (1.8 - 3.1 dt/ac)
Mixed on-farm compost: (OFC)
High C application (8 - 17 dt/acre)
In Systems plots, gas measurements are taken on LEY, High C application, and Low C application
Event Event Date GC Gas/Soil samples
Amendment
ApplicationJune 18th
Pre-till (day -1), Post-till (days
0,1,2,3,7,15)
Irrigation July 16thPreirrigation (day 0), Postirrigation
(days 1,2)
Incorporation September 26thPreincorporation (day -6),
Postincorporation (day 1)
Freeze/Thaw1 November 22nd Frozen (day 0), Thawed (day 3)
Freeze/Thaw2 December 5th Frozen (day 0), Thawed (day 11)
Soil quality measurements include
physical, chemical, and biological
indicators
Bulk Density
Infiltration
Compaction
Particulate OM
Enzyme activity
Nematodes
Collembola
Microbial biomass
Nitrogen cycling
Microbial community structure
Nutrients and carbon
2/27/2014
6
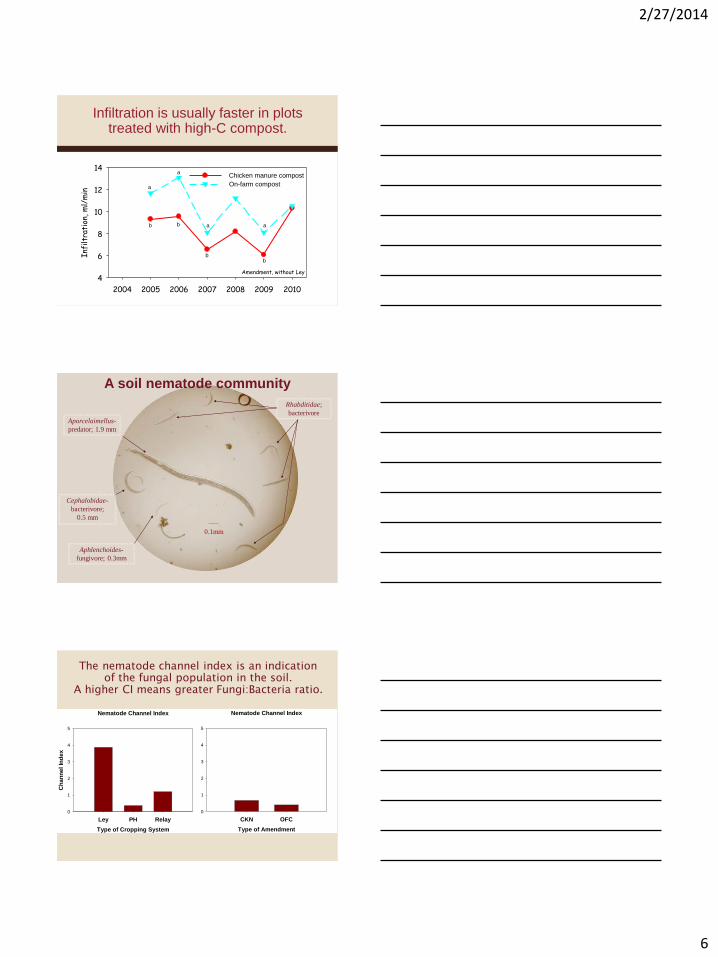
Infiltration is usually faster in plots treated with high-C compost.
Amendment, without Ley
2004 2005 2006 2007 2008 2009 2010
Infi
ltra
tion
, m
l/m
in
4
6
8
10
12
14Chicken manure compost
On-farm composta
b
a
b a
b
a
b
A soil nematode community
Aporcelaimellus-
predator; 1.9 mm
Cephalobidae-
bacterivore;
0.5 mm
Aphlenchoides-
fungivore; 0.3mm
Rhabditidae;
bacterivore
0.1mm
The nematode channel index is an indication
of the fungal population in the soil.
A higher CI means greater Fungi:Bacteria ratio.
Nematode Channel Index
Type of Cropping System
Ley PH Relay
Ch
an
ne
l In
de
x
0
1
2
3
4
5
Nematode Channel Index
Type of Amendment
CKN OFC
0
1
2
3
4
5
a
b b

2/27/2014
7
What does tillage do?
•Manage residue
•Manage weeds
•Prepare seed bed
•Aeration
•Modify moisture
•Modify temperature
Organic Matter
Soil Organisms
Soil Structure
Aggregate Stability
Water Holding Capacity
Water Infiltration
Carbon Sequestration
Field Access
Profitability?
Soil Compaction
Erosion
Surface Crusting
Dust
Sediment
Fuel Use
Greenhouse Gases
Why reduce tillage?
Progress on reduced tillage research in organic
production
• 2008-09 On farm- cereal rye
• 2009-10 WSU Puyallup- barley, wheat
• 2010-11 WSU Puyallup- barley, vetch
• 2011-12 WSU Puyallup & Mt Vernon,
3 On farm sites 19 varieties and
mixes barley, rye, oats vetch peas
triticale
• 2012-13 WSU Puyallup & Mt Vernon 3 on
farm sites 16 varieties and mixes
rye, barley vetch
2/27/2014
8
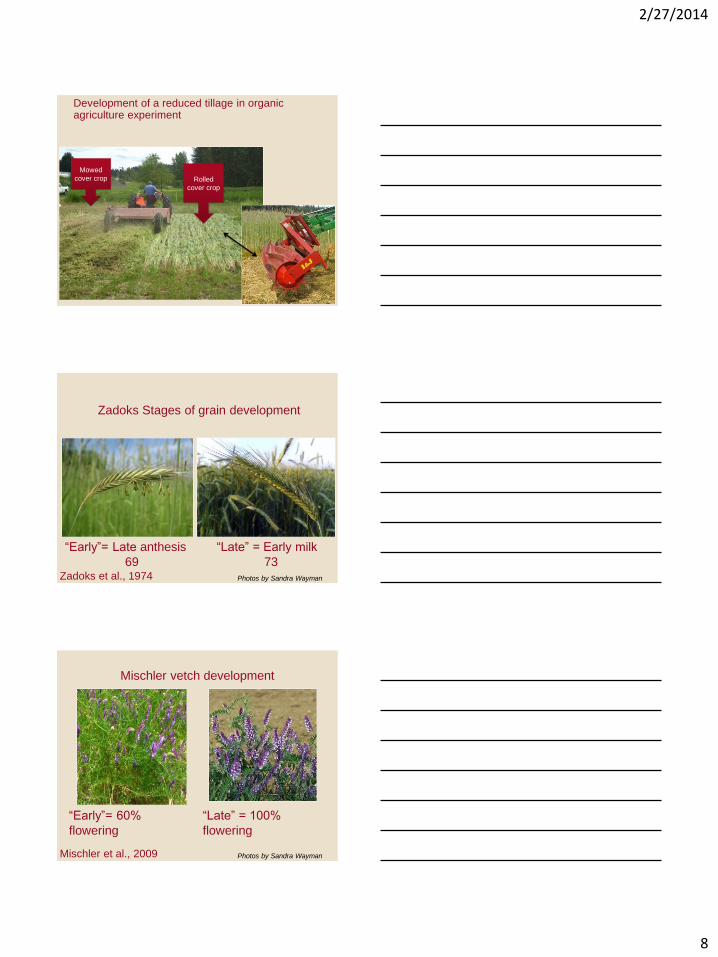
Development of a reduced tillage in organic agriculture experiment
Rolled
cover crop
Mowed
cover crop
Zadoks Stages of grain development
“Early”= Late anthesis
69
“Late” = Early milk
73Zadoks et al., 1974 Photos by Sandra Wayman
Mischler vetch development
“Late” = 100%
flowering
“Early”= 60%
flowering
Mischler et al., 2009 Photos by Sandra Wayman
2/27/2014
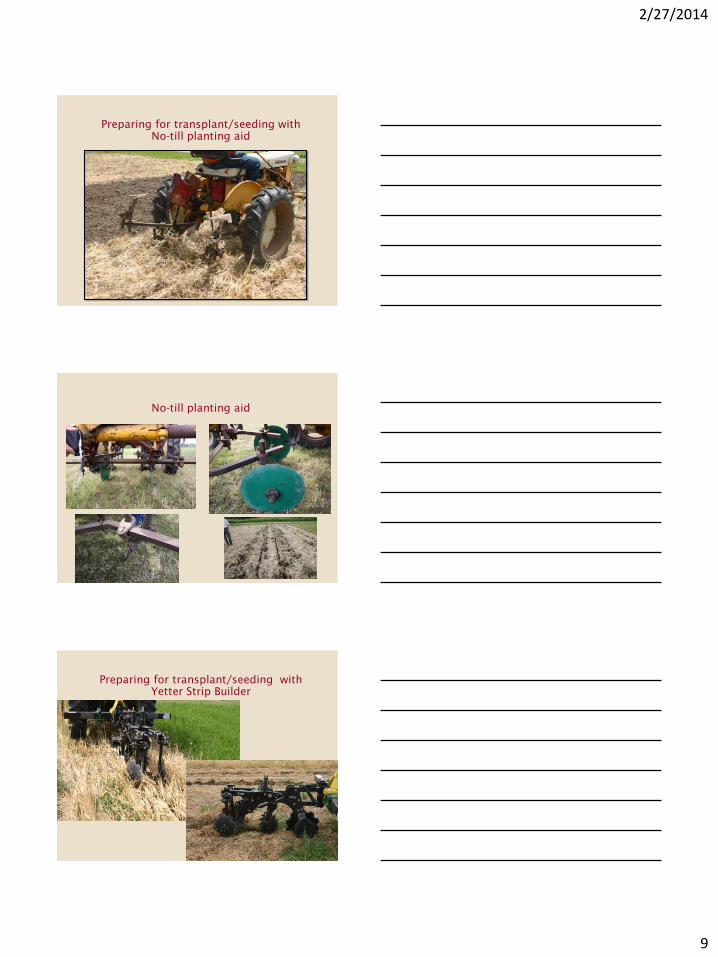
9
Preparing for transplant/seeding with
No-till planting aid
No-till planting aid
Preparing for transplant/seeding with
Yetter Strip Builder

2/27/2014
10
Bu
lk D
en
sity
0.0
0.2
0.4
0.6
0.8
1.0
1.2
1.4
FlailST
FlailPA
FullTill
RollST
RollPA
FlailST
FlailPA
FullTill
RollST
RollPA
2012 2013
AB
AB
C
A
BBAB
AB AB
Bulk density tends to be greater in reduced till plots
Soil temperature is greater in full till plots
Soil moisture is greater in reduced-till plots
2/27/2014
11
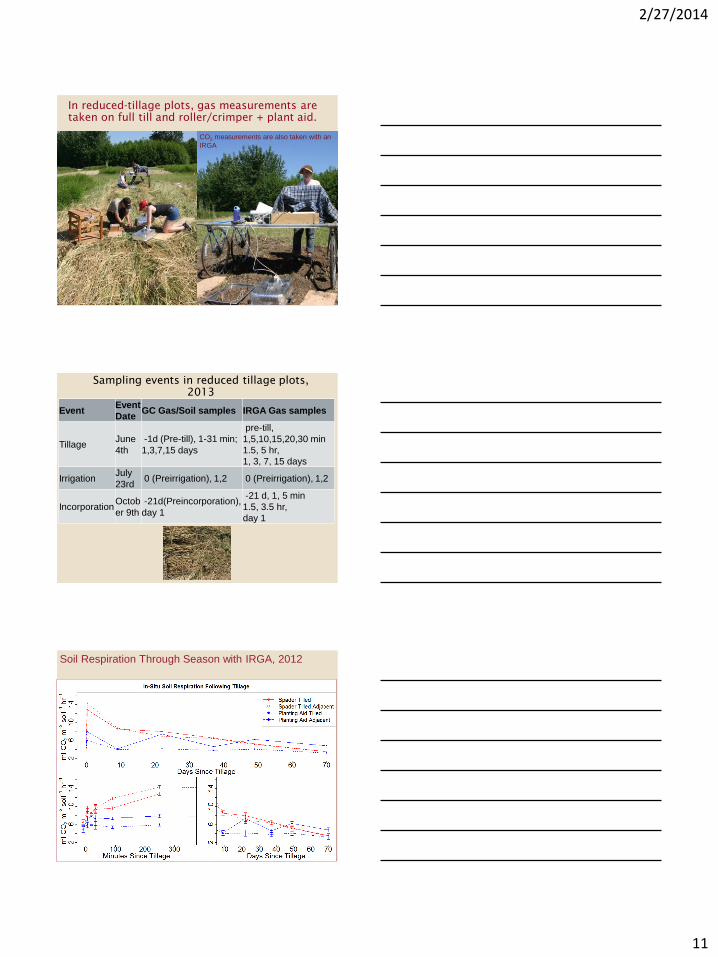
In reduced-tillage plots, gas measurements are
taken on full till and roller/crimper + plant aid.
Insert picture of IRGA sampling
CO2 measurements are also taken with an
IRGA
Sampling events in reduced tillage plots,
2013
EventEvent
DateGC Gas/Soil samples IRGA Gas samples
TillageJune
4th
-1d (Pre-till), 1-31 min;
1,3,7,15 days
pre-till,
1,5,10,15,20,30 min
1.5, 5 hr,
1, 3, 7, 15 days
IrrigationJuly
23rd0 (Preirrigation), 1,2 0 (Preirrigation), 1,2
IncorporationOctob
er 9th
-21d(Preincorporation),
day 1
-21 d, 1, 5 min
1.5, 3.5 hr,
day 1
Soil Respiration Through Season with IRGA, 2012

2/27/2014
12
NO2 Flux Calculations are being done
with R package HMR1
1Pederson, Petersen, and Schelde. 2010. A comprehensive approach to soil-atmosphere trace-
gas flux estimation with static chambers. Eur J. Soil Sci. 61:888-902.
Plot 117 B NO2 Plot 117 C NO2
0 15 30
min0 15 30
Figure by Bethany Wolters
Plot 221 A NO2
0 15 30
minFigure by Bethany Wolters
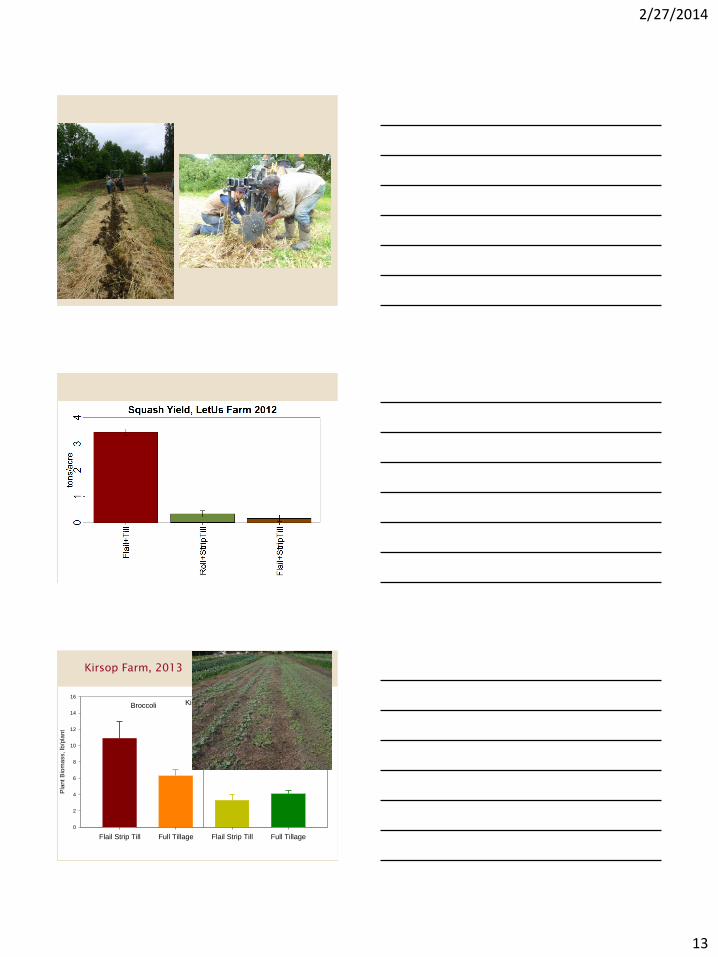
Adoption and On-Farm Trials
Steve Hallstrom, Let Us Farm
2/27/2014
13
Kirsop Farm, 2013
Kirsop Farm
Flail Strip Till Full Tillage Flail Strip Till Full Tillage
Pla
nt
Bio
ma
ss,
lb/p
lan
t
0
2
4
6
8
10
12
14
16
KaleBroccoli

2/27/2014
14
Microbial Matters, the Link Between Soil
Quality and microbial processes
regulating N2O production
•Understand processes that drive the
release of N from organic sources,
identify and quantify microbial
community members controlling
nitrification and denitrification
•Which short-term biological
indicators can be used to assess
seasonal & long-term changes in
soil quality & GHGs?
Biological & Chemical Indicators of Soil Quality
•Enzyme activity (nitrifier, denitrifier)
•Nitrogen cycling (nitrogen mineralization)
•Nutrients (P, K) (fertililty)
• total organic soil carbon
•Particulate organic matter
•Microbial community structure
2/27/2014
15
•Biological measures of soil quality such as
nitrifier and denitrifier rates & gene
copy numbers (~biomass) are indicators
of N fertility, soil quality & relate to the
potential for N2O production
•Nitrification and nitrifiers are sensitive
indicators that reflect short and long-
term management in organic systems
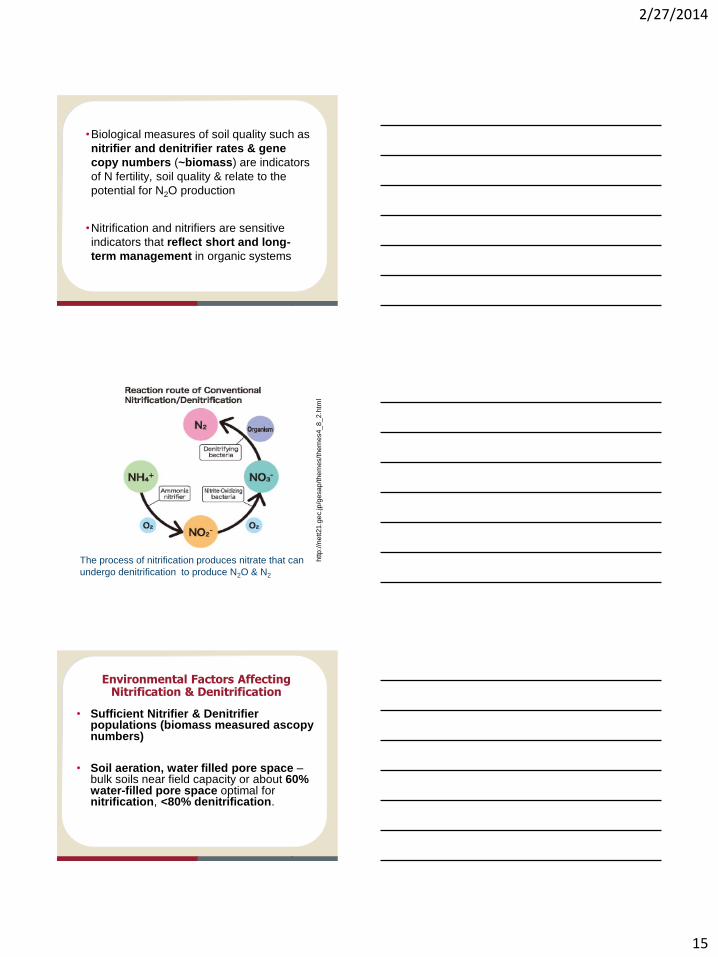
http
://n
ett21.g
ec.jp
/gesap
/them
es/them
es4_8_
2.h
tml
The process of nitrification produces nitrate that can
undergo denitrification to produce N2O & N2
Environmental Factors Affecting Nitrification & Denitrification
• Sufficient Nitrifier & Denitrifierpopulations (biomass measured ascopynumbers)
• Soil aeration, water filled pore space –bulk soils near field capacity or about 60% water-filled pore space optimal for nitrification, <80% denitrification.
2/27/2014
16
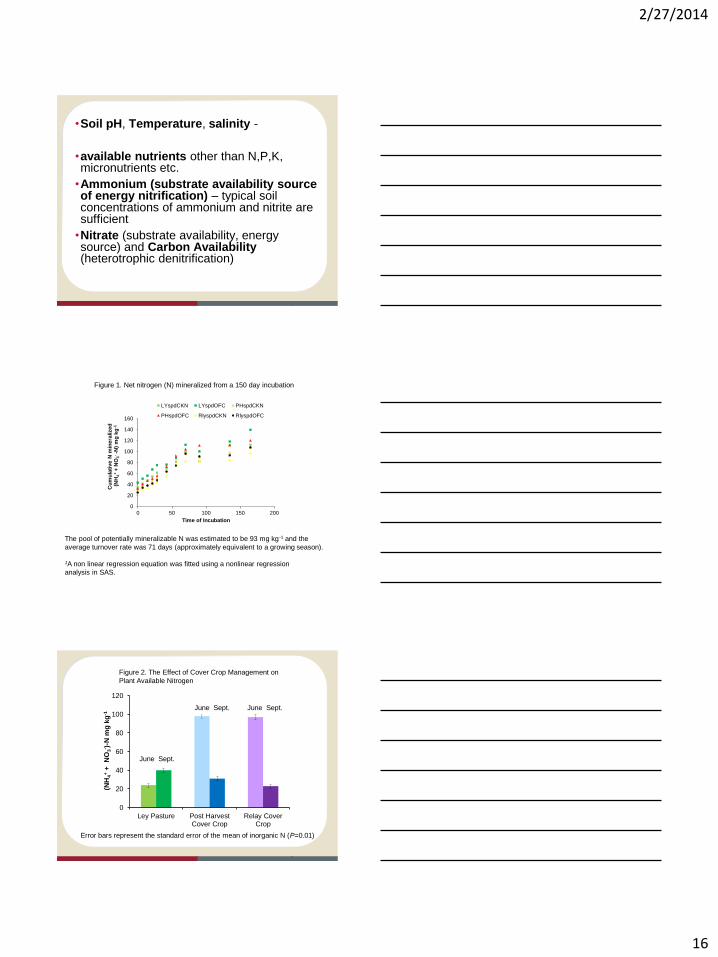
•Soil pH, Temperature, salinity -
•available nutrients other than N,P,K, micronutrients etc.
•Ammonium (substrate availability source of energy nitrification) – typical soil concentrations of ammonium and nitrite are sufficient
•Nitrate (substrate availability, energy source) and Carbon Availability (heterotrophic denitrification)
0
20
40
60
80
100
120
140
160
0 50 100 150 200
Cu
mu
lati
ve
N m
ine
ralize
d(N
H4
++
NO
3--N
) m
g k
g-1
Time of Incubation
LYspdCKN LYspdOFC PHspdCKN
PHspdOFC RlyspdCKN RlyspdOFC
Figure 1. Net nitrogen (N) mineralized from a 150 day incubation
The pool of potentially mineralizable N was estimated to be 93 mg kg-1 and the
average turnover rate was 71 days (approximately equivalent to a growing season).
1A non linear regression equation was fitted using a nonlinear regression
analysis in SAS.
0
20
40
60
80
100
120
Ley Pasture Post HarvestCover Crop
Relay CoverCrop
(NH
4+
+ N
O3- )
-N m
g k
g-1
June Sept.
June Sept. June Sept.
Figure 2. The Effect of Cover Crop Management on
Plant Available Nitrogen
Error bars represent the standard error of the mean of inorganic N (P=0.01)
2/27/2014
17
June Sept.
June Sept. June Sept.
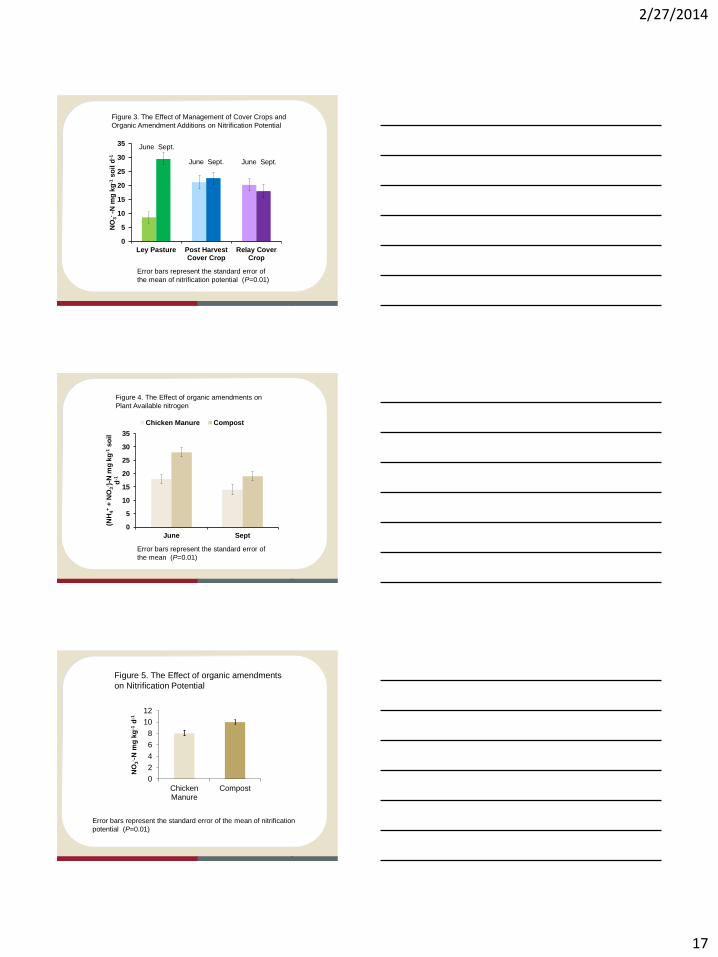
Figure 3. The Effect of Management of Cover Crops and
Organic Amendment Additions on Nitrification Potential
Error bars represent the standard error of
the mean of nitrification potential (P=0.01)
0
5
10
15
20
25
30
35
Ley Pasture Post HarvestCover Crop
Relay CoverCrop
NO
3--N
mg
kg
-1so
il d
-1
Figure 4. The Effect of organic amendments on
Plant Available nitrogen
0
5
10
15
20
25
30
35
June Sept
(NH
4+
+ N
O3- )
-N m
g k
g-1
so
il
d-1
Chicken Manure Compost
Error bars represent the standard error of
the mean (P=0.01)
Figure 5. The Effect of organic amendments
on Nitrification Potential
0
2
4
6
8
10
12
ChickenManure
Compost
NO
3- -
N m
g k
g-1
d-1
Error bars represent the standard error of the mean of nitrification
potential (P=0.01)

2/27/2014
18
Ammonia oxidizing bacteria gene copies per ng of DNA per g-1 dry soil
Treatment June Sept.
Chicken Manure 1.6 x 10⁵ a 1.7 x 10⁵ a
Compost 7.0 x 10⁴ b 7.7 x 10⁴ b
Ammonia oxidizing archaea gene copies per ng of DNA per g-1 dry soil
Treatment June Sept.
Chicken Manure 2.2 x 10⁵ a 2.4 x 10⁵ a
Compost 1.6 x 10⁵ a 1.7 x 10⁵ a
Values in the row labeled June followed by different letters
are significantly different (P=0.02).
Values in the row labeled June followed by different letters
are significantly different (P=0.01).
Values in a row representing sample dates were not followed
by a different letter and not are significantly different.
• Nitrification potential in organic systems
test of N fertility, biological soil quality
and potentially related to losses of
reactive N
• Basic research may lead to improved
Nitrogen Use Efficiency and improve our
understanding of reactive N losses in
organic systems
• Find all upcoming and archived webinars at http://www.extension.org/pages/25242.
• Find the recording and pdf handout for this webinar at http://www.extension.org/pages/70280
• Have an organic farming question? Use the eXtension Ask an Expert service at https://ask.extension.org/groups/1668/ask
• We need your feedback! Please respond to an email survey about this webinar which you’ll receive later.
• Thank you for coming!