PowerPoint Presentations1.q4cdn.com/448338635/files/doc_financials/earnings/... · ·...
38
CNO Financial Group | 2017 Investor Day | June 5, 2017 1 4Q17 Financial and operating results for the period ended December 31, 2017 February 14, 2018 Unless otherwise specified, comparisons in this presentation are between 4Q16 and 4Q17.
Transcript of PowerPoint Presentations1.q4cdn.com/448338635/files/doc_financials/earnings/... · ·...

CNO Financial Group | 2017 Investor Day | June 5, 2017 1
4Q17Financial and operating results for the period ended December 31, 2017February 14, 2018
Unless otherwise specified, comparisons in this presentation are between 4Q16 and 4Q17.

CNO Financial Group | Fourth Quarter 2017 Earnings | February 14, 2018 2
Forward-Looking Statements
Certain statements made in this presentation should be considered
forward-looking statements as defined in the Private Securities Litigation
Reform Act of 1995. These include statements about future results of
operations and capital plans. We caution investors that these forward-
looking statements are not guarantees of future performance, and actual
results may differ materially. Investors should consider the important
risks and uncertainties that may cause actual results to differ, including
those included in our press release issued on February 13, 2018, our
Quarterly Reports on Form 10-Q, our Annual Report on Form 10-K and
other filings we make with the Securities and Exchange Commission. We
assume no obligation to update this presentation, which speaks as of
today’s date.

CNO Financial Group | Fourth Quarter 2017 Earnings | February 14, 2018 3
Non-GAAP Measures
This presentation contains the following financial measures that differ from the
comparable measures under Generally Accepted Accounting Principles (GAAP):
operating earnings measures; book value, excluding accumulated other comprehensive
income (loss) per share; operating return measures; earnings before net realized
investment gains (losses), fair value changes in embedded derivative liabilities, fair value
changes and amendment related to the agent deferred compensation plan, other non-
operating items, corporate interest expense and taxes; and debt to capital ratios,
excluding accumulated other comprehensive income (loss). Reconciliations between
those non-GAAP measures and the comparable GAAP measures are included in the
Appendix, or on the page such measure is presented.
While management believes these measures are useful to enhance understanding and
comparability of our financial results, these non-GAAP measures should not be
considered substitutes for the most directly comparable GAAP measures.
Additional information concerning non-GAAP measures is included in our periodic filings
with the Securities and Exchange Commission that are available in the “Investors – SEC
Filings” section of CNO’s website, www.CNOinc.com.

CNO Financial Group | Fourth Quarter 2017 Earnings | February 14, 2018 4

CNO Financial Group | Fourth Quarter 2017 Earnings | February 14, 2018 5
2017 Year in Review
▪ Solid earnings results and continued financial strength
– Operating EPS up 19% for the full year
– Capital metrics remained strong throughout the year
– Strong cash flow generation, returned $227 million to shareholders
– Book value per diluted share of $21.431, including impacts from tax reform
▪ Continued to grow and diversify the franchise
– Majority of Growth Scorecard measures up year-over-year
– Strategic growth initiatives advancing
▪ Completed year-end actuarial assumption review
– Aggregate margins remain strong
1 A non-GAAP measure. See the Appendix for a reconciliation to the
corresponding GAAP measure.
CNO Financial Group | Fourth Quarter 2017 Earnings | February 14, 2018 6
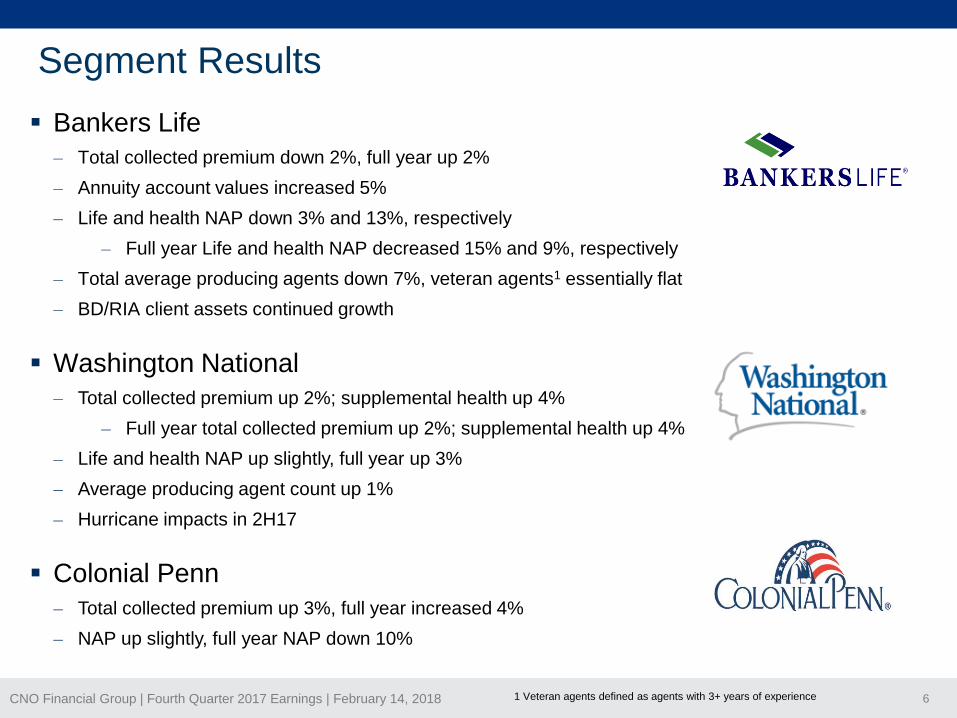
Segment Results
▪ Bankers Life
– Total collected premium down 2%, full year up 2%
– Annuity account values increased 5%
– Life and health NAP down 3% and 13%, respectively
– Full year Life and health NAP decreased 15% and 9%, respectively
– Total average producing agents down 7%, veteran agents1 essentially flat
– BD/RIA client assets continued growth
▪ Washington National
– Total collected premium up 2%; supplemental health up 4%
– Full year total collected premium up 2%; supplemental health up 4%
– Life and health NAP up slightly, full year up 3%
– Average producing agent count up 1%
– Hurricane impacts in 2H17
▪ Colonial Penn
– Total collected premium up 3%, full year increased 4%
– NAP up slightly, full year NAP down 10%
1 Veteran agents defined as agents with 3+ years of experience

CNO Financial Group | Fourth Quarter 2017 Earnings | February 14, 2018 7
$0.49 $0.51
$0.35
$0.47
Net Operating IncomePer Share¹
Net Operating IncomePer Share ExcludingSignificant Items¹
1 A non-GAAP measure. See the Appendix for a reconciliation to the corresponding GAAP measure.
4Q16 4Q17
4Q17 Financial ResultsFinancial Highlights
4Q17 Earnings Highlights ($ millions, except per share data)
Net Operating Income1 $84.9 $85.8
Net Operating Income
Excl. Significant Items1 $60.8 $79.4
Weighted Average
Shares Outstanding
(in millions)
175.2 167.4 2
▪ Net loss per diluted share of $0.42
- Net income per diluted share of $0.61,
excluding impacts of tax reform
▪ Net operating income per diluted share1 of $0.51
- Excluding significant items, net operating
EPS1 of $0.47, up 34%
▪ Operating ROE1 of 9.2%
▪ Holding company cash and investments of $397
million
▪ Estimated consolidated risk-based capital of 446%
▪ Repurchased $27 million of common stock in the
quarter and $167 million for the full year
▪ Committed to deploying 100% of free cash flow
2 Equivalent common shares of 2.8 million were not included in the diluted weighted average shares outstanding due to the
net loss recognized in 4Q17.

CNO Financial Group | Fourth Quarter 2017 Earnings | February 14, 2018 8
Segment Results ($ millions)
1 A non-GAAP measure. See the Appendix for a reconciliation to the corresponding GAAP measure.
Segment Adjusted EBIT Excluding Significant Items1
Segment Highlights4Q16 1Q17 2Q17 3Q17 4Q17
$90.7 $91.4 $103.2 $106.9 $98.9
$29.9$24.8 $23.6
$27.5 $24.7
$7.1
($0.3)
$8.0 $6.0 $5.9
Bankers Life
Washington
National
Colonial
Penn
($1.3)
$0.4 $1.7
($1.0)
$0.6
($17.5)($8.9) ($13.2) ($14.9) ($3.3)
LTC in
run-off
Corporate
Total CNO $108.9 $107.4 $123.3 $124.5 $126.8
▪ Bankers Life results reflect higher
call/prepayment income and favorable LTC
margins
▪ Washington National results reflect lower
investment income and higher expenses
partially offset by stronger supplemental
health margins
▪ Colonial Penn results in-line with
expectations. Expect 2018 Adjusted EBIT
of $10-20 million
▪ LTC in run-off in-line with expectations
▪ Corporate results reflect higher investment
income and lower expenses
CNO Financial Group | Fourth Quarter 2017 Earnings | February 14, 2018 9
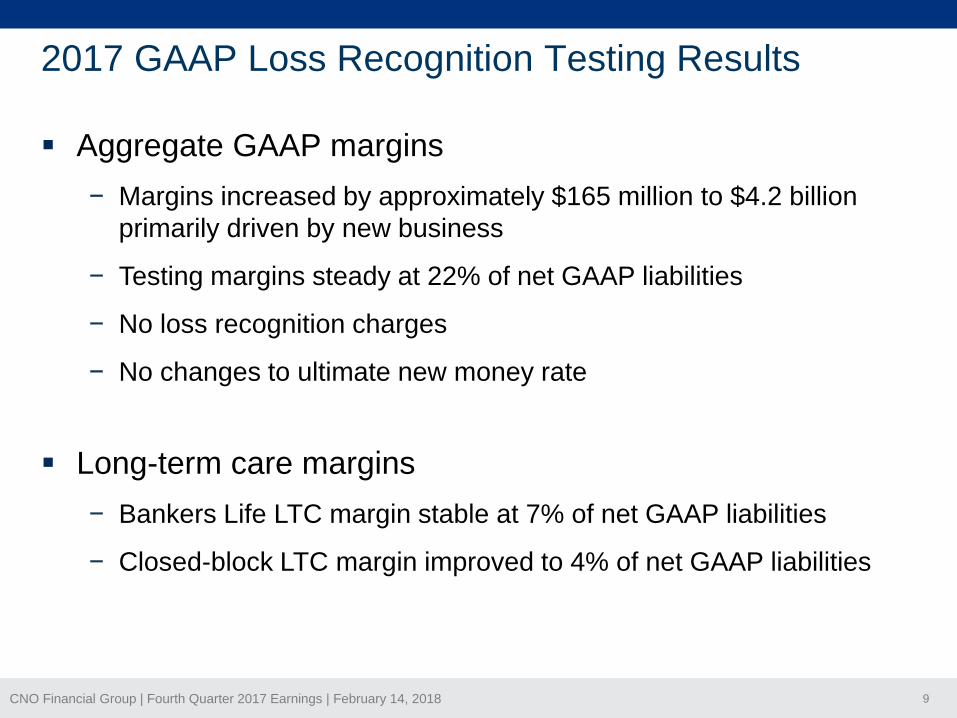
2017 GAAP Loss Recognition Testing Results
▪ Aggregate GAAP margins
− Margins increased by approximately $165 million to $4.2 billion
primarily driven by new business
− Testing margins steady at 22% of net GAAP liabilities
− No loss recognition charges
− No changes to ultimate new money rate
▪ Long-term care margins
− Bankers Life LTC margin stable at 7% of net GAAP liabilities
− Closed-block LTC margin improved to 4% of net GAAP liabilities

CNO Financial Group | Fourth Quarter 2017 Earnings | February 14, 2018 10
Impact of Tax Reform
4Q17 Impacts
▪ GAAP charge of $172 million, components include
– $224 million due to write-down of deferred tax
assets
– ($52) million valuation allowance release
▪ $2.23 decrease to book value per diluted share
(excluding AOCI)
▪ Statutory capital decreased by $46 million, or 9
RBC percentage points, due to a reduction in
admissible deferred taxes
Estimated Future Impacts
▪ GAAP effective tax rate in the 21-23% range
▪ Cash tax rate of ~13%
▪ Modest increase to cash flows of ~$10 million
annually
▪ Increase to operating EPS of 22%
▪ ROE increase of ~225bps
▪ Future updates to RBC formula would result in
an estimated required capital increase of ~$80
million (~65 percentage point decrease to
consolidated RBC ratio)

CNO Financial Group | Fourth Quarter 2017 Earnings | February 14, 2018 11
Priorities & Opportunities
▪ Continue franchise growth and diversification through
− Launching new products and services
− Expanding to the ‘right’
− Enhancing customer experience
▪ Reducing long-term care exposure
▪ Committed to effective capital deployment

CNO Financial Group | Fourth Quarter 2017 Earnings | February 14, 2018 12
Questions and Answers

CNO Financial Group | Fourth Quarter 2017 Earnings | February 14, 2018 13
Appendix

CNO Financial Group | Fourth Quarter 2017 Earnings | February 14, 2018 14
Growth Scorecard ($ millions)
1 Includes third party products sold. See page 20 for a reconciliation to total policies inforce.
2 Measured as 100% of new term life and health annualized premiums and 10% of single premium whole life deposits.
4Q TY 1Q 2Q 3Q 4Q TY Q/Q Y/Y
First Year Collected Premiums Bankers Life $342.1 $1,211.9 $311.1 $319.9 $288.2 $326.4 $1,245.6 -4.6% 2.8%
Washington National 19.3 78.2 20.5 19.7 18.9 19.3 78.4 0.0% 0.3%
Colonial Penn 13.2 54.8 13.7 12.7 12.1 11.6 50.1 -12.1% -8.6%
Total CNO $374.6 $1,344.9 $345.3 $352.3 $319.2 $357.3 $1,374.1 -4.6% 2.2%
Collected Premiums Bankers Life $711.6 $2,666.4 $687.8 $680.6 $641.7 $696.3 $2,706.4 -2.2% 1.5%
Washington National 165.2 659.3 173.1 167.5 164.2 168.6 673.4 2.1% 2.1%
Colonial Penn 69.8 280.3 74.5 72.5 72.6 72.0 291.6 3.2% 4.0%
LTC in run-off 4.7 4.7 4.6 4.4 3.9 4.0 16.9 -14.9% N/A
Total CNO $951.3 $3,610.7 $940.0 $925.0 $882.4 $940.9 $3,688.3 -1.1% 2.1%
Policies Inforce 1 (thousands) Bankers Life 1,686.9 1,686.9 1,673.5 1,671.7 1,665.6 1,672.0 1,672.0 -0.9% -0.9%
Washington National 961.7 961.7 964.6 964.5 963.1 964.1 964.1 0.2% 0.2%
Colonial Penn 846.4 846.4 853.3 849.4 845.1 841.0 841.0 -0.6% -0.6%
LTC in run-off 10.2 10.2 10.1 9.8 9.5 9.3 9.3 -8.8% -8.8%
Total CNO 3,505.2 3,505.2 3,501.5 3495.4 3,483.3 3,486.4 3,486.4 -0.5% -0.5%
New Annualized Premium 2Life Insurance $33.5 $164.1 $41.5 $36.0 $34.3 $33.6 $145.4 0.3% -11.4%
Health Insurance 56.2 194.7 46.4 45.9 43.1 51.8 187.2 -7.8% -3.9%
Total Life & Health Insurance $89.7 $358.7 $87.9 $81.9 $77.4 $85.4 $332.6 -4.8% -7.3%
Annuity Account Values Bankers Life $7,788.5 $7,788.5 $7,869.7 $7,954.7 $8,047.2 $8,163.3 $8,163.3 4.8% 4.8%
Washington National 413.7 413.7 404.5 393.4 385.7 378.2 378.2 -8.6% -8.6%
Total $8,202.2 $8,202.2 $8,274.2 $8,348.1 $8,432.9 $8,541.5 $8,541.5 4.1% 4.1%
Annuity Collected Premiums Bankers Life $284.9 $970.0 $257.5 $264.3 $236.5 $272.3 $1,030.6 -4.4% 6.2%
Fee Revenue Bankers Life $10.7 $33.9 $10.1 $10.1 $10.8 $11.2 $42.2 4.7% 24.5%
% Change2016 2017

CNO Financial Group | Fourth Quarter 2017 Earnings | February 14, 2018 15
$144 $146 $146 $147 $149
57.0%
60.6% 60.4%59.0%
56.6%
4Q16 1Q17 2Q17 3Q17 4Q17
Earned PremiumReported Benefit Ratio
($ millions)
1 Interest-adjusted benefit ratio (IABR); a non-GAAP measure. Refer to the Appendix for the corresponding GAAP measure.
2 Adjusted benefit ratio; long-term care IABR1 excluding impact of policyholder actions following rate increases and other one-time impacts
Health Margins
Washington National
Supplemental Health IABR1
Bankers Life Long-term Care
IABR1
Bankers Life Medicare
Supplement Benefit Ratio
$193 $196 $194 $195 $193
71.2% 70.0% 70.4%72.0% 70.7%
4Q16 1Q17 2Q17 3Q17 4Q17
Earned PremiumReported Benefit Ratio
$118 $116 $114 $113 $111
76.0%72.5%
66.2%
72.9% 73.1%
78.4%
74.2% 74.4% 72.9%73.1%
4Q16 1Q17 2Q17 3Q17 4Q17
Earned Premium
Reported IABR
Adjusted Benefit Ratio²
▪ Benefit ratio of 70.7% in-line with
expectations
▪ Benefit ratio guidance of 71-74%
for 2018
▪ IABR1 of 56.6% reflects favorable
incurred claims
▪ IABR1 guidance of 58-61% for
2018
▪ Adjusted IABR2 of 73.1%, reflects
favorable incurred claims
▪ IABR1 guidance of 75-80% for 2018

CNO Financial Group | Fourth Quarter 2017 Earnings | February 14, 2018 16
Investment Results ($ millions)
Average Invested Assets and Cash
$23,736 $23,864 $23,982 $24,286 $24,580
$315.6 $312.0 $322.4 $325.9 $325.1
4Q16 1Q17 2Q17 3Q17 4Q17
NetInvestmentIncome
1 Earned Yield excludes assets held in our FHLB matchbook program.
▪ Results benefited from high prepayment/call
income and strong private credit performance
▪ New money rate attributable to investments in
real asset alternatives, long dated IG
corporates, and selected esoteric ABS
▪ Low impairment trend continues
▪ Continue to liquidate recaptured assets;
remaining balance of $20.1 million as of
12/31/17, down from $33.4 million as of
9/30/17
New Money Rate 5.02% 5.23% 4.64% 5.38% 5.16%
Earned Yield1: 5.58% 5.42% 5.54% 5.51% 5.43%
Pre-
Pay/Call/Make-
whole Income
$5.3 $0.6 $9.8 $16.9 $11.7
Alternative
Investment
Income
$6.7 $8.5 $6.1 $8.9 $10.2
Impairments $7.5 $8.4 $5.1 $4.7 $4.6
Quarter Highlights

CNO Financial Group | Fourth Quarter 2017 Earnings | February 14, 2018 17
Average Producing Agents1
1st Yr 2nd Yr 3rd Yr + Total 1st Yr 2nd Yr 3rd Yr + Total
12/31/2017 1,845 463 1,863 4,171 288 85 314 687
9/30/2017 1,887 483 1,873 4,243 287 89 310 686
6/30/2017 1,941 503 1,880 4,324 285 91 308 684
3/31/2017 1,994 533 1,877 4,404 280 92 308 680
12/31/2016 2,037 567 1,875 4,479 279 90 308 677
9/30/2016 2,081 584 1,875 4,540 283 89 309 681
6/30/2016 2,123 598 1,882 4,603 284 88 307 679
3/31/2016 2,194 604 1,888 4,686 287 90 300 677
12/31/2015 2,266 613 1,883 4,761 282 92 292 666
1 Producing agent counts are determined at the end of each month and only include agents who submitted at least one policy in the month. The average producing
agent counts represent the average of the last 12 months producing agent counts.
Washington NationalBankers Life

CNO Financial Group | Fourth Quarter 2017 Earnings | February 14, 2018 18
4Q17 Holding Company Liquidity ($ millions)
4Q17 2017
Cash and Investments Balance - Beginning $379.8 $263.6
Sources
Dividends from Insurance Subsidiaries 70.9 357.7
Dividends from Non-insurance Subsidiaries - 5.8
Service and Investment Fees, Net 17.0 108.1
Surplus Debenture Interest 12.3 56.8
Interest/Earnings on Corporate Investments 3.9 16.6
Other 7.6 15.7
Total Sources 111.7 560.7
Uses
Share Repurchases1
26.0 166.1
Interest 21.2 43.9
Common Stock Dividends 15.1 59.6
Intercompany Payments2 - 41.4
Tax Payments 18.5 71.3
General Expenses & Other 20.8 62.4
Total Uses 101.6 444.7
Non-Cash Changes in Investment Balances 6.7 17.0
Cash and Investments Balance - December 31, 2017 $396.6 $396.6
1 Excludes $1.0 million of 4Q17 reported repurchases settled in 1Q18.
2 Settlement of intercompany balances related to previously disclosed 4Q16 IRS tax settlement.

CNO Financial Group | Fourth Quarter 2017 Earnings | February 14, 2018 19
Loss Carryforwards Valuation Allowance
Non-Life(1) $490
Tax Asset Summary ($ millions)
Loss Carryforwards Details
▪ Total estimated economic value
of NOLs of $265 million @ 10%
discount rate (~$1.56 on per
share basis)
▪ NOLs are expected to offset
100% of the taxable income of
our non-life companies and
35% of the taxable income of
our life insurance companies
through 2023
1 Excludes $9 million related to state operating loss carryforwards.
2 Excludes $7 million related to state operating loss carryforwards.
Non-Life(2)
$77

CNO Financial Group | Fourth Quarter 2017 Earnings | February 14, 2018 20
Policies Inforce
4Q16 1Q17 2Q17 3Q17 4Q17
Policies inforce:
Bankers Life 1,526,344 1,519,474 1,515,445 1,510,160 1,500,573
Washington National 961,689 964,642 964,519 963,141 964,138
Colonial Penn 846,372 853,307 849,353 845,135 840,979
Long-term care in run-off 10,260 10,068 9,769 9,473 9,265
Total policies inforce 3,344,665 3,347,491 3,339,086 3,327,909 3,314,955
Third party policies inforce sold by
Bankers Life agents 160,548 154,005 156,308 155,430 171,421
Total policies inforce and third party policies
inforce sold by Bankers Life agents 3,505,213 3,501,496 3,495,394 3,483,339 3,486,376
The following summarizes total policies inforce as of the end of the period indicated.

CNO Financial Group | Fourth Quarter 2017 Earnings | February 14, 2018 21
The table below summarizes the financial impact of significant items on our 4Q16 net operating income. Management believes that
identifying the impact of these items enhances the understanding of our operating results (dollars in millions).
4Q16 Significant Items
* A non-GAAP measure. See pages 26 and 28 for a reconciliation to the corresponding GAAP measure.
Net Operating Income:
Bankers Life $ 138.9 $ (48.2) (1) $ 90.7
Washington National
Colonial Penn (2)
Long-term care in run-off (3.9) 2.6 (3)
Adjusted EBIT from business segments
Corporate Operations, excluding corporate interest expense (4)
Adjusted EBIT
Corporate interest expense
Operating earnings before tax
Tax expense on operating income
Net operating income * $ 84.9 $ (24.1) $ 60.8
Net operating income per diluted share* $ 0.49 $ (0.14) $ 0.35
(1) Pre-tax earnings in the Bankers Life segment included: (i) $45.8 million of favorable impacts for adjustments arising from our comprehensive annual actuarial review of
assumptions, and (ii) the $2.4 million release of long-term care reserves (net of the reduction in insurance intangibles) due to the impact of policyholder actions following rate
increases.
(2) Pre-tax earnings in the Colonial Penn segment were reduced $2.5 million related to the impact of loss recognition on a closed block of payout annuities.
(3) Pre-tax earnings in Long-term care in run-off segment were reduced by $2.6 million related to the impact of loss recognition on this closed block of long-term care business.
135.0 (37.6) 97.4
50.1 (13.5)
(23.0) 5.5 (17.5)
36.6
146.5
(11.5) - (11.5)
108.9
4.6 2.5 7.1
169.5 (43.1)
29.9 - 29.9
(1.3)
(4) Pre-tax earnings in the Corporate segment included a $5.5 million increase to legal reserves related to legacy business of our predecessor.
126.4
(37.6)
Three months ended
December 31, 2016
Actual results Significant items
Excluding
significant
items

CNO Financial Group | Fourth Quarter 2017 Earnings | February 14, 2018 22
Net Operating Income:
Bankers Life $ 89.7 $ 1.7 (1) $ 91.4
Washington National (2)
Colonial Penn
Long-term care in run-off 0.4 -
Adjusted EBIT from business segments
Corporate Operations, excluding corporate interest expense
Adjusted EBIT
Corporate interest expense
Operating earnings before tax
Tax expense on operating income
Net operating income * $ 59.8 $ 1.9 $ 61.7
Net operating income per diluted share* $ 0.34 $ 0.01 $ 0.35
Three months ended
March 31, 2017
Actual results Significant items
Excluding
significant
items
23.5 1.3 24.8
0.4
116.3
3.0 107.4
(0.3) - (0.3)
113.3 3.0
(8.9) - (8.9)
34.2
104.4
(11.5) - (11.5)
(1) Pre-tax earnings in the Bankers Life segment included: (i) a $3.5 million expense increase for estimated future state guaranty association assessments, net of
premium tax offsets, related to the liquidation of Penn Treaty Network America Insurance Company ("Penn Treaty"); partially offset by (ii) the $1.8 million release of
long-term care reserves (net of the reduction in insurance intangibles) due to the impact of policy holder actions following rate increases.
(2) Pre-tax earnings in the Washington National segment included a $1.3 million expense increase related to the aforementioned estimated future state guaranty
association assessments, net of premium tax offsets, related to Penn Treaty.
92.9 3.0 95.9
33.1 1.1
The table below summarizes the financial impact of significant items on our 1Q17 net operating income. Management believes that
identifying the impact of these items enhances the understanding of our operating results (dollars in millions).
1Q17 Significant Items
* A non-GAAP measure. See pages 26 and 28 for a reconciliation to the corresponding GAAP measure.

CNO Financial Group | Fourth Quarter 2017 Earnings | February 14, 2018 23
Net Operating Income:
Bankers Life $ 112.6 $ (9.4) (1) $ 103.2
Washington National
Colonial Penn
Long-term care in run-off 1.7 -
Adjusted EBIT from business segments
Corporate Operations, excluding corporate interest expense
Adjusted EBIT
Corporate interest expense
Operating earnings before tax
Tax expense on operating income
Net operating income * $ 78.6 $ (6.1) $ 72.5
Net operating income per diluted share* $ 0.45 $ 0.03 $ 0.42
(1) Pre-tax earnings in the Bankers Life segment included: (i) favorable persistency (including the results of extensive procedures performed to identify policies that
had terminated prior to June 30, 2017 due to death); and (ii) policy holder actions following long-term care rate increases. These items resulted in a release of
reserves, primarily related to the long-term care business in the Bankers Life segment, which totaled $9.4 million.
121.1 (9.4) 111.7
42.5 (3.3)
(13.2) - (13.2)
39.2
132.7
(11.6) - (11.6)
123.3
8.0 - 8.0
145.9 (9.4)
23.6 - 23.6
1.7
136.5
(9.4)
Three months ended
June 30, 2017
Actual results Significant items
Excluding
significant
items
The table below summarizes the financial impact of significant items on our 2Q17 net operating income. Management believes that
identifying the impact of these items enhances the understanding of our operating results (dollars in millions).
2Q17 Significant Items
* A non-GAAP measure. See pages 26 and 28 for a reconciliation to the corresponding GAAP measure.

CNO Financial Group | Fourth Quarter 2017 Earnings | February 14, 2018 24
Net Operating Income:
Bankers Life $ 106.9 $ - $ 106.9
Washington National
Colonial Penn (1)
Long-term care in run-off (1.0) -
Adjusted EBIT from business segments
Corporate Operations, excluding corporate interest expense
Adjusted EBIT
Corporate interest expense
Operating earnings before tax
Tax expense on operating income
Net operating income * $ 76.7 $ (2.0) $ 74.7
Net operating income per diluted share* $ 0.45 $ (0.01) $ 0.44
Three months ended
September 30, 2017
Actual results Significant items
Excluding
significant
items
27.5 - 27.5
(1.0)
139.4
(3.0) 124.5
9.0 (3.0) 6.0
142.4 (3.0)
(14.9) - (14.9)
38.1
127.5
(11.7) - (11.7)
(1) Pre-tax earnings in the Colonial Penn segment reflects a $3.0 million out-of-period adjustment and refinement to liabilities for insurance products identified in
conjunction with periodic updating of assumptions.
115.8 (3.0) 112.8
39.1 (1.0)
The table below summarizes the financial impact of significant items on our 3Q17 net operating income. Management believes that
identifying the impact of these items enhances the understanding of our operating results (dollars in millions).
3Q17 Significant Items
* A non-GAAP measure. See pages 26 and 28 for a reconciliation to the corresponding GAAP measure.

CNO Financial Group | Fourth Quarter 2017 Earnings | February 14, 2018 25
Net Operating Income:
Bankers Life $ 109.7 $ (10.8) (1) $ 98.9
Washington National (1)
Colonial Penn
Long-term care in run-off 0.6 -
Adjusted EBIT from business segments
Corporate Operations, excluding corporate interest expense
Adjusted EBIT
Corporate interest expense
Operating earnings before tax
Tax expense on operating income
Net operating income * $ 85.8 $ (6.4) $ 79.4
Net operating income per diluted share* $ 0.51 $ (0.04) $ 0.47
Three months ended
December 31, 2017
Actual results Significant items
Excluding
significant
items
23.7 1.0 24.7
0.6
130.1
(9.8) 126.8
5.9 - 5.9
139.9 (9.8)
(3.3) - (3.3)
35.7
136.6
(11.7) - (11.7)
(1) Pre-tax earnings in the Bankers Life and Washington National segments reflect $10.8 million of favorable impacts and $1.0 million of unfavorable impacts,
respectively, from our comprehensive annual actuarial review of assumptions.
124.9 (9.8) 115.1
39.1 (3.4)
The table below summarizes the financial impact of significant items on our 4Q17 net operating income. Management believes that
identifying the impact of these items enhances the understanding of our operating results (dollars in millions).
4Q17 Significant Items
* A non-GAAP measure. See pages 26 and 28 for a reconciliation to the corresponding GAAP measure.

CNO Financial Group | Fourth Quarter 2017 Earnings | February 14, 2018 26
Quarterly Earnings
*Management believes that an analysis of earnings before net realized investment gains (losses), fair value changes in embedded derivative liabilities, fair value changes and amendment
related to the agent deferred compensation plan, other non-operating items, corporate interest expense and taxes (“Adjusted EBIT,” a non-GAAP financial measure) provides a clearer
comparison of the operating results of the company quarter-over-quarter because it excludes: (1) net realized investment gains (losses); (2) fair value changes due to fluctuations in the
interest rates used to discount embedded derivative liabilities related to our fixed index annuities that are unrelated to the company’s underlying fundamentals; (3) fair value changes and
amendment related to the agent deferred compensation plan; (4) charges in the valuation allowance for deferred tax assets and other tax items; and (5) other non-operating items
consisting primarily of earnings attributable to variable interest entities. The table above provides a reconciliation of Adjusted EBIT to net income.
4Q16 1Q17 2Q17 3Q17 4Q17
Bankers Life 138.9$ 89.7$ 112.6$ 106.9$ 109.7$
Washington National 29.9 23.5 23.6 27.5 23.7
Colonial Penn 4.6 (0.3) 8.0 9.0 5.9
Long-term care in run-off (3.9) 0.4 1.7 (1.0) 0.6
Adjusted EBIT from business segments 169.5 113.3 145.9 142.4 139.9
Corporate operations, excluding interest expense (23.0) (8.9) (13.2) (14.9) (3.3)
Adjusted EBIT* 146.5 104.4 132.7 127.5 136.6
Corporate interest expense (11.5) (11.5) (11.6) (11.7) (11.7)
Operating earnings before taxes 135.0 92.9 121.1 115.8 124.9
Tax expense on period income 50.1 33.1 42.5 39.1 39.1
Net operating income 84.9 59.8 78.6 76.7 85.8
Net realized investment gains (losses), net of related amortization (14.8) 7.9 14.9 28.5 (2.0)
Fair value changes in embedded derivative liabilities, net of related amortization 46.2 (4.4) (5.9) 2.3 5.5
Fair value changes and amendment related to the agent deferred compensation plan 15.1 - - (13.4) 1.2
Other (0.8) 0.3 (1.6) (3.3) (4.2)
Non-operating income before taxes 45.7 3.8 7.4 14.1 0.5
Income tax expense (benefit):
On non-operating income (loss) 16.0 1.3 2.6 5.0 0.1
Valuation allowance for deferred tax assets and other tax items (119.6) - - (15.0) 157.1
Net non-operating income (loss) 149.3 2.5 4.8 24.1 (156.7)
Net income (loss) 234.2$ 62.3$ 83.4$ 100.8$ (70.9)$
($ millions)

CNO Financial Group | Fourth Quarter 2017 Earnings | February 14, 2018 27
The following provides additional information regarding certain non-GAAP measures used in this presentation. A non-GAAP measure is a numerical measure of a company’s performance, financial position, or cash flows that excludes or includes amounts that are normally excluded or included in the most directly comparable measure calculated and presented in accordance with GAAP. While management believes these measures are useful to enhance understanding and comparability of our financial results, these non-GAAP measures should not be considered as substitutes for the most directly comparable GAAP measures. Additional information concerning non-GAAP measures is included in our periodic filings with the Securities and Exchange Commission that are available in the “Investors – SEC Filings” section of CNO’s website, www.CNOinc.com.
Operating earnings measuresManagement believes that an analysis of net income applicable to common stock before net realized investment gains or losses, fair value changes due to fluctuations in the interest rates used to discount embedded derivative liabilities related to our fixed index annuities, fair value changes and amendment related to the agent deferred compensation plan, changes in the valuation allowance for deferred tax assets and other tax items and other non-operating items consisting primarily of earnings attributable to variable interest entities (“net operating income,” a non-GAAP financial measure) is important to evaluate the financial performance of the Company and is a key measure commonly used in the life insurance industry. Management uses this measure to evaluate performance because the items excluded from net operating income can be affected by events that are unrelated to the Company’s underlying fundamentals.
Information Related to Certain Non-GAAP Financial Measures
CNO Financial Group | Fourth Quarter 2017 Earnings | February 14, 2018 28
Information Related to Certain Non-GAAP Financial Measures
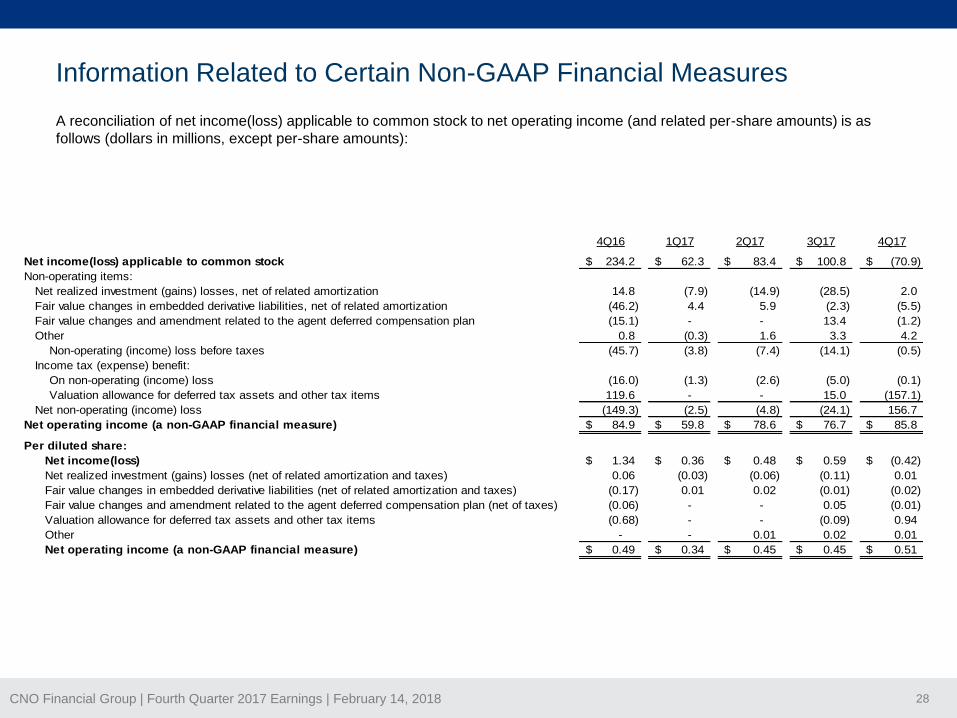
A reconciliation of net income(loss) applicable to common stock to net operating income (and related per-share amounts) is as
follows (dollars in millions, except per-share amounts):
4Q16 1Q17 2Q17 3Q17 4Q17
Net income(loss) applicable to common stock 234.2$ 62.3$ 83.4$ 100.8$ (70.9)$
Non-operating items:
Net realized investment (gains) losses, net of related amortization 14.8 (7.9) (14.9) (28.5) 2.0
Fair value changes in embedded derivative liabilities, net of related amortization (46.2) 4.4 5.9 (2.3) (5.5)
Fair value changes and amendment related to the agent deferred compensation plan (15.1) - - 13.4 (1.2)
Other 0.8 (0.3) 1.6 3.3 4.2
Non-operating (income) loss before taxes (45.7) (3.8) (7.4) (14.1) (0.5)
Income tax (expense) benefit:
On non-operating (income) loss (16.0) (1.3) (2.6) (5.0) (0.1)
Valuation allowance for deferred tax assets and other tax items 119.6 - - 15.0 (157.1)
Net non-operating (income) loss (149.3) (2.5) (4.8) (24.1) 156.7
Net operating income (a non-GAAP financial measure) 84.9$ 59.8$ 78.6$ 76.7$ 85.8$
Per diluted share:
Net income(loss) 1.34$ 0.36$ 0.48$ 0.59$ (0.42)$
Net realized investment (gains) losses (net of related amortization and taxes) 0.06 (0.03) (0.06) (0.11) 0.01
Fair value changes in embedded derivative liabilities (net of related amortization and taxes) (0.17) 0.01 0.02 (0.01) (0.02)
Fair value changes and amendment related to the agent deferred compensation plan (net of taxes) (0.06) - - 0.05 (0.01)
Valuation allowance for deferred tax assets and other tax items (0.68) - - (0.09) 0.94
Other - - 0.01 0.02 0.01
Net operating income (a non-GAAP financial measure) 0.49$ 0.34$ 0.45$ 0.45$ 0.51$

CNO Financial Group | Fourth Quarter 2017 Earnings | February 14, 2018 29
4Q16 1Q17 2Q17 3Q17 4Q17 (a)
Operating income 84.9$ 59.8$ 78.6$ 76.7$ 85.8$
Weighted average shares outstanding for basic earnings per share 173,634 173,431 170,556 168,684 167,428
Effect of dilutive securities on weighted average shares:
Stock options, restricted stock and performance units 1,539 1,634 1,796 2,298 -
Weighted average shares outstanding for diluted earnings per share 175,173 175,065 172,352 170,982 167,428
Net operating income per diluted share 0.49$ 0.34$ 0.45$ 0.45$ 0.51$
A reconciliation of operating income and shares used to calculate basic and diluted operating earnings per share is as
follows (dollars in millions, except per-share amounts, and shares in thousands):
Information Related to Certain Non-GAAP Financial Measures
(a) Equivalent common shares of 2,750 were not included in the diluted weighted average shares outstanding due to the net loss recognized in 4Q17.

CNO Financial Group | Fourth Quarter 2017 Earnings | February 14, 2018 30
Book value per diluted share
Book value per diluted share reflects the potential dilution that could occur if outstanding stock options were exercised, restricted stock and performance units
were vested and convertible securities were converted. The dilution from options, restricted shares and performance units is calculated using the treasury stock
method. Under this method, we assume the proceeds from the exercise of the options (or the unrecognized compensation expense with respect to restricted
stock and performance units) will be used to purchase shares of our common stock at the closing market price on the last day of the period. In addition, the
calculation of this non-GAAP measure differs from the corresponding GAAP measure because accumulated other comprehensive income (loss) has been
excluded from the value of capital used to determine this measure. Management believes this non-GAAP measure is useful because it removes the volatility
that arises from changes in the unrealized appreciation (depreciation) of our investments. In addition, the value of capital used to calculate this non-GAAP
measure at December 31, 2017 is reduced by the $205.4 million impact recorded in retained earnings in the fourth quarter of 2017 from the remeasurement of
deferred tax liabilities originally recorded in accumulated other comprehensive income. Management believes this adjustment to the December 31, 2017 non-
GAAP measure is useful because it removes the tax effects stranded in accumulated other comprehensive income as a result of accounting rules which require
the effects of the Tax Reform Act on deferred tax balances to be recorded in earnings, even if the balance was originally recorded in accumulated other
comprehensive income.
4Q16 1Q17 2Q17 3Q17 4Q17
Total shareholders' equity 4,486.9$ 4,606.8$ 4,779.3$ 4,881.7$ 4,847.5$
Shares outstanding for the period 173,753,614 172,103,802 169,018,890 167,762,323 166,857,931
Book value per share 25.82$ 26.77$ 28.28$ 29.10$ 29.05$
Total shareholders' equity 4,486.9$ 4,606.8$ 4,779.3$ 4,881.7$ 4,847.5$
Less accumulated other comprehensive income (622.4) (729.6) (894.5) (933.6) (1,212.1) (a)
Adjusted shareholders' equity excluding AOCI 3,864.5$ 3,877.2$ 3,884.8$ 3,948.1$ 3,635.4$
Shares outstanding for the period 173,753,614 172,103,802 169,018,890 167,762,323 166,857,931
Dilutive common stock equivalents related to:
Stock options, restricted stock and performance units 1,721,878 1,714,212 1,840,391 2,474,837 2,796,385
Diluted shares outstanding 175,475,492 173,818,014 170,859,281 170,237,160 169,654,316
Book value per diluted share (a non-GAAP financial measure) 22.02$ 22.31$ 22.74$ 23.19$ 21.43$
A reconciliation from book value per share to book value per diluted share, excluding accumulated other comprehensive income (loss) is as follows (dollars in
millions, except per share amounts):
Information Related to Certain Non-GAAP Financial Measures
(a) Accumulated other comprehensive income at December 31, 2017, is increased by $205.4
million to remove the stranded tax effects related to tax reform.

CNO Financial Group | Fourth Quarter 2017 Earnings | February 14, 2018 31
Information Related to Certain Non-GAAP Financial Measures
The interest-adjusted benefit ratio (a non-GAAP measure) is calculated by dividing the product's insurance policy benefits less
imputed interest income on the accumulated assets backing the insurance liabilities by insurance policy income. Interest income is
an important factor in measuring the performance of longer duration health products. The net cash flows generally cause an
accumulation of amounts in the early years of a policy (accounted for as reserve increases), which will be paid out as benefits in
later policy years (accounted for as reserve decreases). Accordingly, as the policies age, the benefit ratio will typically increase, but
the increase in the change in reserve will be partially offset by the imputed interest income earned on the accumulated assets. The
interest-adjusted benefit ratio reflects the effects of such interest income offset. Since interest income is an important factor in
measuring the performance of these products, management believes a benefit ratio, which includes the effect of interest income, is
useful in analyzing product performance. The interest-adjusted benefit ratio excluding the impact of rate increases and other one-
time impacts eliminates the release of reserves due to the impact of policyholder actions following rate increases and other one-time
impacts.
(Dollars in millions)4Q16 1Q17 2Q17 3Q17 4Q17
Bankers Life
Long-term care benefit ratios
Earned premium 117.8$ 115.6$ 113.7$ 112.7$ 111.1$
Benefit ratio before imputed interest income on reserves 134.7% 132.6% 126.9% 134.2% 135.3%
Interest-adjusted benefit ratio 76.0% 72.5% 66.2% 72.9% 73.1%
Interest-adjusted benefit ratio, excluding the impact of reserve releases due to rate increases and other one-time impacts 78.4% 74.2% 74.4% 72.9% 73.1%
Underwriting margin (earned premium plus imputed interest income on reserves less policy benefits) 28.3$ 31.8$ 38.4$ 30.5$ 29.9$
Adjusted underwriting margin (excluding the impact of reserve releases due to rate increases and other one-time impacts) 25.6 29.8 29.0 30.5 29.9
Washington National
Supplemental health benefit ratios
Earned premium 144.0$ 145.6$ 146.3$ 147.2$ 149.4$
Benefit ratio before imputed interest income on reserves 81.0% 84.6% 84.5% 83.2% 80.7%
Interest-adjusted benefit ratio 57.0% 60.6% 60.4% 59.0% 56.6%
Underwriting margin (earned premium plus imputed interest income on reserves less policy benefits) 62.0$ 57.3$ 57.9$ 60.4$ 64.8$
Interest-adjusted benefit ratios

CNO Financial Group | Fourth Quarter 2017 Earnings | February 14, 2018 32
Information Related to Certain Non-GAAP Financial Measures
Operating return measures
Management believes that an analysis of net income applicable to common stock before net realized investment gains or losses,
fair value changes due to fluctuations in the interest rates used to discount embedded derivative liabilities related to our fixed
index annuities, fair value changes and amendment related to the agent deferred compensation plan, loss on reinsurance
transaction, changes in the valuation allowance for deferred tax assets and other tax items, loss on extinguishment of debt and
other non-operating items consisting primarily of earnings attributable to variable interest entities (“net operating income,” a non-
GAAP financial measure) is important to evaluate the financial performance of the Company and is a key measure commonly
used in the life insurance industry. Management uses this measure to evaluate performance because the items excluded from net
operating income can be affected by events that are unrelated to the Company’s underlying fundamentals.
Management also believes that an operating return, excluding significant items, is important as the impact of these items
enhances the understanding of our operating results.
This non-GAAP financial measure also differs from return on equity because accumulated other comprehensive income (loss) has
been excluded from the value of equity used to determine this ratio. Management believes this non-GAAP financial measure is
useful because it removes the volatility that arises from changes in accumulated other comprehensive income (loss). Such
volatility is often caused by changes in the estimated fair value of our investment portfolio resulting from changes in general
market interest rates rather than the business decisions made by management. In addition, the value of capital used to calculate
this non-GAAP measure at December 31, 2017 is reduced by the $205.4 million impact recorded in retained earnings in the fourth
quarter of 2017 from the remeasurement of deferred tax liabilities originally recorded in accumulated other comprehensive
income. Management believes this adjustment to the December 31, 2017 non-GAAP measure is useful because it removes the
tax effects stranded in accumulated other comprehensive income as a result of accounting rules which require the effects of the
Tax Reform Act on deferred tax balances to be recorded in earnings, even if the balance was originally recorded in accumulated
other comprehensive income.
In addition, our equity includes the value of significant net operating loss carryforwards (included in income tax assets). In
accordance with GAAP, these assets are not discounted, and accordingly will not provide a return to shareholders (until after it is
realized as a reduction to taxes that would otherwise be paid). Management believes that excluding this value from the equity
component of this measure enhances the understanding of the effect these non-discounted assets have on operating returns and
the comparability of these measures from period-to-period. Operating return measures are used in measuring the performance of
our business units and are used as a basis for incentive compensation.
CNO Financial Group | Fourth Quarter 2017 Earnings | February 14, 2018 33
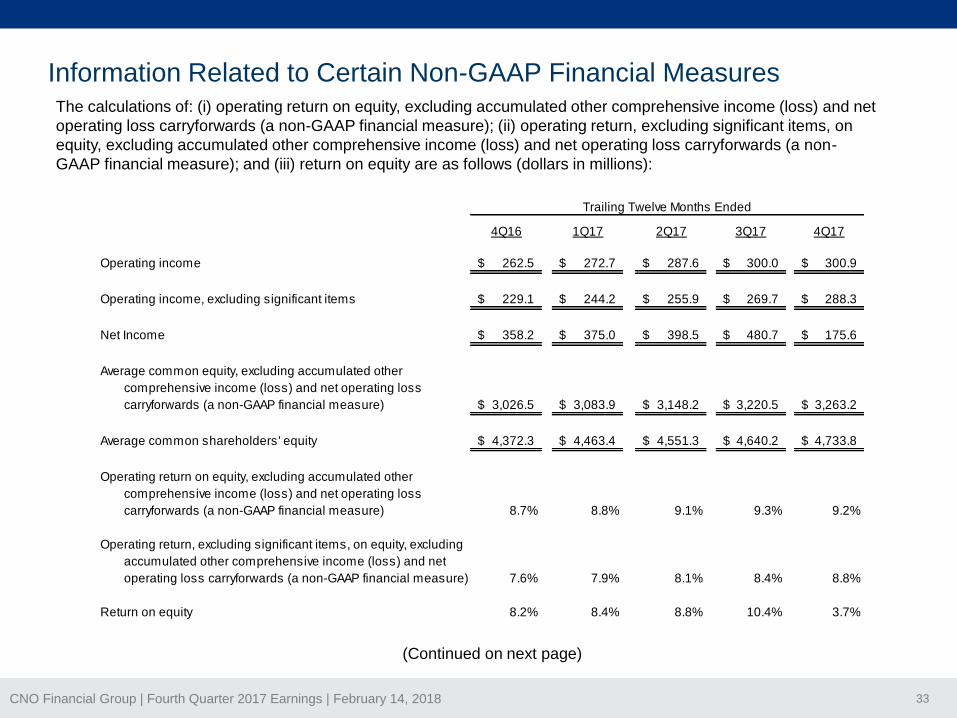
Information Related to Certain Non-GAAP Financial MeasuresThe calculations of: (i) operating return on equity, excluding accumulated other comprehensive income (loss) and net
operating loss carryforwards (a non-GAAP financial measure); (ii) operating return, excluding significant items, on
equity, excluding accumulated other comprehensive income (loss) and net operating loss carryforwards (a non-
GAAP financial measure); and (iii) return on equity are as follows (dollars in millions):
4Q16 1Q17 2Q17 3Q17 4Q17
Operating income 262.5$ 272.7$ 287.6$ 300.0$ 300.9$
Operating income, excluding significant items 229.1$ 244.2$ 255.9$ 269.7$ 288.3$
Net Income 358.2$ 375.0$ 398.5$ 480.7$ 175.6$
Average common equity, excluding accumulated other
comprehensive income (loss) and net operating loss
carryforwards (a non-GAAP financial measure) 3,026.5$ 3,083.9$ 3,148.2$ 3,220.5$ 3,263.2$
Average common shareholders' equity 4,372.3$ 4,463.4$ 4,551.3$ 4,640.2$ 4,733.8$
Operating return on equity, excluding accumulated other
comprehensive income (loss) and net operating loss
carryforwards (a non-GAAP financial measure) 8.7% 8.8% 9.1% 9.3% 9.2%
Operating return, excluding significant items, on equity, excluding
accumulated other comprehensive income (loss) and net
operating loss carryforwards (a non-GAAP financial measure) 7.6% 7.9% 8.1% 8.4% 8.8%
Return on equity 8.2% 8.4% 8.8% 10.4% 3.7%
Trailing Twelve Months Ended
(Continued on next page)

CNO Financial Group | Fourth Quarter 2017 Earnings | February 14, 2018 34
Information Related to Certain Non-GAAP Financial Measures
The following summarizes: (i) operating earnings; (ii) significant items; (iii) operating earnings, excluding significant
items; and (iv) net income (dollars in millions):
Net Operating Income,
income, excluding Net
excluding significant income -
Net Operating Significant significant items - trailing Net trailing
income items (a) items four quarters income (loss) four quarters
1Q16 49.6$ (3.0)$ 46.6$ 248.8$ 45.5$ 263.4$
2Q16 63.7 (2.9) 60.8 243.0 59.9 276.5
3Q16 64.3 (3.4) 60.9 239.6 18.6 261.3
4Q16 84.9 (24.1) 60.8 229.1 234.2 358.2
1Q17 59.8 1.9 61.7 244.2 62.3 375.0
2Q17 78.6 (6.1) 72.5 255.9 83.4 398.5
3Q17 76.7 (2.0) 74.7 269.7 100.8 480.7
4Q17 85.8 (6.4) 79.4 288.3 (70.9) 175.6
(a) - The significant items have been discussed in prior press releases.
(Continued on next page)

CNO Financial Group | Fourth Quarter 2017 Earnings | February 14, 2018 35
Information Related to Certain Non-GAAP Financial Measures
A reconciliation of pretax operating earnings (a non-GAAP financial measure) to net income is as follows (dollars in
millions):
4Q16 1Q17 2Q17 3Q17 4Q17
Pretax operating earnings (a non-GAAP financial measure) 410.3$ 425.6$ 447.3$ 464.8$ 454.7$
Income tax expense (147.8) (152.9) (159.7) (164.8) (153.8)
Operating return 262.5 272.7 287.6 300.0 300.9
Non-operating items:
Net realized investment gains (losses), net of related amortization 7.6 16.5 19.4 36.5 49.3
Fair value changes in embedded derivative liabilities, net of related amortization 9.6 34.7 45.3 38.2 (2.5)
Fair value changes and amendment related to the agent deferred compensation plan 3.1 9.1 21.4 1.7 (12.2)
Loss on reinsurance transaction (75.4) (75.4) (75.4) - -
Other (2.0) (1.1) (2.8) (5.4) (8.8)
Non-operating income (loss) before taxes (57.1) (16.2) 7.9 71.0 25.8
Income tax expense (benefit):
On non-operating income (loss) (20.0) (5.7) 2.8 24.9 9.0
Valuation allowance for deferred tax assets and other tax items (132.8) (112.8) (105.8) (134.6) 142.1
Net non-operating income (loss) 95.7 102.3 110.9 180.7 (125.3)
Net income 358.2$ 375.0$ 398.5$ 480.7$ 175.6$
Twelve Months Ended
(Continued on next page)

CNO Financial Group | Fourth Quarter 2017 Earnings | February 14, 2018 36
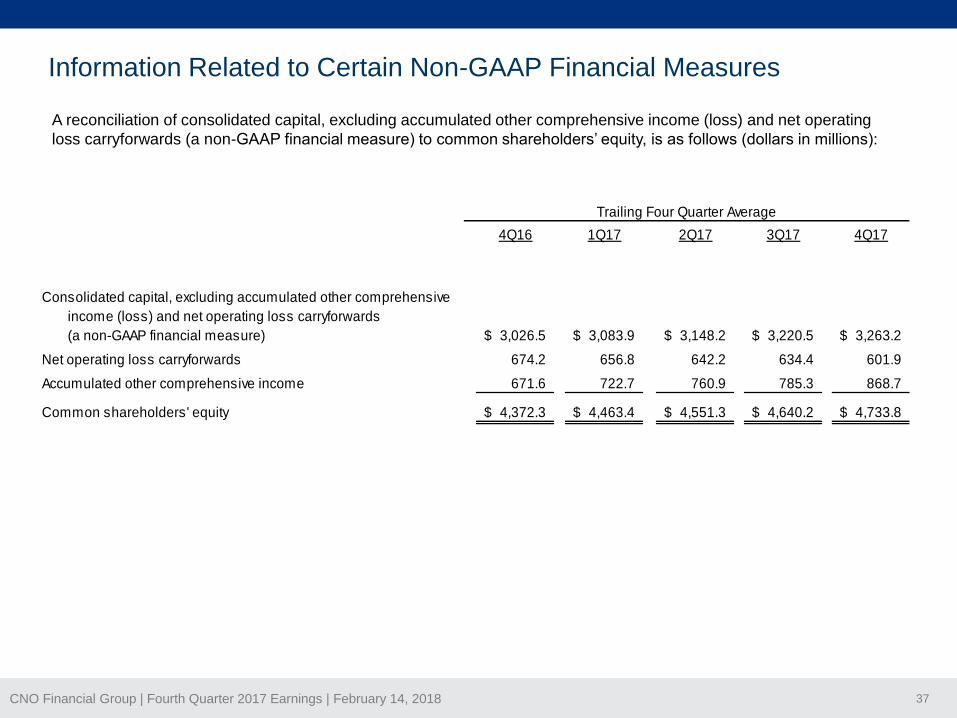
Information Related to Certain Non-GAAP Financial Measures
A reconciliation of consolidated capital, excluding accumulated other comprehensive income (loss) and net operating
loss carryforwards (a non-GAAP financial measure) to common shareholders’ equity, is as follows (dollars in millions):
1Q15 2Q15 3Q15 4Q15
Consolidated capital, excluding accumulated other comprehensive
income (loss) and net operating loss carryforwards
(a non-GAAP financial measure) 3,026.1$ 2,989.7$ 2,924.9$ 3,011.6$
Net operating loss carryforwards 793.3 769.5 735.7 724.1
Accumulated other comprehensive income 934.2 605.0 510.4 402.8
Common shareholders' equity 4,753.6$ 4,364.2$ 4,171.0$ 4,138.5$
1Q16 2Q16 3Q16 4Q16
Consolidated capital, excluding accumulated other comprehensive
income (loss) and net operating loss carryforwards
(a non-GAAP financial measure) 2,975.3$ 3,010.1$ 3,010.1$ 3,209.5$
Net operating loss carryforwards 710.8 668.3 628.2 655.0
Accumulated other comprehensive income 540.5 777.8 855.5 622.4
Common shareholders' equity 4,226.6$ 4,456.2$ 4,493.8$ 4,486.9$
1Q17 2Q17 3Q17 4Q17
Consolidated capital, excluding accumulated other comprehensive
income (loss) and net operating loss carryforwards
(a non-GAAP financial measure) 3,236.6$ 3,263.2$ 3,335.0$ 3,225.6$
Net operating loss carryforwards 640.6 621.6 613.1 409.8
Accumulated other comprehensive income 729.6 894.5 933.6 1,212.1 (a)
Common shareholders' equity 4,606.8$ 4,779.3$ 4,881.7$ 4,847.5$
(a) Accumulated other comprehensive income at December 31, 2017, is increased by $205.4
million to remove the stranded tax effects related to tax reform.
CNO Financial Group | Fourth Quarter 2017 Earnings | February 14, 2018 37
Information Related to Certain Non-GAAP Financial Measures
A reconciliation of consolidated capital, excluding accumulated other comprehensive income (loss) and net operating
loss carryforwards (a non-GAAP financial measure) to common shareholders’ equity, is as follows (dollars in millions):
4Q16 1Q17 2Q17 3Q17 4Q17
Consolidated capital, excluding accumulated other comprehensive
income (loss) and net operating loss carryforwards
(a non-GAAP financial measure) 3,026.5$ 3,083.9$ 3,148.2$ 3,220.5$ 3,263.2$
Net operating loss carryforwards 674.2 656.8 642.2 634.4 601.9
Accumulated other comprehensive income 671.6 722.7 760.9 785.3 868.7
Common shareholders' equity 4,372.3$ 4,463.4$ 4,551.3$ 4,640.2$ 4,733.8$
Trailing Four Quarter Average

CNO Financial Group | Fourth Quarter 2017 Earnings | February 14, 2018 38
Information Related to Certain Non-GAAP Financial Measures
4Q16 1Q17 2Q17 3Q17 4Q17
Corporate notes payable 912.9$ 913.4$ 913.9$ 914.4$ 914.6$
Total shareholders' equity 4,486.9 4,606.8 4,779.3 4,881.7 4,847.5
Total capital 5,399.8$ 5,520.2$ 5,693.2$ 5,796.1$ 5,762.1$
Corporate debt to capital 16.9% 16.5% 16.1% 15.8% 15.9%
Corporate notes payable 912.9$ 913.4$ 913.9$ 914.4$ 914.6$
Total shareholders' equity 4,486.9 4,606.8 4,779.3 4,881.7 4,847.5
Less accumulated other comprehensive income (622.4) (729.6) (894.5) (933.6) (1,212.1) (a)
Total capital 4,777.4$ 4,790.6$ 4,798.7$ 4,862.5$ 4,550.0$
Debt to total capital ratio, excluding AOCI (a
non-GAAP financial measure) 19.1% 19.1% 19.0% 18.8% 20.1%
Debt to capital ratio, excluding accumulated other comprehensive income (loss)
The debt to capital ratio, excluding accumulated other comprehensive income (loss), differs from the debt to capital ratio because accumulated
other comprehensive income (loss) has been excluded from the value of capital used to determine this measure. Management believes this non-
GAAP financial measure is useful because it removes the volatility that arises from changes in accumulated other comprehensive income (loss).
Such volatility is often caused by changes in the estimated fair value of our investment portfolio resulting from changes in general market interest
rates rather than the business decisions made by management. In addition, the value of capital used to calculate this non-GAAP measure at
December 31, 2017 is reduced by the $205.4 million impact recorded in retained earnings in the fourth quarter of 2017 from the remeasurement
of deferred tax liabilities originally recorded in accumulated other comprehensive income. Management believes this adjustment to the
December 31, 2017 non-GAAP measure is useful because it removes the tax effects stranded in accumulated other comprehensive income as a
result of accounting rules which require the effects of the Tax Reform Act on deferred tax balances to be recorded in earnings, even if the
balance was originally recorded in accumulated other comprehensive income. A reconciliation of these ratios is as follows (dollars in millions):
(a) Accumulated other comprehensive income at December 31, 2017, is increased by $205.4
million to remove the stranded tax effects related to tax reform.