¥SKF Prod Guiding GB · General ..... 11 Guiding systems ..... 15

MARKET INSIGHTS
Principles for successful long-term investingUsing Insights to achieve better client outcomes2017

2
THE KEY TO SUCCESSFUL INVESTING ISN’T PREDICTING THE FUTURE, IT’S
LEARNING FROM THE PAST AND UNDERSTANDING THE PRESENT. IN
“PRINCIPLES FOR SUCCESSFUL LONG-TERM INVESTING,” WE PRESENT
SEVEN TIME-TESTED STRATEGIES FOR GUIDING INVESTORS AND THEIR
PORTFOLIOS THROUGH TODAY’S CHALLENGING MARKETS AND TOWARD
TOMORROW’S GOALS. YOU WILL FIND SLIDES FROM OUR INDUSTRY-
LEADING GUIDE TO THE MARKETS AND GUIDE TO RETIREMENT, ALONG
WITH COMMENTARY PROVIDING ADDITIONAL PERSPECTIVE AND ACTION
STEPS.

3
1 PLAN ON LIVING A LONG TIME
2 CASH ISN’T ALWAYS KING
7 DIVERSIFICATION WORKS
6 STAYING INVESTED MATTERS
3 HARNESS THE POWER OF DIVIDENDS AND COMPOUNDING
4 AVOID EMOTIONAL BIASES BY STICKING TO A PLAN
5 VOLATILITY IS NORMAL; DON’T LET IT DERAIL YOU
PRINCIPLESFOR SUCCESSFUL LONG-TERMINVESTING

4
GTM – U.S.1 – Plan on living a long time
107
14
911 11
912
10 10 9 9
0
5
10
15
20
25
Source: J.P. Morgan Asset Management; (Left) SSA 2013 Life Tables; (Right) “The Future of Retirement: Life after work?” study by HSBC.Figures represent the expected portion of retirement that will not be covered by retirement savings based on survey data. Guide to the Markets – U.S. Data are as of December 31, 2016.
Probability of reaching ages 80 and 90Persons aged 65, by gender, and combined couple
Perceived retirement shortfall by country
Men
Women
Couple – at least onelives to specified age
Expected savings shortfall (years)
Savings expected to last (years)
812
7
108
10
8
11
10
58
6
Ave
rage
U.S
.
Fran
ce
Chi
na
Can
ada
Aus
traliaUK
Bra
zil
Sin
gapo
re
Indi
a
UA
E
Mex
ico
Inve
stin
gpr
inci
ples
63%
22%
73%
33%
90%
48%
0%
20%
40%
60%
80%
100%
80 years 90 years
5
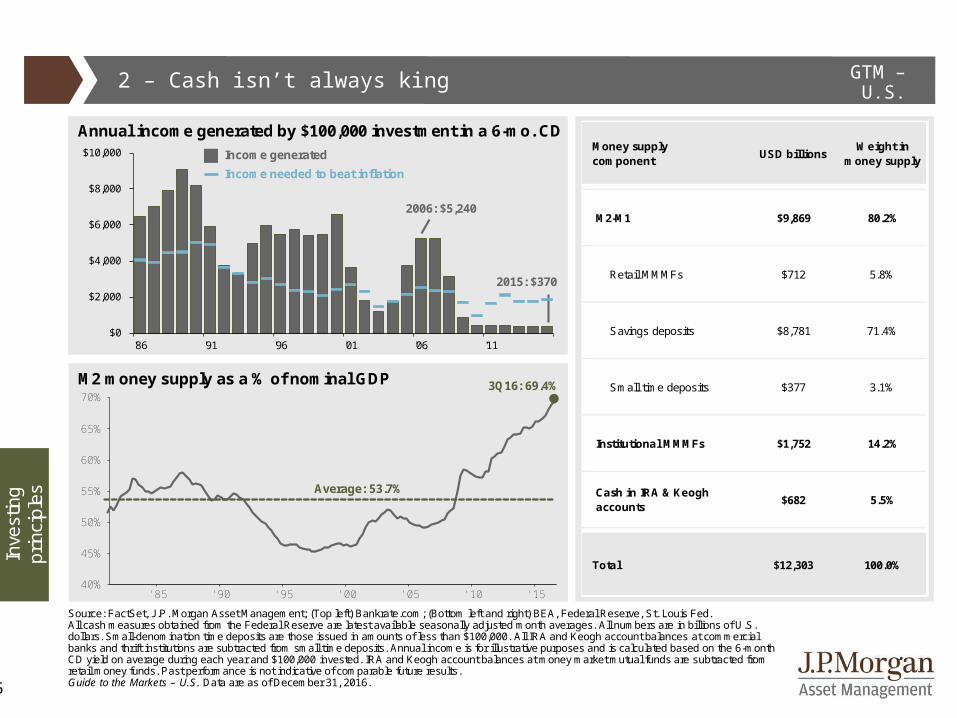
GTM – U.S.2 – Cash isn’t always king
$0
$2,000
$4,000
$6,000
$8,000
$10,000
'86 '91 '96 '01 '06 '11
Source: FactSet, J.P. Morgan Asset Management; (Top left) Bankrate.com; (Bottom left and right) BEA, Federal Reserve, St. Louis Fed. All cash measures obtained from the Federal Reserve are latest available seasonally adjusted month averages. All numbers are in billions of U.S. dollars. Small-denomination time deposits are those issued in amounts of less than $100,000. All IRA and Keogh account balances at commercial banks and thrift institutions are subtracted from small time deposits. Annual income is for illustrative purposes and is calculated based on the 6-month CD yield on average during each year and $100,000 invested. IRA and Keogh account balances at money market mutual funds are subtracted from retail money funds. Past performance is not indicative of comparable future results. Guide to the Markets – U.S. Data are as of December 31, 2016.
Annual income generated by $100,000 investment in a 6-mo. CD
M2 money supply as a % of nominal GDP
2015: $370
2006: $5,240
'85 '90 '95 '00 '05 '10 '1540%
45%
50%
55%
60%
65%
70%3Q16: 69.4%
Average: 53.7%
Inve
stin
gpr
inci
ples
Income generatedIncome needed to beat inflation
USD billions Weight in money supply
M2-M1 $9,869 80.2%
Retail MMMFs $712 5.8%
Savings deposits $8,781 71.4%
Small time deposits $377 3.1%
Institutional MMMFs $1,752 14.2%
$682 5.5%
Total $12,303 100.0%
Money supplycomponent
Cash in IRA & Keogh accounts

6
GTM – U.S. 3 – Harness the power of dividends and compounding
Oth
eras
set c
lass
es
$165k
$645k
$10
$100
$1,000
$10,000
$100,000
'47 '54 '61 '68 '75 '82 '89 '96 '03 '10
Source: Ibbotson, Standard & Poor’s, J.P. Morgan Asset Management.Guide to the Markets – U.S. Data are as of December 31, 2016.
The power of compoundingS&P 500 price return versus total return, growth of $10,000, quarterly
Major asset classes versus inflationGrowth of $10,000 from 1947-2015, annual, log scale, USD thousands
'70 '75 '80 '85 '90 '95 '00 '05 '10 '15$0
$200,000
$400,000
$600,000
$800,000
$1,000,000
Dec. 2016: $1,023,788
Dec. 2016: $249,785
With dividends reinvestedPrice return only
Small cap stocksLarge cap stocksBondsT-billsInflation
$49.5m
$13.9m
$106k

7
GTM – U.S.4 – Avoid emotional biases by sticking to a plan
$40,000
$60,000
$80,000
$100,000
$120,000
$140,000
$160,000
$180,000
Oct '07 Aug '08 Jun '09 Apr '10 Feb '11 Dec '11 Oct '12 Aug '13 Jun '14 Apr '15 Feb '16 Dec '16
Source: J.P. Morgan Asset Management; (Top) Barclays, FactSet, Standard & Poor’s; (Bottom) Dalbar Inc.Indexes used are as follows: REITS: NAREIT Equity REIT Index, EAFE: MSCI EAFE, Oil: WTI Index, Bonds: Barclays U.S. Aggregate Index, Homes: median sale price of existing single-family homes, Gold: USD/troy oz, Inflation: CPI. 60/40: A balanced portfolio with 60% invested in S&P 500 Index and 40% invested in high quality U.S. fixed income, represented by the Barclays U.S. Aggregate Index. The portfolio is rebalanced annually. Average asset allocation investor return is based on an analysis by Dalbar Inc., which utilizes the net of aggregate mutual fund sales, redemptions and exchanges each month as a measure of investor behavior. Returns are annualized (and total return where applicable) and represent the 20-year period ending 12/31/15 to match Dalbar’s most recent analysis. Guide to the Markets – U.S. Data are as of December 31, 2016.
20-year annualized returns by asset class (1996 – 2015)
Portfolio returns: Equities vs. equity and fixed income blend
40/60 stocks & bonds60/40 stocks & bondsS&P 500
Mar. 2009:S&P 500 portfolio
loses over $50,000
Nov. 2009:40/60 portfolio
recovers
Oct. 2010:60/40 portfolio
recovers
Mar. 2012:S&P 500 recovers
Oct. 2007: S&P 500 peak
Inve
stin
gpr
inci
ples
10.9%
8.2%7.2% 6.7%
5.3% 5.2% 4.8%
3.4% 3.3%2.2% 2.1%
0%
2%
4%
6%
8%
10%
12%
REITs S&P 500 60/40 40/60 Bonds Gold EAFE Homes Oil Inflation Averageinvestor

8
GTM – U.S.4 – Avoid emotional biases by sticking to a plan (PART 2)
Source: Openfolio, IMF, ICI, J.P. Morgan Asset Management.*Global stock and bond markets data are as of 2013. **U.S. investor allocation is the total value of investments in global or domestic equity mutual funds and ETFs. ***Investor allocation by region is based on data collected by Openfolio. Average sector allocations at the national level are determined by looking at the sector allocations of over 20,000 brokerage accounts, and taking a simple average. Portfolio allocations are then evaluated on a regional basis, and the regional averages are compared to the national average to highlight any investor biases. Further details can be found on openfolio.com. Guide to the Markets – U.S. Data are as of December 31, 2016.
Investor allocation by regionLikelihood of owning stocks in an industry vs. national average***
Investment universe & U.S. investorsPercentage of total net assets, 2014
Inve
stin
gpr
inci
ples
Financials Technology
Industrials Energy
+10%
-7%
-8%
+0%
-10%
+14%
-6%-7%
+9%
-5%
-12%-2%
+11%
-2%
+5%
-9%
U.S. Global
% +/- National Average
22%
36%
74%
78%
64%
26%
0%
10%
20%
30%
40%
50%
60%
70%
80%
90%
100%
Global GDP Global stock & bondmarkets*
U.S. investorallocation**

9
GTM – U.S.5 – Volatility is normal; don’t let it derail you
26
-10
1517
1
26
15
2
12
27
-7
26
47
-2
34
20
3127
20
-10-13
-23
26
9
3
14
4
-38
23
13
0
13
30
11
-1
10
-17 -18 -17
-7
-13
-8 -9
-34
-8 -8
-20
-6 -6 -5-9
-3
-8-11
-19
-12
-17
-30-34
-14
-8 -7 -8-10
-49
-28
-16-19
-10-6 -7
-12-11
-60%
-50%
-40%
-30%
-20%
-10%
%
10%
20%
30%
40%
'80 '85 '90 '95 '00 '05 '10 '15
Source: FactSet, Standard & Poor’s, J.P. Morgan Asset Management.Returns are based on price index only and do not include dividends. Intra-year drops refers to the largest market drops from a peak to a trough during the year. For illustrative purposes only. Returns shown are calendar year returns from 1980 to 2016.Guide to the Markets – U.S. Data are as of December 31, 2016.
S&P 500 intra-year declines vs. calendar year returnsDespite average intra-year drops of 14.2%, annual returns positive in 28 of 37 years
Equ
ities

10
GTM – U.S.5 – Volatility is normal; don’t let it derail you (PART 2)
7.0%
9.0%
6.6%
9.2%
Return Standard deviation
60%
40%
Source: Standard & Poor’s, Barclays, FactSet, J.P. Morgan Asset Management.*Annual rebalance and buy-and-hold strategies are composed of S&P 500 and Barclays U.S. Aggregate total return indexes on a monthly basis. Annualized risk and return statistics are calculated from 1/31/1996 – 12/31/2016 using monthly data. The risk-free rate is represented by the Barclays 1-3 month Treasury Bellwether index. Guide to the Markets – U.S. Data are as of December 31, 2016.
Risk/return for rebalanced vs. buy-and-hold strategy*60% equity and 40% fixed income portfolio, 20-year holding period
Actual portfolio drift in a buy-and-hold portfolioPortfolio drift of a 60% equity, 40% fixed income buy-and-hold portfolio
Inve
stin
gpr
inci
ples
Jan. 1997
Dec. 2016
Equity
Fixed income
60/40 annual rebalanceBuy-and-hold
Oct. 2007
Mar. 2009
69%
31%
65%
35%
48%52%
0.52
0.47
Sharpe ratio

Inve
stin
g
6 – Staying invested matters GTR – U.S.
This chart is for illustrative purposes only and does not represent the performance of any investment or group of investments. Source: J.P. Morgan Asset Management analysis using data from Morningstar Direct. 20-year annualized returns are based on the S&P 500 Total Return Index, an unmanaged, capitalization-weighted index that measures the performance of 500 large capitalization domestic stocks representing all major industries. Past performance is not indicative of future returns. An individual cannot invest directly in an index. Data as of December 31, 2015.
PLAN TO STAY INVESTED
Trying to time the market is extremely difficult to do consistently. Market lows often result in emotional decision making. Investing for the long term while managing volatility can result in a better retirement outcome.
11

12
GTM – U.S.6 – Staying invested matters (PART 2)
-39%
-8%
-15%
-3% -2%
1%
-1% 1% 2%7%
1%5%
47%43%
33%28%
23% 21% 19%16% 16% 17%
12% 14%
-50%
-40%
-30%
-20%
-10%
0%
10%
20%
30%
40%
50%
60%
1-yr. 5-yr.rolling
10-yr.rolling
20-yr.rolling
Source: Barclays, FactSet, Federal Reserve, Robert Shiller, Strategas/Ibbotson, J.P. Morgan Asset Management.Returns shown are based on calendar year returns from 1950 to 2016. Stocks represent the S&P 500 Shiller Composite and Bonds represent Strategas/Ibbotson for periods from 1950 to 2010 and Barclays Aggregate thereafter. Growth of $100,000 is based on annual average total returns from 1950 to 2016.Guide to the Markets – U.S. Data are as of December 31, 2016.
Range of stock, bond and blended total returnsAnnual total returns, 1950-2016
50/50 portfolio 8.9% $553,221Bonds 6.0% $318,764Stocks 11.1% $823,015
Annual avg. total return
Growth of $100,000 over 20 years
Inve
stin
gpr
inci
ples

13
GTM – U.S.7 – Diversification works
2002 2003 2004 2005 2006 2007 2008 2009 2010 2011 2012 2013 2014 2015 2016 Ann. Vol.
Comdty. EM Equity REITs EM
Equity REITs EM Equity
Fixed Income
EM Equity REITs REITs REITs Small
Cap REITs REITs Small Cap REITs EM
Equity25.9% 56.3% 31.6% 34.5% 35.1% 39.8% 5.2% 79.0% 27.9% 8.3% 19.7% 38.8% 28.0% 2.8% 21.3% 10.8% 23.8%
Fixed Income
Small Cap
EM Equity Comdty. EM
Equity Comdty. Cash High Yield
Small Cap
Fixed Income
High Yield
Large Cap
Large Cap
Large Cap
High Yield
EM Equity REITs
10.3% 47.3% 26.0% 21.4% 32.6% 16.2% 1.8% 59.4% 26.9% 7.8% 19.6% 32.4% 13.7% 1.4% 14.3% 9.8% 22.6%
High Yield
DM Equity
DM Equity
DM Equity
DM Equity
DM Equity
Asset Alloc.
DM Equity
EM Equity
High Yield
EM Equity
DM Equity
Fixed Income
Fixed Income
Large Cap
High Yield
Small Cap
4.1% 39.2% 20.7% 14.0% 26.9% 11.6% - 25.4% 32.5% 19.2% 3.1% 18.6% 23.3% 6.0% 0.5% 12.0% 9.2% 20.1%
REITs REITs Small Cap REITs Small
CapAsset Alloc.
High Yield REITs Comdty. Large
CapDM
EquityAsset Alloc.
Asset Alloc. Cash Comdty. Small
CapDM
Equity3.8% 37.1% 18.3% 12.2% 18.4% 7.1% - 26.9% 28.0% 16.8% 2.1% 17.9% 14.9% 5.2% 0.0% 11.8% 8.5% 19.2%
Cash High Yield
High Yield
Asset Alloc.
Large Cap
Fixed Income
Small Cap
Small Cap
Large Cap Cash Small
CapHigh Yield
Small Cap
DM Equity
EM Equity
Asset Alloc. Comdty.
1.7% 32.4% 13.2% 8.1% 15.8% 7.0% - 33.8% 27.2% 15.1% 0.1% 16.3% 7.3% 4.9% - 0.4% 11.6% 6.9% 19.0%
Asset Alloc.
Large Cap
Asset Alloc.
Large Cap
Asset Alloc.
Large Cap Comdty. Large
CapHigh Yield
Asset Alloc.
Large Cap REITs Cash Asset
Alloc. REITs Large Cap
Large Cap
- 5.9% 28.7% 12.8% 4.9% 15.3% 5.5% - 35.6% 26.5% 14.8% - 0.7% 16.0% 2.9% 0.0% - 2.0% 8.6% 6.7% 15.9%
EM Equity
Asset Alloc.
Large Cap
Small Cap
High Yield Cash Large
CapAsset Alloc.
Asset Alloc.
Small Cap
Asset Alloc. Cash High
YieldHigh Yield
Asset Alloc.
DM Equity
High Yield
- 6.0% 26.3% 10.9% 4.6% 13.7% 4.8% - 37.0% 25.0% 13.3% - 4.2% 12.2% 0.0% 0.0% - 2.7% 8.3% 5.8% 11.7%
DM Equity Comdty. Comdty. High
Yield Cash High Yield REITs Comdty. DM
EquityDM
EquityFixed
IncomeFixed
IncomeEM
EquitySmall Cap
Fixed Income
Fixed Income
Asset Alloc.
- 15.7% 23.9% 9.1% 3.6% 4.8% 3.2% - 37.7% 18.9% 8.2% - 11.7% 4.2% - 2.0% - 1.8% - 4.4% 2.6% 4.6% 11.0%
Small Cap
Fixed Income
Fixed Income Cash Fixed
IncomeSmall Cap
DM Equity
Fixed Income
Fixed Income Comdty. Cash EM
EquityDM
EquityEM
EquityDM
Equity Cash Fixed Income
- 20.5% 4.1% 4.3% 3.0% 4.3% - 1.6% - 43.1% 5.9% 6.5% - 13.3% 0.1% - 2.3% - 4.5% - 14.6% 1.5% 1.3% 3.5%
Large Cap Cash Cash Fixed
Income Comdty. REITs EM Equity Cash Cash EM
Equity Comdty. Comdty. Comdty. Comdty. Cash Comdty. Cash
- 22.1% 1.0% 1.2% 2.4% 2.1% - 15.7% - 53.2% 0.1% 0.1% - 18.2% - 1.1% - 9.5% - 17.0% - 24.7% 0.3% 1.2% 0.8%
2002 - 2016
Source: Barclays, Bloomberg, FactSet, MSCI, NAREIT, Russell, Standard & Poor’s, J.P. Morgan Asset Management. Large cap: S&P 500, Small cap: Russell 2000, EM Equity: MSCI EME, DM Equity: MSCI EAFE, Comdty: Bloomberg Commodity Index, High Yield: Barclays Global HY Index, Fixed Income: Barclays Aggregate, REITs: NAREIT Equity REIT Index. The “Asset Allocation” portfolio assumes the following weights: 25% in the S&P 500, 10% in the Russell 2000, 15% in the MSCI EAFE, 5% in the MSCI EME, 25% in the Barclays Aggregate, 5% in the Barclays 1-3m Treasury, 5% in the Barclays Global High Yield Index, 5% in the Bloomberg Commodity Index and 5% in the NAREIT Equity REIT Index. Balanced portfolio assumes annual rebalancing. Annualized (Ann.) return and volatility (Vol.) represents period of 12/31/01 – 12/31/16. Please see disclosure page at end for index definitions. All data represents total return for stated period. Past performance is not indicative of future returns. Guide to the Markets – U.S. Data are as of December 31, 2016.
Inve
stin
gpr
inci
ples

14
J.P. Morgan Asset Management – Risks & disclosures
The Market Insights program provides comprehensive data and commentary on global markets without reference to products. Designed as a tool to help clients understand the markets and support investment decision-making, the program explores the implications of current economic data and changing market conditions. The views contained herein are not to be taken as an advice or a recommendation to buy or sell any investment in any jurisdiction, nor is it a commitment from J.P. Morgan Asset Management or any of its subsidiaries to participate in any of the transactions mentioned herein. Any forecasts, figures, opinions or investment techniques and strategies set out are for information purposes only, based on certain assumptions and current market conditions and are subject to change without prior notice. All information presented herein is considered to be accurate at the time of writing. This material does not contain sufficient information to support an investment decision and it should not be relied upon by you in evaluating the merits of investing in any securities or products. In addition, users should make an independent assessment of the legal, regulatory, tax, credit, and accounting implications and determine, together with their own professional advisers, if any investment mentioned herein is believed to be suitable to their personal goals. Investors should ensure that they obtain all available relevant information before making any investment. It should be noted that investment involves risks, the value of investments and the income from them may fluctuate in accordance with market conditions and taxation agreements and investors may not get back the full amount invested. Both past performance and yield may not be a reliable guide to future performance.J.P. Morgan Asset Management is the brand for the asset management business of JPMorgan Chase & Co. and its affiliates worldwide. This communication is issued by the following entities: in the United Kingdom by JPMorgan Asset Management (UK) Limited, which is authorized and regulated by the Financial Conduct Authority; in other EEA jurisdictions by JPMorgan Asset Management (Europe) S.à r.l.; in Hong Kong by JF Asset Management Limited, or JPMorgan Funds (Asia) Limited, or JPMorgan Asset Management Real Assets (Asia) Limited; in Singapore by JPMorgan Asset Management (Singapore) Limited (Co. Reg. No. 197601586K), or JPMorgan Asset Management Real Assets (Singapore) Pte Ltd (Co. Reg. No. 201120355E); in Taiwan by JPMorgan Asset Management (Taiwan) Limited; in Japan by JPMorgan Asset Management (Japan) Limited which is a member of the Investment Trusts Association, Japan, the Japan Investment Advisers Association, Type II Financial Instruments Firms Association and the Japan Securities Dealers Association and is regulated by the Financial Services Agency (registration number “Kanto Local Finance Bureau (Financial Instruments Firm) No. 330”); in Korea by JPMorgan Asset Management (Korea) Company Limited; in Australia to wholesale clients only as defined in section 761A and 761G of the Corporations Act 2001 (Cth) by JPMorgan Asset Management (Australia) Limited (ABN 55143832080) (AFSL 376919); in Brazil by Banco J.P. Morgan S.A.; in Canada for institutional clients’ use only by JPMorgan Asset Management (Canada) Inc., and in the United States by JPMorgan Distribution Services Inc. and J.P. Morgan Institutional Investments, Inc., both members of FINRA/SIPC.; and J.P. Morgan Investment Management Inc. In APAC, distribution is for Hong Kong, Taiwan, Japan and Singapore. For all other countries in APAC, to intended recipients only.
Copyright 2017 JPMorgan Chase & Co. All rights reserved
Prepared by: Anastasia V. Amoroso, Samantha M. Azzarello, Gabriela D. Santos, David M. Lebovitz, Hannah J. Anderson, Abigail B. Dwyer, Ainsley E. Woolridge, John C. Manley and David P. Kelly.
Unless otherwise stated, all data are as of December 31, 2016 or most recently available.