PowerPoint Presentation -...
13
1/18/2019 1 “Now I lay me down to sleep. I pray the Lord my soul to keep. If I should die before I wake, I pray to God my soul to take. If I should live for other days” A Child’s Prayer How Much has Changed Why has Infectious Disease Mortality Changed? • Vaccines • Antibiotics • Sanitation Last smallpox outbreak in US, 1947. New York Last person with smallpox in the U.S. 1948 Last case of smallpox (Variola minor), Somalia, 1977
Transcript of PowerPoint Presentation -...

1/18/2019
1
“Now I lay me down to sleep.I pray the Lord my soul to keep.If I should die before I wake,I pray to God my soul to take.If I should live for other days”
A Child’s Prayer
How Much has Changed
Why has Infectious Disease Mortality Changed?
•Vaccines
•Antibiotics
•Sanitation
Last smallpox outbreak in US, 1947. New York
Last person with smallpox in the U.S. 1948
Last case of smallpox
(Variola minor),
Somalia, 1977

1/18/2019
2
Why do we Vaccinate?
• Hemophilus B• Was the leading cause of
acquired retardation
• We now vaccinate a low prevalence disease
• Targeted more at risk population• Teens
• Group Living
• Splenectomized
• MSM in CA
“Antibiotics are the magic weapons of deliverance” Future and Past New Infectious Diseases are Nothing New
• Between 5,000 and 6,000 years ago, Neolithic farming communities in Europe dramatically declined. Now, however, a team of researchers in Sweden has found a new strain of plague that they say may have been partially responsible.
• However, the discovery that the plague reached northern Europe far earlier suggests that the disease arrived before the Eurasian migrants (previously believed to be the source of plague).
• The study suggests that the plague started as a human disease in "mega-settlements" of 10,000 to 20,000 people built starting about 6,000 years ago. Poor sanitation and the concentration of people, animals and food may have allowed the plague to develop into a dangerous disease.
Rasmussen, S, Cell 2018
Emerging Organisms – Continuing Change2001-2005
Human bocavirus
Human coronavirus HKU1HTLV-3
HTLV-4
Human coronavirus
SARS coronavirus
Cryptosporidium hominis
Baboon CMV
Human metapneumovirus
Cryptosporidium felis
Whitewater Arroyo virus
1996-2000
Brachiola algerae
Ehrlichia ewingii
Nipah virus
TT virus
Brachiola vesicularum
Menangle virus
Anthropophthera
Laguna Negra virus
Andes virus
Australian bat lyssavirus
BSE/CJD agent
Ehrlichia canis
Juquitiba virus
Metorchis conjunctus
Trachipleistophorahominis
Usutu virus
1991-1995
Bayou virus
Black Creek Canal virus
Cote d’Ivoire Ebola virus
Hepatitis G virus
New York virus
Anaplasmaphagocytophila
Hendra viru
Human herpesvirus 7
Human herpesvirus 8
Sabia virus
Bartonella elizabethae
Encephalitozoon intestinalis
Gymnophalloides seoi
Sin Nombre virus
Bartonella henselae
Dobrava-Belgrade virus
Ehrlichia chaffeensis
Encephalitozoon hellemGuanarito virus
Nosema ocularum
1985-1990
Banna virus
Gan gan virus
Reston Ebola virus
Semliki Forest virus
Trubanaman virus
Vittaforma corneae
C. amycolatu
European bat lyssavirus1
Hepatitis C virus
Barah Forest virus
Piobirnavirus
Hori virus
Sealpox virus
Suid herpesvirus
Cyclospora cayetanensis
European bat lyssavirus 2
Human herpesvirus 6
HIV- 2
Kasokero virus
Kokobera virus
Rotavirus C
1981-1985
Borna disease virus
Enterocytozoon bieneusi
Pleistophora ronneafiei
Human torovirus
Rotavirus
B Scedosporiumprolificans
Candiru virus
C. canimorsu
Helicobacter pylori
Hepatitis E virus
Human adenovirus F
HIV
Borrelia burgdorferi
HTLV-2 Seoul virus
1980
Microsporidian africanumHTLV -1
Puumala virus
Factors Affecting Emerging and Re-emerging Infections• Climate change
• Politics
• Population growth
• Technology
• Poverty
• Myths and conspiracy theories

1/18/2019
3
Animal Pathogen Evolution – Will Continue to Change
Ebola, Lassa, Marburg, Lyme, Flu, SARS, etc
Diagram courtesy of Wolfe et al. 2007
JAMA. 1997;277:904-908
Disease of Changes in Nature and Population
JAMA. 1997;277:904-908
JAMA. 1997;277:904-908
Dengue - Reasons for pandemic
• Population growth• Urbanization and chaotic growth• Spread of vector mosquitoes• Expansion of plastics and tires• Rapid world-wide travel• Cessation of effective mosquito control• Developing insecticide resistance
Aedes aegypti
• Dengue transmitted female Primarily a daytime feeder
• Bites in and outdoors from early morning
• “Nervous feeders” –> high transmission rate
• Lives around human habitation
• Flies < 200 meters generally
• Lays eggs and produces larvae preferentially in artificial containers

1/18/2019
4
Reinfestation by Aedes aegypti
1930s 1970 1998
2003: 20 megacities of > 10 mil. people ; 75% developing world
Civet cat
SARS -
• Animal to human transmission
• Engineering of modern buildings
• Transportation and technology development
• Mythology
SARS
Vent stack
SARS outbreak in Canada – The Rest of the Story
“I don’t think this is SARS”

1/18/2019
5
Factors Affecting Emerging and Re-emerging Infections
• Politics
• Technology
Foreign Policy March 27, 2012
“Perform genetic engineering work on these viruses, with the eventual aims of manipulating smallpox virulence factors and inserting genes of other viruses into smallpox to create chimera viruses. The purpose of creating chimera viruses was to design new organisms which would have a synergistic effect and/or evade current vaccines or treatments. One of the first chimera viruses planned involved the insertion of Venezuelan equine encephalomyelitis (VEE) genes into smallpox….”
PerspectiveVolume IX, Number 1 (September-October 1998)
ISCIP
The Macabre Part of ID
Molecular Biology Institute outside of Moscow
Entrance to Vektor
Microbiologist Housing at Vektor
Exposure Chambers, ARVI Tartastan

1/18/2019
6
Hantavirus
• A young, physically fit Navajo man with shortness of breath died very rapidly in New Mexico
• The young man's fiancée had died a few days before
• An additional five young, healthy people were identified who all died after acute respiratory failure
• Virus genes linked to the pulmonary syndrome, a previously unknown type of hantavirus. (Sin Nombre Virus)
Hantavirus
• Later that year:• Louisiana bridge inspector who had not traveled to the Four Corners area developed HPS.
Another hantavirus, named Bayou virus
• 33 y/o Florida man with HPS symptoms. Had not traveled to the Four Corners area. Another hantavirus, named the Black Creek Canal virus
• New York 1993 - New York-1
• 1913, Russian clinical records from eastern Siberia describe hemorrhagic fever with renal syndrome (HFRS)• Chinese literature - similar disease dating to about A.D. 960
• Wars disrupt normal interface
Why Did Hanta Emerge?Climate/Population Changes
• Drought for several years.
• Heavy snows and vegetation boom
• Predators became scarce after prey numbers limited
• These factors allowed deer mice population to increase ten fold in May 1993 contrasted to May of 1992. • 30% of the deer mice tested showed evidence of infection with
hantavirus.
Zika virus
Changes• Mobility• Mutation• Population• Sanitation
Zika virus
Zika Virus in Polynesia –Relation to Guillain-Barre

1/18/2019
7
Zika Likely Spread to Brazil by Tongan Soccer Team
Zika virus –Remarkable Affinity for Neural Tissue in Fetus
Risk of Microcephaly after Maternal ZikaInfection in 1st Trimester
• Brasil et al: 22% of pregnancies in cohort of symptomatic women in Brazil
• Cauchemez et al: 1% of pregnancies all infected women in French Polynesia
• Johansson et al: 1 – 13% of all affected neonates born in Bahia*
Rodrigues, Lancet. 2016.Johansson et al NEJM 2016
Changing Malaria Risk in Kenya
• Climate change• Population
PopulationNairobi metro 7 millionKenya -50 million
Malaria Growth and Temperature.
Shapiro LLM, Whitehead SA, Thomas MB (2017) Quantifying the effects of temperature on mosquito and parasite traits that determine the transmission potential of human malaria. PLOS Biology 15(10): e2003489.
What is Cholera?• Bacterial fecal oral infection
• Toxin mediated diarrhea
• Massive fluid and electrolyte derangements
• Not invasive

1/18/2019
8
Cholera in Yemen• Population
Disruption• Breakdown of
Public Health• Malnutrition
“Under pressure from Peru's powerful fishing industry, President Alberto K. Fujimori, his wife, Susana, and his ministers of fisheries and of agriculture went on television eating ceviche…….. Trying to revive tourism, the President also played host to 20 foreign correspondents for a lunch of ceviche and sashimi at a beachfront restaurant.
Within days, hospital admissions for cholera soared. One patient reportedly was the Fisheries Minister, Felix Canal.
The Peruvian government stopped chlorinating drinking water supplies in the country following the publication of U.S. EPA reports on the health risks of disinfection byproducts (DBPs), out of concern for this newly recognized hazard.
Within months, a cholera epidemic swept through the country, eventually causing 1.3 million cases of illness and 13,000 deaths
Cholera in Peru
Cholera Outbreak Peru
• Bilge emptied into Lima harbor• DNA testing of the Latin American cholera strain shows that it is genetically similar—
although not identical—to a cholera strain common in Bangladesh
• The El Ni ˜no warming effect on ocean waters can promote plankton blooms, in which cholera bacteria can thrive, especially with high levels of sewage that provide needed nutrients to the microbes.
• strain of cholera isolated from patients in Peru, Vibrio cholerae O1, El Tor, has been found to produce an exopolysaccaride that can make the bacteria more resistant to chlorine.
• Undercooked seafood, raw (e.g., ceviche)
• Irrigation with sewage water
Cholera Outbreak Peru• Flat water system
• Erratic chlorination
• Lack of toilets – seepage into system
• Testing deteriorated
• Slums along the river
• Strain of cholera isolated from patients in Peru, Vibrio cholerae O1, El Tor, has been found to produce an exopolysaccaride that can make the bacteria more resistant to chlorine.
Fleming’s Nobel Prize Address
“. . .the thoughtless person playing with penicillin
treatment is morally responsible for the death of the
man who finally succumbs to infection with the
penicillin-resistant organism. I hope this evil can be
averted.”
New York Times 1945 Jun 26, p21.
Antibiotic Resistance – Bacteria Live in a Competitive Environment
• Many mechanisms• Enzymes destroy antibiotic (beta-lactamase)• Binding with target is altered (E. faecium, VRE)
• Penetration is reduced (VISA)• Antibiotic is removed from cell (efflux pumps)
• Innate, such as intracellular organisms• Biofilms
• Abscess formation

1/18/2019
9
Factors Promoting Antibiotic Resistance• Increased antimicrobial use in the community and hospitals,
in veterinary medicine and agriculture• 8 million kg used for animals annually
• 22,000 kg used for fruit trees annually in the U.S.
• In 1954, two million pounds of antibiotics were produced in the US. Today > 50 million pounds.
• > 100 million courses of antibiotics in the US annually.
• Empiric antibiotics
• Prolonged and broad-spectrum antibiotic courses
• Repeated antibiotic courses
Antibiotics Used in Veterinary Applications• For treatment of disease.
• For metaprophylaxis.
• For growth enhancement.• In cattle: bacitracin, tetracyclines, lasalocid, monensin• In swine: asanilic acid, bambermycin, erythromycin,
penicillin, tiamulin, virginiamcin
Antibiotics Used in Veterinary Applications• Antibiotics selected have generally not been used in
humans.• This has changed with glycopeptides for instance.• Resistance may not correlate with only the type of
antibiotic used.• Macrolide and glycopeptide genes were linked when the
macrolide (tylosin) was stopped in Denmark, and virginiamycinwas continued.
• Efflux pumps.
Antibiotics Used in Veterinary Applications
• Linkage to resistance in human pathogens is identified, but not well-understood.
• Concerns with veterinary resistance• The widespread presence of resistance genes.
• Studies in bacteria from the pre-antibiotic era.
• Development of resistance vectors such as plasmids permits wide dissemination of resistance.• This reduces the genetic cost of maintaining resistance.
0
5
10
15
20
25
30
35
40
Germany France
1985
1989
1993
1997
Outpatient Antibiotic Use, Daily Defined Doses/1000
Harbarth, Emerg Infect Dis
2002;8:1460.
0
10
20
30
40
50
60
France Germany
Pen R
Pneumococcus
Pen I
Pneumococcus
Erythro R
Pneumococcus
Harbarth, Emerg Infect Dis
2002;8:1460.
Contrast in Pneumococcal Resistance between
Germany and France
1/18/2019
10
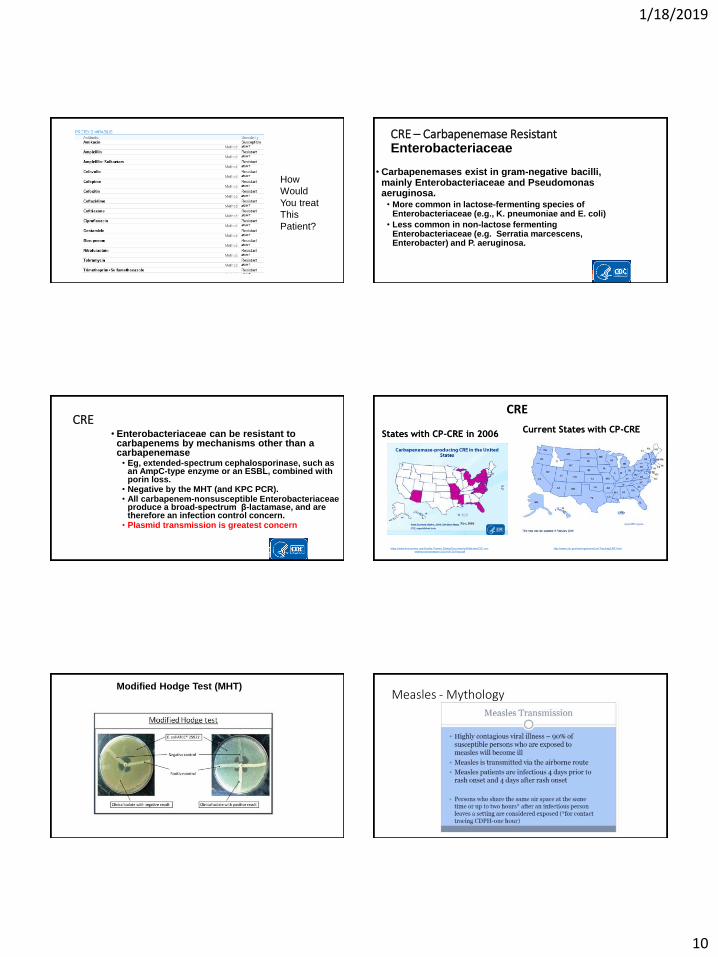
How
Would
You treat
This
Patient?
CRE – Carbapenemase Resistant Enterobacteriaceae
• Carbapenemases exist in gram-negative bacilli, mainly Enterobacteriaceae and Pseudomonas aeruginosa. • More common in lactose-fermenting species of
Enterobacteriaceae (e.g., K. pneumoniae and E. coli)
• Less common in non-lactose fermenting Enterobacteriaceae (e.g. Serratia marcescens, Enterobacter) and P. aeruginosa.
CRE• Enterobacteriaceae can be resistant to
carbapenems by mechanisms other than a carbapenemase• Eg, extended-spectrum cephalosporinase, such as
an AmpC-type enzyme or an ESBL, combined with porin loss.
• Negative by the MHT (and KPC PCR). • All carbapenem-nonsusceptible Enterobacteriaceae
produce a broad-spectrum β-lactamase, and are therefore an infection control concern.
• Plasmid transmission is greatest concern
States with CP-CRE in 2006
https://www.ihaconnect.org/Quality-Patient-Safety/Documents/Webinars/CfC-cre-
webinar-presentation-2014-09-25-final.pdf
Current States with CP-CRE
http://www.cdc.gov/hai/organisms/cre/TrackingCRE.html
CRE
Modified Hodge Test (MHT)Measles - Mythology

1/18/2019
11
Measles – Ro Measles
Duuuhh!
Marin Pertussis Outbreak• 2010 saw the largest epidemic of B. pertussis in California
in more than 50 years
• Marin County was at the epicenter of the epidemic
• All patients with a positive PCR for B. pertussis at from March 1-October 31, 2010
• Example of mutational changes, policy changes and myhtology
Results• 171 patients with B. Pertussis were identified
• 132 age <18, and 103 age <=12.
• Vaccination rates of patients in the <=12 age group: • 85% fully vaccinated• 7% under vaccinated
• 8% never vaccinated.

1/18/2019
12
Case and Testing Rates By Age
0
500
1000
1500
2000
2500
3000
3500
4000
0
5000
10000
15000
20000
25000
30000
0 4 8 12 16
Att
ack
Rate
in
Case
sp
er
100,0
00 P
ers
on
-Years
Rate
of
Pert
uss
is P
CR
Test
ing
per
100,0
00 P
ers
on
-Years
Age in Years
Pertussis attack rate and PCR Testing rate per 100,000 Person-Years
Rate of Pertussis PCR Testing Per 100,000Person-Years
Attack Rate in cases per 100,000 Person Years
Results
Table 3. Attack Rate in Vaccinated and Under and Unvaccinated Patients
Age GroupAttack Rate in
Vaccinated Persons*
Attack Rate in Under and
Unvaccinated Persons*
P-Value
2-7 359 606 0.57
8-12 2453 3211 0.43
13-18 452 2189 0.009
2-18 1011 2073 0.01
*Per 100,000 person-years
Analysis
Table 1. Vaccine Effectiveness by age.
Age Group (Years)
PPV PCVEffectiveness
(%)Effectiveness: 95%
Confidence Intervals
2-7 91% 86% 41% 21-54%
8-12 89% 86% 24% 0-40%
13-18 89% 62% 79% 73-84%
2-18 90% 81% 51% 44-58%
* PPV= Proportion of the Population fully Vaccinated
PCV= Proportion of Cases fully Vaccinated
Why the Pertussis Outbreak
• In 1996 wP was change to aP• Had fewer side effects
• Durability of aP vaccine never tested – only 18 months f/u
• Change in vaccine strategy made without the above knowledge
• Organism may have mutated to make it evade vaccine somewhat
• Unvaccinated pockets of children are incubator for epidemics
History
• Named after the Ebola River in the DRC (formerly
Zaire), near the first epidemics.
• Two species were identified in 1976: • Zaire ebolavirus (ZEBOV) and
• Sudan ebolavirus (SEBOV)
• Case fatality rates of 83% and 54% respectively.
• Additional species continue to be identified.

1/18/2019
13
Hemorrhagic Fever Virus Distribution in Africa Examples of Interspecies Transmission
Lassa Virus Ebola Virus Marburg Virus
Photos courtesy of Travel Approved (for Lassa and Ebola), Mehedi et al. 2011 (for Marburg)
Year Ebola Sub-type Country Number of Cases Percentage of deaths Situation
1976 Ebola-Zaire Zaire (DRC) 318 88% Spread by close personal contact and needles and syringes in hospitals/clinics. First recognition
1976 Ebola-Sudan Sudan 284 53% Disease spread through close personal contact within hospitals.
1976 Ebola-Sudan England 1 0% Laboratory infection by accidental stick of contaminated needle.
1977 Ebola-Zaire Zaire 1 100% Noted retrospectively in the village of Tandala.
1979 Ebola-Sudan Sudan 34 65% Occurred in Nzara. Recurrent outbreak at the same site as the 1976 Sudan epidemic.
1989 Ebola-Reston USA 0 0% Ebola-Reston virus in quarantine facilities in VA, TX, and PA by monkeys imported from the Philippines.
1990 Ebola-Reston USA 0 0% Ebola-Reston virus was introduced once again into quarantine facilities by monkeys from the Philippines.
1992 Ebola-Reston Italy 0 0% Ebola-Reston virus was introduced into quarantine facilities in Sienna
1994 Ebola-Zaire Gabon 49 59% Occurred in Mékouka and other gold-mining camps deep in the rain forest.
1994Ebola-Ivory
CoastIvory Coast 1 0% Contracted after conducting an autopsy on a wild chimpanzee in the Tai Forest.
1995 Ebola-Zaire DRC 315 81% Index case worked in forest. Epidemic spread through families and hospitals.
1996 Ebola-Zaire Gabon 31 68%Chimpanzee found dead in the forest was eaten. 19 involved in the butchery of the animal became ill;
other cases occurred in family members.
1996 Ebola-Zaire Gabon 60 75% Index case was a hunter. Disease spread by close contact with infected persons
1996 Ebola-Zaire South Africa 2 50% HCW from Gabon to South Africa, having treated Ebola patients. A nurse became infected and died.
1996 Ebola-Reston USA 0 0% Ebola-Reston virus was introduced into a quarantine facility in Texas
1996 Ebola-Reston Philippines 0 0% Ebola-Reston virus was identified in a monkey export facility in the Philippines.
2000-2001 Ebola-Sudan Uganda 425 53% Risks were funerals; contact with patients in family, and medical care without adequate protection.
2001-2002 Ebola-Zaire Gabon and DRC 122 79% Outbreak occurred over the border of Gabon and DRC.
Prior Ebola Outbreaks
Year Ebola Sub-type Country Number of Cases Percentage of deaths Situation
2002 Ebola-Zaire Congo 143 89% Hunters with wildlife contact that was killed or found dead. Direct contact with infected persons.
2003 Ebola-Zaire Congo 35 83% Limited due to early mobilization
2004Ebola-Zaire
Russia 1 100% Laboratory infection by accidental stick of contaminated needle.
2004 Ebola-Sudan Sudan 17 41% Limited data
2005 Ebola-Zaire Congo 12 83% Hunters and caretakers
2007Bundibugyo ebolavirus
Uganda 131 32% New strain with lower mortality
2007 Ebola-Zaire DRC 264 71% Ebola-Reston virus was introduced once again into quarantine facilities by monkeys from the Philippines.
2008 Ebola-Zaire DRC 32 47% International response
2011 Ebola-Sudan Uganda 11 36% Limited outbreak
2012 Ebola-Sudan Uganda 1 0% Contracted after conducting an autopsy on a wild chimpanzee in the Tai Forest.
2012Bundibugyo ebolavirus
DRC 36 36% Separate from Ugandan outbreak which was simultaneous
2012 Ebola-Sudan Uganda 11 36% Early recognition
2014 Ebola-Zaire DRC 69 71% Not related to West Africa outbreak
2014 Ebola-ZaireGuinea, Liberia,
Sierra Leone28,610 39% Largest outbreak ever. Many initial errors and urban spread
2014Ebola-Zaire
USA 0 0% Ebola-Reston virus was introduced into a quarantine facility in Texas
2014 Ebola-Reston Philippines 0 0% Ebola-Reston virus was identified in a monkey export facility in the Philippines.
2017 Ebola-Zaire DRC 8 50% Remote area
2018 Ebola-Zaire DRC Ongoing ? Control limited by logistics, war
Prior Ebola Outbreaks
Where does Ebola hide?
• 2002- Fruit Bats - do not show any symptoms
• Best candidate to be the reservoir
• Antibodies against Ebola
• Primate outbreaks often precede Human outbreaks
• Ebola Gene sequences in liver and spleen and many other mammals
Ebola Virus- Risk Factors
• Hunting and butchering wild animals, especially non-human
primates
• Healthcare workers and family
Photo courtesy of Nathan Wolfe Photo courtesy of the CDC PHIL
Transmission• Direct contact with the blood, secretions, organs or
semen of infected persons: • Risk factors among 27 surviving members in Kikwit
• Direct contact during late hospital phase were at very high risk.
• Those with no physical contact with infected remained uninfected.
• Transmission through semen occurs up to 80 d.• Recent report 14 cases - funeral preparations.
• Handling dead infected people or chimps.
• Neonatal
• Droplets or small filovirus particle aerosols confirmed in alveoli of monkeys during Reston outbreak and BT evaluations