PowerPoint Presentation - asdk12.org · AK Native/ Am. Indian Students ... Anchorage 80 55 51 70...
45
Transcript of PowerPoint Presentation - asdk12.org · AK Native/ Am. Indian Students ... Anchorage 80 55 51 70...

100 Day
November 2016

Academics
• Data

ASD and the Big 5
Four Year Graduation Rate
2012 2013 2014 2015 2016
Alaska 70 72 71 76 76
Anchorage 73 76 74 80 80
Mat-Su 72 73 75 78 79
Fairbanks 70 74 73 75 74
Kenai 79 78 81 82 83
Juneau 70 79 80 77 84

Student Group Comparisons 2016Big 5 Four Year Graduation Rate
WholeAK Native/
Am. Indian
Students with
Disabilities
Economically
Disadvantage
Alaska 76 64 54 68
Anchorage 80 55 51 70
Mat-Su 79 70 65 71
Fairbanks 74 54 47 53
Kenai 83 77 59 72
Juneau 84 70 64 68

ASD Students with an F1 in 3 secondary students received an F last year (2015-16)
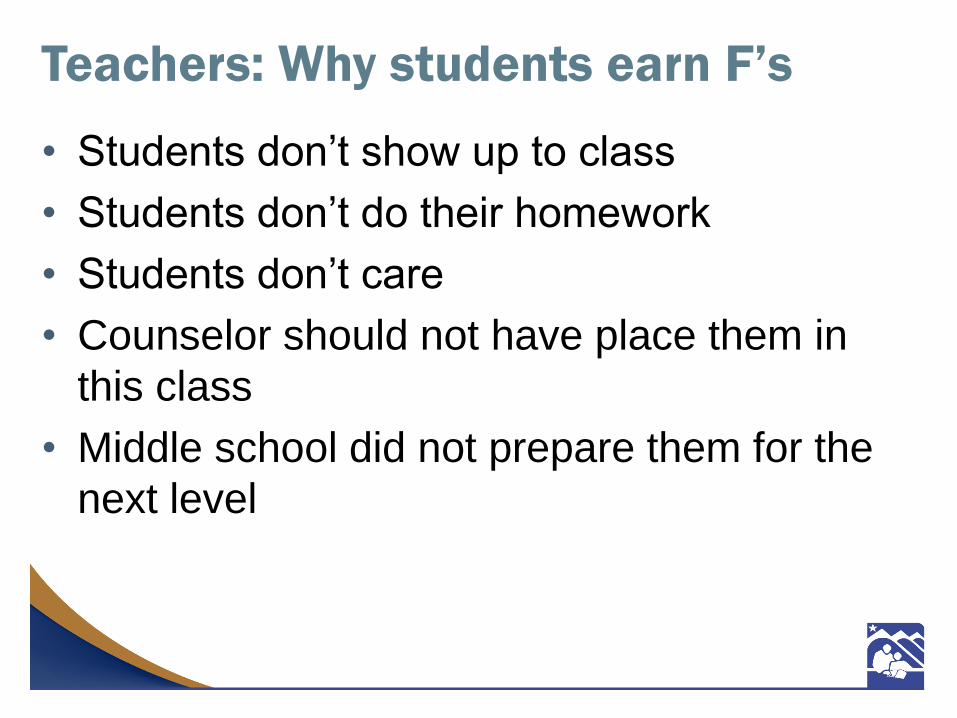
Teachers: Why students earn F’s
• Students don’t show up to class
• Students don’t do their homework
• Students don’t care
• Counselor should not have place them in
this class
• Middle school did not prepare them for the
next level
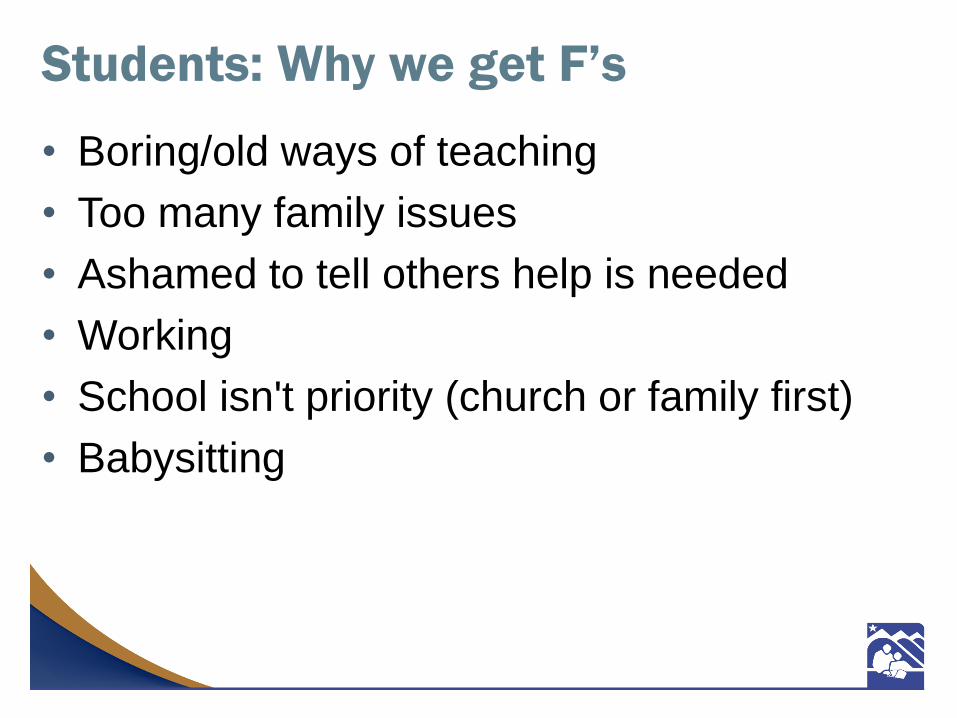
Students: Why we get F’s
• Boring/old ways of teaching
• Too many family issues
• Ashamed to tell others help is needed
• Working
• School isn't priority (church or family first)
• Babysitting
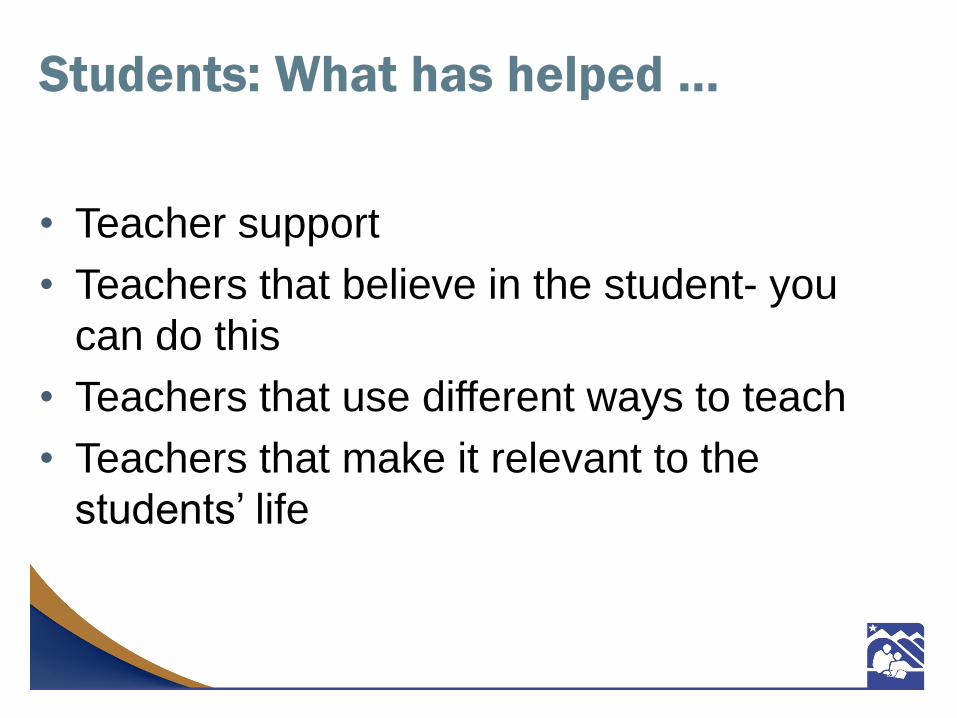
Students: What has helped …
• Teacher support
• Teachers that believe in the student- you
can do this
• Teachers that use different ways to teach
• Teachers that make it relevant to the
students’ life
Climate
• Connectedness Survey
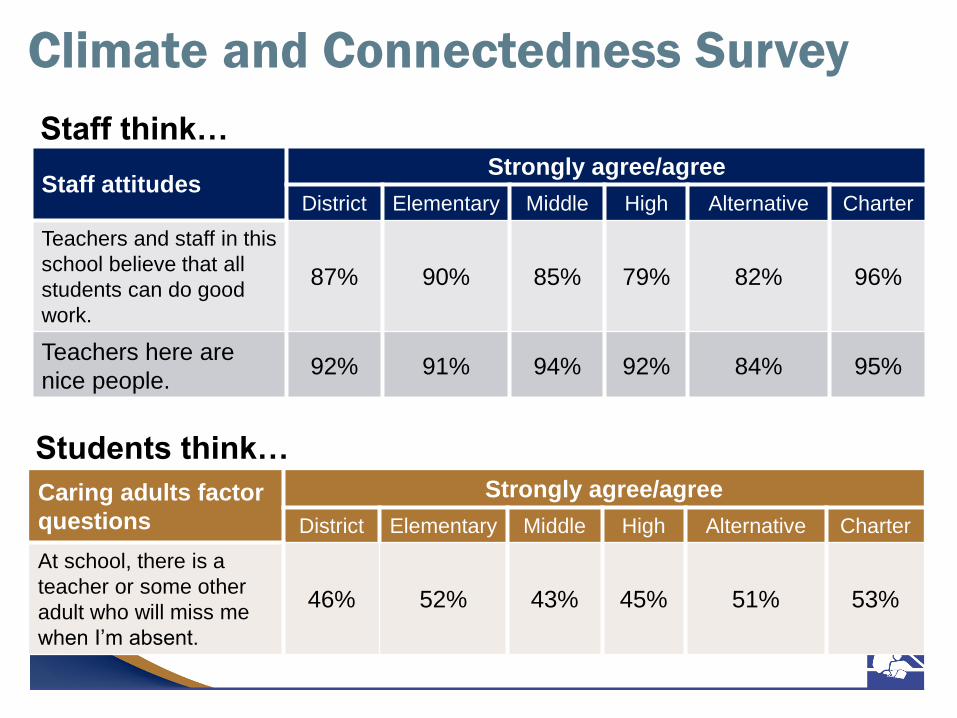
Climate and Connectedness Survey
Staff think…
Students think…
Staff attitudesStrongly agree/agree
District Elementary Middle High Alternative Charter
Teachers and staff in this
school believe that all
students can do good
work.
87% 90% 85% 79% 82% 96%
Teachers here are
nice people.92% 91% 94% 92% 84% 95%
Caring adults factor
questions
Strongly agree/agree
District Elementary Middle High Alternative Charter
At school, there is a
teacher or some other
adult who will miss me
when I’m absent.
46% 52% 43% 45% 51% 53%

Board Goals: Support Initiatives
• Support each Board goal
• Guide work and establish focus
• Measure effort
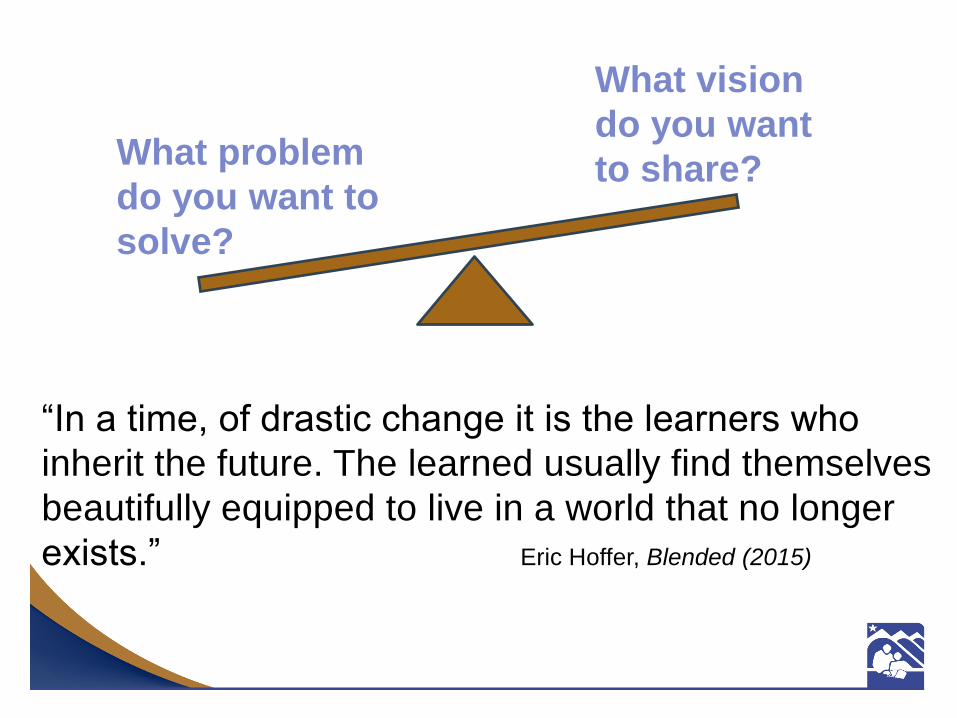
“In a time, of drastic change it is the learners who
inherit the future. The learned usually find themselves
beautifully equipped to live in a world that no longer
exists.” Eric Hoffer, Blended (2015)
What problem
do you want to
solve?
What vision
do you want
to share?

End-of-Year
June 2017

Destination 2020

Performance: Board Goal Initiative
• Increase reading proficiency
Grade
Level
Test
AIMSweb Level
Spring
2016
Spring
2017Change
KLetter Sound
Fluency
Low
Risk/Benchmark74.5% 78.9% 4.4% Met
At Risk/Intensive13% 11% -2% Met
1
Reading
Curriculum
Based
Measure
Low
Risk/Benchmark 60% 58.1% -1.9%Not
Met
At Risk/Intensive 16.3% 17.8% 1.5
Not
Met
3
Reading
Curriculum
Based
Measure
Low
Risk/Benchmark 62.4% 61.3% -1.1%Not
Met
At Risk/intensive 13.8% 15% 1.2% Met
• Increase percentage of students Benchmark/Low Risk (increase of 3% and/or maintain
80% or higher)
• Decrease percentage of students At Risk (decrease of 3% and/or maintain 15% or lower)

Performance: FY17 Action
• Selected researched based ELA (English
Language Arts) Curriculum
• Strategically planned instructional coach
program
• Utilized data-dashboard to highlight
pertinent data at various levels
Performance: FY18 Next Steps
• Expand Measures of Academic Progress
(MAP) to 3rd – 8th
• Increase scope and use of data-dashboard
• Multi-tiered system of support training and
development
◦ Advanced learners
◦ At risk Learners
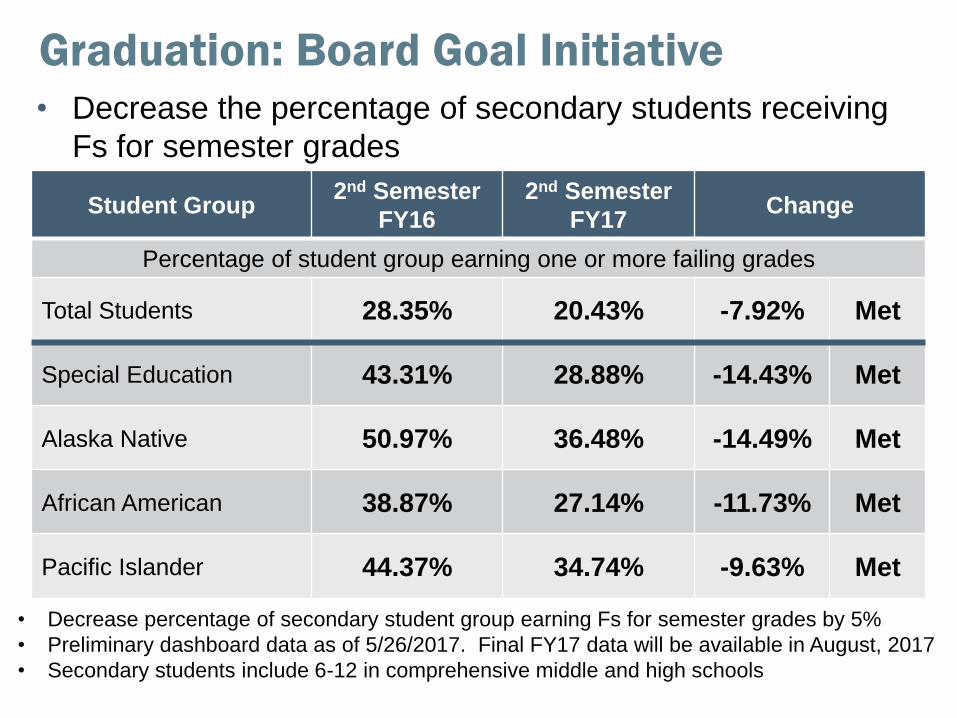
Graduation: Board Goal Initiative• Decrease the percentage of secondary students receiving
Fs for semester grades
Student Group2nd Semester
FY16
2nd Semester
FY17Change
Percentage of student group earning one or more failing grades
Total Students 28.35% 20.43% -7.92% Met
Special Education 43.31% 28.88% -14.43% Met
Alaska Native 50.97% 36.48% -14.49% Met
African American 38.87% 27.14% -11.73% Met
Pacific Islander 44.37% 34.74% -9.63% Met
• Decrease percentage of secondary student group earning Fs for semester grades by 5%
• Preliminary dashboard data as of 5/26/2017. Final FY17 data will be available in August, 2017
• Secondary students include 6-12 in comprehensive middle and high schools

Graduation: FY17 Action
• Stakeholder committees met regularly
◦ Worked on revision and finalization of grading
policy
◦ Worked on documenting plan as administrative
regulations (AR)
• Prepared alignment of Q Gradebook to
grading protocol

Graduation: FY18 Next Steps
• Expansion of choice:
◦ On-line
◦ Blended
◦ Dual credit/concurrent enrollment
◦ CTE opportunities
• Research trimester scheduling
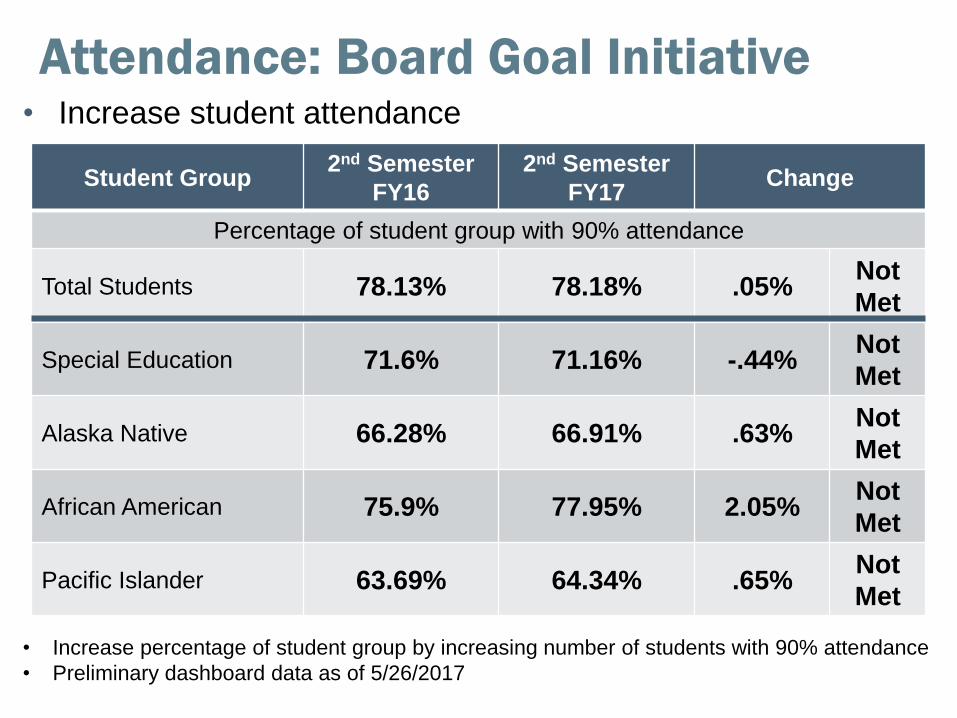
Attendance: Board Goal Initiative• Increase student attendance
Student Group2nd Semester
FY16
2nd Semester
FY17Change
Percentage of student group with 90% attendance
Total Students 78.13% 78.18% .05%Not
Met
Special Education 71.6% 71.16% -.44%Not
Met
Alaska Native 66.28% 66.91% .63%Not
Met
African American 75.9% 77.95% 2.05%Not
Met
Pacific Islander 63.69% 64.34% .65%Not
Met
• Increase percentage of student group by increasing number of students with 90% attendance
• Preliminary dashboard data as of 5/26/2017
Attendance: FY17 Action
• Attendance goals/plans created
◦ Site based
◦ Incentive
• Stakeholder committees met regularly
◦ Revised and finalized proposed changes in attendance policy
◦ Worked to document plan as administrative regulations (AR)
• Prepared alignment of Q Gradebook to attendance protocol
Attendance: FY18 Next Steps
• Integrate attendance into multi-tiered system
of support
• Standardize attendance protocol
◦ Administrative regulations
◦ e.g. Elementary will take attendance twice a
day for accuracy
• Collaborate with community groups
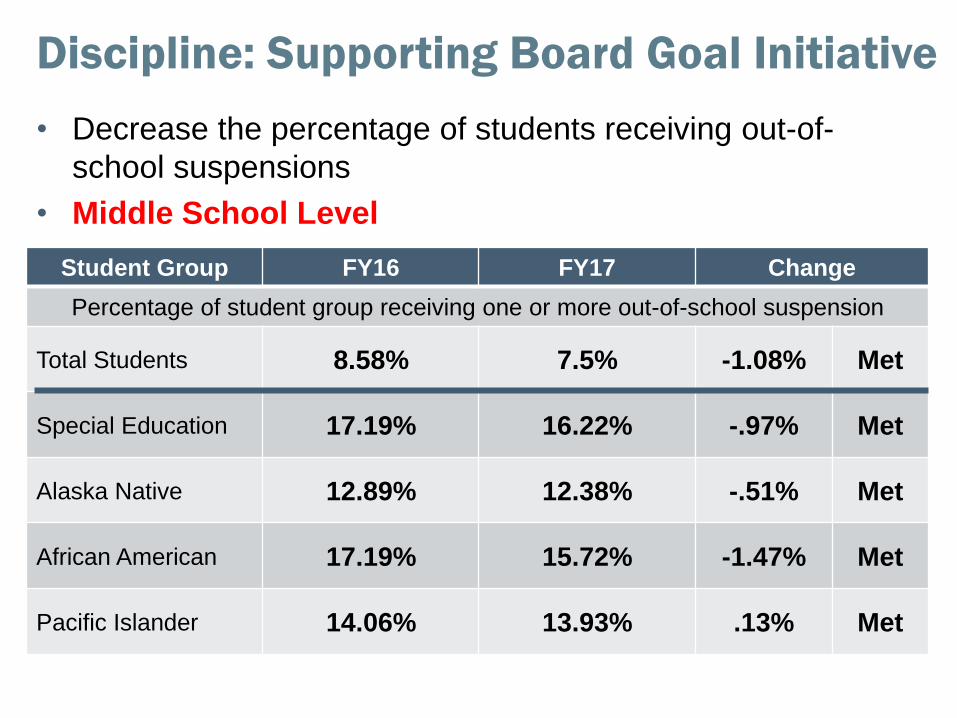
Discipline: Supporting Board Goal Initiative
• Decrease the percentage of students receiving out-of-
school suspensions
• Middle School Level
Student Group FY16 FY17 Change
Percentage of student group receiving one or more out-of-school suspension
Total Students 8.58% 7.5% -1.08% Met
Special Education 17.19% 16.22% -.97% Met
Alaska Native 12.89% 12.38% -.51% Met
African American 17.19% 15.72% -1.47% Met
Pacific Islander 14.06% 13.93% .13% Met

Discipline: Supporting Board Goal Initiative
• Decrease the percentage of students receiving out-of-
school suspensions
• High School Level
Student Group FY16 FY17 Change
Percentage of student group receiving one or more out-of-school suspension
Total Students 6.32% 5.66% -.66% Met
Special Education 14.48% 11.49% -2.99% Met
Alaska Native 7.98% 7.07% -.91% Met
African American 16.18% 14.35% -1.83% Met
Pacific Islander 15.73% 12.58% 3.15% Met
Discipline: FY17 Action• Secondary
◦ Decreased the use of “Willful Disobedience” as
an OSS option
◦ Increased the use of alternative (non-OSS)
interventions
◦ Decreased OSS in all student subgroups
◦ Increased communication between Special
Education Department and administrators to
better address student IEPs (Individual
Education Plan) and BIPs (Behavior Intervention
Plan)

Discipline: FY18 Next Steps
• Implement MTSS plan at elementary level
• Implement Foundations at secondary level
• Increase non OSS interventions
• Address needs of students with disabilities
• Decrease number of students suspended out
of school
• Monitor Capturing Kids’ Heart pilot

Moving Forward
New Year
August 2017

Servant Leadership
I. High Quality Education
II. Positive Customer Experiences
III. Transparent Accountability
I. High Quality Education
• Lowering variance and increasing standards
◦ Intentional about research
◦ Understand actions/qualities that impact
student learning
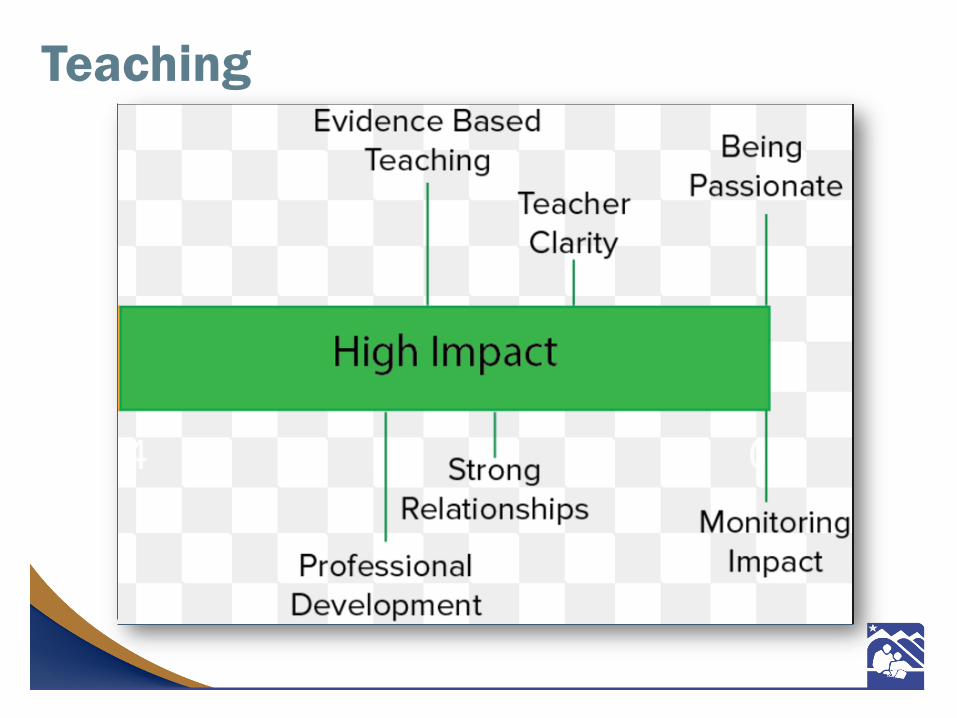
Teaching
II. Positive Customer Experiences
• Knowing our customers
• Intentionally inviting
◦ Warmth
◦ Trust
◦ Empathy
• Fostering positive relationships
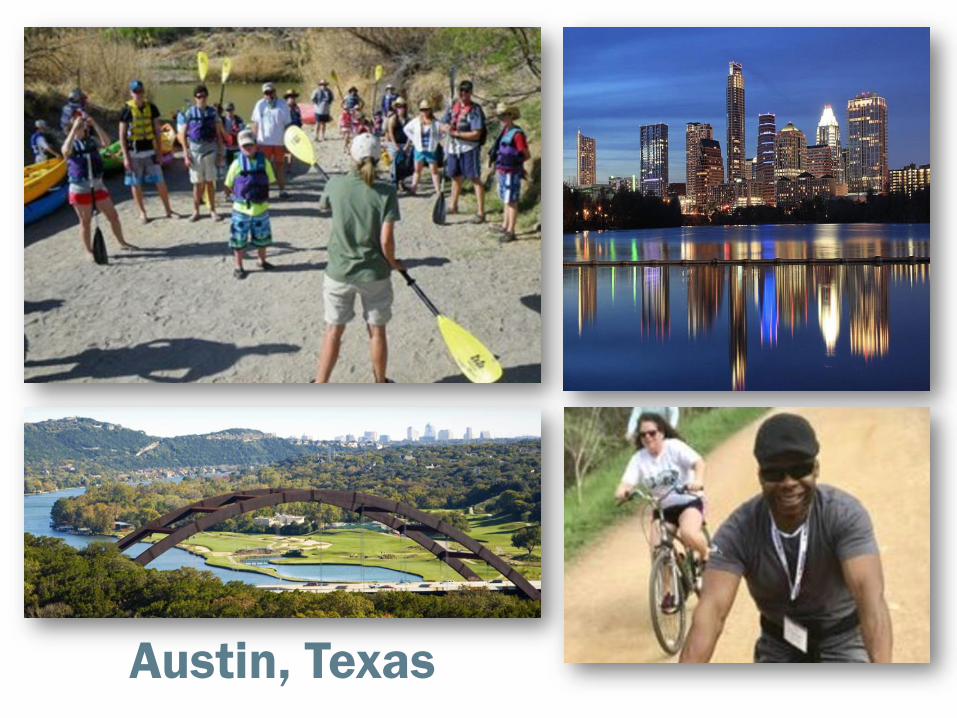
Austin, Texas

III. Transparent Accountability
• Externally and Internally
◦ Budget Process
◦ Data
Dashboard
Schedules

Servant Leadership
I. High Quality Education
II. Positive Customer Experiences
III. Transparent Accountability

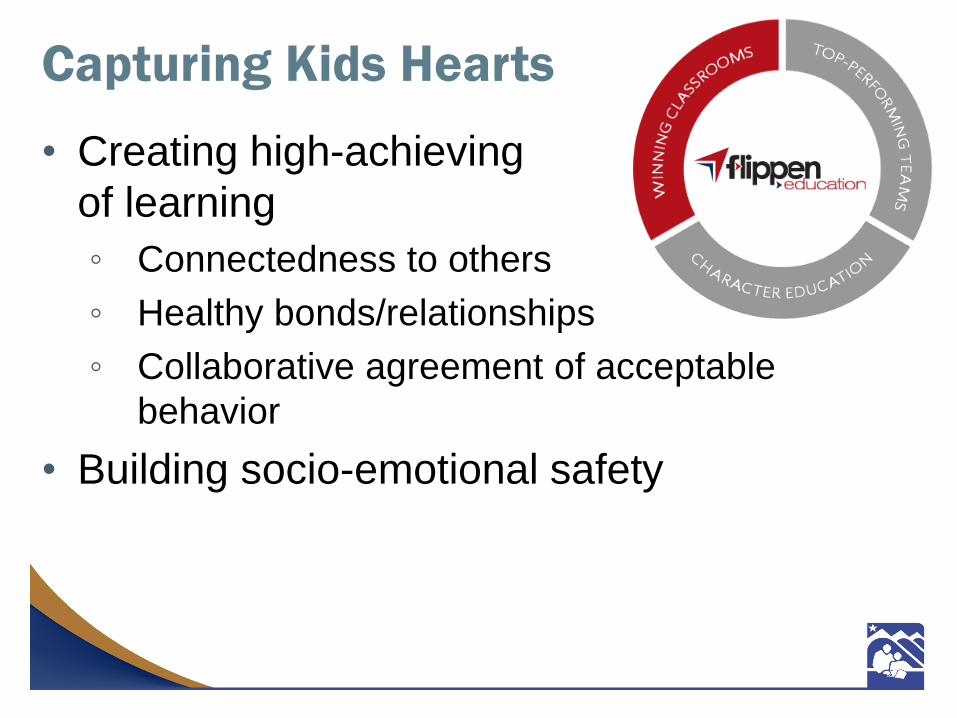
Capturing Kids Hearts
• Creating high-achieving centers
of learning
◦ Connectedness to others
◦ Healthy bonds/relationships
◦ Collaborative agreement of acceptable
behavior
• Building socio-emotional safety
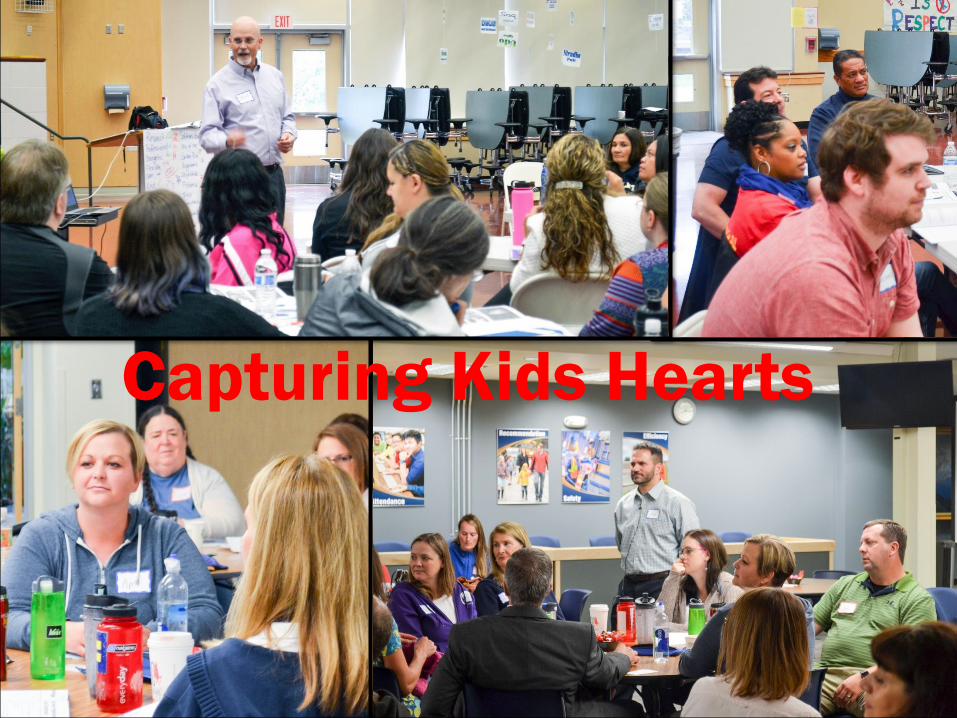
Capturing Kids Hearts

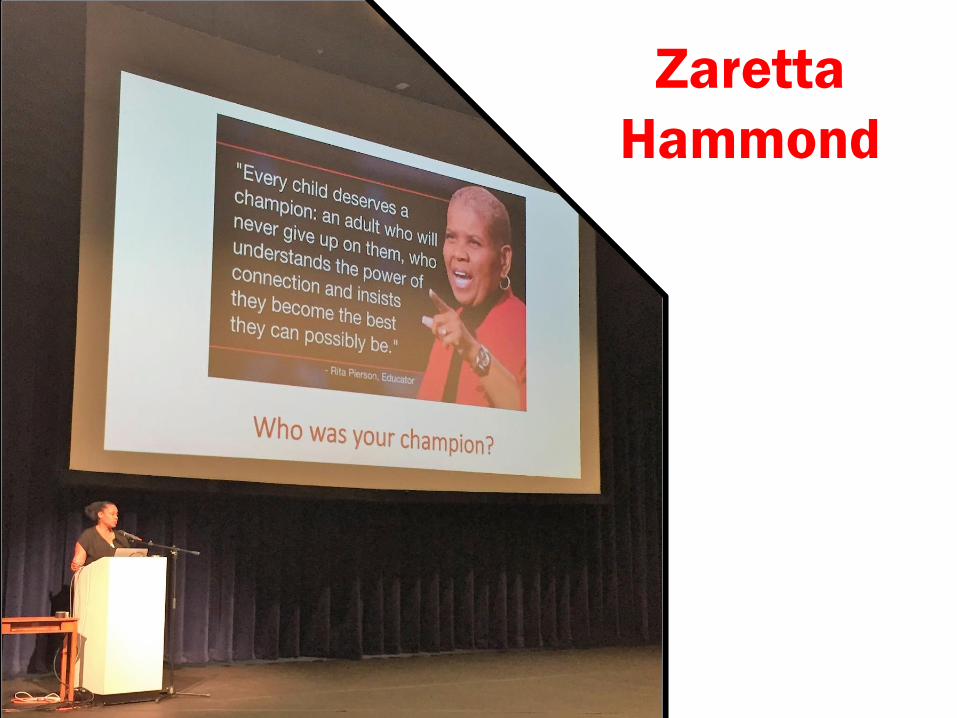
Zaretta
Hammond

SBBS Program Update
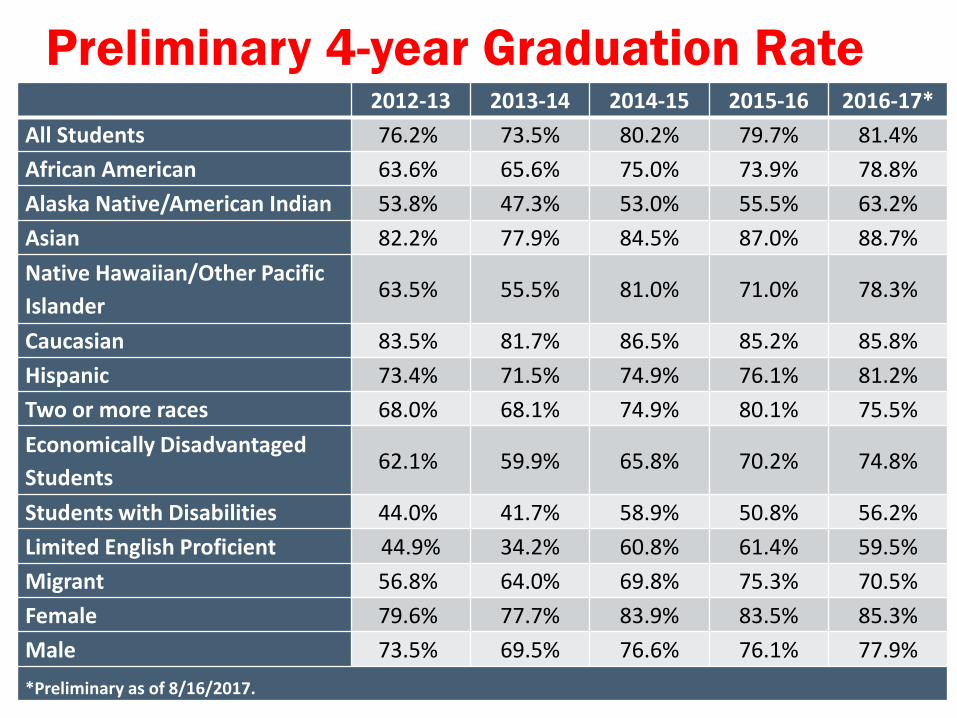
Preliminary 4-year Graduation Rate 2012-13 2013-14 2014-15 2015-16 2016-17*
All Students 76.2% 73.5% 80.2% 79.7% 81.4%
African American 63.6% 65.6% 75.0% 73.9% 78.8%
Alaska Native/American Indian 53.8% 47.3% 53.0% 55.5% 63.2%
Asian 82.2% 77.9% 84.5% 87.0% 88.7%
Native Hawaiian/Other Pacific
Islander63.5% 55.5% 81.0% 71.0% 78.3%
Caucasian 83.5% 81.7% 86.5% 85.2% 85.8%
Hispanic 73.4% 71.5% 74.9% 76.1% 81.2%
Two or more races 68.0% 68.1% 74.9% 80.1% 75.5%
Economically Disadvantaged
Students62.1% 59.9% 65.8% 70.2% 74.8%
Students with Disabilities 44.0% 41.7% 58.9% 50.8% 56.2%
Limited English Proficient 44.9% 34.2% 60.8% 61.4% 59.5%
Migrant 56.8% 64.0% 69.8% 75.3% 70.5%
Female 79.6% 77.7% 83.9% 83.5% 85.3%
Male 73.5% 69.5% 76.6% 76.1% 77.9%
*Preliminary as of 8/16/2017.

Educating All Students for Success in Life