PowerPoint Presentation - Glatfelter -16 CFBU AMBU SPBU Corporate Unallocated Pension Expense Net...
24
-
Upload
nguyencong -
Category
Documents
-
view
216 -
download
2
Transcript of PowerPoint Presentation - Glatfelter -16 CFBU AMBU SPBU Corporate Unallocated Pension Expense Net...


•
•
•
•
•
•
•
•
•
•
•
•
$0.54
$(0.06)
$0.50

$0.50
$0.54
$0.05
$0.04 $(0.12)
$0.03 $(0.01) $(0.01)$(0.02)
Q3-16 CFBU AMBU SPBU Corporate Unallocated
PensionExpense
NetInterest
Taxes, Shares& Other
Q3-17

•
•
•
•
•
•
•
•
•
•
•
•
•
•
$ in millions

•
•
•
•
•
•
•
•
•
•
•
•
$ in millions
Q3-16 Operating
Income
Selling Price
Volume& Mix
RM & Energy Costs
Operations & Other
FX Q3-17 Operating
Income

$18.7
$12.5
$(6.5)
$(0.5)$(0.8)
$1.8 $(0.1)
Q3-16 Operating
Prof it
Selling Price
Volume& Mix
RM & Energy Costs
Operations & Other
Energy-RelatedSales
Q3-17 Operating
Prof it
•
•
•
•
•
•
•
•
•
•
•
•
•
•
$ in millions

(in millions)
― ―

•
•
•
•
•
•
•
•
(in millions) Q3'16 Q3'17 YTD'16 YTD'17

•
•
•
•
•
•

•
•
•
•
•
⅜


•
•
•
•
•
•
•
•
•
•
•
•
•
•


(in millions) 2014 2015 2016 2017Est.


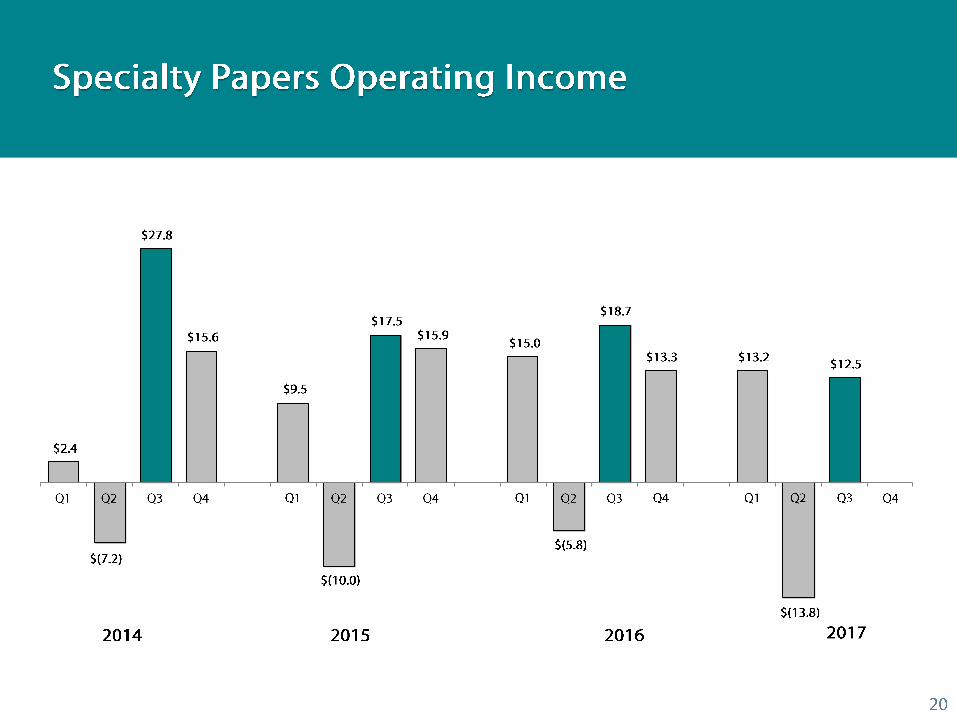

Q1 Q2 Q3 Q4 Q1 Q2 Q3 Q4 Q1 Q2 Q3 Q4 Q1 Q2 Q3 Q4
In thousands, except per share
Net income (loss)$14,648 $4,670 $30,371 $19,557 $13,925 $2,848 $13,504 $34,299 $16,167 $1,966 $19,601 ($16,180) $11,603 $ (5,714) $ 12,105 $ -
Adjustments (pre-tax)
Specialty Papers' environmental compliance - - - - - - - - 37 1,088 5,520 1,703 2,264 216 596 -
Airlaid capacity expansion costs - - - - - - - 50 56 201 1,051 1,353 1,958 2,495 2,581 -
Fox River environmental matter - - - - - - 10,000 - - - - 40,000 - - - -
Asset impairment charge - - 3,262 - - - 1,201 - - - - - - - - -
Timberland sales and related costs (812) (1,478) (1,586) (979) (2,654) (51) - (18,162) - - - - - (74) (114) -
Cost Optimization - - - 516 1,339 614 296 212 88 - - 3,446 2,013 775 6,839 -
Pension Settlement - - - - - - - - - - - 7,306 - - - -
Acquisition and integration related costs - 299 116 641 160 - 18 - - - - - - - - -
Total adjustments (pre-tax) (812) (1,179) 1,792 178 (1,155) 563 11,515 (17,900) 181 1,289 6,571 53,808 6,235 3,412 9,902 -
Income tax (benefits) provision 305 307 (1,357) (10) 604 (1,567) (4,212) 6,503 (56) (487) (2,193) (19,983) (682) (317) (123) -
Total after-tax adjustments (507) (872) 435 168 (551) (1,004) 7,303 (11,397) 125 802 4,378 33,825 5,553 3,095 9,779 -
Adjusted earnings $14,141 $3,798 $30,806 $19,725 $13,374 $1,844 $20,807 $22,902 $16,292 $2,768 $23,979 $17,645 $17,156 $ (2,619) $ 21,884 $ -
Adjusted EPS $0.32 $0.09 $0.70 $0.45 $0.30 $0.04 $0.47 $0.52 $0.37 $0.06 $0.54 $0.40 $0.39 $ (0.06) $ 0.50 $ -
Diluted - QTD 44,360 44,136 43,841 43,943 43,949 44,032 43,865 43,878 43,871 44,062 44,133 44,223 44,493 43,604 44,182 -
2015 20162014 2017