PowerPoint ® Lecture prepared by Gary A. Beluzo WATER RESOURCES 18.
Upload
celeste-ridenCategory
view
218download
3
PowerPoint® Lecture prepared by Gary A. Beluzo
A REDUCTION IN ATMOSPHERIC OZONE Let the Sunshine In
14

Copyright © 2007 McGraw-Hill Publishing Company
STUDENT LEARNING OUTCOMES
• Explain why temperature rises or falls with altitude in different layers of the atmosphere.
• Compare and contrast three hypotheses for the depletion of stratospheric ozone and how the scientific method was used to choose among them.
• Compare and contrast the depletion of stratospheric ozone above the northern and southern poles.
• Describe how a reduction in stratospheric ozone affects organisms that live in either marine or terrestrial ecosystems.
• Describe the role of scientific information in the process that culminated in agreements to end the production of CFCs
After reading this chapter, students will be able to
Copyright © 2007 McGraw-Hill Publishing Company
An Environmental Success Story
• Spring 1986 scientists announced the atmosphere above South Pole had 40% less ozone (O3)
• But in 1974, Rowland and Molina hypothesized that CFCs could destroy the ozone layer
• Environmentalists argued that life could be wiped out
• Industry responded that CFCs were critical to modern life
• Need for cooperation among consumers, industry, government

Copyright © 2007 McGraw-Hill Publishing Company
The Atmosphere
• The atmosphere provides many environmental services
• Nitrogen (N2) 78%
• Oxygen (O2) 21%
• Trace Gases (mostly Ar) 1%
• CO2 is about 0.038% or 380 ppm and now increasing 2.2 ppm/year
CO2 has increased 20% since 1959 whereas oxygen has varied less than 0.03% over the last 50 years

Copyright © 2007 McGraw-Hill Publishing Company
Layers of the Atmosphere• Troposphere (extends up
to altitude of 8 km in polar and 15 km in tropics
• Lapse rate (-6.5º C/km)
• Tropopause keeps water vapor in the troposphere
• Stratosphere (20-50 km)
• Mesosphere (50-100 km)
• Thermosphere
Figure 14.1

Copyright © 2007 McGraw-Hill Publishing Company
Stratospheric Ozone• 90% of ozone (O3) is in the stratosphere
• Solar energy powers the formation of ozone
• The amount of single atom oxygen (O) determines rate at which ozone is formed.
O2 + hv O + O (14.1)
O + O2 O3 (14.2)
O3 + hv O + O2 (14.3)

Copyright © 2007 McGraw-Hill Publishing Company
Ozone Formation

Copyright © 2007 McGraw-Hill Publishing Company
Distribution of Ozone
• Ozone is measured in dobson units (DU)
• 100 DU would be a “pile” 1mm thick at sea level and 0 degrees C.
• There are about 300 DU of ozone, which is equivalent to a pile of molecules 3 mm thick.
• Most ozone is formed near the equator
• Distributed throughout stratosphere by global air circulation
• The result is greatest concentration at mid latitudes, especially in northern hemisphere

Copyright © 2007 McGraw-Hill Publishing Company
Reduction in Stratospheric Ozone
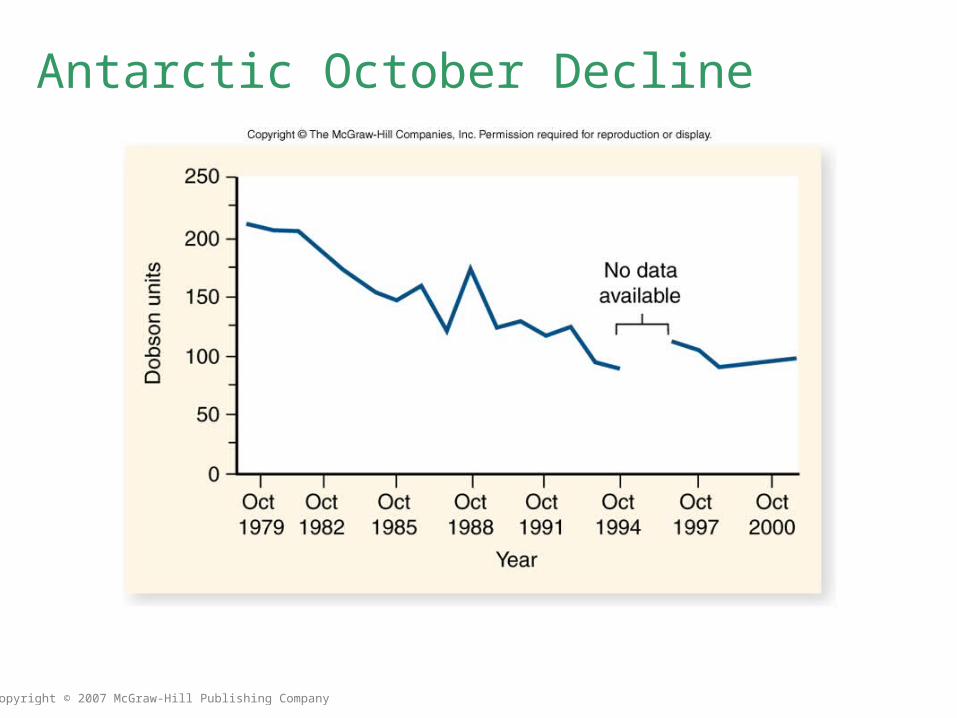
• Satellites since 1979 have measured a annual decline of about 0.41 % in the entire atmosphere
Copyright © 2007 McGraw-Hill Publishing Company
Antarctic October Decline

Copyright © 2007 McGraw-Hill Publishing Company
An Expanded Area of Decline
Figure 14.6

Copyright © 2007 McGraw-Hill Publishing Company
The Halogen Depletion Hypothesis• 1974 paper in Nature in which Rowland and Molina
hypothesized that ozone could be reduced by chlorofluorocarbons (CFC’s)
CFCl3 + hv Cl + CFCl2 (14.4)
Cl + O3 ClO + O2 (14.5)
O + ClO Cl + O2 (14.6)
O + O3 O2 + O2 (14.7)

Copyright © 2007 McGraw-Hill Publishing Company

Copyright © 2007 McGraw-Hill Publishing Company
The “Odd Nitrogen” Hypothesis
• Variation in solar activity
• “Odd Nitrogen” N2O5, NO3, etc
• Trapped by polar vortex
• NO and NO2 destroy ozone

Copyright © 2007 McGraw-Hill Publishing Company
“Dynamic Uplift” Hypothesis
• Changes in atmospheric circulation after 1979
• Upward movements of air dilutes ozone

Copyright © 2007 McGraw-Hill Publishing Company
Which is Correct?
• Scientists tested each hypothesis
• Fly plane into and out of reduced ozone area
• No increased levels of “Odd Nitrogen”
• Nitrous oxide levels low
• Relationship between ozone and ClO was striking
Figure 14.10

Copyright © 2007 McGraw-Hill Publishing Company
Effects of Less Stratospheric O3

Copyright © 2007 McGraw-Hill Publishing Company
Global Decline in Amphibians

Copyright © 2007 McGraw-Hill Publishing Company
Policies to Restore Ozone Layer
• Political Response is Environmental Success
• If halogen depletion correct: CFCs had to be banned
• If halogen depletion was false: banning CFCs would impair the global economy
• Economic and environmental threat created deadlock
• NASA and WMO published “blue books” in 1986
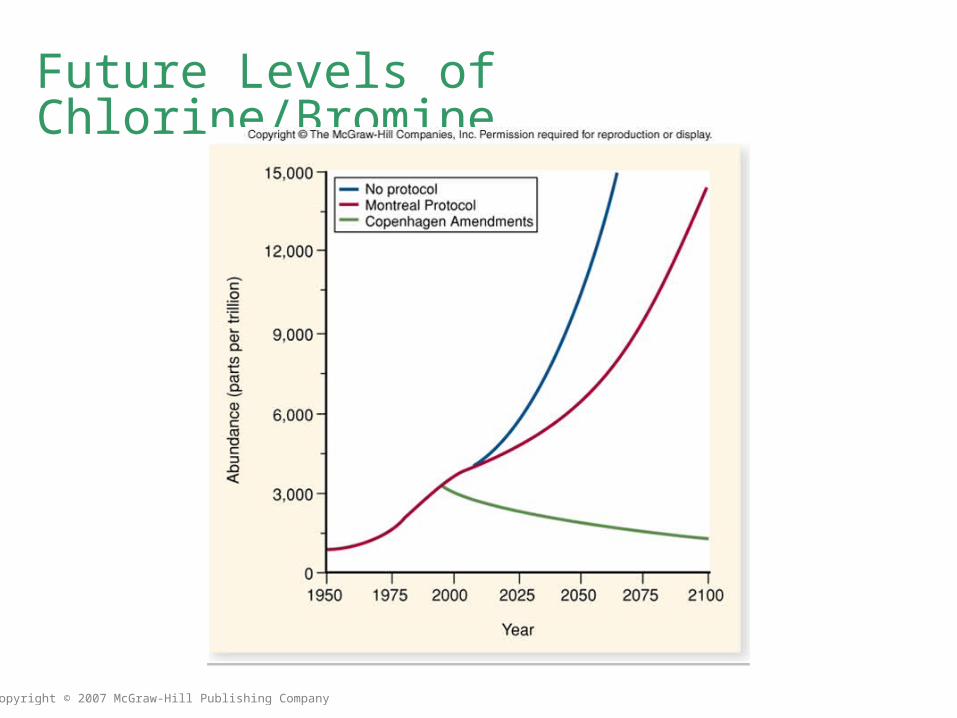
• Montreal Protocol in 1987
• 50% reduction turned out to be ideal
Copyright © 2007 McGraw-Hill Publishing Company
Future Levels of Chlorine/Bromine
Figure 14.14

Copyright © 2007 McGraw-Hill Publishing Company
Declining Concentrations


![Regional Report on Ozone Observation Ozone Observation [ RA-II: Asia ] Regional Report on Ozone Observation Ozone Observation [ RA-II: Asia ] Hidehiko.](https://static.fdocuments.net/doc/165x107/56649f115503460f94c23df0/regional-report-on-ozone-observation-ozone-observation-ra-ii-asia-regional.jpg)