
POWERING TODAY. EMPOWERING TOMORROW./media/Files/N/NEE-IR/...2017-10-09FINANCIAL HIGHLIGHTS Years...
118
POWERING TODAY. EMPOWERING TOMORROW. FPL GROUP 2005 ANNUAL REPORT
Transcript of POWERING TODAY. EMPOWERING TOMORROW./media/Files/N/NEE-IR/...2017-10-09FINANCIAL HIGHLIGHTS Years...

POWERING TODAY.EMPOWERING TOMORROW.
F P L G R O U P 2 0 0 5 A N N U A L R E P O R T

FINANCIAL HIGHLIGHTSYears Ended December 31, 2005 2004 % change
FINANCIAL RESULTS(millions, except per share amounts)Net IncomeAdjustments, net of income taxes $ 885 $ 887 (0.2)
Net unrealized mark-to-market losses associated with non-qualifying hedges – FPL Energy 112 3
Adjusted Earnings $ 997 $ 890 12.0Earnings Per Share (assuming dilution) $ 2.29 $ 2.45 (6.5)Adjustments:
Net unrealized mark-to-market losses associated with non-qualifying hedges – FPL Energy 0.29 0.01
Adjusted Earnings Per Share $ 2.58 $ 2.46 4.9Operating Revenues $ 11,846 $ 10,522 12.6Operating Income $ 1,464 $ 1,472 (0.5)Cash Flows from Operating Activities $ 1,547 $ 2,650 (41.6)Total Assets $ 33,004 $ 28,333 16.5
COMMON STOCK DATAWeighted-Average Shares Outstanding
(assuming dilution – millions) 386 362 6.6Dividends Per Share $ 1.42 $ 1.30 9.2Book Value Per Share $ 22.11 $ 20.83 6.1Market Price Per Share (high – low) $ 48.11 - $35.90 $ 38.05 - $30.10
OPERATING DATAUtility Energy Sales (kwh – millions) 105,648 103,635 1.9FPL Customer Accounts (year end – thousands) 4,356 4,257 2.3Employees (year end) 12,391 12,087 2.5
PROFILE – FPL Group, Inc. is one of the nation’s largest providers of electricity-related
services and is nationally known as a high-quality, efficient and customer-driven organization.
Its principal subsidiary, Florida Power & Light Company, serves more than eight million
people along the eastern seaboard and southern portion of Florida. FPL Energy, LLC, FPL
Group’s competitive energy subsidiary, is a leader in producing electricity from clean and
renewable fuels. Together, FPL’s and FPL Energy’s generating assets represent nearly 33,000
megawatts of capacity. FPL FiberNet, LLC, provides fiber-optic services to FPL and other
customers, primarily telecommunications companies in Florida.
SAFE HARBOR STATEMENT Any statements made herein aboutfuture operating results or otherfuture events are forward-lookingstatements under the Safe HarborProvisions of the Private SecuritiesLitigation Reform Act of 1995. Actualresults may differ substantially fromsuch forward-looking statements. Adiscussion of factors that could causeactual results or events to vary is contained in Item 1A-Risk Factorsin the enclosed Form 10-K.
1 — FPL GROUP 2005 ANNUAL REPORT

2005 was another extraordinary year for FPL Group. Inlast year’s letter, I told you that 2005 would be definedby several major challenges and areas of focus for each ofour businesses. • For Florida Power & Light Company, our regulated
electric company subsidiary, we would need to recoverour prudently incurred 2004 storm restoration costs,establish a new base rate structure to be approved bythe Florida Public Service Commission (PSC) beforethe end of the year, and meet continued growth indemand for electric service in Florida.
• For FPL Energy, our competitive energy subsidiary,our plan was to expand our U.S. market leading windportfolio, continue to extract maximum value fromour existing portfolio through a focus on operationalexcellence, manage a capacity uprate at our Seabrooknuclear power plant in New Hampshire and continueto upgrade our portfolio of assets.
I’m pleased to report that we were successful in meetingthese challenges – and then some. Most notably:• The PSC granted us permission to recover prudently
incurred storm costs through a small temporarymonthly surcharge on customer bills that began in February 2005.
• We negotiated and the PSC approved a new base rateagreement that provides for rate certainty at leastthrough the end of 2009 and allows us to recoverinvestment in new power plants. It also allows us torecover our prudently incurred storm restoration costseither through a surcharge on customers’ bills or
through the sale of bonds known as securitization.We believe this outcome fairly balances the interestsof both our customers and our shareholders.
• Few people expected another storm season in Florida in2005 like the one we experienced in 2004 - the year weprepared for and restored service after three powerfulhurricanes that impacted more than 5.4 million FPLcustomers. But in many ways, 2005 proved every bitthe match. We mobilized forces to restore service afterfour storms - Hurricanes Dennis, Katrina, Rita, andWilma - resulting in approximately 5.3 million FPLcustomer outages and $906 million in restoration costs.Wilma caused the greatest number of power outages inFPL’s 80-plus year history - 3.2 million - and all toldwas our most challenging restoration effort ever. Inmany ways, 2005 was a watershed year for us on thestorm front, especially from an operational standpoint.We made some key enhancements to our stormrestoration processes after the 2004 season, and we aremaking substantial infrastructure changes after the 2005season. An independent international engineeringconsultant’s review of our power delivery systems confirmed that our network meets or exceeds currentstandards and that it performed as expected underhurricane conditions. However, it is now clear thatFlorida is in the midst of a cycle of increased hurricaneactivity, and we must bolster our system. We recentlyannounced a five-point, 10-year plan we call StormSecuresm that includes rapid completion of post-hurricanerepairs and upgrades prior to the 2006 hurricane season,upgrades to our system to withstand higher wind velocity,
To Our Shareholders
FPL GROUP 2005 ANNUAL REPORT — 2
Lewis Hay, IIIChairman, President and Chief Executive Officer

converting more overhead lines to underground, revisingour pole inspection processes, and increasing line clearingand vegetation management, particularly around criticalinfrastructure. We expect these actions will make ournetwork much more resilient to hurricanes. Unfortunately,this will take a lot of time and a significant investmentof capital to complete. And, regardless of what we do,no system will ever be totally hurricane-proof.
• FPL Energy, our competitive energy business, hadanother year of strong performance, recording a 71 percent*increase in adjusted earnings over the prior year. Overthe past five years, FPL Energy has grown adjustedearnings at an average annual rate of 29 percent*.
• Additionally, in December, we announced our proposedmerger with Constellation Energy which, if approved,is expected to create the nation’s leading competitiveenergy business and second largest regulated electricutility business. I’m very excited about this transaction.By successfully integrating our complementary businesses,we will cost effectively build scale and scope immediatelyto establish ourselves as the premier competitive energybusiness in America. From a financial standpoint, weexpect the transaction to be immediately accretive toearnings, preserve balance sheet strength, and providea solid foundation of risk-adjusted cash flows. As we seeit today, the future earnings power of the combinedcompany should be among the best in the industry.Following receipt of the necessary regulatory andshareholder approvals, we expect to complete themerger by the end of this year.
We’re pleased that, in 2005, the U.S. Congress passedand the President signed an energy bill, the first majorreform of energy policy in decades. The legislationincludes a number of provisions that are favorable to ourcompany, including a wind energy production tax credit, ameasure providing greater flexibility to restructure powercontracts at certain of our facilities and a section eliminatingarchaic ownership restrictions on utilities. This last provisionwas instrumental in allowing for our decision to mergewith Constellation.
FPL Group continues to perform extraordinarily wellFPL Group performed admirably again in 2005, and ourresults speak for themselves:• FPL Group provided a 15.1 percent total shareholder
return for the year, which enabled us to continue tooutperform the S&P 500 over the last one-, three-,five- and ten-year periods.
• Net income reached $885 million, or $2.29 per sharein 2005, compared with $887 million or $2.45 pershare in 2004.
• FPL Group’s adjusted earnings, which excludes thenet unrealized mark-to-market effect associated withnon-qualifying hedges, were $997 million or $2.58per share in 2005, compared with $890 million or$2.46 per share in 2004. (See page 1 for reconciliationof net income to adjusted earnings and earnings pershare to adjusted earnings per share.)
• On February 17, 2006, the board of directors againincreased the quarterly common stock dividend, thistime by two cents per share, or 5.6 percent.
BUSINESS REVIEW AND 2005 PERFORMANCE
Florida Power & Light Beyond meeting the extraordinary challenges I outlinedearlier in this letter, Florida Power & Light achieved avariety of important results and met a number of keymilestones last year.• FPL is one of the country’s largest and fastest growing
electric utilities with nearly 4.4 million customeraccounts. In 2005, the average number of FPL customeraccounts increased by 97,000 or 2.3 percent, consis-tent with the growth that we have witnessed over thelast three years.
• We continued the outstanding operational performancethat places FPL among the best utilities in the electricindustry. The amount of time our fossil power plants
3 — FPL GROUP 2005 ANNUAL REPORT
*FPL Energy-Reconciliation of GAAP to Adjusted Earnings(millions) 2000 2001 2002 2003 2004 2005Net Income (Loss) $ 82 $ 113 $ (169) $ 194 $ 172 $ 187Adjustments, net of income taxes:
Merger-related expenses 1Cumulative effect of change in accounting principle (FAS 142) 222Restructuring and other charges 73Cumulative effect of change in accounting principle (FIN 46) 3Net unrealized mark-to-market losses (gains) associated
with non-qualifying hedges (8) (22) 3 112Adjusted Earnings $ 83 $ 105 $ 126 $ 175 $ 175 $ 299
NOTE: For reconciliations of FPL Energy’s net income to FPL Group’s consolidated net income, see note 17 to FPL Group’s consolidated financial statements included herein in FPL Group’s 2005 Annual Report on Form 10-K and note 18 to FPL Group’s consolidated financial statements in FPL Group’s 2002 Annual Report on Form 10-K.

are available to generate electricity is among the highestin the nation, and the reliability of our power deliverysystem is also among the very best.
• We continue to invest heavily in this business to meetgrowth and to maintain system reliability. Last year,we reinvested approximately $1.7 billion in FPL. Ofnote, in June 2005, we added about 1,900 megawattsof gas-fired generation through expansions at ourMartin and Manatee sites. Both of these facilitiescame into service on time and under budget.
• FPL also was challenged in 2005 by conditions in thefuels markets. Dramatically higher prices for naturalgas and oil affected the total cost of fuel we needed togenerate electricity in 2005 and will have a continu-ing effect in future years. FPL finished the year havingspent just over $1 billion more for fuel than anticipated,and this figure would have been some $600 millionhigher had it not been for the beneficial impact of ourfuel hedging program. Approximately three-quartersof this underrecovery has been built into the 2006fuel factor approved by the PSC, and the balance isexpected to be recovered in 2007. In addition, the2006 fuel charge to customers reflects higher costs for2006, causing the typical residential customer bill toincrease by 19 percent, while commercial and industrialcustomers’ bills went up by 30 to 40 percent. Evenwith these increases, FPL’s total bills are still wellbelow the charges for equivalent usage in many otherparts of the country.
FPL EnergyFPL Energy, a leading clean energy provider with naturalgas, wind, solar, hydroelectric and nuclear power plantsin operation in 24 states, had a great year in 2005. • Business results were positively impacted by new projects
added during the year, a strong operating performanceacross the portfolio, improved market conditions,especially in Texas and New England, the ongoingbenefits of previous contract restructurings and assetoptimization and marketing activities.
• We added just over 500 megawatts to our U.S. market-leading wind energy portfolio. By year-end, we had a 35 percent share of the U.S. market with 3,192megawatts of clean wind energy, well outpacing ournearest competitor.
• We also added 52 megawatts in the first phase of ourtwo-phased uprate plan at the Seabrook nuclear plantin New Hampshire. The total uprate is anticipated toincrease Seabrook’s net plant output to 1,106 megawatts.
• Further, we continued to add value and reduce risk byactively hedging our wholesale energy portfolio. At
year-end 2005, more than 90 percent of our expected2006 gross margin and more than 80 percent of ourexpected 2007 gross margin was hedged.
• In early 2006, we completed the acquisition of a 70percent interest in the Duane Arnold Energy Centerin Iowa, adding approximately 415 megawatts ofnuclear power to our portfolio.
• Importantly, the underlying earnings power of FPLEnergy remains strong. We expect adjusted earningsper share growth to continue at a 20 to 30 percentannual pace through 2007, assuming normal weatherand excluding the effect of adopting new accountingstandards and the mark-to-market effect of non-qualifying hedges, neither of which can be determinedat this time.
2006 AND BEYONDGoing forward, we have high expectations, sound strate-gies and strong tangible growth prospects.
From a corporate perspective we have three key prior-ities for 2006. • First, we are focused intensely on achieving our 2006
business objectives, which will culminate in anticipatedadjusted earnings per share growth for FPL Group ofapproximately 9 to 12 percent, translating into adjustedearnings per share in the range of $2.80 - $2.90. Thisincludes contributions from FPL of $2.05 to $2.10and from FPL Energy of $0.90 to $1.00, as well as anexpected negative impact from Corporate & Other of$0.15 to $0.20, largely due to interest expense. Theseranges are on an FPL Group stand-alone basis, assumenormal weather and exclude the effect of adopting newaccounting standards and the mark-to-market effect ofnon-qualifying hedges, neither of which can be deter-mined at this time. We expect to benefit from contin-ued growth in customer accounts at FPL, ongoing pro-ductivity improvements at both FPL and FPL Energy,the full-year contributions of new wind generationadded in 2005, the partial-year contributions from thecontinued buildout of FPL Energy’s portfolio in 2006,the addition of the Duane Arnold nuclear facility, andongoing asset optimization and risk management activitiesat FPL Energy.
• Second, we are committed to completing the mergerwith Constellation as soon as reasonably possible.
• And third, we will prepare and begin implementingintegration plans for “day one” operations of the combinedcompany and to achieve the anticipated synergies in“year one.”
FPL GROUP 2005 ANNUAL REPORT — 4

In support of the first priority, we have a busy yearunderway: • At Florida Power & Light, we’ll complete the analysis
of the infrastructure and begin to implement ourStorm Secure plan to further strengthen our system inorder to minimize disruptions from hurricanes. Weexpect to complete the process for recovering prior-year storm costs and are proposing the rebuilding of a reserve of $650 million for future hurricanes. Toensure reliable electric service and to continue expandingour system to meet the growth in demand for electricpower in our service territory, we’ll continue construc-tion on the new natural gas-fired power plant at ourexisting Turkey Point location south of Miami, andwe’ll continue development plans for a natural gas-fired plant in western Palm Beach County. As wemake these and other future additions to our genera-tion portfolio, we’ll remain mindful of the need tomitigate fuel prices, be sensitive to our environmentand further diversify our fuel mix. On that last point,we’ll continue laying the groundwork necessary tohopefully bring lower-cost advanced technology coaland more nuclear power units into our Florida portfolioin coming years.
• At FPL Energy, we’ll further expand our wind portfolio.Our wind development pipeline is in excellent shape,with more than 700 megawatts of projects board-approved or already under construction. We’ll continueto optimize our portfolio, seeking new assets as appropriateor divesting those that no longer fit into our portfolio.And we expect to benefit from the Duane Arnold nuclearplant acquisition I mentioned earlier.
I would like to personally thank Jesse Arnelle andFrank Zarb for their service as directors of FPL Group.They will be retiring from the board immediately priorto the 2006 annual meeting of shareholders. Jesse hasbeen a director since 1990 and Frank since 2002. Eachhas made important contributions to our company. I’vegreatly appreciated their wise and candid counsel.
Rudy Schupp, Hansel Tookes and Brian Fergusonjoined our board in 2005. Each has valuable expertisethat will serve us well in our changing industry.
As always, I thank our employees for their outstandingefforts in providing safe and reliable power to our customersand for their concern for the environment and for thecommunities of which we are a part. I particularly want tothank them for the extraordinary hard work, dedication andpersonal sacrifices they have made to restore power to ourcustomers following the seven hurricanes we experiencedover the past two years. I firmly believe that no company
could have done a better job than that done by these fine menand women. This past year, their efforts were recognized byseveral organizations: • The Edison Electric Institute, the major trade association
in the electric power industry, presented us with threeawards, one each for our hurricane work in Florida andassisting utilities on the Gulf Coast, and one for ourRight Tree Right Place public education campaign.
• For the fourth straight time, FPL Group received aNo. 1 ranking for environmental performance among23 electric utilities from Innovest, an internationallyrecognized research firm. The Innovest analysis indicatesthat companies that take positive and proactive meas-ures to address environmental, social and governancefactors are likely to outperform peers in stock priceperformance.
• In January 2006, FPL Group for the second year in arow was named one of the Global 100 Most SustainableCorporations in the World by Corporate Knights Inc.,a Canadian media company. Chosen from a universeof 1,800 publicly-traded companies, FPL Group wascited for the honor after having among “the bestdeveloped abilities, relative to their industry peers, tomanage the environmental, social and governancerisks and opportunities they face.”
• In March 2006, FORTUNE magazine ranked FPL Groupsecond among electric and gas utilities in the magazine'sannual survey of America's most admired companies.The top companies in their respective industries wererated on eight key attributes: innovation, quality ofmanagement, employee talents, quality of service, long-term investment value, financial soundness, socialresponsibility and use of corporate assets.
I also want to thank the several hundred utilities andcontractors and their thousands of restoration personnelfrom 39 states and Canada that helped our powerrestoration efforts over the past two years. Their assistanceand the support of their family members were invaluable.
As always, I appreciate the support of you, our share-holders, as we continue our ongoing pursuit of increasingshareholder value.
Lewis Hay, IIIChairman, President and Chief Executive Officer
March 31, 2006
NOTE: FPL Group, Inc. intends to file an amendment to its 2005 Annual Report on Form 10-K, a copy of which follows, on or before April 30, 2006 in order to include the Form 10-K Part III information previously intended to be incorporated by reference from the FPL Group, Inc. Proxy Statement for the 2006 Annual Meeting of Shareholders.
5 — FPL GROUP 2005 ANNUAL REPORT
UNITED STATES SECURITIES AND EXCHANGE COMMISSION
Washington, D.C. 20549
FORM 10-K[X] ANNUAL REPORT PURSUANT TO SECTION 13 OR 15(d)
OF THE SECURITIES EXCHANGE ACT OF 1934
For the fiscal year ended December 31, 2005OR
[ ] TRANSITION REPORT PURSUANT TO SECTION 13 OR 15(d)OF THE SECURITIES EXCHANGE ACT OF 1934
CommissionFile
Number
Exact name of registrants as specified in theircharters, address of principal executive offices and
registrants’ telephone number
IRS EmployerIdentification
Number
1-8841
2-27612
FPL GROUP, INC.FLORIDA POWER & LIGHT COMPANY
700 Universe BoulevardJuno Beach, Florida 33408
(561) 694-4000
59-2449419
59-0247775
State or other jurisdiction of incorporation or organization: FloridaName of exchangeon which registered
Securities registered pursuant to Section 12(b) of the Act: FPL Group, Inc.: Common Stock, $0.01 Par Value and Preferred Share Purchase Rights New York Stock Exchange
Florida Power & Light Company: None
Securities registered pursuant to Section 12(g) of the Act: None
Indicate by check mark if the registrants are well-known seasoned issuers, as defined in Rule 405 of the Securities Act of 1933. FPL Group, Inc. Yes __X__ No ____ Florida Power & Light Company Yes ____ No __X__
Indicate by check mark if the registrants are not required to file reports pursuant to Section 13 or Section 15(d) of the Securities Exchange Act of 1934.FPL Group, Inc. Yes ____ No __X__ Florida Power & Light Company Yes __X__ No ____
Indicate by check mark whether the registrants (1) have filed all reports required to be filed by Section 13 or 15(d) of the Securities Exchange Act of 1934 during thepreceding 12 months and (2) have been subject to such filing requirements for the past 90 days FPL Group, Inc. Yes __X__ No ____ Florida Power & Light Company Yes ____ No __X__
Indicate by check mark if disclosure of delinquent filers pursuant to Item 405 of Regulation S-K is not contained herein, and will not be contained, to the best ofregistrants’ knowledge, in definitive proxy or information statements incorporated by reference in Part III of this Form 10-K or any amendment to this Form 10-K. [ ]
Indicate by check mark whether the registrants are a large accelerated filer, an accelerated filer, or a non-accelerated filer. See definition of "large acceleratedfiler and accelerated filer" in Rule 12b-2 of the Securities Exchange Act of 1934.
FPL Group, Inc. Large Accelerated Filer __X__ Accelerated Filer ____ Non-Accelerated Filer ____Florida Power & Light Company Large Accelerated Filer ____ Accelerated Filer ____ Non-Accelerated Filer __X__
Indicate by check mark whether the registrants are shell companies (as defined in Rule 12b-2 of the Securities Exchange Act of 1934). Yes ____ No X
Aggregate market value of the voting and non-voting common equity of FPL Group, Inc. held by non-affiliates as of June 30, 2005 (based on the closing market priceon the Composite Tape on June 30, 2005) was $16,536,560,740.
There was no voting or non-voting common equity of Florida Power & Light Company held by non-affiliates as of June 30, 2005.
The number of shares outstanding of FPL Group, Inc. common stock, as of the latest practicable date: Common Stock, $0.01 par value, outstanding at January 31,2006: 394,857,526 shares.
As of January 31, 2006, there were issued and outstanding 1,000 shares of Florida Power & Light Company common stock, without par value, all of which wereheld, beneficially and of record, by FPL Group, Inc.
DOCUMENTS INCORPORATED BY REFERENCEPortions of FPL Group, Inc.’s Proxy Statement for the 2006 Annual Meeting of Shareholders are incorporated by reference in Part III hereof.
________________________________________
This combined Form 10-K represents separate filings by FPL Group, Inc. and Florida Power & Light Company. Information contained herein relating to an individualregistrant is filed by that registrant on its own behalf. Florida Power & Light Company makes no representations as to the information relating to FPL Group, Inc.’sother operations.
Florida Power & Light Company meets the conditions set forth under General Instruction (I)(1)(a) and (b) of Form 10-K and is therefore filing this form with reduceddisclosure format.

2
DEFINITIONS
Acronyms and defined terms used in the text include the following:
Term MeaningAFUDC allowance for funds used during constructionBART Best Available Retrofit Technologycapacity clause capacity cost recovery clause, as established by the FPSCcharter restated articles of incorporation, as amended, of FPL Group or FPL, as the case may beConstellation Energy Constellation Energy Group, Inc.CRDM control rod drive mechanismDOE U.S. Department of EnergyDuane Arnold Duane Arnold Energy CenterEMF electric and magnetic fieldsEMT Energy Marketing & Trading2005 Energy Act Energy Policy Act of 2005environmental clause environmental compliance cost recovery clause, as established by the FPSCERCOT Electric Reliability Council of TexasEPA U.S. Environmental Protection AgencyFAS Statement of Financial Accounting Standards No.FASB Financial Accounting Standards BoardFDEP Florida Department of Environmental ProtectionFERC Federal Energy Regulatory CommissionFGT Florida Gas Transmission CompanyFIN FASB Interpretation No.FMPA Florida Municipal Power AgencyFPL Florida Power & Light CompanyFPL Energy FPL Energy, LLCFPL FiberNet FPL FiberNet, LLCFPL Group FPL Group, Inc.FPL Group Capital FPL Group Capital IncFPSC Florida Public Service Commissionfuel clause fuel and purchased power cost recovery clause, as established by the FPSCGexa Gexa Energy, LPGridFlorida GridFlorida LLCGulfstream Gulfstream Natural Gas System, L.L.C.Holding Company Act Holding Company Act of 2005IARC International Agency for Research on CancerIRS Internal Revenue ServiceISO independent system operatorkv kilovoltkwh kilowatt-hourLIBOR London InterBank Offered RateManagement’s Discussion Item 7. Management’s Discussion and Analysis of Financial Condition and Results of OperationsMAPP Mid-Continent Area Power Poolmortgage mortgage and deed of trust dated as of January 1, 1944, from FPL to Deutsche Bank Trust Company
Americas, as supplemented and amendedmw megawatt(s)NEPOOL New England Power PoolNERC North American Electric Reliability CouncilNote ___ note ___ to consolidated financial statementsNRC U.S. Nuclear Regulatory CommissionNuclear Waste Policy Act Nuclear Waste Policy Act of 1982NYPP New York Power PoolO&M expenses other operations and maintenance expenses in the consolidated statements of incomePJM PJM Interconnection, L.L.C.PMI FPL Energy Power Marketing, Inc.PTC production tax creditsPURPA Public Utility Regulatory Policies Act of 1978, as amendedqualifying facilities non-utility power production facilities meeting the requirements of a qualifying facility under the PURPARFC ReliabilityFirst CorporationRFP request for proposalROE return on common equityRTO regional transmission organizationSeabrook Seabrook StationSEC U.S. Securities and Exchange CommissionSERC Southeastern Electric Reliability CouncilSPP Southwest Power PoolVIE variable interest entityWECC Western Electricity Coordinating Council
FPL Group, FPL, FPL Group Capital and FPL Energy each have subsidiaries and affiliates with names that include FPL, FPLEnergy, FPLE and similar references. For convenience and simplicity, in this report the terms FPL Group, FPL, FPL GroupCapital and FPL Energy are sometimes used as abbreviated references to specific subsidiaries, affiliates or groups ofsubsidiaries or affiliates. The precise meaning depends on the context.

3
TABLE OF CONTENTS
Page No.
Definitions 2Forward-Looking Statements 3
PART I
Item 1. Business 4Item 1A. Risk Factors 15Item 1B. Unresolved Staff Comments 18Item 2. Properties 18Item 3. Legal Proceedings 20Item 4. Submission of Matters to a Vote of Security Holders 23
PART II
Item 5. Market for the Registrants’ Common Equity, Related Stockholder Matters and Issuer Purchases of Equity Securities 24
Item 6. Selected Financial Data 25Item 7. Management’s Discussion and Analysis of Financial Condition and Results of Operations 25Item 7A. Quantitative and Qualitative Disclosures About Market Risk 43Item 8. Financial Statements and Supplementary Data 44Item 9. Changes in and Disagreements with Accountants on Accounting and Financial Disclosure 89Item 9A. Controls and Procedures 89Item 9B. Other Information 89
PART III
Item 10. Directors and Executive Officers of the Registrant 90Item 11. Executive Compensation 90Item 12. Security Ownership of Certain Beneficial Owners and Management and Related Stockholder Matters 90Item 13. Certain Relationships and Related Transactions 90Item 14. Principal Accountant Fees and Services 90
PART IV
Item 15. Exhibits and Financial Statement Schedules 92
Signatures 99
FORWARD-LOOKING STATEMENTS
This report includes forward-looking statements within the meaning of the Private Securities Litigation Reform Act of1995. Any statements that express, or involve discussions as to, expectations, beliefs, plans, objectives, assumptions orfuture events or performance (often, but not always, through the use of words or phrases such as will likely result, areexpected to, will continue, is anticipated, believe, could, estimated, may, plan, potential, projection, target, outlook) are notstatements of historical facts and may be forward-looking. Forward-looking statements involve estimates, assumptions anduncertainties. Accordingly, any such statements are qualified in their entirety by reference to important factors included inPart I, Item 1A. Risk Factors (in addition to any assumptions and other factors referred to specifically in connection with suchforward-looking statements) that could have a significant impact on FPL Group’s and/or FPL’s operations and financialresults, and could cause FPL Group’s and/or FPL’s actual results to differ materially from those contained in forward-lookingstatements made by or on behalf of FPL Group and/or FPL in this combined Form 10-K, in presentations, on their respectivewebsites, in response to questions or otherwise.
Any forward-looking statement speaks only as of the date on which such statement is made, and FPL Group and FPLundertake no obligation to update any forward-looking statement to reflect events or circumstances, including unanticipatedevents, after the date on which such statement is made. New factors emerge from time to time and it is not possible formanagement to predict all of such factors, nor can it assess the impact of each such factor on the business or the extent towhich any factor, or combination of factors, may cause actual results to differ materially from those contained in any forward-looking statement.

4
PART I
Item 1. Business
FPL GROUP
FPL Group was incorporated in 1984 under the laws of Florida. FPL Group’s principal subsidiary, FPL, is a rate-regulatedutility engaged primarily in the generation, transmission, distribution and sale of electric energy. FPL Group Capital, a wholly-owned subsidiary of FPL Group, holds the capital stock and provides funding for FPL Group’s operating subsidiaries otherthan FPL. The business activities of these operating subsidiaries primarily consist of FPL Energy’s competitive energybusiness. At December 31, 2005, FPL Group and its subsidiaries employed approximately 12,400 people. For financialinformation regarding FPL Group’s business segments, see Note 17.
In August 2005, President Bush signed into law the 2005 Energy Act, which substantially affected the regulation of energycompanies. The 2005 Energy Act included provisions that, among other things, amended federal energy laws, provided theFERC with new oversight responsibilities, repealed the Public Utility Holding Company Act of 1935, as amended, whichregulated the financial structure of certain utility holding companies and, among other things, restricted mergers andacquisitions in the electric industry, and enacted the Holding Company Act. FPL Group is a holding company, as defined inthe Holding Company Act.
In December 2005, FPL Group and Constellation Energy announced a proposed merger. The combined company isexpected to be the nation’s largest competitive energy supplier based on generation and have the second largest electricutility portfolio based on number of customers served. The companies are working to complete the merger by the end of2006. However, completion of the merger and the actual closing date depend upon the satisfaction of a number ofconditions, including shareholder approvals and the receipt of required regulatory approvals. For additional informationconcerning the proposed merger, see Note 2.
Website Access to SEC Filings. FPL Group and FPL make their SEC filings, including their annual report on Form 10-K,quarterly reports on Form 10-Q, current reports on Form 8-K, and any amendments to those reports, available free of chargeon the internet website, www.fplgroup.com, as soon as reasonably practicable after they are electronically filed with orfurnished to the SEC.
FPL OPERATIONS
General. FPL was incorporated under the laws of Florida in 1925 and is a wholly-owned subsidiary of FPL Group. FPLsupplies electric service to a population of more than eight million throughout most of the east and lower west coasts ofFlorida. During 2005, FPL served approximately 4.3 million customer accounts. The percentage of FPL’s operating revenuesby customer class was as follows:
Years Ended December 31,2005 2004 2003
Residential 55% 54% 56%Commercial 37 37 37Industrial 3 3 3Other, including deferred or recovered clause revenues, the net change in unbilled revenues and any provision for retail rate refund 5 6 4
100% 100% 100%
FPL currently holds 174 franchise agreements to provide electric service in various municipalities and counties in Florida withvarying expiration dates through 2035. Of the 174 franchise agreements, four expire in 2006, 18 expire in 2007 and 85 expireduring the period 2008 through 2015. Ongoing negotiations are taking place to renew franchises with upcomingexpirations. FPL considers its franchises to be adequate for the conduct of its business.
See the discussion of the proposed merger with Constellation Energy under FPL Group above.
Regulation. FPL’s retail operations provided approximately 99% of FPL’s 2005 operating revenues. Retail operations areregulated by the FPSC, which has jurisdiction over retail rates, service territory, issuances of securities, planning, siting andconstruction of facilities and other matters. FPL is also subject to regulation by the FERC with respect to certain aspects of itsoperations, including the acquisition and disposition of facilities, interchange and transmission services and wholesalepurchases and sales of electric energy. In addition, FPL’s nuclear power plants are subject to the jurisdiction of theNRC. NRC regulations govern the granting of licenses for the construction, operation and retirement of nuclear power plantsand subject these plants to continuing review and regulation.
Retail Ratemaking. The underlying concept of utility ratemaking is to set rates at a level that allows the utility theopportunity to collect from customers total revenues (revenue requirements) equal to its cost of providing service, including areasonable rate of return on invested capital. To accomplish this, the FPSC uses various ratemaking mechanisms.

5
The basic costs of providing electric service, other than fuel and certain other costs, are recovered through base rates, whichare designed to recover the costs of constructing, operating and maintaining the utility system. These basic costs includeO&M expenses, depreciation and taxes, as well as a return on FPL’s investment in assets used and useful in providingelectric service (rate base). The rate of return on rate base approximates FPL’s weighted-average cost of capital, whichincludes its costs for debt and preferred stock and, typically, an allowed ROE. The FPSC monitors FPL’s actual ROE througha surveillance report that is filed monthly by FPL with the FPSC. The FPSC does not provide assurance that an allowed ROEwill be achieved. Base rates are determined in rate proceedings or through negotiations, which occur at irregular intervals atthe initiative of FPL, the FPSC, the State of Florida Office of Public Counsel or a substantially affected party.
In August 2005, FPL and all of the interveners in its 2005 rate case filing signed a stipulation and settlement agreementregarding FPL’s retail base rates, which was subsequently approved by the FPSC (2005 rate agreement). The 2005 rateagreement will be in effect through December 31, 2009, and thereafter shall remain in effect until terminated on the date newretail base rates become effective pursuant to an FPSC order. The 2005 rate agreement replaced a rate agreement that waseffective April 15, 2002 through December 31, 2005 (2002 rate agreement).
The 2005 rate agreement provides that retail base rates will not increase during the term of the agreement except to allowrecovery of the revenue requirements of any power plant approved pursuant to the Florida Power Plant Siting Act (Siting Act)that achieves commercial operation during the term of the 2005 rate agreement. The 2005 rate agreement also continues therevenue sharing mechanism in FPL’s 2002 rate agreement, whereby revenues from retail base operations in excess ofcertain thresholds will be shared with customers on the basis of two-thirds refunded to customers and one-third retained byFPL. Revenues from retail base operations in excess of a second, higher threshold (cap) will be refunded 100% tocustomers. The revenue sharing threshold and cap for 2006 will be $3,991 million and $4,156 million, respectively, whichwas established by using the 2005 revenue sharing threshold and cap of $3,880 million and $4,040 million, respectively, andincreasing them by the average annual growth rate in retail kwh sales for the ten-year period ending December 31, 2005. Foreach succeeding year, retail base rate revenue sharing threshold and cap amounts will be established by increasing the prioryear’s threshold and cap by the sum of the following: (i) the average annual growth rate in retail kwh sales for the ten-yearperiod ending December 31 of the preceding year multiplied by the prior year’s retail base rate revenue sharing threshold andcap and (ii) the amount of any incremental base rate increases for power plants approved pursuant to the Siting Act thatachieve commercial operation during the term of the 2005 rate agreement.
Under the terms of the 2005 rate agreement: (i) FPL’s electric property depreciation rates will be based upon thecomprehensive depreciation studies it filed with the FPSC in March 2005; however, FPL may reduce depreciation by up to$125 million annually, (ii) FPL suspended contributions of approximately $79 million per year to its nuclear decommissioningfund beginning in September 2005, (iii) FPL suspended contributions of $20.3 million per year to its storm and propertyinsurance reserve beginning in January 2006 and has the ability to recover prudently incurred storm restoration costs, eitherthrough securitization pursuant to Section 366.8260 of the Florida Statutes or through surcharges, and (iv) FPL will beallowed to recover through a cost recovery clause prudently incurred incremental costs associated with complying with anFPSC or FERC order regarding a regional transmission organization.
FPL will not have an authorized regulatory ROE under the 2005 rate agreement for the purpose of addressing earningslevels. For all other regulatory purposes, FPL will have an ROE of 11.75%. The revenue sharing mechanism describedabove will be the appropriate and exclusive mechanism to address earnings levels. However, if FPL’s regulatory ROE, asreported to the FPSC in FPL’s monthly earnings surveillance report, falls below 10% during the term of the 2005 rateagreement, FPL may petition the FPSC to amend its base rates.
The 2002 rate agreement provided for a $250 million annual reduction in retail base revenues allocated to all customers byreducing customers’ base rates and service charges by approximately 7%, as well as a revenue sharing mechanism basedon stated thresholds. During the term of the 2002 rate agreement, FPL did not have an authorized regulatory ROE range forthe purpose of addressing earnings levels and FPL reduced depreciation on its plant in service by $125 million each year.
Fuel costs are recovered from customers through levelized charges per kwh established under the fuel clause. Thesecharges are calculated annually based on estimated fuel costs and estimated customer usage for the following year, plus orminus a true-up adjustment to reflect the variance of actual costs and usage from the estimates used in setting the fueladjustment charges for prior periods. An adjustment to the levelized charges may be approved during the course of a year toreflect a projected variance based on actual costs and usage. Due to the significant increase in fuel costs during 2005, FPLfiled several revisions to its estimated true-up adjustment. In 2005, approximately $4.1 billion of costs were recoveredthrough the fuel clause. The FPSC has approved a risk management fuel procurement program which is intended to reducethe risk of unexpected fuel price volatility by locking in fuel prices for a portion of FPL’s fuel requirements. The results of theprogram are reviewed by the FPSC as part of the annual review of fuel costs. See Energy Marketing and Trading,Management's Discussion – Results of Operations, Note 1 – Regulation and Note 4.
Capacity payments to other utilities and generating companies for purchased power are recovered from customers throughthe capacity clause and base rates. In 2005, approximately $651 million of costs were recovered through the capacityclause. Costs associated with implementing energy conservation programs totaled approximately $176 million in 2005 andwere recovered from customers through the energy conservation cost recovery clause. Costs of complying with federal, stateand local environmental regulations enacted after April 1993 totaled $24 million in 2005 and are recovered through theenvironmental clause to the extent not included in base rates.

6
FPL was impacted by Hurricanes Dennis, Katrina, Rita and Wilma in 2005 and by Hurricanes Charley, Frances and Jeanne in2004. These hurricanes did major damage in parts of FPL’s service territory and collectively resulted in customer poweroutages in 2005 and 2004 of 5.3 million and 5.4 million, respectively. At December 31, 2005, storm restoration costs incurredby FPL during 2005 and 2004 exceeded the amount in the storm and property insurance reserve. At December 31, 2005,FPL’s storm reserve deficiency totaled approximately $1.1 billion. The storm reserve deficiency associated with the 2004hurricanes, plus interest, is being recovered primarily through a storm damage surcharge applied to retail customer bills overa 36-month period that began in February 2005, and totaled approximately $297 million at December 31, 2005. Theremaining balance of the storm reserve deficiency primarily relates to the storm restoration costs associated with 2005hurricanes. In January 2006, FPL petitioned the FPSC for approval to recover approximately $1.7 billion of storm coststhrough the issuance of $1,050 million of storm recovery bonds pursuant to the securitization provisions of Section 366.8260of the Florida Statutes. The storm bond proceeds will provide for the net-of-tax recovery of the remaining balance of theunrecovered hurricane costs of $1,040 million (estimated balance as of July 31, 2006) and the replenishment of the stormreserve to approximately $650 million. If the FPSC determines that the storm restoration costs should not be securitized andinstead should be recovered through another means, FPL has recommended as an alternative recovering the 2005 hurricanecosts through a surcharge over approximately three years and implementing a separate surcharge to fund a $650 millionstorm reserve. The FPSC’s decision is expected in May 2006. On February 2, 2006, several interested parties filed a motionto dismiss FPL’s petition, claiming that the petition did not satisfy certain technical requirements. FPL filed its response to themotion on February 6, 2006, asserting that the requirements cited are not applicable to FPL's petition and which were met inany event. The FPSC has the right to review FPL's storm charges for prudence, and has the authority to determine themanner and timing of recovery. See Note 1 − Storm Reserve Deficiency.
In January 2006, the FPSC held an electric infrastructure workshop to discuss the damage to electric utility facilities incurreddue to recent hurricanes and to explore ways of minimizing damage and resulting outages to customers in thefuture. Presentations on hurricane issues were made by representatives of city governments, vendors and the Floridautilities. On January 30, 2006, FPL filed a report with the FPSC outlining its Storm Secure Plan, a new initiative to enhanceits electrical grid as a result of heightened hurricane activity and in response to concerns expressed by the community, stateleaders and regulators. On February 7, 2006, the FPSC approved a rule that requires the Florida electric utilities to inspecttheir transmission and distribution wood poles on an eight-year inspection cycle and file an annual report with the FPSCregarding such inspections. The FPSC has scheduled a meeting for February 27, 2006 to discuss what the next step(s) willbe.
The FPSC has the authority to disallow recovery of costs that it considers excessive or imprudently incurred. Such costs mayinclude, among others, O&M expenses, the cost of replacing power lost when fossil and nuclear units are unavailable, stormrestoration costs and costs associated with the construction or acquisition of new facilities.
Competition. FPL currently faces competition from other suppliers of electrical energy to wholesale customers and fromalternative energy sources and self-generation for other customer groups, primarily industrial customers. In 2005, operatingrevenues from wholesale and industrial customers combined represented approximately 4% of FPL's total operatingrevenues. Various states, other than Florida, have enacted legislation or have state commissions that have issued ordersdesigned to allow retail customers to choose their electricity supplier. Such a regulatory restructuring, if enacted in Florida,would most likely result in a shift from cost-based rates to market-based rates for energy production and other servicesprovided to retail customers. Although the legislation and initiatives in other states vary substantially, common areas of focusinclude when market-based pricing will be available for wholesale and retail customers, what existing prudently incurred costsin excess of the market-based price will be recoverable and whether generating assets should be separated fromtransmission, distribution and other assets. It is generally believed that transmission and distribution activities would remainregulated. Within the last few years, these state restructuring efforts have diminished, and several states have delayed theimplementation or reversed previously approved restructuring legislation and rules. Management believes it is unlikely therewill be any state actions to restructure the retail electric industry in Florida in the near future. If the basis of regulation forsome or all of FPL's business changes from cost-based regulation, existing regulatory assets and liabilities would be writtenoff unless regulators specify an alternative means of recovery or refund. Further, other aspects of the business, such asgeneration assets and long-term power purchase commitments, would need to be reviewed to assess their recoverability in achanged regulatory environment. See Note 1 – Regulation.
The FPSC promotes cost competitiveness in the building of new steam generating capacity by requiring investor-ownedelectric utilities, such as FPL, to issue an RFP. The RFP process allows independent power producers and others to bid tosupply the needed generating capacity. If a bidder has the most cost-effective alternative, meets other criteria such asfinancial viability and demonstrates adequate expertise and experience in building and/or operating generation capacity of thetype proposed, the investor-owned electric utility would seek to negotiate a power purchase agreement with the selectedbidder and request that the FPSC approve the terms of the power purchase agreement and, if appropriate, provide therequired authorization for the construction of the bidder’s generation capacity. In August 2005, FPL issued part one of a two-part RFP for additional power resources beginning in 2009. FPL's self-build approach calls for building two approximately1,200 mw natural gas-fired combined-cycle units in western Palm Beach County, Florida, that would be operational in 2009and 2010. In January 2006, after evaluating alternative proposals, FPL concluded that its self-build approach is the mostcost-effective alternative to satisfy the need for additional power resources in 2009 and 2010. FPL plans to issue part two ofthis RFP in 2006 soliciting competitive bids for additional power resources beginning in 2012. FPL's self-build approach callsfor building two approximately 850 mw advanced technology coal generating units that would be operational in 2012 and2013.
7
The FERC has jurisdiction over potential changes that could affect competition in wholesale transactions. In 1999, the FERCissued its final order on RTOs which, under a variety of structures, provides for the independent operation of transmissionsystems for a given geographic area. In early 2001, the FERC approved GridFlorida (FPL’s, Progress Energy Florida, Inc.’sand Tampa Electric Company’s proposed RTO) as the RTO for peninsular Florida. In late 2001, the FPSC determined thatthe RTO as proposed was not in the best interest of Florida customers and required the companies to develop a modifiedproposal. In early 2002, FPL, Progress Energy Florida, Inc. and Tampa Electric Company filed a modified RTO proposal withthe FPSC changing the structure of GridFlorida from a for-profit transmission company to a non-profit ISO. In late 2002, theFPSC approved many of the aspects of the modified RTO proposal, administratively approving recovery of GridFlorida’sincremental costs through the capacity clause. During 2004, the FPSC held workshops to address additional GridFloridaissues. In 2005, an independent consulting firm performed a cost benefit analysis of GridFlorida and concluded thatGridFlorida would not be cost effective for the retail customers of the GridFlorida participants. In January 2006, FPL and theother GridFlorida participants petitioned the FPSC to approve the withdrawal of the GridFlorida proposal.
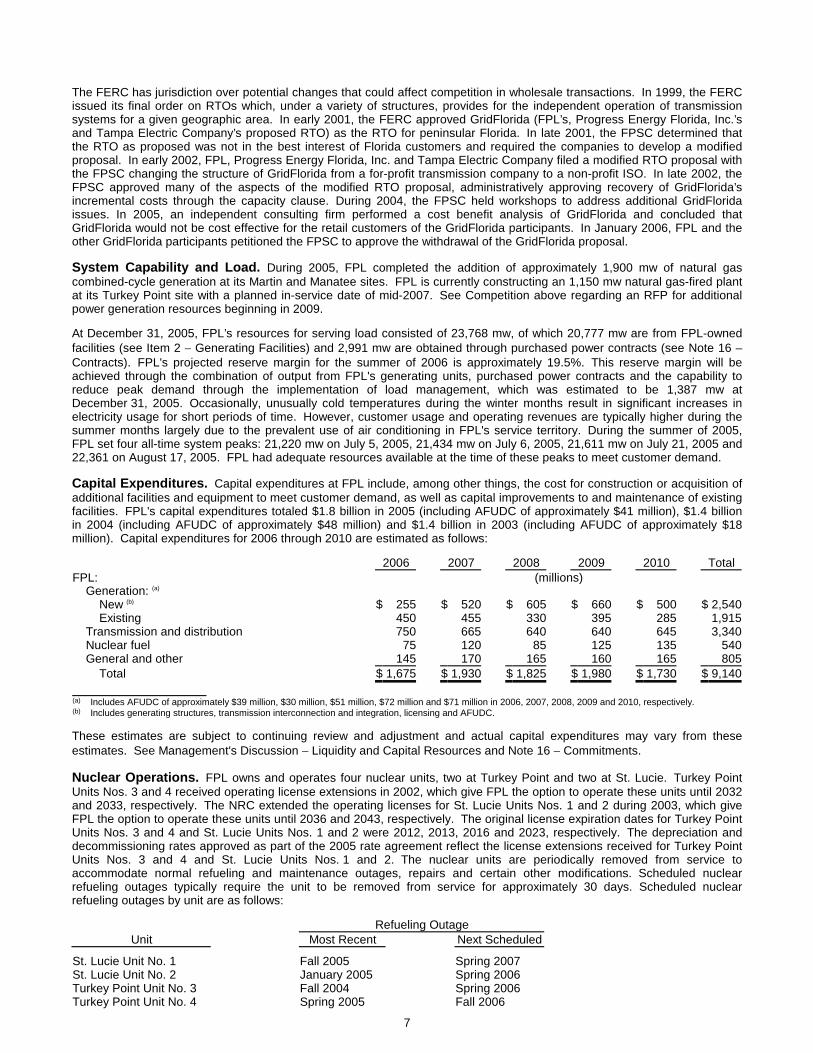
System Capability and Load. During 2005, FPL completed the addition of approximately 1,900 mw of natural gascombined-cycle generation at its Martin and Manatee sites. FPL is currently constructing an 1,150 mw natural gas-fired plantat its Turkey Point site with a planned in-service date of mid-2007. See Competition above regarding an RFP for additionalpower generation resources beginning in 2009.
At December 31, 2005, FPL’s resources for serving load consisted of 23,768 mw, of which 20,777 mw are from FPL-ownedfacilities (see Item 2 − Generating Facilities) and 2,991 mw are obtained through purchased power contracts (see Note 16 –Contracts). FPL's projected reserve margin for the summer of 2006 is approximately 19.5%. This reserve margin will beachieved through the combination of output from FPL's generating units, purchased power contracts and the capability toreduce peak demand through the implementation of load management, which was estimated to be 1,387 mw atDecember 31, 2005. Occasionally, unusually cold temperatures during the winter months result in significant increases inelectricity usage for short periods of time. However, customer usage and operating revenues are typically higher during thesummer months largely due to the prevalent use of air conditioning in FPL's service territory. During the summer of 2005,FPL set four all-time system peaks: 21,220 mw on July 5, 2005, 21,434 mw on July 6, 2005, 21,611 mw on July 21, 2005 and22,361 on August 17, 2005. FPL had adequate resources available at the time of these peaks to meet customer demand.
Capital Expenditures. Capital expenditures at FPL include, among other things, the cost for construction or acquisition ofadditional facilities and equipment to meet customer demand, as well as capital improvements to and maintenance of existingfacilities. FPL's capital expenditures totaled $1.8 billion in 2005 (including AFUDC of approximately $41 million), $1.4 billionin 2004 (including AFUDC of approximately $48 million) and $1.4 billion in 2003 (including AFUDC of approximately $18million). Capital expenditures for 2006 through 2010 are estimated as follows:
2006 2007 2008 2009 2010 TotalFPL: (millions) Generation: (a)
New (b) $ 255 $ 520 $ 605 $ 660 $ 500 $ 2,540 Existing 450 455 330 395 285 1,915 Transmission and distribution 750 665 640 640 645 3,340 Nuclear fuel 75 120 85 125 135 540 General and other 145 170 165 160 165 805 Total $ 1,675 $ 1,930 $ 1,825 $ 1,980 $ 1,730 $ 9,140____________________(a) Includes AFUDC of approximately $39 million, $30 million, $51 million, $72 million and $71 million in 2006, 2007, 2008, 2009 and 2010, respectively.(b) Includes generating structures, transmission interconnection and integration, licensing and AFUDC.
These estimates are subject to continuing review and adjustment and actual capital expenditures may vary from theseestimates. See Management's Discussion − Liquidity and Capital Resources and Note 16 − Commitments.
Nuclear Operations. FPL owns and operates four nuclear units, two at Turkey Point and two at St. Lucie. Turkey PointUnits Nos. 3 and 4 received operating license extensions in 2002, which give FPL the option to operate these units until 2032and 2033, respectively. The NRC extended the operating licenses for St. Lucie Units Nos. 1 and 2 during 2003, which giveFPL the option to operate these units until 2036 and 2043, respectively. The original license expiration dates for Turkey PointUnits Nos. 3 and 4 and St. Lucie Units Nos. 1 and 2 were 2012, 2013, 2016 and 2023, respectively. The depreciation anddecommissioning rates approved as part of the 2005 rate agreement reflect the license extensions received for Turkey PointUnits Nos. 3 and 4 and St. Lucie Units Nos. 1 and 2. The nuclear units are periodically removed from service toaccommodate normal refueling and maintenance outages, repairs and certain other modifications. Scheduled nuclearrefueling outages typically require the unit to be removed from service for approximately 30 days. Scheduled nuclearrefueling outages by unit are as follows:
Refueling OutageUnit Most Recent Next Scheduled
St. Lucie Unit No. 1 Fall 2005 Spring 2007St. Lucie Unit No. 2 January 2005 Spring 2006Turkey Point Unit No. 3 Fall 2004 Spring 2006Turkey Point Unit No. 4 Spring 2005 Fall 2006

8
The NRC’s regulations require FPL to submit a plan for decontamination and decommissioning five years prior to theprojected end of plant operation. FPL’s current plans, under the extended operating licenses, provide for promptdismantlement of Turkey Point Units Nos. 3 and 4 with decommissioning activities commencing in 2032 and 2033,respectively. Current plans provide for St. Lucie Unit No. 1 to be mothballed beginning in 2036 with decommissioningactivities to be integrated with the prompt dismantlement of St. Lucie Unit No. 2 at the end of its useful life in 2043. Seeestimated decommissioning cost data in Note 1 – Decommissioning of Nuclear Plants, Dismantlement of Plants and OtherAccrued Asset Removal Costs.
In 2003, the NRC issued an order requiring all pressurized water reactor licensees, including FPL, to perform visual andvolumetric inspections of reactor vessel heads at each unit's scheduled refueling outage to identify if degradation such ascracking or corrosion has occurred. In conjunction with the NRC order, FPL has performed visual and volumetric inspectionsof its nuclear units' reactor vessel heads during their scheduled refueling outages since October 2002. FPL replaced thereactor vessel heads at Turkey Point Unit No. 3, Turkey Point Unit No. 4 and St. Lucie Unit No. 1 during their scheduledrefueling outages in the fall of 2004, spring of 2005 and fall of 2005, respectively, and therefore no further inspections will berequired at these units until 2009. The inspections during scheduled refueling outages at St. Lucie Unit No. 2 revealed CRDMnozzles with cracks, which were repaired during the outages in 2003 and 2005. It is anticipated that additional CRDM nozzlerepairs will be needed at St. Lucie Unit No. 2's next scheduled outage. FPL intends to replace the reactor vessel head at St.Lucie Unit No. 2 during its fall 2007 scheduled refueling outage. The cost to replace St. Lucie Unit No. 2's reactor vesselhead, including AFUDC, is included in FPL's estimated capital expenditures. See Management’s Discussion – Results ofOperations – FPL and Note 16 – Commitments.
St. Lucie Unit No. 2's steam generators are reaching the end of their useful life. As flaws are identified in individual tubes,they are plugged in order to prevent the tubes from leaking during plant operations. To date, 18.9% of these tubes have beenplugged. In January 2005, FPL received permission from the NRC to plug up to 30% of St. Lucie Unit No. 2's steamgenerator tubes. Current projections indicate that the 30% tube plugging limit could be exceeded during St. Lucie Unit No. 2'snext scheduled refueling outage. FPL is planning to repair any tubes exceeding the 30% tube plugging limit by insertingmetal sleeves inside the degraded tubes (sleeving) and has requested NRC approval to sleeve degraded tubes as analternative to plugging. Sleeving degraded tubes is expected to increase the cost and length of the outage. FPL intends toreplace the steam generators along with the reactor vessel head at St. Lucie Unit No. 2 during its fall 2007 scheduledrefueling outage. The cost to replace St. Lucie Unit No. 2’s steam generators, including AFUDC, is included in FPL’sestimated capital expenditures above. See Management’s Discussion – Results of Operations – FPL and Note 16 –Commitments. The replacement of the reactor vessel head and steam generators is expected to add approximately 55 daysto the number of days St. Lucie Unit No. 2 is removed from service during a typical scheduled refueling outage.
During 2003, nuclear utilities, other than FPL, identified that pressurizer heater sleeves made with a particular material (alloy600) were experiencing penetration cracks and leaks as a result of primary water stress corrosion cracking. As a result, in2004, the NRC issued a bulletin requesting utilities to identify and inspect all alloy 600 and weld materials in all pressurizerlocations and connected steam space piping. Due to the amount of time and cost associated with correcting potential leaks,FPL replaced St. Lucie Unit No. 1's pressurizer during its fall 2005 outage and plans to repair St. Lucie Unit No. 2'spressurizer heater sleeves and other penetrations during its scheduled refueling and steam generator and reactor vesselhead replacement outage in the fall of 2007. The estimated cost is included in FPL's estimated capital expendituresabove. Since the 2004 NRC bulletin was issued, no leaks have been identified based on inspections at St. Lucie Unit No.2. See Note 16 – Commitments. All pressurizer penetrations and welds at Turkey Point Units Nos. 3 and 4 utilize a differentmaterial.
Fuel. FPL's generating plants use a variety of fuels. See Item 2 – Generating Facilities and Note 16 – Contracts. Thediverse fuel options, along with purchased power, enable FPL to shift between sources of generation to achieve a moreeconomical fuel mix.
FPL has four firm transportation contracts in place with FGT and one firm transportation contract with Gulfstream that togetherwill satisfy substantially all of the anticipated needs for natural gas transportation at its existing units. The four existing FGTcontracts expire between 2015 and 2022, while the Gulfstream contract expires in 2028. The two contracts expiring in 2015may be extended by FPL until 2030. To the extent desirable, FPL can also purchase interruptible gas transportation servicefrom FGT and Gulfstream based on pipeline availability. FPL has several short- and medium-term natural gas supplycontracts to provide a portion of FPL's anticipated needs for natural gas. The remainder of FPL's gas requirements arepurchased under other contracts and in the spot market.
FPL has, through its joint ownership interest in St. Johns River Power Park (SJRPP) Units Nos. 1 and 2, long-term coalsupply and transportation contracts for a portion of the fuel needs for those units. All of the transportation requirements and aportion of the fuel supply needs for Scherer Unit No. 4 are covered by a series of annual and long-term contracts. FPL'sremaining fuel requirements for these units will be obtained in the spot market. FPL's oil requirements are obtained undershort-term contracts and in the spot market.
FPL leases nuclear fuel for all four of its nuclear units. See Note 1 – Nuclear Fuel. In 2003, FPL Group and FPL beganconsolidating the lessor entity in accordance with FIN 46, "Consolidation of Variable Interest Entities." See Note 9 –FPL. The contracts for the supply, conversion, enrichment and fabrication of FPL's nuclear fuel have expiration dates rangingfrom December 2006 through 2013. Currently, FPL is storing spent fuel on site pending its removal by the DOE. Under theNuclear Waste Policy Act, the DOE was required to construct permanent disposal facilities and take title to and provide

9
transportation and disposal for spent nuclear fuel by January 31, 1998 for a specified fee based on current generation fromnuclear power plants. Through December 2005, FPL has paid approximately $541 million in such fees to the DOE’s nuclearwaste fund. The DOE did not meet its statutory obligation for disposal of spent nuclear fuel under the Nuclear Waste PolicyAct. In 1997, a court ruled, in response to petitions filed by utilities, state governments and utility commissions, that the DOEcould not assert a claim that its delay was unavoidable in any defense against lawsuits by utilities seeking money damagesarising out of the DOE’s failure to perform its obligations. In 1998, FPL filed a lawsuit against the DOE seeking damagescaused by the DOE’s failure to dispose of spent nuclear fuel from FPL’s nuclear power plants. The matter is pending. In theinterim, FPL is investigating other alternatives to provide adequate storage capacity for all of its spent nuclear fuel. Based oncurrent projections, FPL will lose its ability to store additional spent fuel on site for St. Lucie Unit No. 1 in 2008, St. Lucie UnitNo. 2 in 2007, Turkey Point Unit No. 3 in 2010 and Turkey Point Unit No. 4 in 2012. These projections are based onadditional space provided by new cask pit area storage racks installed at the Turkey Point Units Nos. 3 and 4 and St. LucieUnit No. 1 spent fuel pools in 2004. St. Lucie Unit No. 2’s cask pit rack is expected to be completed in the summer of 2006,which will extend its capability to store spent fuel through 2010. In addition, degradation in a material used in the spent fuelpools at St. Lucie Unit No. 1 and Turkey Point Units Nos. 3 and 4 could result in implementation of alternative spent fuelstorage options sooner than projected. FPL plans to begin using dry storage casks to store spent fuel at the St. Lucie Unitsprior to 2009 and at the Turkey Point Units prior to 2010, which would extend their capability to store spent fuelindefinitely. The cost for the dry storage casks is included in FPL's estimated capital expenditures above.
In 2002, the governor of Nevada submitted a Notice of Disapproval to Congress regarding President Bush's recommendationto develop Yucca Mountain as a nuclear waste depository. The Yucca Mountain site is the DOE's recommended location tostore and dispose of spent nuclear fuel and high-level radioactive waste. During May and July 2002, Congress overrode theNotice of Disapproval through a majority vote of both houses. The President signed the joint resolution of Congress into lawin 2002. The State of Nevada has initiated legal actions to attempt to block the project. In 2004, the U.S. Court of Appealsfor the District of Columbia Circuit ruled on a series of challenges to the statutes and regulations established to govern anuclear waste depository at the Yucca Mountain site. The court denied all the challenges except for one, regarding an EPArule governing the time period the public would be protected from hypothetical radiation leaks at the Yucca Mountainrepository. The court's decision will likely result in revisions to the EPA's and NRC's licensing rules for Yucca Mountain andcould further delay the licensing process for Yucca Mountain. The DOE is no longer projecting when the nuclear wastedepository will be completed.
Energy Marketing and Trading. EMT, a division of FPL, buys and sells wholesale energy commodities, such as naturalgas, oil and electricity. EMT procures natural gas and oil for FPL's use in power generation and sells excess gas, oil andelectricity. EMT also uses derivative instruments, such as swaps, options and forwards to manage the commodity price riskinherent in fuel and electricity sales and purchases. Substantially all of the results of EMT's activities are passed through tocustomers in the fuel or capacity clauses. See Retail Ratemaking, Management's Discussion – Energy Marketing andTrading and Market Risk Sensitivity and Note 4.
Environmental. Federal, state and local environmental laws and regulations cover air and water quality, land use, powerplant and transmission line siting, EMF from power lines and substations, oil discharge from transformers, lead paint,asbestos, noise and aesthetics, solid waste, natural resources, wildlife mortality and other environmentalmatters. Compliance with these laws and regulations increases the cost of electric service by requiring, among other things,changes in the design and operation of existing facilities and changes or delays in the location, design, construction andoperation of new facilities. During 2005, FPL spent approximately $41 million on capital additions to comply withenvironmental laws and regulations. FPL's capital expenditures to comply with environmental laws and regulations areestimated to be $236 million for 2006 through 2008, including approximately $89 million in 2006, and are included inestimated capital expenditures set forth in Capital Expenditures above. Environmental regulations are subject tochange. The following is a discussion of emerging federal initiatives and rules that could potentially affect FPL. FPL wouldgenerally seek recovery under its environmental clause for compliance costs associated with any new environmental lawsand regulations.
Climate Change − As a participant in President Bush's Climate Leader Program to reduce greenhouse gas intensity in theUnited States by 18% by 2012, FPL has inventoried its greenhouse gas emission rates and FPL Group has committed to a2008 reduction target of 18% below a 2001 baseline emission rate measured in pounds per megawatt-hour. FPL believesthat the planned operation of its generating portfolio, along with its current efficiency initiatives, greenhouse gas managementefforts and increased use of renewable energy, will allow it to achieve this target.
In addition to the voluntary initiative, the U.S. Congress is considering several legislative proposals that would establish newmandatory regulatory requirements and reduction targets for greenhouse gases. Based on the most current reference dataavailable from government sources, FPL is among the lowest emitters of greenhouse gases measured by its rate ofemissions to generation in pounds per megawatt-hour. However, these legislative proposals have differing methods ofimplementation and the impact on FPL's generating units and/or the financial impact (either positive or negative) to FPLGroup and FPL could be material, depending on the eventual structure of a mandatory program.
Multi-Pollutant Legislation − The U.S. Congress and the Bush Administration are considering several legislative proposals thatwould establish new regulatory requirements and reduction targets for sulfur dioxide, nitrogen oxide, mercury, and in someproposals, carbon dioxide. Based on the most current reference data available from government sources, FPL is among thelowest generators of these emissions when measured by its rate of emissions to generation in pounds per megawatt-hour. However, these multi-pollutant proposals have differing methods of implementation and the impact on FPL's generating
10
units and/or the financial impact (either positive or negative) to FPL Group and FPL could be material, depending on theeventual structure of any legislation enacted.
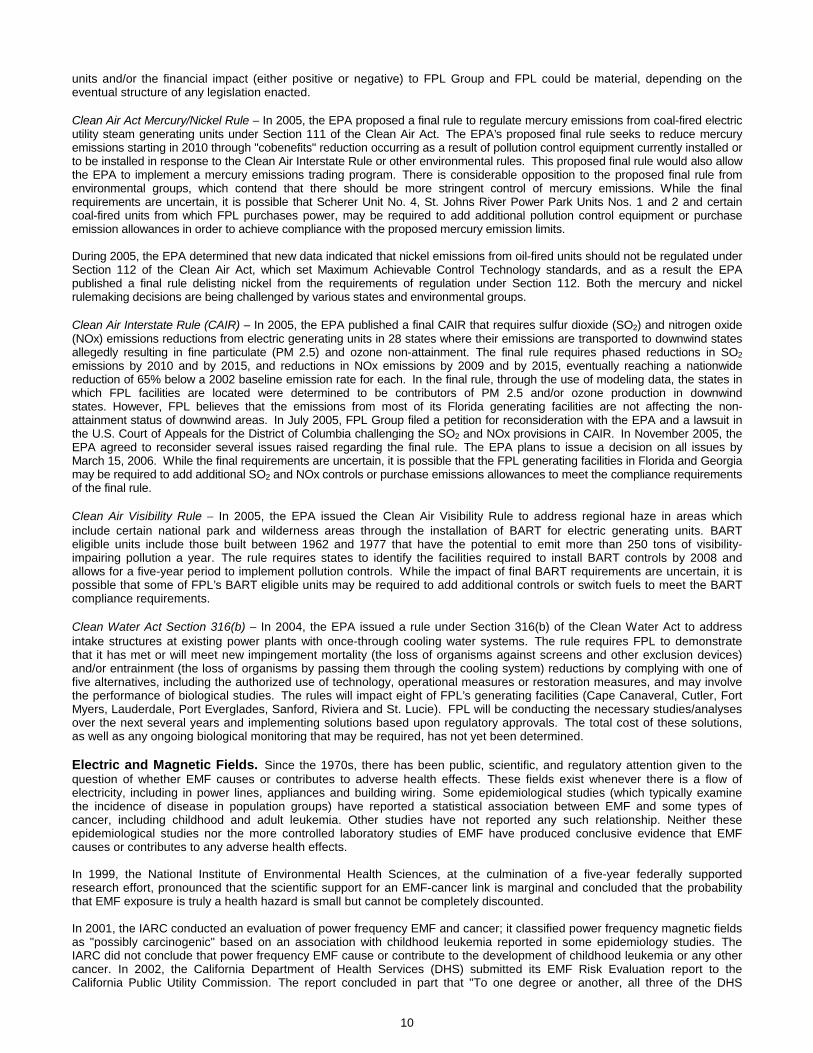
Clean Air Act Mercury/Nickel Rule � In 2005, the EPA proposed a final rule to regulate mercury emissions from coal-fired electricutility steam generating units under Section 111 of the Clean Air Act. The EPA’s proposed final rule seeks to reduce mercuryemissions starting in 2010 through "cobenefits" reduction occurring as a result of pollution control equipment currently installed orto be installed in response to the Clean Air Interstate Rule or other environmental rules. This proposed final rule would also allowthe EPA to implement a mercury emissions trading program. There is considerable opposition to the proposed final rule fromenvironmental groups, which contend that there should be more stringent control of mercury emissions. While the finalrequirements are uncertain, it is possible that Scherer Unit No. 4, St. Johns River Power Park Units Nos. 1 and 2 and certaincoal-fired units from which FPL purchases power, may be required to add additional pollution control equipment or purchaseemission allowances in order to achieve compliance with the proposed mercury emission limits.
During 2005, the EPA determined that new data indicated that nickel emissions from oil-fired units should not be regulated underSection 112 of the Clean Air Act, which set Maximum Achievable Control Technology standards, and as a result the EPApublished a final rule delisting nickel from the requirements of regulation under Section 112. Both the mercury and nickelrulemaking decisions are being challenged by various states and environmental groups.
Clean Air Interstate Rule (CAIR) � In 2005, the EPA published a final CAIR that requires sulfur dioxide (SO2) and nitrogen oxide(NOx) emissions reductions from electric generating units in 28 states where their emissions are transported to downwind statesallegedly resulting in fine particulate (PM 2.5) and ozone non-attainment. The final rule requires phased reductions in SO2
emissions by 2010 and by 2015, and reductions in NOx emissions by 2009 and by 2015, eventually reaching a nationwidereduction of 65% below a 2002 baseline emission rate for each. In the final rule, through the use of modeling data, the states inwhich FPL facilities are located were determined to be contributors of PM 2.5 and/or ozone production in downwindstates. However, FPL believes that the emissions from most of its Florida generating facilities are not affecting the non-attainment status of downwind areas. In July 2005, FPL Group filed a petition for reconsideration with the EPA and a lawsuit inthe U.S. Court of Appeals for the District of Columbia challenging the SO2 and NOx provisions in CAIR. In November 2005, theEPA agreed to reconsider several issues raised regarding the final rule. The EPA plans to issue a decision on all issues byMarch 15, 2006. While the final requirements are uncertain, it is possible that the FPL generating facilities in Florida and Georgiamay be required to add additional SO2 and NOx controls or purchase emissions allowances to meet the compliance requirementsof the final rule.
Clean Air Visibility Rule − In 2005, the EPA issued the Clean Air Visibility Rule to address regional haze in areas whichinclude certain national park and wilderness areas through the installation of BART for electric generating units. BARTeligible units include those built between 1962 and 1977 that have the potential to emit more than 250 tons of visibility-impairing pollution a year. The rule requires states to identify the facilities required to install BART controls by 2008 andallows for a five-year period to implement pollution controls. While the impact of final BART requirements are uncertain, it ispossible that some of FPL’s BART eligible units may be required to add additional controls or switch fuels to meet the BARTcompliance requirements.
Clean Water Act Section 316(b) − In 2004, the EPA issued a rule under Section 316(b) of the Clean Water Act to addressintake structures at existing power plants with once-through cooling water systems. The rule requires FPL to demonstratethat it has met or will meet new impingement mortality (the loss of organisms against screens and other exclusion devices)and/or entrainment (the loss of organisms by passing them through the cooling system) reductions by complying with one offive alternatives, including the authorized use of technology, operational measures or restoration measures, and may involvethe performance of biological studies. The rules will impact eight of FPL’s generating facilities (Cape Canaveral, Cutler, FortMyers, Lauderdale, Port Everglades, Sanford, Riviera and St. Lucie). FPL will be conducting the necessary studies/analysesover the next several years and implementing solutions based upon regulatory approvals. The total cost of these solutions,as well as any ongoing biological monitoring that may be required, has not yet been determined.
Electric and Magnetic Fields. Since the 1970s, there has been public, scientific, and regulatory attention given to thequestion of whether EMF causes or contributes to adverse health effects. These fields exist whenever there is a flow ofelectricity, including in power lines, appliances and building wiring. Some epidemiological studies (which typically examinethe incidence of disease in population groups) have reported a statistical association between EMF and some types ofcancer, including childhood and adult leukemia. Other studies have not reported any such relationship. Neither theseepidemiological studies nor the more controlled laboratory studies of EMF have produced conclusive evidence that EMFcauses or contributes to any adverse health effects.
In 1999, the National Institute of Environmental Health Sciences, at the culmination of a five-year federally supportedresearch effort, pronounced that the scientific support for an EMF-cancer link is marginal and concluded that the probabilitythat EMF exposure is truly a health hazard is small but cannot be completely discounted.
In 2001, the IARC conducted an evaluation of power frequency EMF and cancer; it classified power frequency magnetic fieldsas "possibly carcinogenic" based on an association with childhood leukemia reported in some epidemiology studies. TheIARC did not conclude that power frequency EMF cause or contribute to the development of childhood leukemia or any othercancer. In 2002, the California Department of Health Services (DHS) submitted its EMF Risk Evaluation report to theCalifornia Public Utility Commission. The report concluded in part that "To one degree or another, all three of the DHS

11
scientists are inclined to believe that EMF can cause some degree of increased risk of childhood leukemia, adult braincancer, Lou Gehrig’s Disease, and miscarriage."
In 2002, the National Institute of Environmental Health Sciences said in a booklet it published on EMF: "For most healthoutcomes, there is no evidence that EMF exposures have adverse effects. There is some evidence from epidemiologystudies that exposure to power-frequency EMF is associated with an increased risk for childhood leukemia. This associationis difficult to interpret in the absence of reproducible laboratory evidence or a scientific explanation that links magnetic fieldswith childhood leukemia."
Florida has had EMF regulations in place for many years, and FPL believes it is in compliance with the FDEP regulationsregarding EMF levels within and at the edge of the rights of way for transmission lines. Future changes in the FDEPregulations could require additional capital expenditures by FPL for such things as increasing the right of way corridors orrelocating or reconfiguring transmission facilities. It is not presently known whether any such expenditures will berequired. Currently, there are no such changes proposed to the FDEP regulations.
Employees. FPL had approximately 10,200 employees at December 31, 2005. Approximately 32% of the employees arerepresented by the International Brotherhood of Electrical Workers (IBEW) under a collective bargaining agreement with FPLthat expires October 31, 2008.
FPL ENERGY OPERATIONS
General. FPL Energy, a wholly-owned subsidiary of FPL Group Capital, was formed in 1998 to aggregate FPL Group’sexisting competitive energy business. It is a limited liability company organized under the laws of Delaware. FPL Energythrough its subsidiaries currently owns, develops, constructs, manages and operates domestic electric-generating facilities inwholesale energy markets. FPL Energy also provides full service requirements services to distribution utilities in certainmarkets. FPL Energy manages or participates in the management of approximately 90% of its projects, which representapproximately 97% of the net generating capacity in which FPL Energy has an ownership interest. At December 31, 2005,FPL Energy had ownership interests in operating independent power projects with a net generating capability totaling 12,053mw (see Item 2 – Generating Facilities). Generation capacity spans various regions, thereby reducing overall volatility relatedto varying market conditions and seasonality on a portfolio basis. At December 31, 2005, the percentage of capacity byNERC region or power pool was:
NERC Region/Power Pool Percentage of Generation CapacityMAPP/RFC/SPP/ERCOT 37%NEPOOL/NYPP 24%SERC/PJM 23%WECC 16%
Fuel sources for these projects were as follows:
Fuel Source Percentage of Generation CapacityNatural Gas 54%Wind 26%Nuclear 9%Oil 6%Hydro 3%Other 2%
In June 2005, a wholly-owned subsidiary of FPL Group completed the acquisition of Gexa Corp., a retail electric provider inTexas, which serves approximately 1,200 mw of peak load to over 160,000 commercial and residential customers as ofDecember 31, 2005. The Texas commodity markets have recently experienced significant price increases, which have led someregulators, government officials and other interested parties to call for a review of the structure and operation of the Texas retailmarket. FPL Energy is unable to predict whether such review will occur or result in any changes to the marketstructure. However, if changes occur in the market structure, such changes could affect Gexa's ability to sign and retain new andexisting customers. FPL Energy will continue to monitor these events.
FPL Energy expects its future capacity growth to come primarily from wind development benefiting from the extension of theproduction tax credit program through 2007 for new wind facilities, as well as from asset acquisitions. FPL Energy plans to addapproximately 625 mw to 750 mw of new wind generation in each of 2006 and 2007, including over 700 mw which are currentlyunder construction or have been approved by FPL Group's board of directors. In January 2006, FPL Energy completed theacquisition of a 70% interest in Duane Arnold. See Nuclear Operations. Also, see the discussion of the proposed merger withConstellation Energy under FPL Group above.

12
FPL Energy’s capital expenditures and investments totaled approximately $0.9 billion, $0.4 billion and $1.6 billion in 2005,2004 and 2003, respectively. Capital expenditures for 2006 through 2010 are estimated as follows:
2006 2007 2008 2009 2010 Total(millions)
FPL Energy: Wind (a) $ 960 $ 930 $ 5 $ 5 $ 5 $ 1,905 Nuclear (b) 495 85 40 85 100 805 Gas 45 15 15 5 - 80 Other 10 10 10 10 10 50 Total $ 1,510 $ 1,040 $ 70 $ 105 $ 115 $ 2,840____________________(a) Capital expenditures for new wind projects are estimated through 2007, when eligibility for PTCs for new wind projects is scheduled
to expire.(b) Includes nuclear fuel and, in 2006, the acquisition of a 70% interest in Duane Arnold (see Nuclear Operations).
These estimates are subject to continuing review and adjustment and actual capital expenditures may vary from theseestimates. See Management’s Discussion − Liquidity and Capital Resources and Note 16 − Commitments.
Regulation. At December 31, 2005, FPL Energy had ownership interests in operating independent power projects thathave received exempt wholesale generator status as defined under the Holding Company Act, which represent approximately96% of FPL Energy’s net generating capacity. Exempt wholesale generators own or operate a facility exclusively to sellelectricity to wholesale customers. They are barred from selling electricity directly to retail customers. FPL Energy’s exemptwholesale generators produce electricity from wind, hydropower, fossil fuels and nuclear facilities. In addition, approximately4% of FPL Energy’s net generating capacity has qualifying facility status under PURPA. FPL Energy’s qualifying facilitiesgenerate electricity from wind, solar, fossil fuels, biomass or waste-product combustion. Qualifying facility status exempts theprojects from, among other things, many of the provisions of the Federal Power Act, as well as state laws and regulationsrelating to rates and financial or organizational regulation of electric utilities. While projects with qualifying facility and exemptwholesale generator status are exempt from various restrictions, each project must still comply with other federal, state andlocal laws, including those regarding siting, construction, operation, licensing, pollution abatement and other environmentallaws.
FPL Energy continues to evaluate developing regional market designs. California is scheduled to implement a revised marketdesign in 2007. ERCOT is considering adopting a revised market design with potential implementation in 2009. In bothmarkets, the final market design is not fully known at this time and FPL Energy is currently unable to determine the effects, ifany, on its operations resulting from the implementation of such market designs.
Competition. Competitive wholesale markets in the United States continue to evolve and vary by geographicregion. Revenues from electricity sales in these markets will vary based on the prices obtainable for energy, capacity andother ancillary services. Some of the factors affecting success in these markets include the ability to operate generatingassets efficiently and reliably, the price and supply of fuel, transmission constraints, wind and hydro resources (weatherconditions), competition from new sources of generation, effective risk management, demand growth and exposure to legaland regulatory changes.
Expanded competition in a frequently changing regulatory environment presents both opportunities and risks for FPLEnergy. Opportunities exist for the selective acquisition of generation assets divested under deregulation plans or availablefrom other competitors and for the construction and operation of efficient plants that can sell power in competitivemarkets. FPL Energy seeks to reduce its market risk by having a diversified portfolio, by fuel type and location, as well as bycontracting for the sale of a significant amount of the electricity output of its plants. As of December 31, 2005, FPL Energyhad 86% of its on-peak capacity under contract for 2006. Over the last several years, contracting for the sale of electricityoutput was more difficult as a result of overcapacity in certain regions and diminished market liquidity due to fewercreditworthy counterparties. However, the major markets in which FPL Energy operates have shown signs of continuedimprovement since 2004, such as improved spark spreads and energy prices in ERCOT and NEPOOL. The combination ofnew wind projects, expected increase in contribution from merchant assets and asset acquisitions are expected to be the keydrivers in supporting FPL Energy’s growth over the next few years.
Portfolio by Category. FPL Energy’s assets can be categorized into the following three groups: wind assets, contractedassets and merchant assets.

13
As of December 31, 2005, FPL Energy’s capacity under contract for 2006 and 2007 was as follows:
2006 2007
Project Portfolio CategoryAvailable
MW (a)
% MWUnder Contract
AvailableMW (a)
% MWUnder Contract
Wind 3,166 97% (b) 3,287 93% (b)
Contracted (c) 2,461 99% (b) 2,461 99% (b)
Merchant: (d)
NEPOOL 2,281 74% (e) 2,454 49% (e)
ERCOT 2,598 87% (e) 2,627 37% (e)
All other 1,417 58% (e) 1,372 18% (e)
Total portfolio (f) 11,921 86% (e) 12,200 65% (e)
_____________________(a) Weighted to reflect projected in-service dates, planned maintenance, Seabrook’s planned refueling outage and power uprate in 2006, the acquisition of a 70%
interest, or approximately 415 mw, in Duane Arnold and its planned refueling outage in 2007, and expected production from renewable resource assets.(b) Reflects round-the-clock mw under contract.(c) Includes all projects with mid- to long-term purchase power contracts for substantially all of their output.(d) Includes only those facilities that require active hedging.(e) Represents on-peak mw under contract.(f) Totals may not add due to rounding.
Wind Assets − At December 31, 2005, FPL Energy had ownership interests in wind plants with a combined capacity ofapproximately 3,192 mw (net ownership). The majority of these wind assets have contracts with utilities and power marketerspredominantly under fixed-price agreements with expiration dates ranging from 2011 to 2030. FPL Energy operates all but sixof these wind facilities. Approximately 92% of FPL Energy’s net ownership in wind facilities has received exempt wholesalegenerator status as defined under the Holding Company Act. The remaining facilities have qualifying facility status underPURPA. FPL Energy’s wind facilities are located in fifteen states, thereby reducing weather-related performance risk on aportfolio basis.
FPL Energy plans to add approximately 625 mw to 750 mw of new wind generation in each of 2006 and 2007, including over700 mw which are currently under construction or have been approved by FPL Group’s board of directors.
Contracted – At December 31, 2005, FPL Energy had 2,046 mw of contracted assets. The contracted category includes allprojects with mid- to long-term contracts for substantially all of their output. Essentially all of these contracted assets wereunder power sales contracts with utilities, with contract expiration dates ranging from 2008 to 2020 and have firm fuel andtransportation agreements with expiration dates ranging from 2009 to 2033. Approximately 1,776 mw of this capacity is gas-fired generation. The remaining 270 mw uses a variety of fuels and technologies such as waste-to-energy, oil, solar, coal andpetroleum coke. As of December 31, 2005, approximately 89% of FPL Energy's contracted generating capacity is from powerplants that have received exempt wholesale generator status under the Holding Company Act, while the remaining 11% havequalifying facility status under PURPA. In January 2006, FPL Energy completed the acquisition of a 70% interest, orapproximately 415 mw, in Duane Arnold. FPL Energy is selling its share of the output of Duane Arnold to Interstate Powerand Light Company, a subsidiary of Alliant Energy Corporation (IP&L), under a long-term contract expiring in 2014. SeeNuclear Operations below.
Merchant Assets – At December 31, 2005, FPL Energy's portfolio of merchant assets includes 6,815 mw of owned nuclear,natural gas, oil and hydro generation, of which 2,700 mw is located in the ERCOT region, 2,643 mw in the NEPOOL regionand 1,472 mw in other regions. The merchant assets include 877 mw of peak generating facilities. Merchant assets areplants that do not have long-term power sales agreements to sell their output and therefore require active marketing andhedging. Approximately 77% of the merchant assets have gas supply agreements or a combination of gas supply andtransportation agreements to provide for on-peak gas requirements. PMI uses derivative instruments (primarily swaps,options and forwards) to lock in pricing and manage the commodity price risk inherent in power sales and fuelpurchases. Reducing market risk through these instruments introduces other types of risk however, primarily counterpartyand operational risks.
Nuclear Operations. FPL Energy owns an 88.23% undivided interest, or 1,076 mw, in Seabrook, a nuclear power plantlocated in New Hampshire. FPL Energy is responsible for all plant operations and the ultimate decommissioning of the plant,the cost of which will be shared on a pro-rata basis by the joint owners. See estimated decommissioning cost data in Note 1– Decommissioning of Nuclear Plants, Dismantlement of Plants and Other Accrued Asset Removal Costs – FPL Energy. InDecember 2005, FPL Energy obtained NRC approval to extend the unit's operating license from 2026 to 2030 to recapturethe period of non-operation from 1986 to 1990. FPL Energy intends to seek approval from the NRC to renew the unit'soperating license for an additional 20 years. If granted, this approval would extend the term of the NRC operating license forSeabrook to 2050. In May 2005, Seabrook completed its first phase of a power uprate which increased FPL Energy's netplant output from 1,024 mw to 1,076 mw. Seabrook is periodically removed from service to accommodate normal refuelingand maintenance outages, repairs and certain other modifications. Seabrook is scheduled to complete the second phase ofthe uprate during its next scheduled refueling outage in the fall of 2006, the estimated future costs of which are included inFPL Energy's estimated capital expenditures above. The uprate is anticipated to increase Seabrook's net plant output to1,106 mw.

14
In 2003, the NRC issued an order requiring all pressurized water reactor licensees, including Seabrook, to perform visual andvolumetric inspections of reactor vessel heads at certain scheduled refueling outages to identify if degradation such ascracking or corrosion has occurred. Seabrook will be required to perform 100% visual and volumetric inspections during thefall 2006 refueling outage, and subsequently, visual inspections every third refueling outage and volumetric inspections everyfourth refueling outage.
Seabrook has several contracts for the supply, conversion, enrichment and fabrication of nuclear fuel with expiration datesranging from 2006 to 2014. See Note 16 – Contracts. Currently, Seabrook is storing spent fuel on site pending its removalby the DOE. Under the Nuclear Waste Policy Act, the DOE was required to construct permanent disposal facilities and taketitle to and provide transportation and disposal for spent nuclear fuel by January 31, 1998 for a specified fee based on currentgeneration from nuclear power plants. The total cumulative amount of such fees paid to the DOE's nuclear waste fund forSeabrook, including amounts paid by all joint owners since the start of Seabrook's operation, is approximately $122 million, ofwhich FPL Energy has paid approximately $24 million since the date of the Seabrook acquisition. In 2004, FPL Energy andSeabrook's other joint owners filed a lawsuit against the DOE seeking damages caused by the DOE's failure to dispose ofspent nuclear fuel from the Seabrook facility. The matter is pending. For details on the current status of permanent fuelstorage with the DOE see FPL Operations – Fuel. Based on current projections, FPL Energy will lose its ability to store spentfuel at Seabrook as early as 2009. FPL Energy is proceeding with a dry cask storage system which will be placed intocommercial operation prior to 2009, the cost of which is included in FPL Energy's estimated capital expenditures above. Thiswould allow for all of Seabrook's spent fuel to be stored on site, including spent fuel storage through its license extensionperiod of 2050, if granted.
In January 2006, FPL Energy completed the acquisition of a 70% interest, or approximately 415 mw, in Duane Arnold, a nuclearpower plant located near Cedar Rapids, Iowa, from IP&L. FPL Energy is selling its share of the output of Duane Arnold to IP&L,under a long-term contract expiring in 2014. FPL Energy is responsible for management and operation of the plant, as well as forthe ultimate decommissioning of the facility, the cost of which will be shared on a pro-rata basis by the joint owners. FPL Energyexpects to file for a license extension for the plant in 2009, which, if approved, will enable the plant to continue to operate for anadditional 20 years beyond its current license expiration of 2014. Duane Arnold's next scheduled refueling outage is in February2007. Duane Arnold is using a spent fuel pool and dry cask storage for storing its spent fuel.
Energy Marketing and Trading. PMI, a subsidiary of FPL Energy, buys and sells wholesale energy commodities, suchas natural gas, oil and electricity. PMI procures natural gas and oil for FPL Energy's use in power generation. PMI also sellsthe output from FPL Energy's plants which has not been sold under long-term contracts and purchases replacementpower. PMI uses derivative instruments, such as swaps, options and forwards to manage the risk associated with fluctuatingcommodity prices and to optimize the value of FPL Energy's power generation assets. To a lesser extent, PMI engages inlimited energy trading activities to take advantage of expected future favorable price movements. FPL Energy also providesfull service requirements services to distribution utilities in certain markets. These services include load-following services,which require the supplier of energy to vary the quantity delivered based on the load demand needs of the customer, as wellas various ancillary services. The results of PMI's activities are recognized in FPL Energy's operating results. SeeManagement's Discussion – Energy Marketing and Trading and Market Risk Sensitivity, Note 1 – Energy Trading and Note 4.
Environmental. FPL Energy is subject to the same environmental laws and regulations and is affected by the sameemerging issues included in the discussion of FPL's business (see FPL Operations – Environmental). While the finalrequirements for Section 111 of the Clean Air Act for mercury emissions are uncertain, it is possible that the final Clean AirAct Mercury/Nickel Rule may require a 44 mw coal-fired FPL Energy unit in California to add additional pollution controlequipment or purchase emission allowances in order to achieve compliance with the proposed mercury emission limits. Inaddition, while the impact of final BART requirements of the Clean Air Visibility Rule are uncertain, it is possible that two ofFPL Energy's BART eligible units located in Maine may be required to add additional controls or switch fuels to meet theBART compliance requirements. Furthermore, pursuant to a rule under Section 316(b) of the Clean Water Act, two FPLEnergy plants (Seabrook and an oil-fired plant in Maine) will be required to demonstrate that they currently meet, or will meet,the prescribed performance standards for the reduction of impingement and/or entrainment at their cooling water intakesthrough technology, operational measures or restoration measures. FPL Energy will be conducting the necessarystudies/analyses over the next several years and implementing solutions based upon regulatory approvals. The total cost ofthese solutions, as well as any ongoing biological monitoring that may be required, has not yet been determined.
During 2005, FPL Energy spent approximately $2 million on capital additions to comply with environmental laws andregulations. FPL Energy's capital additions to comply with environmental laws and regulations are estimated to be $5 millionfor 2006 through 2008, including approximately $1 million in 2006, and are included in estimated capital expenditures set forthin General above.
Employees. FPL Energy had approximately 2,030 employees at December 31, 2005. Subsidiaries of FPL Energy havecollective bargaining agreements with the IBEW and the Utility Workers Union of America (UWUA), which expire in February2008 and September 2008, respectively. The IBEW and the UWUA represented approximately 5% and 10%, respectively, ofFPL Energy's employees.

15
OTHER FPL GROUP OPERATIONS
FPL Group’s Corporate and Other segment represents other business activities, primarily FPL FiberNet, that are notseparately reportable. See Note 17.
FPL FiberNet. FPL FiberNet was formed in 2000 to enhance the value of FPL Group’s fiber-optic network assets that wereoriginally built to support FPL operations. Accordingly, in 2000, FPL’s existing fiber-optic lines were transferred to FPLFiberNet. FPL FiberNet is a limited liability company organized under the laws of Delaware. FPL FiberNet leases wholesalefiber-optic network capacity and dark fiber to FPL and other customers, primarily telephone, internet and othertelecommunications companies. Dark fiber in the Florida metro market is also sold to third parties. FPL FiberNet’s primarybusiness focus is the Florida metro market. Metro networks cover Miami, Ft. Lauderdale, West Palm Beach, Tampa, St.Petersburg, Orlando and Jacksonville. FPL FiberNet also has a long-haul network within Florida that leases bandwidth atwholesale rates. At December 31, 2005, FPL FiberNet’s network consisted of approximately 2,500 route miles, whichinterconnect major cities throughout Florida.
At December 31, 2005, FPL Group’s investment in FPL FiberNet totaled approximately $203 million. FPL FiberNet investedapproximately $11 million during 2005 and plans to invest a total of $55 million over the next five years to meet customers’specific requirements and sustain its fiber-optic network.
EXECUTIVE OFFICERS OF FPL GROUP (a)
Name Age Position Effective DatePaul I. Cutler 46 Treasurer and Assistant Secretary of FPL Group
Treasurer and Assistant Secretary of FPLFebruary 19, 2003February 18, 2003
K. Michael Davis 59 Controller and Chief Accounting Officer of FPL Group May 13, 1991Vice President, Accounting, Controller and Chief Accounting Officer of FPL July 1, 1991
Moray P. Dewhurst 50 Vice President, Finance and Chief Financial Officer of FPL GroupSenior Vice President, Finance and Chief Financial Officer of FPL
July 17, 2001July 19, 2001
Robert H. Escoto 52 Vice President, Human Resources of FPL GroupAssistant Secretary of FPL GroupSenior Vice President, Human Resources of FPLAssistant Secretary of FPL
January 25, 2005November 9, 2004February 21, 2005January 25, 2005
Lewis Hay, III 50 President and Chief Executive Officer of FPL GroupChairman of the Board of FPL GroupChairman of the Board and Chief Executive Officer of FPL
June 11, 2001January 1, 2002January 1, 2002
Robert L. McGrath 52 Vice President, Engineering, Construction & Corporate Services of FPL Group February 21, 2005Senior Vice President, Engineering, Construction & Corporate Services of FPL February 21, 2005
Armando J. Olivera 56 President of FPL June 24, 2003James L. Robo 43 Vice President, Corporate Development and Strategy of FPL Group
President of FPL EnergyMarch 11, 2002July 26, 2002
Antonio Rodriguez 63 Senior Vice President, Power Generation Division of FPL July 1, 1999John A. Stall 51 Senior Vice President, Nuclear Division of FPL June 4, 2001Edward F. Tancer 44 Vice President & General Counsel of FPL Group
Assistant Secretary of FPL GroupSenior Vice President & General Counsel of FPLAssistant Secretary of FPL
February 21, 2005January 1, 1997February 21, 2005January 1, 1997
____________________(a) Executive officers are elected annually by, and serve at the pleasure of, their respective boards of directors. Except as noted below, each officer has held his
present position for five years or more and his employment history is continuous. The business experience of the executive officers is as follows: Mr. Cutler wasassistant treasurer of FPL Group from May 1999 to February 2003. He was assistant treasurer of FPL from May 1997 to February 2003. Mr. Cutler has served asassistant secretary of FPL Group and FPL since December 1997. Prior to July 17, 2001, Mr. Dewhurst was senior partner of Dean & Company, a managementconsulting and investment firm that he co-founded in 1993. Mr. Escoto was vice president, human resources of FPL from March 2004 to February 2005. Mr.Escoto has served as vice president, human resources of FPL Energy since April 2002. Prior to that, Mr. Escoto was director of human resources of FPL. Mr. Haywas president of FPL Energy from March 2000 to December 2001. Mr. McGrath was senior vice president, engineering and construction of FPL from November2002 to February 2005 and treasurer of FPL Group and FPL from January 2000 to November 2002. He was also vice president, finance and chief financial officerof FPL Energy from June 2000 to November 2002. Mr. Olivera was senior vice president, power systems of FPL from July 1999 to June 2003. Prior to March2002, Mr. Robo was president and chief executive officer of TIP, a GE Capital Company that provides trailer and storage equipment services, and GE CapitalModular Space, a supplier of mobile and modular buildings. Mr. Stall was vice president of nuclear engineering of FPL from January 2000 to June 2001. Mr.Tancer was associate general counsel of FPL Group from April 2003 to February 2005. He was also vice president and general counsel of FPL Energy fromFebruary 2001 to February 2005.
Item 1A. Risk Factors
Risks Relating to FPL Group’s and FPL’s Business
FPL Group and FPL are subject to complex laws and regulations and to changes in laws and regulations as well as changinggovernmental policies and regulatory actions, including initiatives regarding deregulation and restructuring of the energyindustry. FPL holds franchise agreements with local municipalities and counties, and must renegotiate expiringagreements. These factors may have a negative impact on the business and results of operations of FPL Group and FPL.

16
• FPL Group and FPL are subject to complex laws and regulations, and to changes in laws or regulations, including thePURPA, the Holding Company Act, the Federal Power Act, the Atomic Energy Act of 1954, as amended, the 2005Energy Act and certain sections of the Florida statutes relating to public utilities, changing governmental policies andregulatory actions, including those of the FERC, the FPSC and the legislatures and utility commissions of other states inwhich FPL Group has operations, and the NRC, with respect to, among other things, allowed rates of return, industry andrate structure, operation of nuclear power facilities, operation and construction of plant facilities, operation andconstruction of transmission facilities, acquisition, disposal, depreciation and amortization of assets and facilities,recovery of fuel and purchased power costs, decommissioning costs, ROE and equity ratio limits, and present orprospective wholesale and retail competition (including but not limited to retail wheeling and transmission costs). TheFPSC has the authority to disallow recovery by FPL of any and all costs that it considers excessive or imprudentlyincurred. The regulatory process generally restricts FPL’s ability to grow earnings and does not provide any assuranceas to achievement of earnings levels.
• FPL Group and FPL are subject to extensive federal, state and local environmental statutes as well as the effect ofchanges in or additions to applicable statutes, rules and regulations relating to air quality, water quality, wastemanagement, wildlife mortality, natural resources and health and safety that could, among other things, restrict or limitthe output of certain facilities or the use of certain fuels required for the production of electricity and/or require additionalpollution control equipment and otherwise increase costs. There are significant capital, operating and other costsassociated with compliance with these environmental statutes, rules and regulations, and those costs could be evenmore significant in the future.
• FPL Group and FPL operate in a changing market environment influenced by various legislative and regulatory initiativesregarding deregulation, regulation or restructuring of the energy industry, including deregulation or restructuring of theproduction and sale of electricity. FPL Group and its subsidiaries will need to adapt to these changes and may faceincreasing competitive pressure.
• FPL Group’s and FPL’s results of operations could be affected by FPL’s ability to renegotiate franchise agreements withmunicipalities and counties in Florida.
The operation of power generation facilities, including nuclear facilities, involves significant risks that could adversely affectthe results of operations and financial condition of FPL Group and FPL.
• The operation of power generation facilities involves many risks, including start up risks, breakdown or failure ofequipment, transmission lines or pipelines, use of new technology, the dependence on a specific fuel source, includingthe supply and transportation of fuel, or the impact of unusual or adverse weather conditions (including natural disasterssuch as hurricanes), as well as the risk of performance below expected or contracted levels of output or efficiency. Thiscould result in lost revenues and/or increased expenses, including the requirement to purchase power in the market atpotentially higher prices to meet its contractual obligations. Insurance, warranties or performance guarantees may notcover any or all of the lost revenues or increased expenses, including the cost of replacement power. In addition to theserisks, FPL Group’s and FPL’s nuclear units face certain risks that are unique to the nuclear industry including the ability tostore and/or dispose of spent nuclear fuel, the potential payment of significant retrospective insurance premiums, as wellas additional regulatory actions up to and including shutdown of the units stemming from public safety concerns, whetherat FPL Group’s and FPL’s plants, or at the plants of other nuclear operators. Breakdown or failure of an operating facilityof FPL Energy may prevent the facility from performing under applicable power sales agreements which, in certainsituations, could result in termination of the agreement or incurring a liability for liquidated damages.
The construction of, and capital improvements to, power generation facilities involve substantial risks. Should construction orcapital improvement efforts be unsuccessful, the results of operations and financial condition of FPL Group and FPL could beadversely affected.
• FPL Group’s and FPL’s ability to successfully and timely complete their power generation facilities currently underconstruction, those projects yet to begin construction or capital improvements to existing facilities within establishedbudgets is contingent upon many variables and subject to substantial risks. Should any such efforts be unsuccessful,FPL Group and FPL could be subject to additional costs, termination payments under committed contracts, and/or thewrite-off of their investment in the project or improvement.
The use of derivative contracts by FPL Group and FPL in the normal course of business could result in financial losses thatnegatively impact the results of operations of FPL Group and FPL.
• FPL Group and FPL use derivative instruments, such as swaps, options and forwards to manage their commodity andfinancial market risks, and to a lesser extent, engage in limited trading activities. FPL Group could recognize financiallosses as a result of volatility in the market values of these contracts, or if a counterparty fails to perform. In the absenceof actively quoted market prices and pricing information from external sources, the valuation of these derivativeinstruments involves management’s judgment or use of estimates. As a result, changes in the underlying assumptions oruse of alternative valuation methods could affect the reported fair value of these contracts. In addition, FPL’s use of suchinstruments could be subject to prudency challenges and if found imprudent, cost recovery could be disallowed by theFPSC.
FPL Group’s competitive energy business is subject to risks, many of which are beyond the control of FPL Group, that mayreduce the revenues and adversely impact the results of operations and financial condition of FPL Group.

17
• There are other risks associated with FPL Group’s competitive energy business. In addition to risks discussedelsewhere, risk factors specifically affecting FPL Energy’s success in competitive wholesale markets include the ability toefficiently develop and operate generating assets, the successful and timely completion of project restructuring activities,maintenance of the qualifying facility status of certain projects, the price and supply of fuel (including transportation),transmission constraints, competition from new sources of generation, excess generation capacity and demand forpower. There can be significant volatility in market prices for fuel and electricity, and there are other financial,counterparty and market risks that are beyond the control of FPL Energy. FPL Energy’s inability or failure to effectivelyhedge its assets or positions against changes in commodity prices, interest rates, counterparty credit risk or other riskmeasures could significantly impair FPL Group’s future financial results. In keeping with industry trends, a portion of FPLEnergy’s power generation facilities operate wholly or partially without long-term power purchase agreements. As aresult, power from these facilities is sold on the spot market or on a short-term contractual basis, which may affect thevolatility of FPL Group’s financial results. In addition, FPL Energy’s business depends upon transmission facilities ownedand operated by others; if transmission is disrupted or capacity is inadequate or unavailable, FPL Energy’s ability to selland deliver its wholesale power may be limited.
FPL Group’s ability to successfully identify, complete and integrate acquisitions, including the proposed merger withConstellation Energy is subject to significant risks, including the effect of increased competition for acquisitions resulting fromthe consolidation of the power industry.
• FPL Group is likely to encounter significant competition for acquisition opportunities that may become available as aresult of the consolidation of the power industry, in general, as well as the passage of the 2005 Energy Act. In addition,FPL Group may be unable to identify attractive acquisition opportunities at favorable prices and to successfully andtimely complete and integrate them.
• FPL Group’s ability to successfully complete and integrate the proposed merger between FPL Group and ConstellationEnergy is subject to certain risks and uncertainties including the ability to obtain governmental approvals of thetransaction on the proposed terms, conditions and schedule; the failure of FPL Group or Constellation Energy’sshareholders to approve the transaction; the risk that anticipated synergies will not be achieved or will take longer toachieve than expected; disruption from the transaction making it more difficult to maintain relationships with customers,employees, suppliers or governmental entities; unexpected transaction costs or liabilities; economic conditions; and otherspecific factors discussed in documents filed with the SEC by both FPL Group and Constellation Energy. These risks, aswell as other risks associated with the merger, will be more fully discussed in the joint proxy statement/prospectus thatwill be included in the Registration Statement on Form S-4 that Constellation Energy will file with the SEC in connectionwith the proposed merger.
Because FPL Group and FPL rely on access to capital markets, the inability to maintain current credit ratings and accesscapital markets on favorable terms may limit the ability of FPL Group and FPL to grow their businesses and would likelyincrease interest costs.
• FPL Group and FPL rely on access to capital markets as a significant source of liquidity for capital requirements notsatisfied by operating cash flows. The inability of FPL Group, FPL Group Capital and FPL to maintain their current creditratings could affect their ability to raise capital on favorable terms, particularly during times of uncertainty in the capitalmarkets, which, in turn, could impact FPL Group’s and FPL’s ability to grow their businesses and would likely increasetheir interest costs.
Customer growth in FPL’s service area affects FPL Group’s results of operations.
• FPL Group’s results of operations are affected by the growth in customer accounts in FPL’s service area. Customergrowth can be affected by population growth as well as economic factors in Florida, including job and income growth,housing starts and new home prices. Customer growth directly influences the demand for electricity and the need foradditional power generation and power delivery facilities at FPL.
Weather affects FPL Group’s and FPL’s results of operations.
• FPL Group’s and FPL’s results of operations are affected by changes in the weather. Weather conditions directlyinfluence the demand for electricity and natural gas and affect the price of energy commodities, and can affect theproduction of electricity at wind and hydro-powered facilities. FPL Group’s and FPL’s results of operations can beaffected by the impact of severe weather which can be destructive, causing outages and/or property damage, may affectfuel supply, and could require additional costs to be incurred. At FPL, recovery of these costs is subject to FPSCapproval.
FPL Group and FPL are subject to costs and other effects of legal proceedings as well as changes in or additions toapplicable tax laws, rates or policies, rates of inflation, accounting standards, securities laws and corporate governancerequirements.
• FPL Group and FPL are subject to costs and other effects of legal and administrative proceedings, settlements,investigations and claims, as well as the effect of new, or changes in, tax laws, rates or policies, rates of inflation,accounting standards, securities laws and corporate governance requirements.
Threats of terrorism and catastrophic events that could result from terrorism may impact the operations of FPL Group andFPL in unpredictable ways.

18
• FPL Group and FPL are subject to direct and indirect effects of terrorist threats and activities. Generation andtransmission facilities, in general, have been identified as potential targets. The effects of terrorist threats and activitiesinclude, among other things, terrorist actions or responses to such actions or threats, the inability to generate, purchaseor transmit power, the risk of a significant slowdown in growth or a decline in the U.S. economy, delay in economicrecovery in the U.S., and the increased cost and adequacy of security and insurance.
The ability of FPL Group and FPL to obtain insurance and the terms of any available insurance coverage could be affected bynational, state or local events and company-specific events.
• FPL Group’s and FPL’s ability to obtain insurance, and the cost of and coverage provided by such insurance, could beaffected by national, state or local events as well as company-specific events.
FPL Group and FPL are subject to employee workforce factors that could affect the businesses and financial condition of FPLGroup and FPL.
• FPL Group and FPL are subject to employee workforce factors, including loss or retirement of key executives, availabilityof qualified personnel, collective bargaining agreements with union employees and work stoppage that could affect thebusinesses and financial condition of FPL Group and FPL.
Item 1B. Unresolved Staff Comments
None
Item 2. Properties
FPL Group and its subsidiaries maintain properties which are adequate for their operations. At December 31, 2005, theelectric generating, transmission, distribution and general facilities of FPL represented approximately 45%, 12%, 37% and6%, respectively, of FPL’s gross investment in electric utility plant in service.
Generating Facilities. At December 31, 2005, FPL Group had the following generating facilities:
FPL Facilities Location No. of Units Fuel Net Capability
(mw) (a)
Nuclear St. Lucie Hutchinson Island, FL 2 Nuclear 1,553(b)
Turkey Point Florida City, FL 2 Nuclear 1,386
Steam turbines Cape Canaveral Cocoa, FL 2 Oil/Gas 798 Cutler Miami, FL 2 Gas 170 Manatee Parrish, FL 2 Oil/Gas 1,620 Martin Indiantown, FL 2 Oil/Gas 1,643 Port Everglades Port Everglades, FL 4 Oil/Gas 1,200 Riviera Riviera Beach, FL 2 Oil/Gas 556 St. Johns River Power Park Jacksonville, FL 2 Coal/Petroleum Coke 232(c)
Sanford Lake Monroe, FL 1 Oil/Gas 138 Scherer Monroe County, GA 1 Coal 639(d)
Turkey Point Florida City, FL 2 Oil/Gas 785
Combined-cycle Fort Myers Fort Myers, FL 1 Gas 1,441 Lauderdale Dania, FL 2 Gas/Oil 859 Manatee Parrish, FL 1 Gas 1,107 Martin Indiantown, FL 1 Gas/Oil 1,107 Martin Indiantown, FL 2 Gas 899 Putnam Palatka, FL 2 Gas/Oil 494 Sanford Lake Monroe, FL 2 Gas 1,904
Simple-cycle combustion turbines Fort Myers Fort Myers, FL 1 Gas/Oil 326
Gas turbines/diesels Fort Myers Fort Myers, FL 12 Oil 648 Lauderdale Dania, FL 24 Oil/Gas 840 Port Everglades Port Everglades, FL 12 Oil/Gas 420 Turkey Point Florida City, FL 5 Oil 12TOTAL 20,777(e)
____________________(a) Represents FPL’s net ownership interest in plant capacity.(b) Excludes Orlando Utilities Commission’s and the FMPA’s combined share of approximately 15% of St. Lucie Unit No. 2.(c) Represents FPL’s 20% ownership interest in each of St. Johns River Power Park Units Nos. 1 and 2, which are jointly owned with JEA.(d) Represents FPL’s approximately 76% ownership of Scherer Unit No. 4, which is jointly owned with JEA.(e) Substantially all of FPL’s properties are subject to the lien of FPL’s mortgage.

19
FPL Energy Facilities LocationNo. ofUnits Fuel
Net Capability(mw)(a)
Wind Cabazon Riverside County, CA 53 Wind 40 Callahan Divide (b) Taylor County, TX 76 Wind 114 Cerro Gordo (b) Cerro Gordo County, IA 55 Wind 41 Delaware Mountain Culberson County, TX 39 Wind 30 Diablo Wind Alameda County, CA 31 Wind 21 Gray County Gray County, KS 170 Wind 112 Green Mountain Somerset County, PA 8 Wind 10 Green Power Riverside County, CA 22 Wind 17 Hancock County (b) Hancock County, IA 148 Wind 98 High Winds (b) Solano County, CA 90 Wind 162 Horse Hollow (b) Taylor County, TX 140 Wind 210 Indian Mesa Upton County, TX 125 Wind 83 King Mountain Upton County, TX 215 Wind 281 Lake Benton II (b) Pipestone County, MN 138 Wind 104 Meyersdale (b) Somerset County, PA 20 Wind 30 Mill Run Fayette County, PA 10 Wind 15 Montfort (b) Iowa County, WI 20 Wind 30 Mountaineer (b) Preston & Tucker Counties, WV 44 Wind 66 New Mexico (b) Quay & Debaca Counties, NM 136 Wind 204 North Dakota (b) LaMoure County, ND 41 Wind 62 Oklahoma / Sooner (b) Harper & Woodward Counties, OK 68 Wind 102 Sky River Kern County, CA 342 Wind 77 Somerset Wind Power Somerset County, PA 6 Wind 9 South Dakota (b) Hyde County, SD 27 Wind 41 Southwest Mesa (b) Upton & Crockett Counties, TX 107 Wind 75 Stateline (b) Umatilla County, OR and Walla Walla County, WA 454 Wind 300 Vansycle (b) Umatilla County, OR 38 Wind 25 Victory Garden Kern County, CA 96 Wind 22 Waymart (b) Wayne County, PA 43 Wind 65 Weatherford Wind Custer County, OK 98 Wind 147 Wilton Wind Burleigh County, ND 21 Wind 31(c)
Windpower Partners 1994 (b) Culberson County, TX 112 Wind 27 Woodward Mountain Upton & Pecos Counties, TX 242 Wind 160 Wyoming (b) Uinta County, WY 80 Wind 144 Investments in joint ventures Various 3,199 (d) 237 Total Wind 3,192
Contracted Bayswater (b) Far Rockaway, NY 2 Gas 56 Calhoun (b) Eastaboga, AL 4 Gas 668 Doswell (b) Ashland, VA 6 Gas/Oil 708 Jamaica Bay (b) Far Rockaway, NY 2 Oil/Gas 54 Port of Stockton Stockton, CA 1 Coal/Petroleum Coke 44
516 Investments in joint ventures Various 18 (e)
Total Contracted 2,046
Merchant Blythe Energy Blythe, CA 3 Gas 507 Doswell – Expansion (b) Ashland, VA 1 Gas/Oil 171 Forney Forney, TX 8 Gas 1,700 Lamar Power Partners Paris, TX 6 Gas 1,000 Maine Various – ME 6 Oil 656(f)
Maine Various – ME 83 Hydro 361 Marcus Hook 50 Marcus Hook, PA 1 Gas 50 Marcus Hook 750 (b) Marcus Hook, PA 4 Gas 744 RISEP (b) Johnston, RI 3 Gas 550 Seabrook Seabrook, NH 1 Nuclear 1,076(g)
Total Merchant 6,815TOTAL 12,053
_____________________(a) Represents FPL Energy's net ownership interest in plant capacity, and does not include the January 2006 acquisition of a 70% interest, or approximately 415 mw, in
Duane Arnold.(b) These consolidated generating facilities are encumbered by liens against their assets securing various financings.(c) Represents partial operations as of December 31, 2005 with the remaining 18 mw operational in January 2006.(d) Represents plants with no more than 50% ownership using wind technology.(e) Represents plants with no more than 50% ownership using fuels and technologies such as gas, waste-to-energy, solar and coal.(f) Excludes 10 other energy-related partners' combined share of 38.22%.(g) Excludes Massachusetts Municipal Wholesale Electric Company's, Taunton Municipal Lighting Plant's and Hudson Light & Power Department's combined share of
11.77%.

20
Transmission and Distribution. At December 31, 2005, FPL owned and operated the following electric transmissionand distribution lines:
NominalVoltage
Overhead LinesPole Miles
Trench and SubmarineCables Miles
500 kv 1,106(a) -230 kv 2,771 25138 kv 1,588 50115 kv 752 -69 kv 164 14Less than 69 kv 41,343 24,427Total 47,724 24,516____________________(a) Includes approximately 75 miles owned jointly with JEA.
In addition, at December 31, 2005, FPL owned and operated 543 substations, one of which is jointly owned. See Note 8.
Character of Ownership. Substantially all of FPL’s properties are subject to the lien of FPL’s mortgage, which securesmost debt securities issued by FPL. The majority of FPL Group’s principal properties are held by FPL in fee and are free fromother encumbrances, subject to minor exceptions, none of which is of such a nature as to substantially impair the usefulnessto FPL of such properties. Some of FPL’s electric lines are located on land not owned in fee but are covered by necessaryconsents of governmental authorities or rights obtained from owners of private property. A number of FPL Energy’sgenerating facilities are encumbered by liens against their assets securing various financings. See Generating Facilities andNote 1 – Electric Plant, Depreciation and Amortization.
Item 3. Legal Proceedings
In November 1999, the Attorney General of the United States, on behalf of the EPA, brought an action in the U.S. DistrictCourt for the Northern District of Georgia against Georgia Power Company and other subsidiaries of The Southern Companyfor certain alleged violations of the Prevention of Significant Deterioration (PSD) provisions and the New Source PerformanceStandards (NSPS) of the Clean Air Act. In May 2001, the EPA amended its complaint. The amended complaint alleges,among other things, that Georgia Power Company constructed and is continuing to operate Scherer Unit No. 4, in which FPLowns a 76% interest, without obtaining a PSD permit, without complying with NSPS requirements, and without applying bestavailable control technology for nitrogen oxides, sulfur dioxides and particulate matter as required by the Clean Air Act. It alsoalleges that unspecified major modifications have been made at Scherer Unit No. 4 that require its compliance with theaforementioned Clean Air Act provisions. The EPA seeks injunctive relief requiring the installation of best available controltechnology and civil penalties of up to $25,000 per day for each violation from an unspecified date after June 1, 1975 throughJanuary 30, 1997 and $27,500 per day for each violation thereafter. The EPA further revised its civil penalty rule in February2004, such that the maximum penalty is $32,500 per day for each violation after March 15, 2004. Georgia Power Companyhas answered the amended complaint, asserting that it has complied with all requirements of the Clean Air Act, denying theplaintiff's allegations of liability, denying that the plaintiff is entitled to any of the relief that it seeks and raising various otherdefenses. In June 2001, the federal district court stayed discovery and administratively closed the case pending resolution ofthe EPA's motion for consolidation of discovery in several Clean Air Act cases that was filed with a Multi-District Litigation(MDL) panel. In August 2001, the MDL panel denied the motion for consolidation. In September 2001, the EPA moved thatthe federal district court reopen this case for purposes of discovery. Georgia Power Company opposed that motion askingthat the case remain closed until the Eleventh Circuit Court of Appeals ruled on the Tennessee Valley Authority's (TVA)appeal of an EPA administrative compliance order relating to legal issues that are also central to this case. In August 2002,the federal district court denied without prejudice the EPA's motion to reopen. In June 2003, the Eleventh Circuit issued itsorder dismissing the TVA's appeal because it found the provision of the Clean Air Act allowing the EPA to issue bindingadministrative compliance orders was unconstitutional, and hence found that the TVA order was a non-final order that courtsof appeal do not have jurisdiction to review. In September 2003, the Eleventh Circuit denied the EPA's motion forrehearing. In May 2004, the U.S. Supreme Court denied the EPA's petition for review of the Eleventh Circuit order. The EPAhas not yet moved to reopen the Georgia Power Company case.
In November 2001, J. W. and Ernestine M. Thomas, Chester and Marie Jenkins (since substituted for by Hazel and LamarJenkins), and Ray Norman and Jack Teague, as Co-Personal Representatives on behalf of the Estate of Robert L. Johns,served FPL Group, FPL, FPL FiberNet, FPL Group Capital and FPL Investments, Inc. (FPL Investments) as defendants in acivil action filed in the Circuit Court for Suwanee County, Florida. This action was purportedly on behalf of all property ownersin Florida (excluding railroad and public rights of way) whose property is encumbered by easements in favor of FPL, and onwhose property defendants have installed or intend to install fiber-optic cable which defendants currently lease, license orconvey or intend to lease, license or convey for non-electric transmission or distribution purposes. The lawsuit alleged thatFPL's easements do not permit the installation and use of fiber-optic cable for general communication purposes. Theplaintiffs asserted claims for unlawful detainer, unjust enrichment and constructive trust and sought injunctive relief andcompensatory damages. In May 2002, plaintiffs filed an amended complaint, adding allegations regarding the installation ofwireless communications equipment on some easements, and adding a claim for declaratory relief. Defendants filed ananswer and affirmative defenses to the amended complaint in August 2002. Motions for summary judgment by FPL Group,

21
FPL Group Capital and FPL Investments were granted, and they were dismissed from this lawsuit. In February 2004, theplaintiffs filed a motion for leave to file their third amended complaint adding four more plaintiffs and seeking leave to add aclaim for punitive damages, and a hearing on this motion was held on April 29, 2005. In July 2005, the parties executed asettlement agreement, subject to court approval. The settlement resolved all aspects of the case and does not contain anyadmission of liability or wrongdoing by any of the FPL Group companies. The court entered its final order and judgmentapproving the settlement in January 2006.
In August 2001, FMPA filed with the U.S. Court of Appeals for the District of Columbia (DC Circuit) a petition for review askingthe DC Circuit to reverse and remand orders of the FERC denying FMPA’s request for credits for transmission facilities ownedby FMPA members. The transmission credits sought by FMPA would offset the transmission charges that FPL bills FMPA fornetwork transmission service to FMPA’s member cities. FMPA member cities have been taking network transmission serviceunder FPL’s open access transmission tariff since 1996. In the orders appealed by FMPA, the FERC ruled that FMPA wouldbe entitled to credits for any FMPA facilities that were "integrated" with the FPL transmission system. Based on the evidencesubmitted, the FERC concluded that none of the FMPA facilities met the integration test and, therefore, FMPA was notentitled to credits against FPL’s charges for transmission service. In January 2003, the DC Circuit upheld the FERC’s orderdenying FMPA credits for its facilities; in March 2003, the DC Circuit denied FMPA’s rehearing request of the DC Circuit’sdecision; and in October 2003, the U.S. Supreme Court denied FMPA’s petition for review of the DC Circuit’s decision.
FMPA also has requested that the FERC decide the same crediting issue in a separate FERC proceeding. That proceedingdates back to a filing by FPL in 1993 of a comprehensive restructuring of its then-existing tariff structure. All issues in thatcase were settled in September 2000 except for three issues reserved by FMPA: (i) the crediting issue, (ii) treatment ofbehind-the-meter generation and load ratio pricing for network integration transmission service, and (iii) exclusions from FPL’stransmission rates of the costs of FPL’s facilities that failed to meet the same integration test that was applied to FMPA’sfacilities with respect to the crediting issue. In December 2003, the FERC issued an order addressing the three reservedissues. With respect to the crediting issue, the FERC stated that it had previously determined that FMPA was not entitled tocredits for its facilities in the related proceeding discussed above and saw no persuasive reason to revisit that determinationin this proceeding. Regarding the issue of behind-the-meter generation, the FERC stated that it had addressed the issue ofload ratio pricing for network integration transmission service and the related issue of behind-the-meter generation in OrderNos. 888 and 888-A, and saw no persuasive reason to revisit that determination in this proceeding. With respect to the thirdissue, the FERC directed FPL to make a compliance filing of a proposed rate schedule that does not include those facilities ofFPL that fail to meet the same integration test applied to the FMPA facilities.
In January 2004, FMPA requested a "conditional rehearing on the Commission’s failure to order rate credits solely in theevent that Commission does not adequately reduce FPL’s rate base to achieve comparability," and challenging the FERC’sdetermination not to revisit the issue of behind-the-meter generation and load ratio pricing for network integrationtransmission service. In March 2004, the FERC issued an order denying FMPA’s rehearing request. In April 2004, FMPApetitioned the DC Circuit for review of the FERC’s December 2003 order and March 2004 order. FMPA filed its initial brief inthat proceeding in October 2004. FMPA’s arguments are limited to the issue of behind-the-meter generation and load ratiopricing for network integration transmission service in instances when, according to FMPA, FPL cannot provide transmissionservice because of "physical transmission limitations." In June 2005, the DC Circuit remanded the case to the FERC forfurther consideration. The DC Circuit concluded that the FERC failed to explain in its orders why network customers shouldbe charged by the transmission provider for network service that the provider is physically constrained from offering and whyphysical impossibility should not be recognized as an exception to the general rule against permitting partial load ratio pricingfor network customers. The DC Circuit noted that it was not reaching a determination on whether charging on a full load basisin fact is unjust and unreasonable under the circumstances, that it was not defining what constitutes physical impossibility,and that it was not determining whether FMPA made a showing of impossibility. In December 2005, the FERC issued anorder on remand answering the DC Circuit’s question by finding that FPL is entitled to load ratio share pricing,notwithstanding constraints on a third-party’s system. In January 2006, FMPA filed a rehearing request of this order with theFERC.
In May 2004, FPL made a compliance filing of a proposed rate schedule that does not include those facilities of FPL that failto meet the same integration test that was applied to the FMPA facilities. Pursuant to this filing, 1.63% of FPL's transmissionfacilities do not satisfy the integration standard and FPL's current network transmission rate would be reduced by $0.02 perkilowatt (kw) per month. In June 2004, FMPA filed a protest to FPL's compliance filing, which protest would excludeapproximately 30% of FPL's transmission facilities and reduce FPL's current network transmission rate by approximately$0.41 per kw per month. In January 2005, the FERC issued an order on FPL's compliance filing. In the order, the FERCaccepted FPL's standards for analyzing the transmission system and agreed that FPL's "Georgia Ties" and "Turkey PointLines" are part of FPL's integrated grid. The FERC required FPL to make an additional compliance filing removing the cost ofall radial transmission lines from transmission rates, rather than only radial lines that serve one customer, analyzing the FPLtransmission system to remove the cost of any transmission facilities that provide only "unneeded redundancy," andcalculating rate adjustments using 1993 data rather than 1998 data. FPL made this compliance filing in April 2005, reducingFPL’s rate $0.04 per kw per month resulting in a refund obligation to FMPA of approximately $3 million at December 31,2005. In May 2005, FMPA protested FPL’s compliance filing, claiming that FPL had not followed the FERC’s mandate andargued that FPL’s rates should be reduced by an additional $0.20, potentially resulting in a refund obligation to FMPA ofapproximately $18 million at December 31, 2005. Any reduction in FPL’s network service rate also would apply effectiveJanuary 1, 2004 to Seminole Electric Cooperative Inc. (Seminole), FPL’s other network customer. The refund obligation toSeminole at December 31, 2005 would be approximately $1 million under FPL’s filing and approximately $5 million based onFMPA’s position.

22
In December 2005, the FERC issued an order accepting FPL’s April 2005 compliance filing in part, rejecting it in part, anddirecting the submission of a further compliance filing. The FERC accepted FPL’s compliance filing wherein FPL proposed areduction in its rate base created by the exclusion of certain radial lines valued at $29 million net plant. However, the FERCconcluded that it is not clear whether FPL failed to test its non-radial facilities in a manner comparable to the way it testedFMPA’s facilities. The December 2005 order asks FPL to make a further compliance filing in 60 days to explain the meaningof "unserved load" as it applies to Florida Reliability Coordinating Council (FRCC) standards, and to remove from rates anyfacility where the unserved load occurred only as a result of the contingency facility. The FERC noted that FRCC and NERCstandards allow for the controlled loss of load on radial facilities and that FPL tested FMPA facilities for loss of local load aswell as load at other load centers. FPL filed a rehearing request in January 2006, contending that the FERC misappliedFRCC/NERC planning criteria for radial facilities to network systems and misinterpreted the test FPL applied to FMPAfacilities. FPL also filed a request to delay the compliance filing pending FERC action on FPL’s rehearing request.
In 1995 and 1996, FPL Group, through an indirect subsidiary, purchased from Adelphia Communications Corporation(Adelphia) 1,091,524 shares of Adelphia common stock and 20,000 shares of Adelphia preferred stock (convertible into2,358,490 shares of Adelphia common stock) for an aggregate price of approximately $35,900,000. On January 29, 1999,Adelphia repurchased all of these shares for $149,213,130 in cash. On June 24, 2004, Adelphia, Adelphia Cablevision,L.L.C. and the Official Committee of Unsecured Creditors of Adelphia filed a complaint against FPL Group and its indirectsubsidiary in the U.S. Bankruptcy Court, Southern District of New York. The complaint alleges that the repurchase of theseshares by Adelphia was a fraudulent transfer, in that at the time of the transaction Adelphia (i) was insolvent or was renderedinsolvent, (ii) did not receive reasonably equivalent value in exchange for the cash it paid, and (iii) was engaged or about toengage in a business or transaction for which any property remaining with Adelphia had unreasonably small capital. Thecomplaint seeks the recovery for the benefit of Adelphia's bankruptcy estate of the cash paid for the repurchased shares, plusinterest. FPL Group has filed an answer to the complaint and discovery has commenced. FPL Group believes that thecomplaint is without merit because, among other reasons, Adelphia will be unable to demonstrate that (i) Adelphia'srepurchase of shares from FPL Group, which repurchase was at the market value for those shares, was not for reasonablyequivalent value, (ii) Adelphia was insolvent at the time of the repurchase, or (iii) the repurchase left Adelphia withunreasonably small capital. The case has been set for trial in August 2007.
In February 2003, Scott and Rebecca Finestone brought an action on behalf of themselves and their son Zachary Finestonein the U.S. District Court for the Southern District of Florida alleging that their son has developed cancer (neuroblastoma) as aresult of the release and/or dissipation into the air, water, soil and underground areas of radioactive and non-radioactivehazardous materials, including strontium 90, and the release of other toxic materials from FPL's St. Lucie nuclear powerplant. The complaint, as subsequently amended, includes counts against FPL for strict liability for allegedly engaging in anultra-hazardous activity and for alleged negligence in operating the plant in a manner that allowed emissions of the foregoingmaterials and failing to limit its release of nuclear fission products as prescribed by federal and state laws andregulations. The plaintiffs seek damages in excess of $1 million. In January 2006, the court granted FPL's motion for finalsummary judgment and dismissed the case. On February 8, 2006, the plaintiffs filed a notice of appeal of the court’s decisiongranting final summary judgment for FPL.
In May 2003, Tish Blake and John Lowe, as personal representatives of the Estate of Ashton Lowe, on behalf of the estateand themselves, as surviving parents, brought an action in the U.S. District Court for the Southern District of Florida allegingthat their son developed cancer (medulo-blastoma) as a result of the release and/or dissipation into the air, water, soil andunderground areas of radioactive and non-radioactive hazardous materials, including strontium 90, and the release of othertoxic materials from FPL's St. Lucie nuclear power plant. The allegations, counts and damages demanded in the complaint,as subsequently amended, are virtually identical to those contained in the Finestone lawsuit described above. In January2006, the court granted FPL's motion for final summary judgment and dismissed the case. On February 8, 2006, the plaintiffsfiled a notice of appeal of the court’s decision granting final summary judgment for FPL.
In August 2003, Pedro C. and Emilia Roig brought an action on behalf of themselves and their son, Pedro Anthony Roig, inthe Circuit Court of the 11th Judicial Circuit in and for Miami-Dade County, Florida (the state court), which was removed inOctober 2003 to the U.S. District Court for the Southern District of Florida, against Aventis Pasteur and a number of othernamed and unnamed drug manufacturing and distribution companies and FPL, alleging that their son has suffered toxicneurological effects from mercury poisoning. The sources of mercury exposure are alleged to be vaccines containing apreservative called thimerosal that were allegedly manufactured and distributed by the drug companies, mercury amalgamdental fillings, and emissions from FPL power plants in southeast Florida. The complaint includes counts against alldefendants for civil battery and against FPL for alleged negligence in operating the plants such that the son was exposed tomercury and other heavy metals emissions. The damages demanded from FPL are for injuries and losses allegedly sufferedby the son as a result of his exposure to the plants' mercury emissions and the parents' alleged pain and suffering, medicalexpenses, loss of wages, and loss of their son's services and companionship. No amount of damages is specified. The U.S.District Court remanded the action back to the state court. The drug manufacturing and distribution companies have movedto dismiss the action. Plaintiffs and FPL have agreed that FPL will not respond to the complaint until the state court rules onthose motions.
In December 2003, Edward and Janis Shiflett brought an action on behalf of themselves and their son, Phillip BenjaminShiflett, in the Circuit Court of the 18th Judicial Circuit in and for Brevard County, Florida (the state court), which was removedin January 2004 to the U.S. District Court for the Middle District of Florida, against Aventis Pasteur and a number of othernamed and unnamed drug manufacturing and distribution companies, FPL and the Orlando Utilities Commission, alleging

23
that their son has suffered toxic neurological effects from mercury poisoning. The allegations, counts and damagesdemanded in the complaint with respect to FPL are virtually identical to those contained in the Roig lawsuit describedabove. FPL’s motion to dismiss the complaint was denied. The U.S. District Court subsequently remanded the action back tothe state court. All parties anticipate that the drug manufacturing and distribution companies will move to dismiss theaction. Plaintiffs and FPL have agreed that FPL will not respond to the complaint until the state court rules on those motions.
In October 2004, TXU Portfolio Management Company (TXU) served FPL Energy Pecos Wind I, LP, FPL Energy Pecos WindI GP, LLC, FPL Energy Pecos Wind II, LP, FPL Energy Pecos Wind II GP, LLC and Indian Mesa Wind Farm, LP (FPL EnergyAffiliates) as defendants in a civil action filed in the District Court in Dallas County, Texas. The petition alleges that the FPLEnergy Affiliates had a contractual obligation to produce and sell to TXU a minimum quantity of energy each year and that theFPL Energy Affiliates failed to meet this obligation. The plaintiff has asserted claims for breach of contract and declaratoryjudgment and seeks damages of approximately $21 million. The FPL Energy Affiliates filed their answer and counterclaim inNovember 2004, denying the allegations. The counterclaim, as now amended, asserts claims for conversion, breach offiduciary duty, breach of warranty, conspiracy, breach of contract and fraud and seeks termination of the contract anddamages. At the end of 2005, TXU amended its complaint to add FPL Group, FPL Energy, FPL Group Capital and ESIEnergy, LLC, as defendants. Motions to dismiss those entities as defendants have been filed. The case is in discovery andhas been set for trial in October 2006.
In November 2005, Peter Rabbino and Legal Computer Consultants, Inc. brought a civil action against FPL in the CircuitCourt for Broward County, Florida. This action is purportedly on behalf of all customers of FPL that lost power due toHurricane Wilma. No class certification motion has been filed to date. The two count complaint alleges, in Count I, breach ofcontract and, in Count II, violation of a statute. Count I alleges that FPL failed to sufficiently maintain its system to preventpower outages due to inclement weather, including hurricanes. This count seeks injunctive relief requiring FPL to bury itslines or install stronger poles and consequential damages. Count II alleges that FPL is statutorily obligated to providesufficient, adequate and efficient service and that FPL was grossly negligent in carrying out this obligation resulting indamages to its customers due to Hurricane Wilma. This count seeks injunctive relief and consequential damages identical tothat sought in Count I. FPL filed a motion to dismiss based on a number of legal grounds, including the exclusive jurisdictionof the FPSC to govern these types of disputes. On February 8, 2006, the court granted FPL’s motion to dismiss, dismissingall claims in Count I with prejudice, and dismissing Count II without prejudice except as to any claims for injunctive relief,which were dismissed with prejudice.
In addition to those legal proceedings discussed above, FPL Group and its subsidiaries, including FPL, are involved in anumber of other legal proceedings and claims in the ordinary course of their businesses. In addition, generating plants inwhich FPL Group or FPL have an ownership interest are involved in legal proceedings and claims, the liabilities from which, ifany, would be shared by FPL Group or FPL.
In the event that FPL Group and FPL do not prevail in these lawsuits, there may be a material adverse effect on their financialstatements. However, FPL Group and FPL believe that they have meritorious defenses to all the pending litigation andproceedings discussed above under the heading Litigation and are vigorously defending the lawsuits. While management isunable to predict with certainty the outcome of the legal proceedings and claims discussed or described herein, based oncurrent knowledge it is not expected that their ultimate resolution, individually or collectively, will have a material adverseeffect on the financial statements.
Item 4. Submission of Matters to a Vote of Security Holders
None

24
PART II
Item 5. Market for the Registrants’ Common Equity, Related Stockholder Matters and Issuer Purchases ofEquity Securities
Common Stock Data. All of FPL’s common stock is owned by FPL Group. FPL Group’s common stock is traded on theNew York Stock Exchange. The high and low sales prices for the common stock of FPL Group as reported in theconsolidated transaction reporting system of the New York Stock Exchange for each quarter during the past two years are asfollows:
2005 2004Quarter High Low High Low
First $ 41.38 $ 35.90 $ 34.41 $ 31.67Second $ 42.72 $ 39.16 $ 33.63 $ 30.10Third $ 48.11 $ 40.30 $ 34.93 $ 31.21Fourth $ 48.05 $ 40.75 $ 38.05 $ 33.67
Approximate Number of Shareholders. As of the close of business on January 31, 2006, there were 32,364 holders ofrecord of FPL Group’s common stock.
Dividends. Quarterly dividends have been paid on common stock of FPL Group during the past two years in the followingamounts per share:
Quarter 2005 2004
First $ 0.355 $ 0.31Second $ 0.355 $ 0.31Third $ 0.355 $ 0.34Fourth $ 0.355 $ 0.34
The amount and timing of dividends payable on FPL Group’s common stock are within the sole discretion of FPL Group’sboard of directors. The board of directors reviews the dividend rate at least annually (generally in February) to determine itsappropriateness in light of FPL Group’s financial position and results of operations, legislative and regulatory developmentsaffecting the electric utility industry in general and FPL in particular, competitive conditions and any other factors the boarddeems relevant. The ability of FPL Group to pay dividends on its common stock is dependent upon, among other things,dividends paid to it by its subsidiaries, primarily FPL. There are no restrictions in effect that currently limit FPL’s ability to paydividends to FPL Group. In February 2006, FPL Group announced that it would increase its quarterly dividend on its commonstock from $0.355 to $0.375. See Management’s Discussion − Liquidity and Capital Resources with respect to dividendrestrictions and Note 12 − Common Stock Dividend Restrictions regarding dividends paid by FPL to FPL Group.
Issuer Purchases of Equity Securities.
The following table presents information regarding purchases made by FPL Group of its common stock:
Period
Total Numberof Shares
Purchased (a)
AveragePrice Paid
Per Share (a)
Total Number ofShares Purchased as Part of aPublicly Announced Program
Maximum Number ofShares that May Yet bePurchased Under the
Program (b)
(thousands)
10/1/05 – 10/31/05 5,350 $ 44.93 - 20,00011/1/05 – 11/30/05 422,826 $ 41.38 - 20,00012/1/05 – 12/31/05 229 $ 41.56 - 20,000
Total 428,405 -____________________(a) Represents: (1) shares of common stock purchased by FPL Group in the open market in accordance with the terms and conditions of the FPL Group
Amended and Restated Long-Term Incentive Plan (LTIP), which provides for the purchase of such shares in connection with grants and vesting of stockawards and (2) shares of common stock purchased from employees to pay certain withholding taxes upon the vesting of stock awards granted to suchemployees under the LTIP. The November 2005 period also includes 171,132 shares forfeited by an employee pursuant to an agreement without anypayment by FPL Group.
(b) In February 2005, FPL Group’s board of directors authorized a common stock repurchase plan of up to 20 million shares of common stock (after giving effectto the 2005 stock split) over an unspecified period, which plan was ratified and confirmed by FPL’s Group’s board of directors in December 2005.

25
Item 6. Selected Financial Data
Years Ended December 31,2005 2004 2003 2002 2001
SELECTED DATA OF FPL GROUP (millions, except per share amounts): Operating revenues $ 11,846 $ 10,522 $ 9,630 $ 8,173 $ 8,217 Income before cumulative effect of changes in accounting principles $ 885(a) $ 887 (a) $ 893(a) $ 695 (b) $ 781(c)
Cumulative effect of adopting FAS 142, net of income taxes of $143 $ - $ - $ - $ (222) $ - Cumulative effect of adopting FIN 46, net of income taxes of $2 $ - $ - $ (3) $ - $ - Net income $ 885(a) $ 887 (a) $ 890(d) $ 473 (e) $ 781(c)
Earnings per share of common stock: Earnings per share before cumulative effect of changes in accounting principles $ 2.33(a) $ 2.47 (a) $ 2.52(a) $ 2.01 (b) $ 2.31(c)
Cumulative effect of changes in accounting principles $ - $ - $ (0.01) $ (0.64) $ - Earnings per share $ 2.33(a) $ 2.47 (a) $ 2.51(d) $ 1.37 (e) $ 2.31(c)
Earnings per share of common stock – assuming dilution: Earnings per share before cumulative effect of changes in accounting principles $ 2.29(a) $ 2.45 (a) $ 2.51(a) $ 2.01 (b) $ 2.31(c)
Cumulative effect of changes in accounting principles $ - $ - $ (0.01) $ (0.64) $ - Earnings per share $ 2.29(a) $ 2.45 (a) $ 2.50(d) $ 1.37 (e) $ 2.31(c)
Dividends paid per share of common stock $ 1.42 $ 1.30 $ 1.20 $ 1.16 $ 1.12 Total assets (f)(g) $ 33,004 $ 28,333 $ 26,935 $ 23,185 $ 20,713 Long-term debt, excluding current maturities (f) $ 8,039 $ 8,027 $ 8,723 $ 5,790 $ 4,858 Obligations of FPL under capital lease, excluding current maturities (f) $ - $ - $ - $ 140 $ 133
SELECTED DATA OF FPL (millions): Operating revenues $ 9,528 $ 8,734 $ 8,293 $ 7,378 $ 7,477 Net income available to FPL Group $ 748 $ 749 $ 733 $ 717 $ 679(h)
Total assets (f) $ 22,726 $ 19,114 $ 17,817 $ 16,032 $ 15,174 Long-term debt, excluding current maturities (f) $ 3,271 $ 2,813 $ 3,074 $ 2,364 $ 2,579 Energy sales (kwh) 105,648 103,635 103,202 98,605 93,488 Energy sales: Residential 51.4% 50.7% 51.8% 51.6% 50.9% Commercial 41.1 40.6 40.1 40.6 40.6 Industrial 3.7 3.8 3.9 4.1 4.4 Interchange power sales 2.0 2.9 2.3 1.8 2.2 Other (i) 1.8 2.0 1.9 1.9 1.9 Total 100.0% 100.0% 100.0% 100.0% 100.0%
Approximate 60-minute peak load (mw): (j)
Summer season 22,361 20,545 19,668 19,219 18,754 Winter season 19,682 18,108 15,989 20,190 17,585 Average number of customer accounts (thousands): Residential 3,828 3,745 3,653 3,566 3,491 Commercial 470 458 445 435 427 Industrial 20 19 17 16 15 Other 4 3 2 3 2 Total 4,322 4,225 4,117 4,020 3,935
Average price per kwh (cents) (k) 8.88 8.36 7.95 7.32 8.05____________________(a) Includes net unrealized mark-to-market gains or losses associated with non-qualifying hedges.(b) Includes impairment and restructuring charges, charges related to certain wind projects and leveraged leases, a favorable settlement of litigation with the IRS and net
unrealized mark-to-market gains associated with non-qualifying hedges.(c) Includes merger-related expenses and net unrealized mark-to-market gains associated with non-qualifying hedges.(d) Includes the cumulative effect of an accounting change and net unrealized mark-to-market gains associated with non-qualifying hedges.(e) Includes the cumulative effect of an accounting change, impairment and restructuring charges, charges related to certain wind projects and leveraged leases, a
favorable settlement of litigation with the IRS and net unrealized mark-to-market gains associated with non-qualifying hedges.(f) Reflects the adoption of FIN 46 in July 2003. See Note 9.(g) Reflects the adoption of FAS 142 in January 2002. (h) Includes merger-related expenses.(i) Includes the net change in unbilled sales.(j) Winter season includes November and December of the current year and January to March of the following year.(k) Excludes interchange power sales, net change in unbilled revenues, deferrals/recoveries under cost recovery clauses and a provision, if any, for retail rate refund.
Item 7. Management’s Discussion and Analysis of Financial Condition and Results of Operations
This discussion should be read in conjunction with the Notes to Consolidated Financial Statements contained herein. In thediscussion of Results of Operations below, all comparisons are with the corresponding items in the prior year.
Overview
FPL Group is one of the nation’s largest providers of electricity-related services. Its principal subsidiary, FPL, serves morethan eight million people throughout most of the east and lower west coasts of Florida. FPL Energy, FPL Group’s competitiveenergy subsidiary, produces electricity primarily utilizing natural gas, wind and nuclear resources. Together, FPL’s and FPLEnergy’s generating assets represented approximately 32,800 mw of capacity at December 31, 2005. FPL FiberNet providesfiber-optic services to FPL, telecommunications companies and other customers throughout Florida. In December 2005, FPLGroup entered into an agreement and plan of merger with Constellation Energy. The combined company is expected to bethe nation’s largest competitive energy supplier based on generation and have the second largest electric utility portfoliobased on the number of customers served. Completion of the merger and the actual closing date depend upon thesatisfaction of a number of conditions, including shareholder approvals and the receipt of required regulatory approvals. The

26
parties believe that the proposed merger will offer both strategic and financial advantages in serving the energy marketplace,as well as generate significant cost savings and synergies, the majority of which are expected to come from the competitiveenergy businesses. These synergies are expected to result from consolidation of competitive energy business unitoperations, sharing of best practices, improved procurement strategies and consolidation of systems and supportactivities. See Note 2.
FPL obtains its operating revenues primarily from the retail sale of electricity. In August 2005, FPL and all of the intervenersin its 2005 rate case filing signed a stipulation and settlement agreement regarding FPL’s retail base rates, which wassubsequently approved by the FPSC. The 2005 rate agreement will be in effect through December 31, 2009, and thereaftershall remain in effect until terminated on the date new retail base rates become effective pursuant to an FPSC order. SeeNote 1 – Revenues and Rates. Over the last 10 years, FPL's average annual customer growth has been 2.2% whileunderlying usage growth has been 0.6%. FPL is meeting the increased demands of its customers by adding to its generationcapacity and electric transmission and distribution infrastructure. FPL plans to add approximately 1,150 mw of combined-cycle generating capacity by 2007 at a total investment of approximately $580 million. FPL's O&M expenses increased in2005 reflecting continued upward trends in nuclear maintenance and employee-related costs, as well as increasedmaintenance costs for fossil generation plants due to a number of FPL's older units going through major overhauls. Thesesame factors, along with costs associated with enhancing FPL's transmission and distribution system and uncollectibleaccounts, are expected to increase O&M expenses in 2006. FPL's business strategy is to meet the increased demands ofcustomer growth and focus on improving operating performance.
FPL Energy is in the competitive energy business with the majority of its operating revenues derived from wholesale electricitysales. Its market is diversified by region as well as by fuel source. As of December 31, 2005, approximately 86% of FPLEnergy's expected 2006 capacity was hedged against commodity price volatility. If FPL Energy's plants do not perform asexpected, this high degree of hedging could result in FPL Energy being required to purchase power, including transportation,in the market at potentially higher prices to meet its contractual obligations. FPL Energy's energy marketing and tradingbusiness is focused on reducing risk and extracting maximum value from its assets. FPL Energy, through its subsidiaries, isone of the largest producers of wind energy in the world, and with the extension of the production tax credit program throughDecember 2007, plans to continue expanding its wind portfolio in 2006 and 2007 through construction of new facilities andselective acquisitions. FPL Energy's business strategy is to maximize the value of its current portfolio, expand its U.S.market-leading wind position and build its portfolio through asset acquisitions.
Results of Operations
Summary – FPL Group's net income for the years ended December 31, 2005, 2004 and 2003 was $885 million, $887 millionand $890 million, respectively. See Note 17 for segment information. FPL Group's net income for the year endedDecember 31, 2005 reflects slightly reduced earnings at FPL and higher interest expense at Corporate and Other, partiallyoffset by improved results at FPL Energy. FPL's 2005 results reflect strong customer growth and increased usage per retailcustomer despite the impact of increased hurricane activity in 2005 versus 2004, which were more than offset by higher O&Mexpenses, depreciation and amortization and interest charges. FPL Energy’s 2005 results improved primarily due toimproved market conditions in the ERCOT and NEPOOL regions and the favorable effects of contract restructuring activitiesand asset sales, as well as the addition of new wind projects partially offset by higher interest expense. In addition, FPLGroup's and FPL Energy's net income for 2005 reflect unrealized losses from non-qualifying hedges of $112 million while2004 net income reflects unrealized losses of $3 million. The increase in unrealized mark-to-market losses associated withnon-qualifying hedge activity for 2005 is primarily attributable to increased forward power and natural gas prices, as well asthe reversal of previously recognized unrealized mark-to-market gains as the underlying transactions were realized during thisperiod. As a general rule, a loss in the non-qualifying hedge category is offset by increases in the fair value of physical assetpositions in the portfolio, which are not marked to market under generally accepted accounting principles. That is, the samefactors that affected the decline in value of the hedges in general also increase the future value of nearly all of FPL Energy’smerchant assets. Results for Corporate and Other in 2005 reflect approximately $25 million in certain state tax benefitsresulting from FPL Energy's growth throughout the United States, more than offset by higher interest expense and theabsence of the effect of a prior year resolution of various tax issues. FPL Group's net income for the year endedDecember 31, 2004 reflects reduced earnings at FPL Energy partially offset by improved results at FPL. At Corporate andOther, the impact of the favorable resolution of certain tax issues was partially offset by higher interest expense. FPL's 2004results improved as a result of strong customer growth and the settlement of shareholder litigation initiated in 2002 and 2003,but were partially offset by the impacts of three hurricanes that struck FPL's service territory during the third quarter of 2004,as well as lower customer usage due to overall milder weather. FPL Energy's 2004 results decreased due to the effect ofrestructuring activities during 2004 compared to 2003 and higher interest expense partially offset by increased earnings fromits existing portfolio as well as project additions. In addition, FPL Group's and FPL Energy’s net income for 2004 reflectunrealized losses from non-qualifying hedges of $3 million while 2003 net income reflects unrealized gains of $22 million anda $3 million charge due to a change in accounting principle. FPL Group's effective tax rate for all periods presented reflectproduction tax credits for wind projects at FPL Energy. PTCs can significantly affect FPL Group’s effective tax rate dependingon the amount of pre-tax income and wind generation. See Note 1 – Income Taxes and Note 5.
FPL Group and its subsidiaries segregate unrealized mark-to-market gains and losses on derivative transactions into twocategories. The first category, referred to as trading and managed hedge activities, represents the net unrealized effect ofactively traded positions entered into to take advantage of market price movements and to optimize the value of generationassets and related contracts. The second category, referred to as non-qualifying hedges, represents the net unrealized effectof derivative transactions entered into as economic hedges (but which do not qualify for hedge accounting under FAS 133,

27
"Accounting for Derivative Instruments and Hedging Activities," as amended) and the ineffective portion of transactionsaccounted for as cash flow hedges. These derivative transactions have been entered into to reduce FPL Group’s aggregaterisk.
FPL Group’s management uses earnings excluding certain items (adjusted earnings), which in 2005 and 2004 were the mark-to-market effect of non-qualifying hedges, internally for financial planning, for reporting of results to the Board of Directors andfor FPL Group’s employee incentive compensation plans. FPL Group also uses adjusted earnings when communicating itsearnings outlook to analysts and investors. FPL Group’s management believes adjusted earnings provide a more meaningfulrepresentation of the company’s fundamental earnings power. Although the excluded items are properly included in thedetermination of net income in accordance with generally accepted accounting principles, both the size and nature of suchitems can make period to period comparisons of operations difficult and potentially confusing.
FPL – FPL's net income available to FPL Group for 2005, 2004 and 2003 was $748 million, $749 million and $733 million,respectively. During 2005, FPL's net income benefited from strong customer growth and increased customer usage due tooverall improved weather conditions. However, the impact of increased hurricane activity, higher depreciation andamortization expense and increased O&M and interest expenses more than offset these benefits. During 2004, FPL's netincome benefited from strong customer growth, underlying customer usage growth and lower O&M expenses, includingreduced expenses associated with the settlement of shareholder litigation. In addition, AFUDC, primarily equity funds,increased during 2004 reflecting higher plant balances under construction. However, the effect of milder weather ascompared to 2003, the impact of three hurricanes and higher depreciation and amortization expense partially offset thesebenefits.
In August 2005, FPL and all of the interveners in its 2005 rate case filing signed a stipulation and settlement agreementregarding FPL's retail base rates, which was subsequently approved by the FPSC. The 2005 rate agreement will be in effectthrough December 31, 2009, and thereafter shall remain in effect until terminated on the date new retail base rates becomeeffective pursuant to an FPSC order. The 2005 rate agreement replaced a rate agreement that was effective April 15, 2002through December 31, 2005.
The 2005 rate agreement provides that retail base rates will not increase during the term of the agreement except to allowrecovery of the revenue requirements of any power plant approved pursuant to the Siting Act that achieves commercialoperation during the term of the 2005 rate agreement. The 2005 rate agreement also continues the revenue sharingmechanism in FPL's 2002 rate agreement, whereby revenues from retail base operations in excess of certain thresholds willbe shared with customers on the basis of two-thirds refunded to customers and one-third retained by FPL. Revenues fromretail base operations in excess of a second, higher threshold (cap) will be refunded 100% to customers. The revenuesharing threshold and cap for 2006 will be $3,991 million and $4,156 million, respectively, which was established by using the2005 revenue sharing threshold and cap of $3,880 million and $4,040 million, respectively, and increasing them by theaverage annual growth rate in retail kwh sales for the ten-year period ending December 31, 2005. For each succeeding year,retail base rate revenue sharing threshold and cap amounts will be established by increasing the prior year's threshold andcap by the sum of the following: (i) the average annual growth rate in retail kwh sales for the ten-year period endingDecember 31 of the preceding year multiplied by the prior year's retail base rate revenue sharing threshold and cap and (ii)the amount of any incremental base rate increases for power plants approved pursuant to the Siting Act that achievecommercial operation during the term of the 2005 rate agreement.
Under the terms of the 2005 rate agreement: (i) FPL's electric property depreciation rates will be based upon thecomprehensive depreciation studies it filed with the FPSC in March 2005; however, FPL may reduce depreciation by up to$125 million annually, (ii) FPL suspended contributions of approximately $79 million per year to its nuclear decommissioningfund beginning in September 2005, (iii) FPL suspended contributions of $20.3 million per year to its storm and propertyinsurance reserve beginning in January 2006 and has the ability to recover prudently incurred storm restoration costs, eitherthrough securitization pursuant to Section 366.8260 of the Florida Statutes or through surcharges, and (iv) FPL will beallowed to recover through a cost recovery clause prudently incurred incremental costs associated with complying with anFPSC or FERC order regarding a regional transmission organization.
FPL will not have an authorized regulatory ROE under the 2005 rate agreement for the purpose of addressing earningslevels. For all other regulatory purposes, FPL will have an ROE of 11.75%. The revenue sharing mechanism describedabove will be the appropriate and exclusive mechanism to address earnings levels. However, if FPL's regulatory ROE, asreported to the FPSC in FPL's monthly earnings surveillance report, falls below 10% during the term of the 2005 rateagreement, FPL may petition the FPSC to amend its base rates.
The 2002 rate agreement provided for a $250 million annual reduction in retail base revenues allocated to all customers byreducing customers' base rates and service charges by approximately 7%, as well as a revenue sharing mechanism basedon stated thresholds. During the term of the 2002 rate agreement, FPL did not have an authorized regulatory ROE range forthe purpose of addressing earnings levels and FPL reduced depreciation on its plant in service by $125 million each year.

28
FPL’s operating revenues consisted of the following:
Years Ended December 31,2005 2004 2003
(millions)
Retail base operations $ 3,658 $ 3,548 $ 3,560Revenue refund provision - - (3)Cost recovery clauses and other pass-through costs 5,651 4,999 4,558Other, primarily gas, transmission and wholesale sales and customer-related fees 219 187 178Total $ 9,528 $ 8,734 $ 8,293
The increase in retail base revenues for the year ended December 31, 2005 was primarily due to an increase in the averagenumber of customer accounts as well as an increase in usage per retail customer. A 2.3% increase in the average number ofcustomer accounts during 2005 increased revenue from retail base operations by approximately $82 million while the balanceof the increase, or $28 million, was primarily due to a 0.5% increase in usage per retail customer. The majority of the growthin usage was due to the effects of overall improved weather conditions which was partially offset by increased hurricaneactivity in 2005 that caused customer service interruptions throughout FPL’s service territory. The 2005 hurricanes resulted inlost revenues of approximately $52 million.
The decrease in retail base revenues in 2004 was primarily due to a decrease in usage per retail customer, partially offset bya 2.6% increase in the average number of customer accounts. A 2.7% decrease in usage per retail customer resulted in adecrease in revenues from retail base operations of approximately $100 million, primarily due to milder weather and customerservice interruptions during the three hurricanes that struck FPL’s service territory. The increase in the average number ofcustomer accounts, as well as other factors, increased revenues from retail base operations by approximately $88million. The 2004 hurricanes resulted in lost revenues of approximately $38 million.
Revenues from cost recovery clauses and other pass-through costs, such as franchise fees, revenue taxes and storm costrecoveries do not significantly affect net income; however, under- or over-recovery of such costs can significantly affect FPLGroup’s and FPL’s operating cash flows. Fluctuations in these revenues, as well as in fuel, purchased power and interchangeexpense are primarily driven by changes in energy sales, fuel prices and capacity charges. Ordinarily, the fuel charge is setannually based on estimated fuel costs and estimated customer usage, plus or minus a true-up for prior periodestimates. Effective January 1, 2003, the FPSC approved a risk management fuel procurement program, which is intended toreduce the risk of unexpected fuel price volatility by locking in fuel prices for a portion of FPL’s fuel requirements. The resultsof the program are reviewed by the FPSC as part of the annual review of fuel costs. Revenues from cost recovery clausesand other pass-through costs increased effective January 1, 2005, primarily as a result of additional fuel clause revenues dueto an increase of approximately 6% in the fuel clause recovery factor as a result of higher fuel prices. The effect of higher fuelprices also was the primary contributor to the $872 million increase in deferred clause and franchise expenses (current andnoncurrent, collectively) on FPL Group’s and FPL’s consolidated balance sheets at December 31, 2005, and negativelyaffected FPL Group’s and FPL’s cash flows from operations for the year ended December 31, 2005. In February 2005, FPLbegan recovering the 2004 storm restoration cost deficiency from retail customers. For the year ended December 31, 2005,the amount billed to customers related to these storm restoration cost recoveries amounted to approximately $155 million andthe corresponding expense for the amortization of the storm reserve deficiency is shown as a separate line on theconsolidated statements of income. For further discussion, see Note 1 – Storm Reserve Deficiency.
FPL's O&M expenses increased approximately $79 million in 2005 primarily due to higher employee benefits expenses ofapproximately $28 million, higher nuclear maintenance costs of approximately $19 million and higher fossil generation costsof approximately $18 million, as well as the absence of a $21 million settlement related to shareholder litigation whichreduced O&M expenses in 2004. In addition, part of the O&M expense increase relates to approximately $17 million ofexpenses associated with increased nuclear security costs which are recovered through the capacity clause. The overallincrease in O&M expenses was partially offset by a reversal of a prior year reserve of approximately $15 million related to2004 storm costs that were subsequently determined to be recoverable pursuant to a 2005 FPSC order. Increased employeebenefits expenses are primarily associated with the absence of a pension transition credit that was fully amortized by the endof 2004 and higher employee costs. The increase in fossil generation expense relates primarily to the introduction of theMartin and Manatee expansion as well as timing of overhaul maintenance at some of the older generatingunits. Management expects to see a continued upward trend in O&M expenses for 2006, primarily driven by nuclearmaintenance, uncollectible accounts as a result of higher customer bills primarily related to fuel charges and employee-related costs, as well as costs associated with enhancing FPL's transmission and distribution system as part of its StormSecure Plan and an increase in maintenance costs for fossil generation plants as major overhauls continue for a number ofolder generating units. Partly offsetting the increased costs is the suspension of contributions to the storm and propertyinsurance reserve as specified in the 2005 rate agreement.
In conjunction with an NRC order, FPL has performed visual and volumetric inspections of its nuclear units' reactor vesselheads during their scheduled refueling outages since October 2002. FPL replaced the reactor vessel heads at Turkey PointUnit No. 3, Turkey Point Unit No. 4 and St. Lucie Unit No. 1 during their scheduled refueling outages in the fall of 2004, springof 2005 and fall of 2005, respectively, and therefore no further inspections will be required at these units until 2009. Theinspections during scheduled refueling outages at St. Lucie Unit No. 2 revealed CRDM nozzles with cracks, which were

29
repaired during the outages in 2003 and 2005. It is anticipated that additional CRDM nozzle repairs will be needed at St.Lucie Unit No. 2’s next scheduled outage scheduled for the spring of 2006. FPL intends to replace the reactor vessel head atSt. Lucie Unit No. 2 during its fall 2007 scheduled refueling outage. The estimated remaining cost to replace St. Lucie UnitNo. 2’s reactor vessel head, including AFUDC, is approximately $67 million and is included in FPL’s estimated capitalexpenditures. See Note 16 – Commitments. The cost of performing inspections and any necessary repairs to the reactorvessel heads until they are replaced is being recognized as expense on a levelized basis over a five-year period beginning in2002, as authorized by the FPSC, and amounted to approximately $11 million in 2005, $10 million in 2004 and $13 million in2003.
St. Lucie Unit No. 2's steam generators are reaching the end of their useful life. As flaws are identified in individual tubes,they are plugged in order to prevent the tubes from leaking during plant operations. To date, 18.9% of these tubes have beenplugged. In January 2005, FPL received permission from the NRC to plug up to 30% of St. Lucie Unit No. 2's steamgenerator tubes. Current projections indicate that the 30% tube plugging limit could be exceeded during St. Lucie Unit No. 2'snext scheduled refueling outage in the spring of 2006. FPL is planning to repair any tubes exceeding the 30% tube plugginglimit by inserting metal sleeves inside the degraded tubes (sleeving) and has requested NRC approval to sleeve degradedtubes as an alternative to plugging. Sleeving degraded tubes is expected to increase the cost and length of theoutage. Costs accrued in 2005 associated with sleeving are reflected in the nuclear maintenance costs discussedabove. FPL intends to replace the steam generators along with the reactor vessel head at St. Lucie Unit No. 2 during its fall2007 scheduled refueling outage. The remaining cost to replace St. Lucie Unit No. 2’s steam generators, including AFUDC,is approximately $200 million and is included in FPL’s estimated capital expenditures. See Note 16 – Commitments.
In conjunction with a 2004 NRC bulletin, FPL must perform inspections of all alloy 600 and weld materials in pressurizerlocations and connected steam space piping. Due to the amount of time and cost associated with correcting potential leaks,FPL replaced St. Lucie Unit No. 1's pressurizer during its fall 2005 outage and plans to repair St. Lucie Unit No. 2'spressurizer heater sleeves and other penetrations during its scheduled refueling and steam generator and reactor vesselhead replacement outage in the fall of 2007. The estimated cost is included in FPL's estimated capital expenditures. SeeNote 16 – Commitments. Since the 2004 NRC bulletin was issued, no leaks have been identified based on inspections at St.Lucie Unit No. 2. All pressurizer penetrations and welds at Turkey Point Units Nos. 3 and 4 utilize a different material.
In 2004, O&M expenses decreased $22 million primarily reflecting the receipt of approximately $21 million associated with thesettlement of the shareholder litigation. The settlement was offset by higher nuclear maintenance costs of approximately $10million, higher insurance costs of approximately $8 million and an increase in the provision for uncollectible accountsreceivable of approximately $8 million in connection with the hurricanes. The remainder of the fluctuation in the 2004 O&Mexpenses was primarily due to the absence of certain legal expenses recorded in 2003.
For the year ended December 31, 2005, depreciation and amortization expense increased by $36 million of whichapproximately $23 million related to the addition of two new generating units at FPL's existing Martin and Manatee powerplant sites, which became operational on June 30, 2005. The remainder of the increase is primarily due to FPL's continuedinvestment in transmission and distribution expansion to support customer growth and demand. FPL expects to place anadditional approximately 1,150 mw generating unit into service at its Turkey Point site by mid-2007. The increase indepreciation and amortization expense was partially offset by the suspension, in September 2005, of FPL's nucleardecommissioning accrual which totaled approximately $79 million annually. In addition, beginning in 2006, depreciation andamortization expense will also benefit from lower depreciation and decommissioning rates approved as part of the 2005 rateagreement reflecting mainly the 20-year license extensions received for Turkey Point Units Nos. 3 and 4 and St. Lucie UnitsNos. 1 and 2. Depreciation and amortization expense in 2004 increased by $17 million, reflecting continued growth of electricutility plant in service to help meet increasing customer demand.
Interest charges for 2005 and 2004 increased primarily due to an increase of approximately 30 basis points and 40 basispoints, respectively, in average interest rates and higher average debt balances used to fund increased investment ingeneration, transmission and distribution expansion and to pay for storm restoration costs. Interest income, included in other– net in FPL's consolidated statements of income, increased in 2005 by approximately $14 million primarily due to interestaccrued on the unrecovered balance of the storm reserve deficiency and on deferred costs associated with nuclear securityas approved by the FPSC.
FPL currently faces competition from other suppliers of electrical energy to wholesale customers and from alternative energysources and self-generation for other customer groups, primarily industrial customers. In 2005, operating revenues fromwholesale and industrial customers combined represented approximately 4% of FPL's total operating revenues. Variousstates, other than Florida, have enacted legislation or have state commissions that have issued orders designed to allow retailcustomers to choose their electricity supplier. Such a regulatory restructuring, if enacted in Florida, would most likely result ina shift from cost-based rates to market-based rates for energy production and other services provided to retailcustomers. Although the legislation and initiatives in other states vary substantially, common areas of focus include whenmarket-based pricing will be available for wholesale and retail customers, what existing prudently incurred costs in excess ofthe market-based price will be recoverable and whether generating assets should be separated from transmission,distribution and other assets. It is generally believed that transmission and distribution activities would remainregulated. Within the last few years, these state restructuring efforts have diminished, and several states have delayed theimplementation or reversed previously approved restructuring legislation and rules. Management believes it is unlikely therewill be any state actions to restructure the retail electric industry in Florida in the near future. If the basis of regulation forsome or all of FPL's business changes from cost-based regulation, existing regulatory assets and liabilities would be written

30
off unless regulators specify an alternative means of recovery or refund. Further, other aspects of the business, such asgeneration assets and long-term power purchase commitments, would need to be reviewed to assess their recoverability in achanged regulatory environment. See Note 1 – Regulation.
The FPSC promotes cost competitiveness in the building of new steam generating capacity by requiring investor-ownedelectric utilities, such as FPL, to issue an RFP. The RFP process allows independent power producers and others to bid tosupply the needed generating capacity. If a bidder has the most cost-effective alternative, meets other criteria such asfinancial viability and demonstrates adequate expertise and experience in building and/or operating generation capacity of thetype proposed, the investor-owned electric utility would seek to negotiate a power purchase agreement with the selectedbidder and request that the FPSC approve the terms of the power purchase agreement and, if appropriate, provide therequired authorization for the construction of the bidder’s generation capacity. In August 2005, FPL issued part one of a two-part RFP for additional power resources beginning in 2009. FPL's self-build approach calls for building two approximately1,200 mw natural gas-fired combined-cycle units in western Palm Beach County, Florida that would be operational in 2009and 2010. In January 2006, after evaluating alternative proposals, FPL concluded that its self-build approach is the mostcost-effective alternative to satisfy the need for additional power resources in 2009 and 2010. FPL plans to issue part two ofthis RFP in 2006 soliciting competitive bids for additional power resources beginning in 2012. FPL's self-build approach callsfor building two approximately 850 mw advanced technology coal generating units that would be operational in 2012 and2013.
The FERC has jurisdiction over potential changes that could affect competition in wholesale transactions. In 1999, the FERCissued its final order on RTOs which, under a variety of structures, provides for the independent operation of transmissionsystems for a given geographic area. In early 2001, the FERC approved GridFlorida (FPL's, Progress Energy Florida, Inc.'sand Tampa Electric Company's proposed RTO) as the RTO for peninsular Florida. In late 2001, the FPSC determined thatthe RTO as proposed was not in the best interest of Florida customers and required the companies to develop a modifiedproposal. In early 2002, FPL, Progress Energy Florida, Inc. and Tampa Electric Company filed a modified RTO proposal withthe FPSC changing the structure of GridFlorida from a for-profit transmission company to a non-profit ISO. In late 2002, theFPSC approved many of the aspects of the modified RTO proposal, administratively approving recovery of GridFlorida'sincremental costs through the capacity clause. During 2004, the FPSC held workshops to address additional GridFloridaissues. In 2005, an independent consulting firm performed a cost benefit analysis of GridFlorida and concluded thatGridFlorida would not be cost effective for the retail customers of the GridFlorida participants. In January 2006, FPL and theother GridFlorida participants petitioned the FPSC to approve the withdrawal of the GridFlorida proposal.
FPL Energy – FPL Energy’s net income for 2005, 2004, and 2003 was $187 million, $172 million and $194 million,respectively, and included net unrealized mark-to-market gains (losses) on non-qualifying hedges of approximately $(112)million, $(3) million and $22 million, respectively. For further discussion of derivative instruments, see Note 4.
In 2005, net income benefited from improved results of the existing portfolio primarily reflecting improved market conditionsand higher prices in the ERCOT and NEPOOL regions, as well as the favorable effects of contract restructurings, asset salesand the addition of new projects, primarily wind, partially offset by higher interest expense and lost revenues related to theplanned Seabrook outage in 2005.
FPL Energy’s net income for the year ended December 31, 2004 decreased primarily as a result of approximately $50 millionof higher net losses associated with restructuring activities and higher interest expense, partially offset by the addition of newprojects, primarily wind, and improved results of the existing portfolio primarily due to improved market conditions, particularlyin the NEPOOL region, and the absence of an outage at Seabrook that affected 2003 results.
FPL Energy added over 1,300 mw of gas-fired, wind and solar generation since late 2004 which added approximately $29million to net income. This contribution was partially offset by losses associated with Gexa, a retail electric provider in Texasacquired in June 2005. The net effect of these additions resulted in a net increase to 2005 net income of approximately $14million. FPL Energy’s operating revenues increased $516 million in 2005 primarily driven by improved market conditionsmainly in the ERCOT and NEPOOL regions, project additions and improved hydro resources, partially offset by higherunrealized mark-to-market losses from non-qualifying hedge activity, lower generation at Seabrook due to its scheduledspring 2005 refueling outage and reduced wind resource. Operating expenses increased $552 million in 2005 primarilydriven by increased fuel prices and generation in the ERCOT and NEPOOL regions as well as by project additions which alsoresulted in higher O&M and depreciation and amortization expenses. The increase in operating expenses was partially offsetby higher unrealized mark-to-market gains from non-qualifying hedge activity. Included in operating expenses in 2004 arecharges of approximately $81 million associated with the restructuring of the Marcus Hook steam contract discussedbelow. FPL Energy expects O&M expenses to increase in 2006, primarily related to costs associated with project additionsand plant maintenance.
In 2005, earnings from investments in partnerships and joint ventures, presented as equity in earnings of equity methodinvestees, increased $30 million primarily due to the positive effects of prior contract restructurings partially offset by lowergains from non-qualifying hedge activity.
For the year ended December 31, 2005, FPL Energy’s net income also reflected higher interest expense of $43 millionassociated with increased average debt balances due to growth in its asset base, as well as a 56 basis point increase inaverage interest rates. In addition, interest income increased by approximately $10 million in 2005 primarily related to higherinvestment income associated with the Seabrook decommissioning fund balance as well as interest income associated with a

31
bridge loan, which was originated early in 2005 in connection with an acquisition of a solar project and repaid in the thirdquarter of 2005. In addition, other – net in FPL Group’s consolidated statements of income includes approximately $43million of pre-tax gains on the sale of joint venture projects in California and a $12 million pre-tax benefit associated withobtaining an additional partnership interest in a coal plant in California. PTCs from FPL Energy’s wind projects are reflectedin FPL Energy’s earnings. PTCs are recognized as wind energy is generated based upon a per kwh rate prescribed inapplicable federal and state statutes, and amounted to approximately $129 million and $109 million in 2005 and 2004,respectively.
FPL Energy’s 2004 net income benefited from the full year effect of 3,904 mw of wind and fossil generation added during2003 and 39 mw of wind generation added during 2004. In aggregate, these project additions added approximately $30million to 2004 net income. FPL Energy’s operating revenues increased $453 million primarily driven by project additions, thecommencement of a contract for the sale of the remaining 50% of the capacity of a natural gas-fired facility in Alabama, lackof a refueling outage at the Seabrook facility, improvements in the NEPOOL region aided by higher gas prices and volatility inthe oil-gas price ratio and increased generation in the ERCOT region due to improved market conditions. Operatingexpenses increased $482 million, over half of which was fuel-related, primarily driven by project additions and the increasedgeneration in the ERCOT region. Included in operating expenses in 2004 are charges of approximately $81 millionassociated with the restructuring of the Marcus Hook steam contract, which consisted of the write-off of an auxiliary boiler ofapproximately $33 million and a $48 million contract termination payment. As a result of changes in market conditions sinceinitiation of the Marcus Hook project in the late 1990's, it became more economical to dispatch the plant during peak hoursand uneconomical to operate the auxiliary boiler to satisfy the steam contract obligation when the plant is not running.
Earnings from investments in partnerships and joint ventures for the year ended December 31, 2004 increased $5 millionfrom the prior year primarily due to the positive effects on operating results of prior contract restructurings, the receipt of aportion of a settlement related to a previous investment in an Indonesian project partially offset by unrealized losses from non-qualifying hedge activity in the portfolio in 2004 compared to gains in 2003. Also, during 2004, FPL Energy recorded a netgain of approximately $52 million on the termination of a gas supply contract and a steam agreement which was essentiallyoffset by an impairment loss recorded as a result of agreeing to sell its interest in a combined-cycle power plant inTexas. The sale was completed in 2004.
FPL Energy’s net income for the year ended 2004 also reflected higher interest expense of $56 million due to growth in thebusiness reflecting more projects being placed in service and the acquisition of new projects, as well as higher averageinterest rates of approximately 60 basis points. PTCs amounted to approximately $109 million and $78 million in 2004 and2003, respectively.
In June 2005, a wholly-owned subsidiary of FPL Group completed the acquisition of Gexa Corp., a retail electric provider in Texaswhich was valued at approximately $73 million, payable in shares of FPL Group common stock. The Texas commodity marketshave recently experienced significant price increases, which have led some regulators, government officials and other interestedparties to call for a review of the structure and operation of the Texas retail market. FPL Energy is unable to predict whether suchreview will occur or result in any changes to the market structure. However, if changes occur in the market structure, suchchanges could affect Gexa's ability to sign and retain new and existing customers. FPL Energy will continue to monitor theseevents.
In January 2006, FPL Energy completed the acquisition of a 70% interest, or approximately 415 mw, in Duane Arnold, a nuclearpower plant located near Cedar Rapids, Iowa, from IP&L. FPL Energy purchased the 70% interest, including nuclear fuel,inventory and other items for a total of approximately $373 million. FPL Energy is selling its share of the output of Duane Arnoldto IP&L at a price of approximately $46 per mwh in 2006, escalating annually to approximately $61 per mwh in 2013, under along-term contract expiring in 2014. FPL Energy is responsible for management and operation of the plant, as well as for theultimate decommissioning of the facility, the cost of which will be shared on a pro-rata basis by the joint owners. FPL Energyreceived approximately $188 million of decommissioning funds at closing. FPL Energy expects to file for a license extension forthe plant in 2009, which, if approved, will enable the plant to continue to operate for an additional 20 years beyond its currentlicense expiration of 2014.
FPL Energy expects its future capacity growth to come primarily from wind development benefiting from the extension of theproduction tax credit program through 2007 for new wind facilities, as well as from asset acquisitions. FPL Energy plans toadd approximately 625 mw to 750 mw of new wind generation in each of 2006 and 2007, including over 700 mw which arecurrently under construction or have been approved by FPL Group's board of directors.
Competitive wholesale markets in the United States continue to evolve and vary by geographic region. Revenues fromelectricity sales in these markets will vary based on the prices obtainable for energy, capacity and other ancillaryservices. Some of the factors affecting success in these markets include the ability to operate generating assets efficientlyand reliably, the price and supply of fuel, transmission constraints, wind and hydro resources (weather conditions),competition from new sources of generation, effective risk management, demand growth and exposure to legal and regulatorychanges.
Expanded competition in a frequently changing regulatory environment presents both opportunities and risks for FPLEnergy. Opportunities exist for the selective acquisition of generation assets divested under deregulation plans or availablefrom other competitors and for the construction and operation of efficient plants that can sell power in competitivemarkets. FPL Energy seeks to reduce its market risk by having a diversified portfolio, by fuel type and location, as well as bycontracting for the sale of a significant amount of the electricity output of its plants. As of December 31, 2005, FPL Energy

32
had 86% of its on-peak capacity under contract for 2006. Over the last several years, contracting for the sale of electricityoutput was more difficult as a result of overcapacity in certain regions and diminished market liquidity due to fewercreditworthy counterparties. However, the major markets in which FPL Energy operates have shown signs of continuedimprovement since 2004, such as improved sparks spreads and energy prices in ERCOT and NEPOOL. The combination ofnew wind projects, expected increase in contribution from merchant assets and asset acquisitions are expected to be the keydrivers in supporting FPL Energy’s growth over the next few years.
FPL Energy’s earnings are subject to variability due to, among other things, operational performance, commodity priceexposure, counterparty performance, weather conditions and project restructuring activities. FPL Energy’s exposure tocommodity price risk is reduced by the degree of contract coverage obtained for 2006 and 2007. As of December 31, 2005,approximately 86% of FPL Energy's expected 2006 capacity was hedged against commodity price volatility. If FPL Energy'splants do not perform as expected, this high degree of hedging could result in FPL Energy being required to purchase power,including transportation, in the market at potentially higher prices to meet its contractual obligations. As of December 31,2005, FPL Energy’s capacity under contract for 2006 and 2007 was as follows:
2006 2007
Project Portfolio CategoryAvailable
MW (a)
% MWUnder Contract
AvailableMW (a)
% MWUnder Contract
Wind 3,166 97% (b) 3,287 93% (b)
Contracted (c) 2,461 99% (b) 2,461 99% (b)
Merchant: (d)
NEPOOL 2,281 74% (e) 2,454 49% (e)
ERCOT 2,598 87% (e) 2,627 37% (e)
All other 1,417 58% (e) 1,372 18% (e)
Total portfolio (f) 11,921 86% (e) 12,200 65% (e)
_____________________(a) Weighted to reflect projected in-service dates, planned maintenance, Seabrook’s planned refueling outage and power uprate in 2006, the acquisition of a 70%
interest, or approximately 415 mw, in Duane Arnold and its planned refueling outage in 2007, and expected production from renewable resource assets. (b) Reflects round-the-clock mw under contract.(c) Includes all projects with mid- to long-term purchase power contracts for substantially all of their output.(d) Includes only those facilities that require active hedging.(e) Represents on-peak mw under contract.(f) Totals may not add due to rounding.
FPL Energy’s results are affected by natural fluctuations in weather. In addition to the effect of temperature, which isreflected in commodity prices and demand, changes in weather affect production levels of the wind portfolio as well as thehydro units in Maine. In managing its exposure to commodity prices, FPL Energy is dependent upon its counterparties toperform under their contractual obligations. FPL Energy actively manages the trade-off between market risk and credit risk,as well as exposure with individual counterparties as a function of their creditworthiness. Substantially all of FPL Energy’s2006 contracted revenues are with investment grade counterparties.
Corporate and Other – Corporate and Other is primarily comprised of interest expense, FPL FiberNet and other businessactivities as well as corporate interest income and expenses. Corporate and Other allocates interest charges to FPL Energybased on a deemed capital structure at FPL Energy of 50% debt for operating projects and 100% debt for projects underconstruction. Corporate and Other's net loss for the years ended December 31, 2005, 2004 and 2003 was $50 million, $34million and $37 million, respectively. Results for Corporate and Other in 2005 reflect approximately $25 million in certainstate tax benefits resulting from FPL Energy's growth throughout the United States and gains of approximately $10 million ($6million after tax) from the sale and termination of leveraged lease agreements, which are included in gains (losses) ondisposal of equity method investees and leveraged leases-net in FPL Group's consolidated statements of income. Operatingexpenses at Corporate and Other increased $18 million in 2005 primarily due to higher corporate expenses, including theabsence of the pension transition credit that was fully amortized in 2004. Interest expense at Corporate and Other increased$20 million primarily due to higher interest rates. Corporate and Other's 2005 results also reflect an increase in interestincome of approximately $10 million primarily related to interest on a secured third party loan that was repaid in October2005. Results from Corporate and Other for 2004 reflect certain state tax benefits resulting from FPL Energy’s growththroughout the United States as well as the resolution of other tax issues totaling approximately $30 million, partially offset byhigher interest expenses and the absence of gains at FPL FiberNet associated with restructuring two transactions in 2003.
Liquidity and Capital Resources
FPL Group and its subsidiaries, including FPL, require funds to support and grow their businesses. These funds are used forworking capital, capital expenditures and investments in or acquisitions of assets and businesses, to pay maturing debtobligations and, from time to time, to redeem outstanding debt and/or repurchase common stock. It is anticipated that theserequirements will be satisfied through a combination of internally generated funds and the issuance, from time to time, of debtand equity securities, consistent with FPL Group's and FPL's objective of maintaining, on a long-term basis, a capitalstructure that will support a strong investment grade credit rating. Credit ratings can affect FPL Group's, FPL's and FPLGroup Capital's ability to obtain short- and long-term financing, the cost of such financing and the execution of their respectivefinancing strategies.
FPL Group's cash flows from operating activities for the year ended December 31, 2005 reflect the receipt of cash collateralprimarily from FPL's counterparties related to energy contracts (margin cash deposits), under-recovered fuel costs at FPL
33
caused primarily by higher than anticipated fuel costs, the payment of 2004 and 2005 storm restoration costs and recoveriesfrom customers of a portion of the 2004 storm restoration costs. See Note 1 – Storm Reserve Deficiency. The cash collateralamounts associated with energy contracts can fluctuate significantly as a result of, among other things, commodity pricemovements in the underlying contracts.
FPL Group’s cash flows from investing activities for the year ended December 31, 2005 reflect continuing investment by FPLto meet customer demand of approximately $1.6 billion and new investments at FPL Energy of approximately $815 million, aswell as FPL Group Capital’s receipt of approximately $218 million in full payment of a secured third party loan.
During 2005, FPL Group generated proceeds of approximately $2.7 billion from financing activities, including approximately$575 million from the sale of FPL Group common stock related to the Corporate Units issued in February 2002, the issuanceof $600 million in first mortgage bonds at FPL, approximately $821 million from the issuance of limited-recourse seniorsecured bonds, limited-recourse floating rate notes and draws on a construction revolver by FPL Energy subsidiaries,approximately $64 million related to the exercise of stock options and warrants and a net increase in commercial paper of$667 million. During 2005, FPL Group used approximately $1.2 billion to pay off maturing debt, and redeem or makeprincipal payments on debt and preferred stock. Maturities, redemptions and principal payments during 2005 included thematurity of $600 million in debentures at FPL Group Capital and $500 million in first mortgage bonds at FPL, the redemptionof $5 million of FPL preferred stock held by third parties, a redemption of approximately $5 million in 7.35% bonds at FPLGroup Capital and principal payments of approximately $110 million at FPL Energy. Also during 2005, FPL Energysubsidiaries entered into two interest rate swap agreements. One swap associated with a variable rate construction revolver,was to receive LIBOR and pay a fixed rate of 4.255% to hedge specified notional amounts ranging from approximately $4million to $6 million through November 2007 and approximately $163 million from November 2007 until the related debtmatures in June 2008. The other swap was to receive LIBOR and pay a fixed rate of 4.905% on $266 million of a limitedrecourse note. In addition, in November 2005, FPL Group Capital reset the annual interest rate on $506 million principalamount of its debentures due February 2008 from 5.0% to 5.551%. These debentures were originally issued in June 2002 inconnection with FPL Group's publicly-traded equity units known as Corporate Units. The interest rate was reset as a result ofFPL Group Capital remarketing these debentures. Neither FPL Group nor FPL Group Capital received any proceeds from theremarketing of the debentures. See further discussion of interest rate swaps in Note 10 − Interest Rate Swaps.
In January 2006, FPL issued $400 million of 5.65% first mortgage bonds maturing in 2037. In February 2006, FPL Grouppaid net approximately $48 million to cancel approximately 4.2 million of its Corporate Units sold in June 2002. Also inFebruary 2006, FPL Group issued approximately 8.7 million shares of common stock in return for approximately $296 millionin proceeds, upon settlement of the stock purchase contracts issued in connection with its Corporate Units sold in June 2002.
The following provides various metrics regarding FPL Group's (including FPL's) and FPL's outstanding debt:
FPL Group FPLDecember 31,
2005December 31,
2004December 31,
2005December 31,
2004
Weighted-average annual interest rate (a) 5.9% 5.4% 5.2% 4.9%Weighted-average life (years) 9.3 8.7 15.1 14.3Annual average of floating rate debt to total debt (a) 35% 31% 40% 34%____________________(a) Calculations include interest rate swaps.
FPL was impacted by Hurricanes Dennis, Katrina, Rita and Wilma in 2005 and by Hurricanes Charley, Frances and Jeanne in2004. These hurricanes did major damage in parts of FPL's service territory and collectively resulted in customer poweroutages in 2005 and 2004 of 5.3 million and 5.4 million, respectively. At December 31, 2005, storm restoration costs incurredby FPL during 2005 and 2004 exceeded the amount in the storm and property insurance reserve. At December 31, 2005,FPL's storm reserve deficiency totaled approximately $1.1 billion. The storm reserve deficiency associated with the 2004hurricanes, plus interest, is being recovered primarily through a storm damage surcharge applied to retail customer bills overa 36-month period that began in February 2005, and totaled approximately $297 million at December 31, 2005. Theremaining balance of the storm reserve deficiency primarily relates to the storm restoration costs associated with 2005hurricanes. In January 2006, FPL petitioned the FPSC for approval to recover approximately $1.7 billion of storm coststhrough the issuance of $1,050 million of storm recovery bonds pursuant to the securitization provisions of Section 366.8260of the Florida Statutes. The storm bond proceeds will provide for the net-of-tax recovery of the remaining balance of theunrecovered hurricane costs of $1,040 million (estimated balance as of July 31, 2006) and the replenishment of the stormreserve to approximately $650 million. If the FPSC determines that the storm restoration costs should not be securitized andinstead should be recovered through another means, FPL has recommended as an alternative recovering the 2005 hurricanecosts through a surcharge over approximately three years and implementing a separate surcharge to fund a $650 millionstorm reserve. The FPSC's decision is expected in May 2006. On February 2, 2006, several interested parties filed a motionto dismiss FPL’s petition, claiming that the petition did not satisfy certain technical requirements. FPL filed its response to themotion on February 6, 2006, asserting that the requirements cited are not applicable to FPL's petition and which were met inany event. The FPSC has the right to review FPL's storm charges for prudence, and has the authority to determine themanner and timing of recovery. See Note 1 − Storm Reserve Deficiency.
In January 2006, the FPSC held an electric infrastructure workshop to discuss the damage to electric utility facilities incurreddue to recent hurricanes and to explore ways of minimizing damage and resulting outages to customers in thefuture. Presentations on hurricane issues were made by representatives of city governments, vendors and the Florida
34
utilities. On January 30, 2006, FPL filed a report with the FPSC outlining its Storm Secure Plan, a new initiative to enhanceits electrical grid as a result of heightened hurricane activity and in response to concerns expressed by the community, stateleaders and regulators. On February 7, 2006, the FPSC approved a rule that requires the Florida electric utilities to inspecttheir transmission and distribution wood poles on an eight-year inspection cycle and file an annual report with the FPSCregarding such inspections. The FPSC has scheduled a meeting for February 27, 2006 to discuss what the next step(s) willbe.
FPL Group’s charter does not limit the dividends that may be paid on its common stock. As a practical matter, the ability ofFPL Group to pay dividends on its common stock is dependent upon, among other things, dividends paid to it by itssubsidiaries, primarily FPL. During the first quarter of 2005, FPL Group increased its quarterly dividend on its common stockfrom $0.34 to $0.355 per share. In February 2006, FPL Group announced that it would increase its quarterly dividend on itscommon stock from $0.355 to $0.375. FPL pays dividends to FPL Group in a manner consistent with FPL’s long-termtargeted capital structure. FPL Group made capital contributions to FPL in 2003 of $600 million. FPL’s mortgage containsprovisions which, under certain conditions, restrict the payment of dividends to FPL Group and the issuance of additional firstmortgage bonds. In light of FPL’s current financial condition and level of earnings, management does not expect that plannedfinancing activities or dividends would be affected by these limitations.
Under the mortgage securing FPL’s first mortgage bonds, in some cases, the amount of retained earnings that FPL can useto pay cash dividends on its common stock is restricted. The restricted amount may change based on factors set out in themortgage. Other than this restriction on the payment of common stock dividends, the mortgage does not restrict FPL’s use ofretained earnings. As of December 31, 2005, no retained earnings were restricted by these provisions of the mortgage.
FPL may issue first mortgage bonds under its mortgage subject to its meeting an adjusted net earnings test set forth in themortgage, which generally requires adjusted net earnings to be at least twice the annual interest requirements on, or at least10% of the aggregate principal amount of, FPL’s first mortgage bonds including those to be issued and any other non-juniorFPL indebtedness. As of December 31, 2005, after giving effect to the January 2006 issuance of $400 million 5.65% firstmortgage bonds maturing in 2037, coverage for the 12 months ended December 31, 2005 would have been in excess of 8.5times the annual interest requirements and 5 times the aggregate principal requirements. New first mortgage bonds are alsolimited to an amount equal to the sum of 60% of unfunded property additions after adjustments to offset property retirements,the amount of retired first mortgage bonds or qualified lien bonds and the amount of cash on deposit with the mortgagetrustee. As of December 31, 2005, after giving effect to the January 2006 issuance of $400 million 5.65% first mortgagebonds maturing in 2037, FPL could have issued in excess of $5.5 billion of additional first mortgage bonds based on theunfunded property additions and in excess of $5.5 billion based on retired first mortgage bonds. As of December 31, 2005,no cash was deposited with the mortgage trustee for these purposes.
FPL Group and its subsidiaries, including FPL, have no credit rating downgrade triggers that would accelerate the maturitydates of debt outstanding. A change in ratings is not an event of default under applicable debt instruments, and while thereare conditions to drawing on the credit facilities maintained by FPL Group Capital and FPL, the maintenance of a specificminimum level of credit rating is not a condition to drawing upon those credit facilities. However, commitment fees andinterest rates on loans under the credit facilities agreements are tied to credit ratings and would increase or decrease whenratings are changed. A ratings downgrade also could reduce the accessibility and increase the cost of commercial paperissuances and additional or replacement credit facilities, and could result in the requirement that FPL Group subsidiaries,including FPL, post collateral under certain power purchase and other agreements. FPL Group subsidiaries, including FPL,may be required to post collateral in excess of collateral threshold amounts when FPL Group’s exposure to the counterpartyunder the applicable trading agreement exceeds such threshold.
Securities of FPL Group and its subsidiaries are currently rated by Moody’s Investors Service, Inc. (Moody’s), Standard &Poor’s Ratings Services (S&P) and Fitch Ratings (Fitch). At February 22, 2006, Moody’s, S&P and Fitch had assigned thefollowing credit ratings to FPL Group, FPL and FPL Group Capital:
Moody’s (a) S&P (a) Fitch (a)
FPL Group: (b)
Corporate credit rating A2 A A
FPL: (b)
Corporate credit rating A1 A/A-1 N/A First mortgage bonds Aa3 A AA- Pollution control, solid waste disposal and industrial development revenue bonds Aa3/VMIG-1 A A+ Commercial paper P-1 A-1 F-1
FPL Group Capital: (b)
Corporate credit rating N/A A/A-1 N/A Debentures A2 A- A Commercial paper P-1 A-1 F-1____________________(a) A security rating is not a recommendation to buy, sell or hold securities and should be evaluated independently of any other rating. The rating is subject to revision or
withdrawal at any time by the assigning rating organization.(b) The outlook indicated by Moody’s, S&P and Fitch is negative, watch negative and stable, respectively.
35
FPL Group’s commitments at December 31, 2005 were as follows:
2006 2007 2008 2009 2010 Thereafter Total(millions)
Long-term debt, including interest: (a)
FPL $ 306 $ 169 $ 363 $ 376 $ 144 $ 5,694 $ 7,052 FPL Energy 322 690 547 206 199 1,346 3,310 Corporate and Other 1,321 1,189 577 666 18 914 4,685Corporate Units 2 - - - - - 2Purchase obligations: FPL (b) 5,800 3,880 2,730 2,880 2,500 6,965 24,755 FPL Energy (c) 1,335 614 56 56 56 779 2,896 Corporate and Other 52 - - - - - 52Asset retirement activities: (d)
FPL (e) - - - - - 11,571 11,571 FPL Energy (f) - - - - - 1,869 1,869Total $ 9,138 $ 6,542 $ 4,273 $ 4,184 $ 2,917 $ 29,138 $ 56,192____________________(a) Includes principal, interest and interest rate swaps. Variable rate interest was computed using December 31, 2005 rates.(b) Represents required capacity and minimum payments under long-term purchased power and fuel contracts, the majority of which is recoverable through various
cost recovery clauses (see Note 16 – Contracts), and projected capital expenditures through 2010 to meet, among other things, increased electricity usage andcustomer growth, as well as capital improvements to and maintenance of existing facilities (see Note 16 – Commitments).
(c) Represents firm commitments primarily in connection with the supply of wind turbines and towers, natural gas transportation, supply and storage, firmtransmission service, nuclear fuel, a portion of its projected capital expenditures and in 2006 the acquisition of a 70% interest in Duane Arnold. See Note 16 –Commitments and Contracts.
(d) Represents expected cash payments adjusted for inflation for estimated costs to perform asset retirement activities.(e) At December 31, 2005, FPL had $2,083 million in restricted trust funds for the payment of future expenditures to decommission FPL's nuclear units, which are
included in nuclear decommissioning reserve funds.(f) At December 31, 2005, FPL Energy's 88.23% portion of Seabrook's restricted trust fund for the payment of future expenditures to decommission Seabrook was
$318 million and is included in FPL Group's nuclear decommissioning reserve funds.
FPL Group and FPL obtain letters of credit and issue guarantees to facilitate commercial transactions with third parties andfinancings. At December 31, 2005, FPL Group had standby letters of credit of approximately $927 million ($14 million forFPL) and approximately $5,540 million notional amount of guarantees ($265 million for FPL), of which approximately $5,423million ($249 million for FPL) have expirations within the next five years. These letters of credit and guarantees support thebuying and selling of wholesale energy commodities, debt-related reserves and other contractual agreements. FPL Groupand FPL believe it is unlikely that they would be required to perform or otherwise incur any losses associated with theseletters of credit and guarantees. At December 31, 2005, FPL Group and FPL did not have any liabilities recorded for theseletters of credit and guarantees. In addition, FPL Group has guaranteed certain payment obligations of FPL Group Capital,including most of those under FPL Group Capital’s debt, including all of its debentures and commercial paper issuances, aswell as most of its guarantees, and FPL Group Capital has guaranteed certain debt and other obligations of FPL Energy andits subsidiaries. See Note 16 – Commitments.
In addition to the above, FPL Energy has guaranteed certain performance obligations of a power plant owned by awholly-owned subsidiary as part of a power purchase agreement that expires in 2027. Under this agreement, the subsidiarycould incur market-based liquidated damages for failure to meet contractual minimum outputs. In addition, certainsubsidiaries of FPL Energy have contracts that require certain projects to meet annual minimum generation amounts. Failureto meet the annual minimum generation amounts would result in the FPL Energy subsidiary incurring specified liquidateddamages. Based on past performance of these and similar projects and current forward prices, management believes thatthe exposure associated with these guarantees is not material.
Bank revolving lines of credit currently available to FPL Group and its subsidiaries, including FPL, are as follows:
FPL (a) FPL Group Capital Total Maturity Date(millions)
$ 2,000 $ 2,500 $ 4,500 November 2010_____________________(a) Excludes a $100 million senior secured revolving credit facility of a consolidated FPL VIE that leases nuclear fuel to FPL, which matures in June 2009 and is
available only to the VIE.
These credit facilities provide for the issuance of letters of credit up to $4.5 billion and are available to support the companies'commercial paper programs and to provide additional liquidity in the event of a loss to the companies' or their subsidiaries'operating facilities (including, in the case of FPL, a transmission and distribution property loss), as well as for generalcorporate purposes. At December 31, 2005, letters of credit totaling $598 million were outstanding under FPL GroupCapital's credit facilities and no amounts were outstanding under FPL's credit facilities. FPL Group (which guarantees thepayment of FPL Group Capital's credit facilities pursuant to a 1998 guarantee agreement) is required to maintain a minimumratio of funded debt to total capitalization under the terms of FPL Group Capital's credit facility. FPL is required to maintain aminimum ratio of funded debt to total capitalization under the terms of FPL's credit facility. At December 31, 2005, each ofFPL Group and FPL was in compliance with its respective ratio.
36
In addition, at December 31, 2005, FPL Energy had a $50 million letter of credit outstanding. Also, FPL Group Capital andFPL have each established an uncommitted credit facility with a bank to be used for general corporate purposes. The bankmay at its discretion, upon the request of FPL Group Capital or FPL, make a short-term loan or loans to FPL Group Capital orFPL in an aggregate amount determined by the bank, which is subject to change at any time. The terms of the specificborrowings under the uncommitted credit facilities, including maturity, are set at the time borrowing requests are made by FPLGroup Capital or FPL. At December 31, 2005, there were no amounts outstanding for either FPL Group Capital or FPL underthe uncommitted credit facilities.
In addition to the bank lines of credit discussed above, a consolidated FPL VIE that leases nuclear fuel to FPL hasestablished a $100 million senior secured revolving credit facility, which expires in June 2009, to provide backup support forits commercial paper program. FPL has provided an unconditional guarantee of the payment obligations of the VIE under thecredit facility, which is included in the guarantee discussion above. At December 31, 2005, the VIE had no outstandingborrowings under the revolving credit facility and had approximately $59 million of commercial paper outstanding. FPL alsoprovides an unconditional payment guarantee of the VIE’s $135 million of 2.34% senior secured notes, maturing in June2006, which is included in the guarantee discussion above.
At February 22, 2006, FPL Group and FPL Group Capital had $2.0 billion (issuable by either or both of them up to suchaggregate amount) of available capacity under shelf registration statements. Securities that may be issued under the FPLGroup and FPL Group Capital shelf registration statements, depending on the registrant, include common stock, stockpurchase contracts, stock purchase units, preferred stock, senior debt securities, preferred trust securities and relatedsubordinated debt securities, and guarantees relating to certain of those securities. This capacity is available for, amongother things, new investment opportunities.
In February 2005, FPL Group’s board of directors approved a two-for-one stock split of FPL Group’s common stock effectiveMarch 15, 2005 (2005 stock split). FPL Group’s authorized common stock increased from 400 million to 800 millionshares. Also in February 2005, FPL Group’s board of directors authorized a new common stock repurchase plan of up to 20million shares of common stock (after giving effect to the 2005 stock split) over an unspecified period, which plan was ratifiedand confirmed by the board of directors in December 2005, and terminated a previous common stock repurchase plan. AtDecember 31, 2005, no shares had been repurchased under the repurchase plan.
In June 2005, a wholly-owned subsidiary of FPL Group completed the acquisition of Gexa Corp., a retail electric provider inTexas, which serves approximately 1,200 mw of peak load to over 160,000 commercial and residential customers as ofDecember 31, 2005. Each share of Gexa Corp.’s outstanding common stock was converted into 0.1682 of a share of FPLGroup common stock. Assuming the exercise of Gexa Corp.’s options and warrants net of cash to be received upon exercise,the aggregate value of the consideration for the acquisition of Gexa Corp. was approximately $73 million, payable in shares ofFPL Group common stock.
In December 2005, FPL Group and Constellation Energy entered into an agreement and plan of merger that is expected tocreate a combined company which will be the nation’s largest competitive energy supplier based on generation and have thesecond largest electric utility portfolio based on the number of customers served. Completion of the merger and the actualclosing date depend upon the satisfaction of a number of conditions, including shareholder approvals and the receipt ofrequired regulatory approvals. The parties believe that the proposed merger will offer both strategic and financial advantagesin serving the energy marketplace, as well as generate significant cost savings and synergies, the majority of which areexpected to come from the competitive energy businesses. These synergies are expected to result from consolidation ofcompetitive energy business unit operations, sharing of best practices, improved procurement strategies and consolidation ofsystems and support activities. In a tax free, stock-for-stock exchange, each share of Constellation Energy common stockoutstanding immediately prior to the merger will be converted into 1.444 shares of Constellation Energy common stock andeach share of FPL Group common stock outstanding immediately prior to the merger will be converted into one share ofConstellation Energy common stock. Upon completion of the merger, former FPL Group shareholders will own approximately60 percent and Constellation Energy’s shareholders will own approximately 40 percent of the combined company. SeeNote 2.
New Accounting Rules and Interpretations
Stock-Based Compensation – On January 1, 2006, FPL Group adopted FAS 123(R), "Share-Based Payment." Thestatement requires costs related to share-based payment transactions to be recognized in the financial statements based ongrant-date fair value. Because FPL Group adopted the fair value recognition provisions of FAS 123, "Accounting forStock-Based Compensation," on January 1, 2004, the adoption of FAS 123(R) will not have a significant financial impact forthe year ending December 31, 2006.
Accounting for Conditional Asset Retirement Obligations – On December 31, 2005, FPL Group and FPL adopted FIN 47,"Accounting for Conditional Asset Retirement Obligations," an interpretation of FAS 143, "Accounting for Asset RetirementObligations." See Note 15.

37
Critical Accounting Policies and Estimates
The preparation of financial statements and related disclosures in conformity with generally accepted accounting principlesrequires management to exercise judgment and make estimates and assumptions where amounts are not subject to precisemeasurement or are dependent on future events.
Critical accounting policies and estimates, which are important to the portrayal of both FPL Group’s and FPL’s financialcondition and results of operations and which require complex, subjective judgments are as follows:
Accounting for Derivatives and Hedging Activities – FPL Group and FPL use derivative instruments (primarily swaps, optionsand forwards) to manage the commodity price risk inherent in fuel and electricity contracts, optimize the value of powergeneration assets and related contracts and manage risks associated with changes in interest rates. To a lesser extent, FPLGroup and FPL also engage in limited energy trading activities to take advantage of expected favorable pricemovements. Accounting pronouncements, which require the use of fair value accounting if certain conditions are met, applynot only to traditional financial derivative instruments, but to any contract having the accounting characteristics of a derivative.
Derivative instruments, when required to be marked to market under FAS 133, as amended, are recorded on the balancesheet at fair value. Fair values for some of the longer-term contracts where liquid markets are not available are based oninternally developed models based on the forward prices for electricity and fuel. Forward prices represent the price at which abuyer or seller could contract today to purchase or sell a commodity at a future date. In general, the models estimate the fairvalue of a contract by calculating the present value of the difference between the contract price and the forward prices. Thenear term forward market for electricity is generally liquid and therefore the prices in the early years of the forward curvesreflect observable market quotes. However, in the later years, the market is much less liquid and forward price curves mustbe developed using factors including the forward prices for the commodities used as fuel to generate electricity, the expectedsystem heat rate (which measures the efficiency of power plants in converting fuel to electricity) in the region where thepurchase or sale takes place, and a fundamental forecast of expected spot prices based on modeled supply and demand inthe region. The assumptions in these models are critical since any changes therein could have a significant impact on the fairvalue of the contract. Substantially all changes in the fair value of derivatives held by FPL are deferred as a regulatory assetor liability until the contracts are settled. Upon settlement, any gains or losses will be passed through the fuel and capacityclauses. In non-rate regulated operations, predominantly FPL Energy, changes in derivative fair values are recognized incurrent earnings, unless the criteria for hedge accounting are met and the company elects to account for the derivative as ahedge. For those transactions accounted for as cash flow hedges, much of the effects of changes in fair value are reflectedin other comprehensive income (OCI), a component of common shareholders' equity, rather than being recognized in currentearnings. For those transactions accounted for as fair value hedges the effects of changes in fair value are reflected incurrent earnings offset by changes in the fair value of the item being hedged.
Since FAS 133 became effective in 2001, the FASB has discussed and, from time to time, issued implementation guidancerelated to FAS 133. In particular, much of the interpretive guidance affects when certain contracts for the purchase and saleof power and certain fuel supply contracts can be excluded from the provisions of FAS 133. Despite the large volume ofimplementation guidance, FAS 133 and the supplemental guidance does not provide specific guidance on all contractissues. As a result, significant judgment must be used in applying FAS 133 and its interpretations. The interpretation of FAS133 continues to evolve. A result of changes in interpretation could be that contracts that currently are excluded from theprovisions of FAS 133 would have to be recorded on the balance sheet at fair value, with changes in fair value recorded in theincome statement.
During the fourth quarter of 2003, FPL Group and its subsidiaries adopted EITF 03-11, which precluded certain economichedging transactions at FPL Energy from qualifying for hedge accounting treatment. Changes in fair value of thosetransactions are marked to market and reported in the non-qualifying hedge category and may result in volatility in the non-qualifying hedge category. The ongoing changes in accounting guidance relating to derivatives confirm management's beliefin the importance of segregating the effects of the unrealized mark-to-market impact of non-qualifying hedges. Without anychange in FPL Group's economic positions or the timing or amounts of future cash flows, a small change in classification ofparticular transactions can result in significant changes in net income. This could be significant to FPL Energy's resultsbecause often the economic offset to the positions which are required to be marked to market (such as the physical assetsfrom which power is generated) are not marked to market. As a consequence, net income reflects only the movement in onepart of economically linked transactions. Because of this, FPL Group's management continues to view results expressedexcluding the unrealized mark-to-market impact of the non-qualifying hedges as a meaningful measure of current periodperformance. For additional information regarding derivative instruments, see Note 4 and also see Management's Discussion– Energy Marketing and Trading and Market Risk Sensitivity.
Accounting for Pensions and Other Postretirement Benefits – FPL Group sponsors a qualified noncontributory defined benefitpension plan for substantially all employees of FPL Group and its subsidiaries. FPL Group also has a non-qualifiedsupplemental defined benefit pension plan that provides benefits to higher-level employees. In addition to pension benefits,FPL Group sponsors a substantially contributory postretirement plan for health care and split dollar life insurance benefits(other benefits) for retirees of FPL Group and its subsidiaries meeting certain eligibility requirements. The qualified pensionplan has a fully funded trust dedicated to providing the benefits under the plan. The other benefits plan has a partially fundedtrust dedicated to providing benefits related to life insurance.

38
FPL Group’s pension income net of the cost of other benefits was approximately $53 million, $81 million and $78 million forthe years ended December 31, 2005, 2004 and 2003, respectively. The corresponding amounts allocated to FPL were $38million, $63 million and $60 million, respectively. Pension income and the cost of other benefits are included in O&Mexpenses, and are calculated using a number of actuarial assumptions. Those assumptions include an expected long-termrate of return on qualified plan assets of 7.75% for all years, assumed increases in future compensation levels of 4.0% for2005 and 2004 and 4.5% for 2003, and a weighted-average discount rate of 5.50% for 2005 and 2004 and 6.00% for 2003,respectively. Based on current health care costs (as related to other benefits), the projected 2006 trend assumption used tomeasure the expected cost of health care benefits covered by the plans for all age groups are 8.50% for medical benefits and10.50% for prescription drug benefits. The rates are assumed to decrease over the next eight years to the ultimate trend rateof 5.0% and remain at that level thereafter. The ultimate trend rate is assumed to be reached in 2013 for medical costs and2017 for prescription drug costs. In developing these assumptions, FPL Group evaluated input from its actuaries, as well asinformation available in the marketplace. For the expected long-term rate of return on fund assets, FPL Group considered 10-year and 20-year historical median returns for a portfolio with an equity/bond asset mix similar to its funds. FPL Group alsoconsidered its funds’ historical compounded returns. FPL Group believes that 7.75% is a reasonable long-term rate of returnon its plans’ assets. FPL Group will continue to evaluate all of its actuarial assumptions, including its expected rate of return,at least annually, and will adjust them as necessary.
FPL Group bases its determination of pension and other benefits expense or income on a market-related valuation of assets,which reduces year-to-year volatility. This market-related valuation recognizes investment gains or losses over a five-yearperiod from the year in which they occur. Investment gains or losses for this purpose are the difference between theexpected return calculated using the market-related value of assets and the actual return realized on those assets. Since themarket-related value of assets recognizes gains or losses over a five-year period, the future value of assets will be affectedas previously deferred gains or losses are recognized. Such gains and losses together with other differences between actualresults and the estimates used in the actuarial valuations are deferred and recognized in determining pension and otherbenefits expense and income only when they exceed 10% of the greater of projected benefit obligations or the market-relatedvalue of assets.
Lowering the expected long-term rate of return on plan assets by 0.5% (from 7.75% to 7.25%) would have reduced FPLGroup’s net income for 2005 by approximately $14 million ($10 million for FPL). Lowering the discount rate assumption by0.5% would have decreased FPL Group’s net income for 2005 by approximately $5 million ($4 million for FPL). Raising thesalary increase assumption by 0.5% would have decreased FPL Group’s net income for 2005 by approximately $2 million ($1million for FPL). Assumed health care cost trend rates can have a significant effect on the amounts reported forpostretirement plans providing health care benefits. However, this effect is somewhat mitigated by the retiree cost sharingstructure incorporated in FPL Group’s other benefits plan. Increasing the assumed health care cost trend rates by 1% wouldhave reduced FPL Group’s net income for 2005 by approximately $1 million.
The fair value of plan assets has increased from $2.9 billion at September 30, 2004 to $3.1 billion at September 30, 2005 forthe pension plan and decreased from $50 million at September 30, 2004 to $49 million at September 30, 2005 for otherbenefits. Management believes that, based on the actuarial assumptions and the well funded status of the pension plan, FPLGroup will not be required to make any cash contributions to the qualified pension plan in the near future. In December 2005,$24 million was transferred from the qualified pension plan as reimbursement for eligible retiree medical expenses paid byFPL Group during the year pursuant to the provisions of the Internal Revenue Code. FPL Group anticipates payingapproximately $27 million for eligible retiree medical expenses on behalf of the other benefits plan during 2006 withsubstantially all of that amount being reimbursed through a transfer of assets from the qualified pension plan pursuant to theprovisions of the Internal Revenue Code. See Note 3.
Carrying Value of Long-Lived Assets – FPL Group evaluates on an ongoing basis the recoverability of its assets forimpairment whenever events or changes in circumstances indicate that the carrying amount may not be recoverable asdescribed in FAS 144, "Accounting for the Impairment or Disposal of Long-Lived Assets."
Under that standard, an impairment loss is required to be recognized if the carrying value of the asset exceeds theundiscounted future net cash flows associated with that asset. The impairment loss to be recognized is the amount by whichthe carrying value of the long-lived asset exceeds the asset's fair value. In most instances, the fair value is determined bydiscounting estimated future cash flows using an appropriate interest rate.
The amount of future net cash flows, the timing of the cash flows and the determination of an appropriate interest rate allinvolve estimates and judgments about future events. In particular, the aggregate amount of cash flows determines whetheran impairment exists, and the timing of the cash flows is critical in determining fair value. Because each assessment is basedon the facts and circumstances associated with each long-lived asset, the effects of changes in assumptions cannot begeneralized.
Nuclear Decommissioning and Fossil Dismantlement – FPL Group and FPL adopted FAS 143, “Accounting for AssetRetirement Obligations” and FIN 47, “Accounting for Conditional Asset Retirement Obligations,” effective January 1, 2003 andDecember 31, 2005, respectively. FAS 143 and FIN 47 require that a liability for the fair value of an asset retirementobligation (ARO) be recognized in the period in which it is incurred with the offsetting associated asset retirement costscapitalized as part of the carrying amount of the long-lived assets.
For ratemaking purposes, FPL accrues and funds for nuclear plant decommissioning costs over the expected service life ofeach unit based on studies that are filed with the FPSC at least every five years. FPL filed updated nuclear decommissioning

39
studies in 2005, which indicate that FPL’s portion of the future cost of decommissioning its four nuclear units, including spentfuel storage, is $10.9 billion, or $2.0 billion in 2005 dollars. The 2005 studies reflect, among other things, the 20-year licenseextensions of FPL's nuclear units and support the suspension, effective September 2005, of the $79 million annualdecommissioning accrual. At December 31, 2005, $2,351 million was accrued for nuclear decommissioning, of which $1,460million was recorded as an ARO, $57 million was recorded as a capitalized net asset related to the ARO, $770 million wasrecorded as a regulatory liability and $178 million was included in accrued asset removal costs on the consolidated balancesheets. See Note 1 – Decommissioning of Nuclear Plants, Dismantlement of Plants and Other Accrued Asset Removal Costsand Note 15.
FPL accrues the cost of dismantling its fossil plants over the expected service life of each unit based on studies filed with theFPSC at least every four years. Unlike nuclear decommissioning, fossil dismantlement costs are not funded. The mostrecent studies, which became effective January 1, 2003, indicated that FPL's portion of the ultimate cost to dismantle its fossilunits is $668 million. The majority of the dismantlement costs are not considered AROs. At December 31, 2005, theprovision for fossil dismantlement was approximately $277 million and is included in accrued asset removal costs.
FPL Energy records a liability for the present value of Seabrook's expected decommissioning costs in accordance with FAS143 and FIN 47. Comprehensive studies are filed with the New Hampshire Nuclear Decommissioning Financing Committeeevery four years, with updates provided annually. These studies indicate that FPL Energy's 88.23% portion of the ultimatecost of decommissioning Seabrook, including costs associated with spent fuel storage, is approximately $1,496 million, or$604 million in 2005 dollars. At December 31, 2005, the ARO for Seabrook's nuclear decommissioning totaled approximately$189 million. See Note 1 – Decommissioning of Nuclear Plants, Dismantlement of Plants and Other Accrued Asset RemovalCosts and Note 15.
The calculation of the future cost of retiring long-lived assets, including nuclear decommissioning and fossil dismantlementcosts, involves the use of estimates and judgments concerning the amount and timing of future expenditures and whether ornot such costs are considered a legal obligation under FAS 143 and FIN 47. FPL Group and FPL also make interest rate,rate of return and inflation projections to determine funding requirements related to decommissioning. Periodically, FPLGroup and FPL will be required to update their estimates and projections which can affect the annual expense amountsrecognized, the liabilities recorded and the annual funding requirements for nuclear decommissioning costs.
Regulatory Accounting – FPL follows the accounting practices set forth in FAS 71, "Accounting for the Effects of CertainTypes of Regulation." FAS 71 indicates that regulators can create assets and impose liabilities that would not be recorded bynon-rate regulated entities. Regulatory assets and liabilities represent probable future revenues that will be recovered from orrefunded to customers through the ratemaking process. If FPL were no longer subject to cost-based rate regulation, theexisting regulatory assets and liabilities would be written off unless regulators specify an alternative means of recovery orrefund. In addition, the FPSC has the authority to disallow recovery of costs that it considers excessive or imprudentlyincurred. Such costs may include, among others, O&M expenses, the cost of replacing power lost when fossil and nuclearunits are unavailable, storm restoration costs and costs associated with the construction or acquisition of new facilities. Thecontinued applicability of FAS 71 is assessed at each reporting period.
FPL's regulatory assets and liabilities are as follows:
December 31,2005 2004
(millions)Regulatory assets: Current: Deferred clause and franchise expenses $ 795 $ 230 Storm reserve deficiency $ 156 $ 163 Derivatives $ - $ 9 Other $ 7 $ -
Noncurrent: Storm reserve deficiency $ 957 $ 373 Deferred clause expenses $ 307 $ - Unamortized loss on reacquired debt $ 42 $ 45 Litigation settlement $ - $ 45 Other $ 37 $ 38
Regulatory liabilities: Current: Deferred clause and franchise revenues $ 32 $ 30 Derivatives $ 757 $ -
Noncurrent: Accrued asset removal costs $ 2,033 $ 2,012 Asset retirement obligation regulatory expense difference $ 786 $ 266 Unamortized investment tax credits $ 62 $ 81 Other $ 90 $ 106
See Note 1 for a discussion of FPL Group's and FPL's other significant accounting policies.

40
Energy Marketing and Trading and Market Risk Sensitivity
Energy Marketing and Trading – Certain of FPL Group's subsidiaries, including FPL and FPL Energy, use derivativeinstruments (primarily swaps, options and forwards) to manage the commodity price risk inherent in the purchase and sale offuel and electricity, as well as to optimize the value of power generation assets. To a lesser extent, FPL Group and FPLengage in limited energy trading activities to take advantage of expected future favorable price movements.
Derivative instruments, when required to be marked to market under FAS 133, as amended, are recorded on FPL Group'sand FPL's consolidated balance sheets as either an asset or liability measured at fair value. At FPL, substantially all changesin fair value are deferred as a regulatory asset or liability until the contracts are settled. Upon settlement, any gains or lossesare passed through the fuel clause or the capacity clause. For FPL Group's non-rate regulated operations, predominantlyFPL Energy, essentially all changes in the derivatives' fair value for power purchases and sales and trading activities arerecognized on a net basis in operating revenues; fuel purchases and sales are recognized net in fuel, purchased power andinterchange expense; and the equity method investees' related activity is recognized in equity in earnings of equity methodinvestees in FPL Group's consolidated statements of income unless hedge accounting is applied. See Note 4.
The changes in the fair value of FPL Group's consolidated subsidiaries' energy contract derivative instruments were asfollows:
Hedges on Owned Assets
ProprietaryTrading Managed
Non-Qualifying OCI
FPL CostRecoveryClauses
FPLGroupTotal
(millions)
Fair value of contracts outstanding at December 31, 2003 $ 7 $ 1 $ 21 $ (11) $ 94 $ 112Reclassification to realized at settlement of contracts (15) (2) (60) 1 (223) (299)Effective portion of changes in fair value recorded in OCI - - - (99) - (99)Ineffective portion of changes in fair value recorded in earnings - - (7) - - (7)Changes in fair value excluding reclassification to realized 14 (1) 36 - 120 169Fair value of contracts outstanding at December 31, 2004 6 (2) (10) (109) (9) (124)Reclassification to realized at settlement of contracts (6) 3 (9) 89 (617) (540)Acquisition of Gexa contracts - - 38 - - 38Effective portion of changes in fair value recorded in OCI - - - (353) - (353)Ineffective portion of changes in fair value recorded in earnings - - (33) - - (33)Changes in fair value excluding reclassification to realized 3 (2) (162) - 1,383 1,222Fair value of contracts outstanding at December 31, 2005 3 (1) (176) (373) 757 210Net option premium payments (receipts) - 1 10 - 71 82Total mark-to-market energy contract net assets (liabilities) at December 31, 2005 $ 3 $ - $ (166) $ (373) $ 828 $ 292
FPL Group's total mark-to-market energy contract net assets (liabilities) at December 31, 2005 shown above are included in theconsolidated balance sheets as follows:
December 31,2005
(millions)
Derivative assets $ 1,070Other assets 56Other current liabilities (449)Other liabilities (385)FPL Group’s total mark-to-market energy contract net assets $ 292

41
The sources of fair value estimates and maturity of energy contract derivative instruments at December 31, 2005 were as follows:
Maturity2006 2007 2008 2009 2010 Thereafter Total
(millions)Proprietary Trading: Actively quoted (i.e., exchange trade) prices $ (16) $ 1 $ - $ - $ - $ - $ (15) Prices provided by other external sources 58 1 - - 1 1 61 Modeled (43) - - - - - (43) Total (1) 2 - - 1 1 3
Owned Assets – Managed: Actively quoted (i.e., exchange trade) prices (20) - - - - - (20) Prices provided by other external sources 9 1 - - - - 10 Modeled 9 - - - - - 9 Total (2) 1 - - - - (1)
Owned Assets – Non-Qualifying: Actively quoted (i.e., exchange trade) prices 88 22 (9) (2) (7) (7) 85 Prices provided by other external sources (144) (58) (8) (1) - (17) (228) Modeled (29) 1 - (1) (1) (3) (33) Total (85) (35) (17) (4) (8) (27) (176)
Owned Assets – OCI: Actively quoted (i.e., exchange trade) prices 1 - - - - - 1 Prices provided by other external sources (107) (191) (57) (15) (4) - (374) Modeled - - - - - - - Total (106) (191) (57) (15) (4) - (373)
Owned Assets – FPL Cost Recovery Clauses: Actively quoted (i.e., exchange trade) prices 690 - - - - - 690 Prices provided by other external sources 50 - - - - - 50 Modeled 17 - - - - - 17 Total 757 - - - - - 757
Total sources of fair value $ 563 $ (223) $ (74) $ (19) $ (11) $ (26) $ 210
Market Risk Sensitivity – Financial instruments and positions affecting the financial statements of FPL Group and FPL describedbelow are held primarily for purposes other than trading. Market risk is measured as the potential loss in fair value resulting fromhypothetical reasonably possible changes in commodity prices, interest rates or equity prices over the next year. Managementhas established risk management policies to monitor and manage market risks. FPL Group's Exposure Management Committee(EMC), which is comprised of certain members of senior management, is responsible for the overall approval of market riskmanagement policies and the delegation of approval and authorization levels. The EMC receives periodic updates on marketpositions and related exposures, credit exposures and overall risk management activities.
FPL Group and its subsidiaries are also exposed to credit risk through their energy marketing and trading operations. Credit riskis the risk that a financial loss will be incurred if a counterparty to a transaction does not fulfill its financial obligation. FPL Groupmanages counterparty credit risk for its subsidiaries with energy marketing and trading operations through established policies,including counterparty credit limits, and in some cases credit enhancements, such as cash prepayments, letters of credit, cashand other collateral and guarantees. Credit risk is also managed through the use of master netting agreements. FPL Group'scredit department monitors current and forward credit exposure to counterparties and their affiliates, both on an individual and anaggregate basis.
Commodity price risk – FPL Group uses a value-at-risk (VaR) model to measure market risk in its trading and mark-to-marketportfolios. The VaR is the estimated nominal loss of market value based on a one-day holding period at a 95% confidencelevel using historical simulation methodology. As of December 31, 2005 and 2004, the VaR figures are as follows:
Trading and Managed Hedges
Non-Qualifying Hedgesand Hedges in OCI and
FPL cost recovery clauses (a) Total
FPLFPL
EnergyFPL
Group FPLFPL
EnergyFPL
Group FPLFPL
EnergyFPL
Group(millions)
December 31, 2004 $ - $ - $ - $ 55 $ 12 $ 48 $ 55 $ 15 $ 47December 31, 2005 $ - $ - $ - $ 114 $ 38 $ 98 $ 114 $ 38 $ 98
Average for the period ended December 31, 2005 $ - $ 1 $ 1 $ 57 $ 40 $ 48 $ 57 $ 40 $ 49_____________________(a) Non-qualifying hedges are employed to reduce the market risk exposure to physical assets which are not marked to market. The VaR figures for the non-
qualifying hedges and hedges in OCI and FPL cost recovery clauses category do not represent the economic exposure to commodity price movements.
Interest rate risk – FPL Group and FPL are exposed to risk resulting from changes in interest rates as a result of theirrespective issuances of debt, investments in nuclear decommissioning reserve funds and interest rate swaps. FPL Groupand FPL manage their respective interest rate exposure by monitoring current interest rates, entering into interest rate swapsand adjusting their variable rate debt in relation to total capitalization.

42
The following are estimates of the fair value of FPL Group’s and FPL’s financial instruments:
December 31, 2005 December 31, 2004CarryingAmount
EstimatedFair Value
CarryingAmount
EstimatedFair Value
FPL Group: (millions) Long-term debt, including current maturities $ 9,443 $ 9,540(a) $ 9,247 $ 9,611(a)
Fixed income securities: Nuclear decommissioning reserve funds $ 1,290 $ 1,290(b) $ 1,219 $ 1,219(b)
Other investments $ 80 $ 80(b) $ 72 $ 72(b)
Interest rate swaps – net unrealized loss $ (9) $ (9)(c) $ (11) $ (11)(c)
FPL: Long-term debt, including current maturities $ 3,406 $ 3,416(a) $ 3,311 $ 3,438(a)
Fixed income securities: Nuclear decommissioning reserve funds $ 1,151 $ 1,151(b) $ 1,081 1,081(b)
Interest rate swaps – net unrealized loss $ - $ - $ (2) $ (2)(c)
_____________________(a) Based on market prices provided by external sources.(b) Based on quoted market prices for these or similar issues.(c) Based on market prices modeled internally.
The nuclear decommissioning reserve funds of FPL Group consist of restricted funds set aside to cover the cost ofdecommissioning of FPL Group's and FPL's nuclear power plants. A portion of these funds is invested in fixed income debtsecurities carried at their market value. Adjustments to market value result in a corresponding adjustment to the relatedliability accounts based on current regulatory treatment for FPL. The market value adjustments of FPL Group's non-rateregulated operations result in a corresponding adjustment to OCI. See Note 10.
FPL Group and its subsidiaries use a combination of fixed rate and variable rate debt to manage interest rateexposure. Interest rate swaps are used to adjust and mitigate interest rate exposure when deemed appropriate based uponmarket conditions or when required by financing agreements. At December 31, 2005, the estimated fair value for FPL Groupinterest rate swaps was as follows:
NotionalAmount
EffectiveDate
MaturityDate
RatePaid
RateReceived
EstimatedFair Value
(millions) (millions)
Fair value hedges – FPL Group Capital:$ 150 July 2003 September 2006 variable(a) 7.625% $ (3)$ 150 July 2003 September 2006 variable(b) 7.625% (3)$ 195 October 2004 April 2006 variable(c) 3.250% (2)$ 55 October 2004 April 2006 variable(d) 3.250% -$ 195 October 2004 April 2006 variable(e) 3.250% (2)$ 55 October 2004 April 2006 variable(f) 3.250% -$ 300 November 2004 February 2007 variable(g) 4.086% (5)$ 275 December 2004 February 2007 variable(h) 4.086% (4)
Total fair value hedges (19)
Cash flow hedges – FPL Energy:$ 90 August 2002 December 2007 4.410% variable (i) 1$ 185 August 2003 November 2007 3.557% variable (i) 4$ 6 February 2005 June 2008 4.255% variable (i) 1$ 85 December 2003 December 2017 4.245% variable (i) 3$ 28 April 2004 December 2017 3.845% variable (i) 1$ 266 December 2005 November 2019 4.905% variable (i) -
Total cash flow hedges 10Total interest rate hedges $ (9)____________________(a) Six-month LIBOR plus 4.9900%(b) Six-month LIBOR plus 4.9925%(c) Six-month LIBOR plus 0.0153%(d) Six-month LIBOR plus 0.0100%(e) Six-month LIBOR plus 0.1500%(f) Six-month LIBOR plus 0.1525%(g) Three-month LIBOR plus 0.50577%(h) Three-month LIBOR plus 0.4025%(i) Three-month LIBOR
Based upon a hypothetical 10% decrease in interest rates, which is a reasonable near-term market change, the net fair valueof FPL Group's net liabilities would increase by approximately $311 million ($171 million for FPL) at December 31, 2005.

43
Equity price risk – Included in the nuclear decommissioning reserve funds of FPL Group are marketable equity securitiescarried at their market value of approximately $1,113 million and $1,051 million ($933 million and $890 million for FPL) atDecember 31, 2005 and 2004, respectively. A hypothetical 10% decrease in the prices quoted by stock exchanges, which isa reasonable near-term market change, would result in a $111 million ($93 million for FPL) reduction in fair value andcorresponding adjustments to the related liability accounts based on current regulatory treatment for FPL, or adjustments toOCI for FPL Group's non-rate regulated operations, at December 31, 2005.
Credit risk – For all derivative and contractual transactions, FPL Group's energy marketing and trading operations, whichincludes FPL's energy marketing and trading division, are exposed to losses in the event of nonperformance bycounterparties to these transactions. Relevant considerations when assessing FPL Group's energy marketing and tradingoperations' credit risk exposure include:
• Operations are primarily concentrated in the energy industry.
• Trade receivables and other financial instruments are predominately with energy, utility and financial services relatedcompanies, as well as municipalities, cooperatives and other trading companies in the United States.
• Overall credit risk is managed through established credit policies.
• Prospective and existing customers are reviewed for creditworthiness based upon established standards, with customersnot meeting minimum standards providing various credit enhancements or secured payment terms, such as letters ofcredit or the posting of cash collateral.
• The use of master netting agreements to offset cash and non-cash gains and losses arising from derivative instrumentswith the same counterparty. FPL Group's policy is to have master netting agreements in place with significantcounterparties.
Based on FPL Group's policies and risk exposures related to credit, FPL Group and FPL do not anticipate a material adverseeffect on their financial positions as a result of counterparty nonperformance. As of December 31, 2005, approximately 99%of both FPL Group's and FPL's energy marketing and trading counterparty credit risk exposure is associated with companiesthat have investment grade credit ratings.
Item 7A. Quantitative and Qualitative Disclosures About Market Risk
See Management's Discussion – Energy Marketing and Trading and Market Risk Sensitivity – Market Risk Sensitivity.
44
Item 8. Financial Statements and Supplementary Data
MANAGEMENT’S REPORT ON INTERNAL CONTROL OVER FINANCIAL REPORTING
FPL Group, Inc.’s (FPL Group) and Florida Power & Light Company’s (FPL) management are responsible for establishing andmaintaining adequate internal control over financial reporting as defined in Rules 13a-15(f) and 15d-15(f) under the SecuritiesExchange Act of 1934. The consolidated financial statements, which in part are based on informed judgments and estimatesmade by management, have been prepared in conformity with generally accepted accounting principles applied on aconsistent basis.
To aid in carrying out this responsibility, we, along with all other members of management, maintain a system of internalaccounting control which is established after weighing the cost of such controls against the benefits derived. In the opinion ofmanagement, the overall system of internal accounting control provides reasonable assurance that the assets of FPL Groupand its subsidiaries are safeguarded and that transactions are executed in accordance with management’s authorization andare properly recorded for the preparation of financial statements. In addition, management believes the overall system ofinternal accounting control provides reasonable assurance that material errors or irregularities would be prevented ordetected on a timely basis by employees in the normal course of their duties. Any system of internal accounting control, nomatter how well designed, has inherent limitations, including the possibility that controls can be circumvented or overriddenand misstatements due to error or fraud may occur and not be detected. Also, because of changes in conditions, internalcontrol effectiveness may vary over time. Accordingly, even an effective system of internal control will provide onlyreasonable assurance with respect to financial statement preparation and reporting.
The system of internal accounting control is supported by written policies and guidelines, the selection and training ofqualified employees, an organizational structure that provides an appropriate division of responsibility and a program ofinternal auditing. FPL Group’s written policies include a Code of Business Conduct & Ethics that states management’s policyon conflict of interest and ethical conduct. Compliance with the Code of Business Conduct & Ethics is confirmed annually bykey personnel.
The Board of Directors pursues its oversight responsibility for financial reporting and accounting through its AuditCommittee. This Committee, which is comprised entirely of outside directors, meets regularly with management, the internalauditors and the independent auditors to make inquiries as to the manner in which the responsibilities of each are beingdischarged. The independent auditors and the internal audit staff have free access to the Committee without management’spresence to discuss auditing, internal accounting control and financial reporting matters.
In accordance with the SEC’s published guidance, we have excluded from our assessment the internal control over financialreporting for the entities that directly own the interests in each of the entities acquired in connection with the acquisition ofGexa Corp., which was acquired in June 2005, and whose financial statements reflect total assets and operating revenuesrepresenting less than 1% and approximately 3%, respectively, of FPL Group’s consolidated total assets and operatingrevenues as of and for the year ended December 31, 2005. FPL Group does not consider the acquisition of Gexa Corp.material to FPL Group’s results of operations, financial position and cash flows.
Management assessed the effectiveness of FPL Group's and FPL's internal control over financial reporting as ofDecember 31, 2005, using the criteria set forth by the Committee of Sponsoring Organizations of the Treadway Commissionin the Internal Control – Integrated Framework and also the standards of the Public Company Accounting OversightBoard. Based on this assessment, management believes that FPL Group's and FPL's internal control over financial reportingwas effective as of December 31, 2005.
FPL Group's and FPL's independent registered public accounting firm, Deloitte & Touche LLP, is engaged to express anopinion on FPL Group's and FPL's consolidated financial statements and an opinion on FPL Group's and FPL's internalcontrol over financial reporting. Their reports are based on procedures believed by them to provide a reasonable basis tosupport such opinions. FPL Group's and FPL's independent registered public accounting firm has issued an attestation reporton management's assessment of FPL Group's and FPL's internal control over financial reporting. That report appears on thefollowing page.
LEWIS HAY, III MORAY P. DEWHURSTLewis Hay, IIIChairman, President and ChiefExecutive Officer of FPL Groupand Chairman and Chief ExecutiveOfficer of FPL
Moray P. DewhurstVice President, Finance and ChiefFinancial Officer of FPL Groupand Senior Vice President, Financeand Chief Financial Officer of FPL
K. MICHAEL DAVISK. Michael DavisController and Chief Accounting Officerof FPL Group and Vice President,Accounting, Controller and ChiefAccounting Officer of FPL

45
REPORT OF INDEPENDENT REGISTERED PUBLIC ACCOUNTING FIRM
To the Board of Directors and Shareholders FPL Group, Inc. and Florida Power & Light Company:
We have audited management’s assessment, included in the accompanying Management’s Report on Internal Control OverFinancial Reporting, that FPL Group, Inc. and subsidiaries (FPL Group) and Florida Power & Light Company and subsidiaries(FPL) maintained effective internal control over financial reporting as of December 31, 2005, based on criteria established inInternal Control—Integrated Framework issued by the Committee of Sponsoring Organizations of the TreadwayCommission. As described in Management’s Report on Internal Control Over Financial Reporting, management excludedfrom their assessment the internal control over financial reporting for the entities that directly own the interests in each of theentities acquired in connection with the acquisition of Gexa Corp., which was acquired on June 17, 2005 and whose financialstatements reflect total assets and revenues constituting less than one percent and approximately three percent, respectively,of the related consolidated financial statement amounts of FPL Group as of and for the year ended December 31,2005. Accordingly, our audit did not include the internal control over financial reporting for the entities that directly own theinterests in each of the entities acquired in connection with the acquisition of Gexa Corp. FPL Group's management andFPL's management are responsible for maintaining effective internal control over financial reporting and for their assessmentof the effectiveness of internal control over financial reporting. Our responsibility is to express an opinion on management'sassessment and an opinion on the effectiveness of FPL Group's and FPL's internal control over financial reporting based onour audits.
We conducted our audits in accordance with the standards of the Public Company Accounting Oversight Board (UnitedStates). Those standards require that we plan and perform the audit to obtain reasonable assurance about whether effectiveinternal control over financial reporting was maintained in all material respects. Our audits included obtaining anunderstanding of internal control over financial reporting, evaluating management's assessment, testing and evaluating thedesign and operating effectiveness of internal control, and performing such other procedures as we considered necessary inthe circumstances. We believe that our audits provide a reasonable basis for our opinions.
A company's internal control over financial reporting is a process designed by, or under the supervision of, the company'sprincipal executive and principal financial officers, or persons performing similar functions, and effected by the company'sboard of directors, management, and other personnel to provide reasonable assurance regarding the reliability of financialreporting and the preparation of financial statements for external purposes in accordance with generally accepted accountingprinciples. A company's internal control over financial reporting includes those policies and procedures that (1) pertain to themaintenance of records that, in reasonable detail, accurately and fairly reflect the transactions and dispositions of the assetsof the company; (2) provide reasonable assurance that transactions are recorded as necessary to permit preparation offinancial statements in accordance with generally accepted accounting principles, and that receipts and expenditures of thecompany are being made only in accordance with authorizations of management and directors of the company; and (3)provide reasonable assurance regarding prevention or timely detection of unauthorized acquisition, use, or disposition of thecompany's assets that could have a material effect on the financial statements.
Because of the inherent limitations of internal control over financial reporting, including the possibility of collusion or impropermanagement override of controls, material misstatements due to error or fraud may not be prevented or detected on a timelybasis. Also, projections of any evaluation of the effectiveness of the internal control over financial reporting to future periodsare subject to the risk that the controls may become inadequate because of changes in conditions, or that the degree ofcompliance with the policies or procedures may deteriorate.
In our opinion, management's assessment that FPL Group and FPL maintained effective internal control over financialreporting as of December 31, 2005, is fairly stated, in all material respects, based on the criteria established in InternalControl—Integrated Framework issued by the Committee of Sponsoring Organizations of the Treadway Commission. Also inour opinion, FPL Group and FPL maintained, in all material respects, effective internal control over financial reporting as ofDecember 31, 2005, based on the criteria established in Internal Control—Integrated Framework issued by the Committee ofSponsoring Organizations of the Treadway Commission.
We have also audited, in accordance with the standards of the Public Company Accounting Oversight Board (United States),the consolidated financial statements as of and for the year ended December 31, 2005 of FPL Group and FPL and our reportdated February 22, 2006 expressed an unqualified opinion on those financial statements.
DELOITTE & TOUCHE LLPCertified Public Accountants
Miami, FloridaFebruary 22, 2006

46
REPORT OF INDEPENDENT REGISTERED PUBLIC ACCOUNTING FIRM
To the Board of Directors and Shareholders FPL Group, Inc. and Florida Power & Light Company:
We have audited the accompanying consolidated balance sheets of FPL Group, Inc. and subsidiaries (FPL Group) and theseparate consolidated balance sheets of Florida Power & Light Company and subsidiaries (FPL) as of December 31, 2005and 2004, and the related consolidated statements of income, common shareholders’ equity, and cash flows for each of thethree years in the period ended December 31, 2005. These financial statements are the responsibility of the respectivecompany’s management. Our responsibility is to express an opinion on these financial statements based on our audits.
We conducted our audits in accordance with the standards of the Public Company Accounting Oversight Board (UnitedStates). Those standards require that we plan and perform the audit to obtain reasonable assurance about whether thefinancial statements are free of material misstatement. An audit includes examining, on a test basis, evidence supporting theamounts and disclosures in the financial statements. An audit also includes assessing the accounting principles used andsignificant estimates made by management, as well as evaluating the overall financial statement presentation. We believethat our audits provide a reasonable basis for our opinion.
In our opinion, such consolidated financial statements present fairly, in all material respects, the financial position of FPLGroup and the financial position of FPL at December 31, 2005 and 2004, and the respective results of their operations andtheir cash flows for each of the three years in the period ended December 31, 2005, in conformity with accounting principlesgenerally accepted in the United States of America.
We have also audited, in accordance with the standards of the Public Company Accounting Oversight Board (United States),the effectiveness of FPL Group’s and FPL’s internal control over financial reporting as of December 31, 2005, based on thecriteria established in Internal Control—Integrated Framework issued by the Committee of Sponsoring Organizations of theTreadway Commission and our report dated February 22, 2006 expressed an unqualified opinion on management’sassessment of the effectiveness of FPL Group’s and FPL’s internal control over financial reporting and an unqualified opinionon the effectiveness of FPL Group’s and FPL’s internal control over financial reporting.
DELOITTE & TOUCHE LLPCertified Public Accountants
Miami, FloridaFebruary 22, 2006

47
FPL GROUP, INC.CONSOLIDATED STATEMENTS OF INCOME
(millions, except per share amounts)
Years Ended December 31,2005 2004 2003
OPERATING REVENUES $ 11,846 $ 10,522 $ 9,630
OPERATING EXPENSESFuel, purchased power and interchange 6,171 5,217 4,539Other operations and maintenance 1,840 1,672 1,626Restructuring charge - 81 -Amortization of storm reserve deficiency 155 - -Depreciation and amortization 1,285 1,198 1,105Taxes other than income taxes 931 882 829
Total operating expenses 10,382 9,050 8,099
OPERATING INCOME 1,464 1,472 1,531
OTHER INCOME (DEDUCTIONS)Interest charges (593) (489) (379)Preferred stock dividends – FPL - - (13)Loss on redemption of preferred stock – FPL - - (9)Equity in earnings of equity method investees 124 94 89Gains (losses) on disposal of equity method investees and leveraged leases – net 52 (3) 6Allowance for equity funds used during construction 28 37 14Interest income 59 25 19Other – net 23 18 3
Total other deductions – net (307) (318) (270)
INCOME FROM OPERATIONS BEFORE INCOME TAXES AND CUMULATIVEEFFECT OF CHANGE IN ACCOUNTING PRINCIPLE 1,157 1,154 1,261
INCOME TAXES 272 267 368
INCOME BEFORE CUMULATIVE EFFECT OF CHANGEIN ACCOUNTING PRINCIPLE 885 887 893
CUMULATIVE EFFECT OF ADOPTING FASB INTERPRETATION NO. 46,"CONSOLIDATION OF VARIABLE INTEREST ENTITIES," NET OFINCOME TAXES OF $2 - - (3)
NET INCOME $ 885 $ 887 $ 890
Earnings per share of common stock:Earnings per share before cumulative effect of adopting FASB $ 2.33 $ 2.47 $ 2.52
Interpretation No. 46Cumulative effect of adopting FASB Interpretation No. 46 $ - $ - $ (0.01)Earnings per share $ 2.33 $ 2.47 $ 2.51
Earnings per share of common stock – assuming dilution:Earnings per share before cumulative effect of adopting FASB $ 2.29 $ 2.45 $ 2.51
Interpretation No. 46Cumulative effect of adopting FASB Interpretation No. 46 $ - $ - $ (0.01)Earnings per share $ 2.29 $ 2.45 $ 2.50
Dividends per share of common stock $ 1.42 $ 1.30 $ 1.20
Weighted-average number of common shares outstanding:Basic 380.1 358.6 355.1Assuming dilution 385.7 361.7 356.3
The accompanying Notes to Consolidated Financial Statements are an integral part of these statements.

48
FPL GROUP, INC.CONSOLIDATED BALANCE SHEETS
(millions)December 31,
2005 2004PROPERTY, PLANT AND EQUIPMENT Electric utility plant in service and other property $ 31,886 $ 29,721 Nuclear fuel 520 504 Construction work in progress 945 1,495 Less accumulated depreciation and amortization (10,888) (10,494) Total property, plant and equipment – net 22,463 21,226
CURRENT ASSETS Cash and cash equivalents 530 225 Customer receivables, net of allowances of $34 and $37, respectively 1,064 785 Other receivables, net of allowances of $9 and $1, respectively 366 259 Materials, supplies and fossil fuel inventory – at average cost 567 394 Regulatory assets: Deferred clause and franchise expenses 795 230 Storm reserve deficiency 156 163 Derivatives - 9 Other 7 - Derivatives 1,074 110 Other 428 352 Total current assets 4,987 2,527
OTHER ASSETS Nuclear decommissioning reserve funds 2,401 2,271 Other investments 467 740 Regulatory assets: Storm reserve deficiency 957 373 Deferred clause expenses 307 - Unamortized loss on reacquired debt 42 45 Litigation settlement - 45 Other 37 38 Other 1,343 1,068 Total other assets 5,554 4,580
TOTAL ASSETS $ 33,004 $ 28,333
CAPITALIZATION Common shareholders’ equity $ 8,499 $ 7,537 Long-term debt 8,039 8,027 Total capitalization 16,538 15,564
CURRENT LIABILITIES Commercial paper 1,159 492 Current maturities of long-term debt and preferred stock 1,404 1,225 Accounts payable 1,245 762 Customers’ deposits 433 394 Margin cash deposits 393 5 Accrued interest and taxes 253 227 Regulatory liabilities: Deferred clause and franchise revenues 32 30 Derivatives 757 - Derivatives 463 118 Other 1,128 995 Total current liabilities 7,267 4,248
OTHER LIABILITIES AND DEFERRED CREDITS Asset retirement obligations 1,685 2,207 Accumulated deferred income taxes 3,015 2,685 Regulatory liabilities: Accrued asset removal costs 2,033 2,012 Asset retirement obligation regulatory expense difference 786 266 Unamortized investment tax credits 62 81 Other 90 106 Other 1,528 1,164 Total other liabilities and deferred credits 9,199 8,521
COMMITMENTS AND CONTINGENCIES
TOTAL CAPITALIZATION AND LIABILITIES $ 33,004 $ 28,333
The accompanying Notes to Consolidated Financial Statements are an integral part of these statements.

49
FPL GROUP, INC.CONSOLIDATED STATEMENTS OF CASH FLOWS
(millions)Years Ended December 31,
2005 2004 2003CASH FLOWS FROM OPERATING ACTIVITIES
Net income $ 885 $ 887 $ 890Adjustments to reconcile net income to net cash provided by operating activities:
Depreciation and amortization 1,242 1,153 1,060Nuclear fuel amortization 99 93 58Cumulative effect of changes in accounting principles - - 5Storm-related costs of FPL, net of insurance advances (659) (627) -Amortization of storm reserve deficiency 155 - -Restructuring charges - 33 -Unrealized losses on marked to market energy contracts 191 25 (12)Deferred income taxes and related regulatory credit 333 428 588Cost recovery clauses and franchise fees (825) 144 (186)Equity in earnings of equity method investees (124) (94) (89)Distribution of earnings from equity method investees 86 83 68Changes in operating assets and liabilities:
Customer receivables (227) 23 (161)Other receivables (64) 16 2Material, supplies and fossil fuel inventory (173) 29 1Other current assets (9) (10) (18)Deferred pension cost (70) (101) (123)Accounts payable 346 220 104Customers’ deposits 32 42 41Margin cash deposits 387 (5) 11Income taxes (51) 108 (142)Interest and other taxes 29 (2) 57Other current liabilities (95) 80 90Other liabilities (21) 65 (55)
Other – net 80 60 65Net cash provided by operating activities 1,547 2,650 2,254
CASH FLOWS FROM INVESTING ACTIVITIES Capital expenditures of FPL (1,616) (1,394) (1,383) Independent power investments (815) (476) (1,461) Nuclear fuel purchases (102) (141) (42) Sale of independent power investments 69 93 - Loan repayments and capital distributions from equity method investees 199 9 13 Proceeds from sale of securities 2,928 2,207 2,735 Purchase of securities (2,928) (2,207) (2,735) Contributions to special use funds (127) (148) (173) Reimbursements from special use funds 8 218 - Sale of Olympus Communications, L.P. note receivable - 126 - Funding of secured loan (43) (128) (47) Repayment of secured loan 218 - - Proceeds from termination and sale of leveraged leases 58 - - Other – net (14) (31) 4 Net cash used in investing activities (2,165) (1,872) (3,089)
CASH FLOWS FROM FINANCING ACTIVITIES Issuances of long-term debt 1,391 569 2,995 Retirements of long-term debt (1,215) (432) (431) Retirements of preferred stock – FPL (5) - (228) Net change in short-term debt 667 (423) (1,238) Issuances of common stock 639 110 73 Dividends on common stock (544) (467) (425) Other – net (10) (39) (48) Net cash provided by (used in) financing activities 923 (682) 698
Net increase (decrease) in cash and cash equivalents 305 96 (137)Cash and cash equivalents at beginning of year 225 129 266Cash and cash equivalents at end of year $ 530 $ 225 $ 129
SUPPLEMENTAL DISCLOSURES OF CASH FLOW INFORMATION Cash paid for interest (net of amount capitalized) $ 543 $ 460 $ 342 Cash paid (received) for income taxes – net $ 8 $ (254) $ (77)
SUPPLEMENTAL SCHEDULE OF NONCASH INVESTING AND FINANCING ACTIVITIES Issuance of common stock and conversion of options and warrants in connection with the acquisition of Gexa Corp. $ 74 $ - $ - Additions to capital lease obligations $ - $ - $ 41 Additions to debt through the adoption of FIN 46 $ - $ - $ 515 Additions to property, plant and equipment – net through the adoption of FIN 46 $ - $ - $ 346
The accompanying Notes to Consolidated Financial Statements are an integral part of these statements.
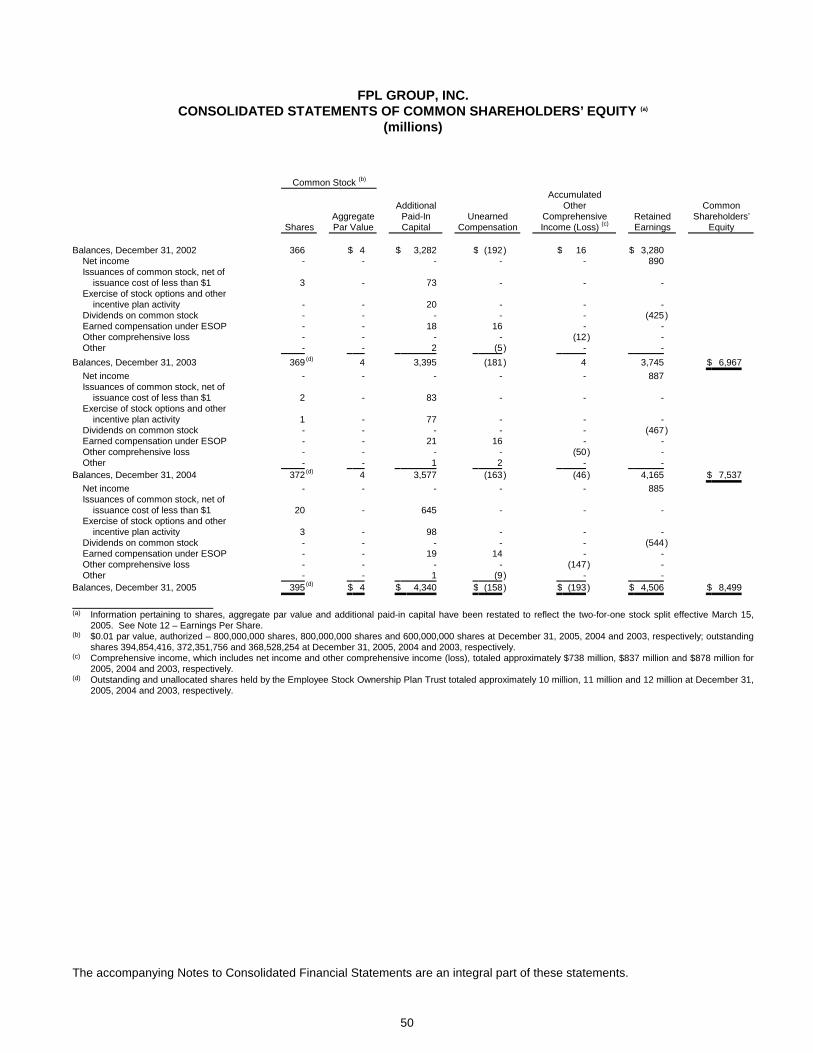
50
FPL GROUP, INC.CONSOLIDATED STATEMENTS OF COMMON SHAREHOLDERS’ EQUITY (a)
(millions)
Common Stock (b)
SharesAggregatePar Value
AdditionalPaid-InCapital
UnearnedCompensation
AccumulatedOther
ComprehensiveIncome (Loss) (c)
RetainedEarnings
CommonShareholders’
Equity
Balances, December 31, 2002 366 $ 4 $ 3,282 $ (192) $ 16 $ 3,280 Net income - - - - - 890 Issuances of common stock, net of issuance cost of less than $1 3 - 73 - - - Exercise of stock options and other incentive plan activity - - 20 - - - Dividends on common stock - - - - - (425) Earned compensation under ESOP - - 18 16 - - Other comprehensive loss - - - - (12) - Other - - 2 (5) - -
Balances, December 31, 2003 369(d) 4 3,395 (181) 4 3,745 $ 6,967
Net income - - - - - 887 Issuances of common stock, net of issuance cost of less than $1 2 - 83 - - - Exercise of stock options and other incentive plan activity 1 - 77 - - - Dividends on common stock - - - - - (467) Earned compensation under ESOP - - 21 16 - - Other comprehensive loss - - - - (50) - Other - - 1 2 - -Balances, December 31, 2004 372(d) 4 3,577 (163) (46) 4,165 $ 7,537
Net income - - - - - 885 Issuances of common stock, net of issuance cost of less than $1 20 - 645 - - - Exercise of stock options and other incentive plan activity 3 - 98 - - - Dividends on common stock - - - - - (544) Earned compensation under ESOP - - 19 14 - - Other comprehensive loss - - - - (147) - Other - - 1 (9) - -Balances, December 31, 2005 395(d) $ 4 $ 4,340 $ (158) $ (193) $ 4,506 $ 8,499
_____________________(a) Information pertaining to shares, aggregate par value and additional paid-in capital have been restated to reflect the two-for-one stock split effective March 15,
2005. See Note 12 – Earnings Per Share.(b) $0.01 par value, authorized – 800,000,000 shares, 800,000,000 shares and 600,000,000 shares at December 31, 2005, 2004 and 2003, respectively; outstanding
shares 394,854,416, 372,351,756 and 368,528,254 at December 31, 2005, 2004 and 2003, respectively. (c) Comprehensive income, which includes net income and other comprehensive income (loss), totaled approximately $738 million, $837 million and $878 million for
2005, 2004 and 2003, respectively.(d) Outstanding and unallocated shares held by the Employee Stock Ownership Plan Trust totaled approximately 10 million, 11 million and 12 million at December 31,
2005, 2004 and 2003, respectively.
The accompanying Notes to Consolidated Financial Statements are an integral part of these statements.

51
FLORIDA POWER & LIGHT COMPANYCONSOLIDATED STATEMENTS OF INCOME
(millions)
Years Ended December 31,2005 2004 2003
OPERATING REVENUES $ 9,528 $ 8,734 $ 8,293
OPERATING EXPENSES Fuel, purchased power and interchange 4,910 4,467 4,047 Other operations and maintenance 1,307 1,228 1,250 Amortization of storm reserve deficiency 155 - - Depreciation and amortization 951 915 898 Taxes other than income taxes 858 809 769 Total operating expenses 8,181 7,419 6,964
OPERATING INCOME 1,347 1,315 1,329
OTHER INCOME (DEDUCTIONS) Interest charges (224) (183) (173) Allowance for equity funds used during construction 28 37 14 Other – net 5 (10) (12) Total other deductions – net (191) (156) (171)
INCOME BEFORE INCOME TAXES 1,156 1,159 1,158
INCOME TAXES 408 409 403
NET INCOME 748 750 755
PREFERRED STOCK DIVIDENDS - 1 13
LOSS ON REDEMPTION OF PREFERRED STOCK - - 9
NET INCOME AVAILABLE TO FPL GROUP $ 748 $ 749 $ 733
The accompanying Notes to Consolidated Financial Statements are an integral part of these statements.

52
FLORIDA POWER & LIGHT COMPANYCONSOLIDATED BALANCE SHEETS
(millions)December 31,
2005 2004ELECTRIC UTILITY PLANT Plant in service $ 23,251 $ 21,860 Nuclear fuel 380 370 Construction work in progress 776 1,285 Less accumulated depreciation and amortization (9,530) (9,467) Electric utility plant – net 14,877 14,048
CURRENT ASSETS Cash and cash equivalents 56 65 Customer receivables, net of allowances of $20 and $18, respectively 653 585 Other receivables, net of allowances of $1 and $1, respectively 313 216 Materials, supplies and fossil fuel inventory – at average cost 449 315 Regulatory assets: Deferred clause and franchise expenses 795 230 Storm reserve deficiency 156 163 Derivatives - 9 Other 7 - Derivatives 828 26 Other 212 146 Total current assets 3,469 1,755
OTHER ASSETS Nuclear decommissioning reserve funds 2,083 1,971 Regulatory assets: Storm reserve deficiency 957 373 Deferred clause expenses 307 - Unamortized loss on reacquired debt 42 45 Litigation settlement - 45 Other 37 38 Other 954 839 Total other assets 4,380 3,311
TOTAL ASSETS $ 22,726 $ 19,114
CAPITALIZATION Common shareholder’s equity $ 6,737 $ 6,150 Long-term debt 3,271 2,813 Total capitalization 10,008 8,963
CURRENT LIABILITIES Commercial paper 1,159 492 Current maturities of long-term debt and preferred stock 135 523 Accounts payable 863 606 Customers’ deposits 423 388 Margin cash deposits 382 - Accrued interest and taxes 174 158 Regulatory liabilities: Deferred clause and franchise revenues 32 30 Derivatives 757 - Other 929 826 Total current liabilities 4,854 3,023
OTHER LIABILITIES AND DEFERRED CREDITS Asset retirement obligations 1,474 2,015 Accumulated deferred income taxes 2,647 1,949 Regulatory liabilities: Accrued asset removal costs 2,033 2,012 Asset retirement obligation regulatory expense difference 786 266 Unamortized investment tax credits 62 81 Other 90 106 Other 772 699 Total other liabilities and deferred credits 7,864 7,128
COMMITMENTS AND CONTINGENCIES
TOTAL CAPITALIZATION AND LIABILITIES $ 22,726 $ 19,114
The accompanying Notes to Consolidated Financial Statements are an integral part of these statements.

53
FLORIDA POWER & LIGHT COMPANYCONSOLIDATED STATEMENTS OF CASH FLOWS
(millions)
Years Ended December 31,2005 2004 2003
CASH FLOWS FROM OPERATING ACTIVITIES Net income $ 748 $ 750 $ 755 Adjustments to reconcile net income to net cash provided by operating activities: Depreciation and amortization 909 870 853 Nuclear fuel amortization 72 66 33 Storm-related costs, net of insurance advances (659) (627) - Amortization of storm reserve deficiency 155 - - Deferred income taxes and related regulatory credit 531 553 172 Cost recovery clauses and franchise fees (825) 144 (186) Changes in operating assets and liabilities: Customer receivables (82) 51 (132) Other receivables (26) (5) (2) Material, supplies and fossil fuel inventory (133) 39 (6) Other current assets (9) (8) (10) Deferred pension cost (52) (78) (99) Accounts payable 221 171 84 Customers’ deposits 35 42 30 Margin cash deposits 382 - - Income taxes (71) (61) (52) Interest and other taxes 17 (1) 29 Other current liabilities (44) 27 74 Other liabilities 33 33 (27) Other – net 36 (18) 41 Net cash provided by operating activities 1,238 1,948 1,557
CASH FLOWS FROM INVESTING ACTIVITIES Capital expenditures (1,616) (1,394) (1,383) Proceeds from sale of securities 2,759 2.072 2.702 Purchases of securities (2,759) (2,072) (2,702) Contributions to special use funds (111) (134) (157) Reimbursements from special use funds 8 218 - Nuclear fuel purchases (95) (90) (26) Other – net (2) - 1 Net cash used in investing activities (1,816) (1,400) (1,565)
CASH FLOWS FROM FINANCING ACTIVITIES Issuances of long-term debt 588 236 877 Retirements of long-term debt (500) - (388) Issuances of preferred stock - 20 - Retirements of preferred stock (25) - (228) Net change in short-term debt 667 (139) (121) Capital contributions from FPL Group - - 600 Dividends (161) (604) (728) Net cash provided by (used in) financing activities 569 (487) 12
Net increase (decrease) in cash and cash equivalents (9) 61 4Cash and cash equivalents at beginning of year 65 4 -Cash and cash equivalents at end of year $ 56 $ 65 $ 4
SUPPLEMENTAL DISCLOSURES OF CASH FLOW INFORMATION Cash paid for interest (net of amount capitalized) $ 217 $ 167 $ 155 Cash paid (received) for income taxes – net $ (46) $ (60) $ 292
SUPPLEMENTAL SCHEDULE OF NONCASH INVESTING AND FINANCING ACTIVITIES Additions to capital lease obligations $ - $ - $ 41 Additions to debt through the adoption of FIN 46 $ - $ - $ 164
The accompanying Notes to Consolidated Financial Statements are an integral part of these statements.

54
FLORIDA POWER & LIGHT COMPANYCONSOLIDATED STATEMENTS OF COMMON SHAREHOLDER’S EQUITY
(millions)
CommonStock (a)
AdditionalPaid-In Capital
AccumulatedOther
ComprehensiveIncome (Loss) (b)
RetainedEarnings
CommonShareholder’s
Equity
Balances, December 31, 2002 $ 1,373 $ 3,716 $ (2) $ 295 Net income available to FPL Group - - - 733 Capital contributions from FPL Group - 600 - - Dividends to FPL Group - - - (715) Other comprehensive income - - 2 (c) - Other - 2 - -
$ 6,004Balances, December 31, 2003 1,373 4,318 - 313 Net income available to FPL Group - - - 749 Dividends to FPL Group - - - (603)Balances, December 31, 2004 1,373 4,318 - 459 $ 6,150 Net income available to FPL Group - - - 748 Dividends to FPL Group - - - (161)Balances, December 31, 2005 $ 1,373 $ 4,318 $ - $ 1,046 $ 6,737_____________________(a) Common stock, no par value, 1,000 shares authorized, issued and outstanding.(b) Comprehensive income, which includes net income and other comprehensive income (loss), totaled approximately $748 million, $749 million and $735 million for
2005, 2004 and 2003, respectively.(c) Minimum supplemental employee retirement plan liability adjustment.
The accompanying Notes to Consolidated Financial Statements are an integral part of these statements.
55
FPL GROUP, INC. AND FLORIDA POWER & LIGHT COMPANYNOTES TO CONSOLIDATED FINANCIAL STATEMENTS
Years Ended December 31, 2005, 2004 and 2003
1. Summary of Significant Accounting and Reporting Policies
Basis of Presentation – FPL Group, Inc.'s (FPL Group) operations are conducted primarily through its wholly-ownedsubsidiary Florida Power & Light Company (FPL) and its wholly-owned indirect subsidiary FPL Energy, LLC (FPLEnergy). FPL, a rate-regulated public utility, supplies electric service to approximately 4.3 million customer accountsthroughout most of the east and lower west coasts of Florida. FPL Energy invests in independent power projects throughboth controlled and consolidated entities and non-controlling ownership interests in joint ventures essentially all of which areaccounted for under the equity method.
The consolidated financial statements of FPL Group and FPL include the accounts of their respective majority-owned andcontrolled subsidiaries. All significant intercompany balances and transactions have been eliminated in consolidation. Certainamounts included in prior years' consolidated financial statements have been reclassified to conform to the current year'spresentation. The preparation of financial statements requires the use of estimates and assumptions that affect the reportedamounts of assets, liabilities, revenues and expenses and the disclosure of contingent assets and liabilities. Actual resultscould differ from those estimates.
Regulation – FPL is subject to regulation by the Florida Public Service Commission (FPSC) and the Federal EnergyRegulatory Commission (FERC). Its rates are designed to recover the cost of providing electric service to its customersincluding a reasonable rate of return on invested capital. As a result of this cost-based regulation, FPL follows the accountingpractices set forth in Statement of Financial Accounting Standards No. (FAS) 71, "Accounting for the Effects of Certain Typesof Regulation." FAS 71 indicates that regulators can create assets and impose liabilities that would not be recorded bynon-rate regulated entities. Regulatory assets and liabilities represent probable future revenues that will be recovered from orrefunded to customers through the ratemaking process.
Cost recovery clauses, which are designed to permit full recovery of certain costs and provide a return on certain assetsallowed to be recovered through the various clauses, include substantially all fuel, purchased power and interchangeexpenses, conservation and certain environmental-related expenses, certain revenue taxes and franchise fees. Revenuesfrom cost recovery clauses are recorded when billed; FPL achieves matching of costs and related revenues by deferring thenet under- or over-recovery. Any under-recovered costs or over-recovered revenues are collected from or returned tocustomers in subsequent periods. Although deferred clause revenues and expenses do not significantly affect net income,the under- or over-recoveries can significantly affect FPL Group's and FPL's operating cash flows.
Beginning in 2004, in order to comply with a U.S. Nuclear Regulatory Commission (NRC) order, FPL incurred additional costto modify its security systems at its St. Lucie and Turkey Point nuclear units. During 2005 and 2004, FPL incurred anddeferred pursuant to an FPSC order approximately $12 million and $25 million, respectively, in additional costs as aregulatory asset (included in regulatory assets – other) and, in 2005, accrued interest on the deferred amount at anFPSC-approved rate of 7.29%. During 2005, FPL reduced the regulatory asset by the amount of the reduction in thedecommissioning accrual approved by the FPSC in the 2005 rate agreement discussed below. Effective January 1, 2006, theremaining balance of approximately $13 million will be included in rate base, amortized over a four-year period and includedin depreciation expense.
In 2000, a bankruptcy court approved a $222.5 million settlement of a contract dispute between FPL and two qualifyingfacilities. As approved by the FPSC, FPL is recovering the cost of the settlement through the fuel and purchased power costrecovery clause (fuel clause) and capacity cost recovery clause (capacity clause) over a five-year period which beganJanuary 1, 2002. The settlement cost is included in deferred clause and franchise expenses and litigation settlement on FPLGroup's and FPL's consolidated balance sheets.
If FPL were no longer subject to cost-based rate regulation, the regulatory assets and liabilities would be written off unlessregulators specify an alternative means of recovery or refund. In addition, the FPSC has the authority to disallow recovery ofcosts that it considers excessive or imprudently incurred. The continued applicability of FAS 71 is assessed at each reportingperiod.
Revenues and Rates – FPL's retail and wholesale utility rate schedules are approved by the FPSC and the FERC,respectively. FPL records unbilled base revenues for the estimated amount of energy delivered to customers but not yetbilled. Unbilled base revenues are included in customer receivables and amounted to approximately $123 million and $135million at December 31, 2005 and 2004, respectively. FPL's operating revenues also include amounts resulting from costrecovery clauses (see Regulation), franchise fees, gross receipts taxes and beginning in 2005 a surcharge related to therecovery of storm restoration costs associated with the 2004 hurricanes (see Storm Reserve Deficiency). Franchise fees andgross receipts taxes are imposed on FPL; however, the FPSC allows FPL to include in the amounts charged to customers theamount of the gross receipts tax for all customers and the franchise amount for those customers located in the jurisdictionthat imposes the fee. Accordingly, franchise fees and gross receipts taxes are reported gross in operating revenues andtaxes other than income taxes on FPL Group's and FPL's consolidated statements of income and were approximately $604million, $558 million and $527 million in 2005, 2004 and 2003, respectively. FPL also collects municipal utility taxes which arereported gross in customer receivables and accounts payable on FPL Group's and FPL's consolidated balance sheets.

FPL GROUP, INC. AND FLORIDA POWER & LIGHT COMPANYNOTES TO CONSOLIDATED FINANCIAL STATEMENTS (Continued)
56
In August 2005, FPL and all of the interveners in its 2005 rate case filing signed a stipulation and settlement agreementregarding FPL’s retail base rates, which was subsequently approved by the FPSC (2005 rate agreement). The 2005 rateagreement will be in effect through December 31, 2009, and thereafter shall remain in effect until terminated on the date newretail base rates become effective pursuant to an FPSC order. The 2005 rate agreement replaced a rate agreement that waseffective April 15, 2002 through December 31, 2005 (2002 rate agreement).
The 2005 rate agreement provides that retail base rates will not increase during the term of the agreement except to allowrecovery of the revenue requirements of any power plant approved pursuant to the Florida Power Plant Siting Act (Siting Act)that achieves commercial operation during the term of the 2005 rate agreement. The 2005 rate agreement also continues therevenue sharing mechanism in FPL’s 2002 rate agreement, whereby revenues from retail base operations in excess ofcertain thresholds will be shared with customers on the basis of two-thirds refunded to customers and one-third retained byFPL. Revenues from retail base operations in excess of a second, higher threshold (cap) will be refunded 100% tocustomers. The revenue sharing threshold and cap for 2006 will be $3,991 million and $4,156 million, respectively, whichwas established by using the 2005 revenue sharing threshold and cap of $3,880 million and $4,040 million, respectively, andincreasing them by the average annual growth rate in retail kilowatt-hour (kwh) sales for the ten-year period endingDecember 31, 2005. For each succeeding year, retail base rate revenue sharing threshold and cap amounts will beestablished by increasing the prior year’s threshold and cap by the sum of the following: (i) the average annual growth rate inretail kwh sales for the ten-year period ending December 31 of the preceding year multiplied by the prior year’s retail baserate revenue sharing threshold and cap and (ii) the amount of any incremental base rate increases for power plants approvedpursuant to the Siting Act that achieve commercial operation during the term of the 2005 rate agreement.
Under both the 2005 and 2002 rate agreements, the accrual for the refund associated with the revenue sharing mechanism iscomputed monthly for each twelve-month period of the rate agreement. At the beginning of each twelve-month period,planned revenues are reviewed to determine if it is probable that the threshold will be exceeded. If so, an accrual is recordedeach month for a portion of the anticipated refund based on the relative percentage of year-to-date planned revenues to thetotal estimated revenues for the twelve-month period, plus accrued interest. In addition, if in any month actual revenues areabove or below planned revenues, the accrual is increased or decreased as necessary to recognize the effect of this varianceon the expected refund amount. Under both the 2005 and 2002 rate agreements, the annual refund (including interest) ispaid to customers as a credit to their February electric bill. At December 31, 2005 and 2004, there was no refund due tocustomers.
Under the terms of the 2005 rate agreement: (i) FPL’s electric property depreciation rates will be based upon thecomprehensive depreciation studies it filed with the FPSC in March 2005; however, FPL may reduce depreciation by up to$125 million annually, (ii) FPL suspended contributions of approximately $79 million per year to its nuclear decommissioningfund beginning in September 2005, (iii) FPL suspended contributions of $20.3 million per year to its storm and propertyinsurance reserve beginning in January 2006 and has the ability to recover prudently incurred storm restoration costs, eitherthrough securitization pursuant to Section 366.8260 of the Florida Statutes or through surcharges, and (iv) FPL will beallowed to recover through a cost recovery clause prudently incurred incremental costs associated with complying with anFPSC or FERC order regarding a regional transmission organization.
FPL will not have an authorized regulatory ROE under the 2005 rate agreement for the purpose of addressing earningslevels. For all other regulatory purposes, FPL will have an ROE of 11.75%. The revenue sharing mechanism describedabove will be the appropriate and exclusive mechanism to address earnings levels. However, if FPL’s regulatory ROE, asreported to the FPSC in FPL’s monthly earnings surveillance report, falls below 10% during the term of the 2005 rateagreement, FPL may petition the FPSC to amend its base rates.
The 2002 rate agreement provided for a $250 million annual reduction in retail base revenues allocated to all customers byreducing customers’ base rates and service charges by approximately 7% as well as a revenue sharing mechanism based onstated thresholds. During the term of the 2002 rate agreement, FPL did not have an authorized regulatory ROE range for thepurpose of addressing earnings levels and FPL reduced depreciation on its plant in service by $125 million each year.
FPL Energy’s revenue is recorded as electricity is delivered, which is when revenue is earned. FPL Energy’s retail energybusiness records unbilled revenues for the estimated amount of energy delivered to customers but not yet billed. Unbilledrevenues are included in customer receivables and amounted to approximately $30 million at December 31, 2005.
Electric Plant, Depreciation and Amortization – The cost of additions to units of utility property of FPL and FPL Energy isadded to electric utility plant. In accordance with regulatory accounting, the cost of FPL's units of utility property retired, lessestimated net salvage value, is charged to accumulated depreciation. Maintenance and repairs of property as well asreplacements and renewals of items determined to be less than units of utility property are charged to other operations andmaintenance (O&M) expenses. At December 31, 2005, the electric generating, transmission, distribution and generalfacilities of FPL represented approximately 45%, 12%, 37% and 6%, respectively, of FPL's gross investment in electric utilityplant in service. Substantially all of FPL's properties are subject to the lien of FPL's mortgage, which secures most debtsecurities issued by FPL. A number of FPL Energy's generating facilities are encumbered by liens against their assetssecuring various financings. The total amount of FPL Energy's assets serving as collateral was approximately $3.7 billion atDecember 31, 2005.

FPL GROUP, INC. AND FLORIDA POWER & LIGHT COMPANYNOTES TO CONSOLIDATED FINANCIAL STATEMENTS (Continued)
57
Depreciation of FPL’s electric property is primarily provided on a straight-line average remaining life basis. FPL includes indepreciation expense a provision for fossil plant dismantlement and nuclear plant decommissioning (see Decommissioning ofNuclear Plants, Dismantlement of Plants and Other Accrued Asset Removal Costs). For substantially all of FPL’s property,depreciation studies are performed and filed with the FPSC at least every four years; however, the 2002 rate agreementrequired FPL to continue to depreciate its electric property based on rates approved in April 1999 that became effectiveJanuary 1, 1998. The weighted annual composite depreciation rate for FPL’s electric plant in service, including intangiblesoftware, but excluding the effects of decommissioning and dismantlement, was approximately 4.3%, 4.2% and 4.3% for2005, 2004 and 2003, respectively. These rates exclude the depreciation adjustments discussed below. Pursuant to the2005 rate agreement, FPL implemented new depreciation rates on January 1, 2006. FPL Energy’s electric plants in serviceless salvage value are depreciated using the straight-line method over their estimated useful lives. FPL Energy’s effectivedepreciation rates were 3.9%, 3.9% and 3.9% for 2005, 2004 and 2003, respectively.
Under the 2002 and 2005 rate agreements (see Revenues and Rates), FPL may reduce depreciation by up to $125 millionannually during the term of the rate agreements. These depreciation adjustments are included in earnings. The amountsrecorded during the 2002 rate agreement were allocated primarily to the nuclear depreciation reserve. The amounts to berecorded during the 2005 rate agreement will be allocated to the appropriate assets when FPL files its comprehensivedepreciation studies at the end of the 2005 rate agreement.
Nuclear Fuel – FPL leases nuclear fuel for all four of its nuclear units. Beginning July 1, 2003, the lessor was consolidated byFPL as a result of adopting the Financial Accounting Standards Board's (FASB) Interpretation No. (FIN) 46, "Consolidation ofVariable Interest Entities." See Note 9 – FPL. For ratemaking purposes, these leases are treated similar to operatingleases. For financial reporting, prior to July 1, 2003, these leases were recorded as capital leases. Nuclear fuel leaseexpense was $31 million for the six months ended June 30, 2003. Included in this expense was an interest component of $1million for the six months ended June 30, 2003. Until July 1, 2003, the lease payments were charged to fuel expense on aunit of production method. Beginning July 1, 2003, the cost of nuclear fuel was capitalized and is being amortized to fuelexpense on a unit of production method except for the interest component, which is recorded as interest expense. Thesecharges, as well as a charge for spent nuclear fuel, are recovered through the fuel clause. FPL makes quarterly payments tothe lessor for the lease commitments. Under certain circumstances of lease termination, the associated debt ($194 million atDecember 31, 2005), which was recorded in commercial paper and long-term debt on FPL Group's and FPL's consolidatedbalance sheets, would become due.
Seabrook Station (Seabrook) has several contracts for the supply, conversion, enrichment and fabrication of nuclearfuel. See Note 16 – Contracts. Seabrook's nuclear fuel costs are charged to fuel expense on a unit of production method.
Construction Activity – Allowance for funds used during construction (AFUDC) is a non-cash item which represents theallowed cost of capital, including an ROE, used to finance construction projects. The portion of AFUDC attributable toborrowed funds is recorded as a reduction of interest expense and the remainder is recorded as other income. The FPSCrules limit the recording of AFUDC to projects that cost in excess of 0.5% of a utility's plant in service balance and requiremore than one year to complete. The FPSC rules allow construction projects below the 0.5% threshold as a component ofrate base. During 2005, 2004 and 2003, AFUDC was capitalized at a rate of 7.42%, 7.29% and 7.84%, respectively, andamounted to approximately $41 million, $48 million and $18 million, respectively. See Note 16 – Commitments.
FPL's construction work in progress at December 31, 2005 includes construction materials, progress payments on majorequipment contracts, third party engineering costs and other costs directly associated with the construction of variousprojects. Upon completion of the projects, these costs are transferred to electric utility plant in service. At December 31,2005 and 2004, FPL recorded approximately $156 million and $135 million, respectively, of construction accruals, which areincluded in other current liabilities on FPL Group's and FPL's consolidated balance sheets.
FPL Energy capitalizes project development costs once it is probable that such costs will be realized through the ultimateconstruction of a power plant. At December 31, 2005 and 2004, FPL Energy's capitalized development costs totaledapproximately $19 million and $15 million, respectively, which are included in other assets on FPL Group's consolidatedbalance sheets. These costs include emission reduction credits, land rights and other third party costs directly associatedwith the development of a new project. Upon commencement of construction, these costs either are transferred toconstruction work in progress or remain in other assets, depending upon the nature of the cost. Capitalized developmentcosts are charged to O&M expenses when the development of a project is no longer probable. In addition to capitalizeddevelopment costs, FPL Energy capitalizes interest on its construction projects. Interest capitalized on construction projectsamounted to $8 million, $43 million and $83 million during 2005, 2004 and 2003, respectively. FPL Energy's interest chargesare based on a deemed capital structure of 50% debt for operating projects and 100% debt for projects under construction.
FPL Energy's construction work in progress includes construction materials, prepayments on turbine generators, third partyengineering costs, interest and other costs directly associated with the construction and development of the project. Uponcommencement of plant operation, these costs are transferred to electric utility plant in service and other property. AtDecember 31, 2005 and 2004, FPL Energy recorded approximately $73 million and $55 million, respectively, of constructionaccruals, which are included in other current liabilities on FPL Group's consolidated balance sheets.

FPL GROUP, INC. AND FLORIDA POWER & LIGHT COMPANYNOTES TO CONSOLIDATED FINANCIAL STATEMENTS (Continued)
58
Asset Retirement Obligations – FPL Group and FPL adopted FAS 143, “Accounting for Asset Retirement Obligations” andFIN 47, “Accounting for Conditional Asset Retirement Obligations” effective January 1, 2003 and December 31, 2005,respectively. See Note 15.
Decommissioning of Nuclear Plants, Dismantlement of Plants and Other Accrued Asset Removal Costs – Following are thecomponents of FPL Group's and FPL's decommissioning of nuclear plants, dismantlement of plants and other accrued assetremoval costs:
FPL
NuclearDecommissioning
FossilDismantlement
Interim RemovalCosts
and Other FPL Energy FPL GroupDecember 31, December 31, December 31, December 31, December 31,
2005 2004 2005 2004 2005 2004 2005 2004 2005 2004(millions)
Asset retirement obligations (ARO) $ 1,460 $ 2,013 $ 11 $ 2 $ 3 $ - $ 211 $ 192 $ 1,685 $ 2,207Less capitalized ARO asset net of accumulated depreciation 57 214 2 1 1 - - - 60 215Accrued asset removal costs (a) 178 158 277 291 1,578 1,563 - - 2,033 2,012Asset retirement obligation regulatory expense difference (a) 770 267 16 (1) - - - - 786 266Accrued decommissioning, dismantlement and other accrued asset removal costs $ 2,351 (b) $ 2,224 (b) $ 302 (b) $ 291 (b) $ 1,580 (b) $ 1,563 (b) $ 211 $ 192 $ 4,444 $ 4,270
_____________________(a) Regulatory liability on FPL Group’s and FPL’s consolidated balance sheets.(b) Represents total amount accrued for ratemaking purposes.
FPL – For ratemaking purposes, FPL accrues for the cost of end of life retirement and disposal of its nuclear and fossil plantsover the expected service life of each unit based on nuclear decommissioning and fossil dismantlement studies periodicallyfiled with the FPSC. In addition, FPL accrues for interim removal costs over the life of the related assets based ondepreciation studies approved by the FPSC. For financial reporting purposes, FPL recognizes decommissioning anddismantlement liabilities in accordance with FAS 143 and FIN 47. Any differences between expense recognized under FAS143 and FIN 47 and the amount recoverable through rates are deferred in accordance with FAS 71. See Electric Plant,Depreciation and Amortization and Note 15.
Nuclear decommissioning studies are performed at least every five years and are submitted to the FPSC for approval. FPLfiled updated nuclear decommissioning studies with the FPSC in December 2005. The studies filed in December 2005support the suspension, effective September 2005, of the $79 million annual decommissioning accrual as indicated in the2005 rate agreement. These studies reflect FPL’s current plans, under the extended operating licenses, for promptdismantlement of Turkey Point Units Nos. 3 and 4 with decommissioning activities commencing in 2032 and 2033,respectively, and provide for St. Lucie Unit No. 1 to be mothballed beginning in 2036 with decommissioning activities to beintegrated with the prompt dismantlement of St. Lucie Unit No. 2 at the end of its useful life in 2043. These studies alsoassume that FPL will be storing spent fuel on site pending removal to a U.S. government facility. The studies indicate FPL’sportion of the ultimate costs of decommissioning its four nuclear units, including costs associated with spent fuel storage, tobe $10.9 billion. FPL’s portion of the ultimate cost of decommissioning its four units, expressed in 2005 dollars, is estimatedby the studies to aggregate $2.0 billion.
During 2005, with respect to costs associated with nuclear decommissioning, FPL recognized approximately $112 millionrelated to ARO accretion expense, approximately $7 million related to depreciation of the capitalized ARO asset,approximately $4 million related to the non-legal obligation included in accrued asset removal costs and an approximately $70million credit to adjust the total accrual to the $53 million approved by the FPSC for decommissioning expense (included indepreciation and amortization expense in FPL Group’s and FPL’s consolidated statements of income). During 2004, withrespect to costs associated with nuclear decommissioning, FPL recognized approximately $106 million related to AROaccretion expense, approximately $8 million related to depreciation of the capitalized ARO asset, approximately $6 millionrelated to the non-legal obligation included in accrued asset removal costs and an approximate $41 million credit to adjust thetotal accrual to the $79 million approved by the FPSC for decommissioning expense (included in depreciation andamortization expense in FPL Group’s and FPL’s consolidated statements of income). During 2003, FPL recognizedapproximately $101 million related to ARO accretion expense, approximately $8 million related to depreciation of thecapitalized ARO asset, approximately $6 million related to the non-legal obligation included in accrued asset removal costsand an approximate $36 million credit to adjust the total accrual to the $79 million approved by the FPSC fordecommissioning expense.
Restricted trust funds for the payment of future expenditures to decommission FPL's nuclear units are included in nucleardecommissioning reserve funds of FPL. Consistent with regulatory treatment, marketable securities held in thedecommissioning funds are classified as available for sale and are carried at market value with market adjustments, includingany other-than-temporary impairment losses, resulting in a corresponding adjustment to the related regulatory liability

FPL GROUP, INC. AND FLORIDA POWER & LIGHT COMPANYNOTES TO CONSOLIDATED FINANCIAL STATEMENTS (Continued)
59
accounts. See Note 10. Contributions to the funds were based on current period decommissioning expense and weresuspended beginning September 2005. Additionally, fund earnings, net of taxes, are reinvested in the funds. Earnings arerecognized as income and an offsetting expense is recorded to reflect a corresponding increase in the related regulatoryliability accounts. As a result, there is no effect on net income. The tax effects of amounts not yet recognized for taxpurposes are included in accumulated deferred income taxes.
Fossil fuel plant dismantlement studies are performed and filed with the FPSC at least every four years. FPL’s latest fossilfuel plant dismantlement studies became effective January 1, 2003. The studies indicate that FPL’s portion of the ultimatecost to dismantle its fossil units is $668 million. FPL recognized fossil dismantlement expense of approximately $19 million ineach of 2005, 2004 and 2003, which is included in depreciation and amortization expense.
FPL Energy – FPL Energy also records a nuclear decommissioning liability for Seabrook in accordance with FAS 143 and FIN47. See Note 15. Seabrook's current decommissioning funding plan is based on an operating license expiration date of2026. The funding plan is based on a comprehensive nuclear decommissioning study reviewed by the New HampshireNuclear Decommissioning Financing Committee (NDFC) in 2003 and is effective for four years. This study assumes thatSeabrook would begin decommissioning in 2026 and that FPL Energy's 88.23% portion of the ultimate cost ofdecommissioning Seabrook, including costs associated with spent fuel storage, is approximately $1.5 billion, or $604 millionexpressed in 2005 dollars. In December 2005, FPL Energy obtained NRC approval to extend the unit's operating licensefrom 2026 to 2030 to recapture the period of non-operation from 1986 to 1990. FPL Energy intends to seek approval from theNRC to renew the unit's operating license for an additional 20 years. At December 31, 2005 and 2004, FPL Energy had anARO related to nuclear decommissioning of $189 million and $175 million, respectively.
FPL Energy's 88.23% portion of Seabrook's restricted trust fund for the payment of future expenditures to decommissionSeabrook is included in FPL Group's nuclear decommissioning reserve funds. Marketable securities held in thedecommissioning fund are classified as available for sale and are carried at market value with market adjustments resulting ina corresponding adjustment to other comprehensive income. Any unrealized losses associated with marketable securitiesthat are determined to be other-than-temporarily impaired would be recognized as an expense in FPL Group's consolidatedstatements of income. Fund earnings are recognized in income and are reinvested in the funds either on a pretax or after-taxbasis. The tax effects of amounts not yet recognized for tax purposes are included in accumulated deferred incometaxes. See Note 10.
Accrual for Major Maintenance Costs – Consistent with regulatory treatment, FPL’s estimated nuclear maintenance costs foreach nuclear unit’s next planned outage are accrued over the period from the end of the last outage to the end of the nextplanned outage. Any difference between the estimated and actual costs is included in O&M expenses when known. Theestimated costs for inspection and repair of FPL’s four reactor vessel heads were deferred and are being amortized on alevelized basis over a five-year period beginning in 2002 as authorized by the FPSC, and amounted to approximately $11million in 2005, $10 million in 2004 and $13 million in 2003. The accrued liability for nuclear maintenance costs, includingthose for the reactor vessel heads, at December 31, 2005 and 2004 totaled approximately $79 million and $74 million,respectively, and is included in other liabilities. For the years ended December 31, 2005, 2004 and 2003, FPL recognizedapproximately $160 million, $164 million and $157 million, respectively, in nuclear maintenance costs (including reactorvessel head inspection and repair costs) which are included in O&M expenses in FPL Group’s and FPL’s consolidatedincome statements.
FPL Energy's estimated major maintenance costs for its combustion turbine and nuclear generating units' next plannedoutage are accrued over the period from the end of the last outage to the end of the next planned outage. Any differencebetween the estimated and actual costs is included in O&M expenses when known. The accrued liability for FPL Energy'smajor maintenance costs totaled approximately $114 million and $83 million at December 31, 2005 and 2004, respectively,and is included in other liabilities. For the years ended December 31, 2005, 2004 and 2003, FPL Energy recognizedapproximately $78 million, $80 million and $54 million in major maintenance costs which are included in O&M expenses inFPL Group's consolidated income statements.
Cash Equivalents – Cash equivalents consist of short-term, highly liquid investments with original maturities of three monthsor less.
Restricted Cash – At both December 31, 2005 and 2004, FPL Group had approximately $56 million of restricted cashincluded in other current assets on FPL Group's consolidated balance sheets, essentially all of which is restricted for debtservice payments and O&M expenses, as well as for margin collateral in 2005 and construction liabilities in 2004.
Allowance for Doubtful Accounts – FPL maintains an accumulated provision for uncollectible customer accounts receivablethat is determined by multiplying the previous six months of revenues by a bad debt percentage, which represents an averageof the past two years' actual write-offs. Additional amounts are included in the provision to address specific items that are notconsidered in the calculation described above. FPL Energy regularly reviews collectibility of its receivables and establishes aprovision for losses estimated as a percentage of revenue based on the historical bad debt write-off trends for its retail energybusiness, and when necessary using the specific identification method for all other receivables.

FPL GROUP, INC. AND FLORIDA POWER & LIGHT COMPANYNOTES TO CONSOLIDATED FINANCIAL STATEMENTS (Continued)
60
Inventory – FPL values materials, supplies and fossil fuel inventory using a weighted-average cost method. FPL Energy'smaterials, supplies and oil and gas inventories are carried at the lower of weighted-average cost or market.
Energy Trading – FPL Group and FPL engage in limited energy trading activities to optimize the value of electricity and fuelcontracts and generating facilities, as well as to take advantage of expected favorable commodity price movements. Inaccordance with Emerging Issues Task Force Issue No. (EITF) 02-3, trading contracts that meet the definition of a derivativeare accounted for at market value and realized gains and losses from all trading contracts, including those where physicaldelivery is required, are recorded net for all periods presented. See Note 4.
Storm Reserve Deficiency – The storm reserve deficiency represents storm restoration costs incurred by FPL that exceededthe amounts in the storm and property insurance reserve, which provided FPL coverage toward storm damage costs andpossible retrospective premium assessments stemming from a nuclear incident under the various insurance programscovering FPL's nuclear generating plants. The storm restoration costs were associated with hurricanes that affected FPL'sservice territory in 2004 and 2005. At December 31, 2005 and 2004, FPL's storm reserve deficiency totaled approximately$1.1 billion and $536 million, respectively, a portion of which is included in current assets.
The storm reserve deficiency associated with the 2004 hurricanes, plus interest, is being recovered primarily through a stormdamage surcharge applied to retail customer bills over a 36-month period that began in February 2005, and totaledapproximately $297 million at December 31, 2005. During 2005, FPL billed to customers approximately $155 million throughthe storm damage surcharge, which is included in operating revenues on the consolidated statements of income. Acorresponding expense for the amortization of the storm reserve deficiency is shown as a separate line on the consolidatedstatements of income. The remaining balance of the storm reserve deficiency primarily relates to the storm restoration costsassociated with Hurricanes Dennis, Katrina, Rita and Wilma that struck FPL's service territory in 2005. In January 2006, FPLpetitioned the FPSC for approval to recover approximately $1.7 billion of storm costs through the issuance of $1,050 million ofstorm recovery bonds pursuant to the securitization provisions of Section 366.8260 of the Florida Statutes. The storm bondproceeds will provide for the net-of-tax recovery of the remaining balance of the unrecovered hurricane costs of $1,040 million(estimated balance as of July 31, 2006) and the replenishment of the storm reserve to approximately $650 million. If theFPSC determines that the storm restoration costs should not be securitized and instead should be recovered through anothermeans, FPL has recommended as an alternative recovering the 2005 hurricane costs through a surcharge overapproximately three years and implementing a separate surcharge to fund a $650 million storm reserve. The FPSC'sdecision is expected in May 2006. On February 2, 2006, several interested parties filed a motion to dismiss FPL’s petition,claiming that the petition did not satisfy certain technical requirements. FPL filed its response to the motion on February 6,2006, asserting that the requirements cited are not applicable to FPL's petition and which were met in any event. The FPSChas the right to review FPL's storm charges for prudence, and has the authority to determine the manner and timing ofrecovery.
Investments in Leveraged Leases – Subsidiaries of FPL Group, other than FPL, have investments in leveraged leases, whichat December 31, 2005 and 2004 totaled $28 million and $81 million, respectively, and are included in other investments onFPL Group's consolidated balance sheets. The related deferred tax liabilities totaled $28 million and $80 million atDecember 31, 2005 and 2004, respectively, and are included in accumulated deferred income taxes.
Impairment of Long-Lived Assets – FPL Group evaluates on an ongoing basis the recoverability of its assets for impairmentwhenever events or changes in circumstances indicate that the carrying amount may not be recoverable as described inFAS 144, "Accounting for the Impairment or Disposal of Long-Lived Assets." See Note 6.
Goodwill and Other Intangible Assets – At December 31, 2005, FPL Energy had recorded, after certain purchase priceallocation adjustments, approximately $72 million of goodwill within its merchant reporting unit, and approximately $27 millionof intangible assets for customer lists (net of accumulated amortization of approximately $2 million) in connection with the2005 acquisition of Gexa Corp. The intangible asset for customer lists is being amortized on a straight-line basis over itsestimated economic life of 8 years. The acquisition of Gexa Corp. was accounted for using the purchase method ofaccounting.
FPL Energy's other intangible assets consist primarily of power purchase agreements, transmission and land rights, permitsand licenses and totaled approximately $75 million and $79 million at December 31, 2005 and 2004, respectively, net ofaccumulated amortization. Other intangible assets are amortized over their estimated useful lives.
FPL Energy's goodwill and other intangible assets are included in other assets on FPL Group's consolidated balancesheets. In accordance with FAS 142, "Goodwill and Other Intangible Assets," goodwill is assessed for impairment at leastannually by applying a fair value based test. Other intangible assets are periodically reviewed when impairment indicators arepresent to assess recoverability from future operations using undiscounted future cash flows in accordance with FAS 144.
Stock-Based Compensation – Effective January 1, 2004, FPL Group adopted the fair value recognition provisions of FAS 123,"Accounting for Stock-Based Compensation." FPL Group selected the modified prospective method of adoption described inFAS 148, "Accounting for Stock-Based Compensation – Transition and Disclosure." Under that method, stock-basedemployee compensation cost recognized in 2004 is the same as that which would have been recognized had the fair value

FPL GROUP, INC. AND FLORIDA POWER & LIGHT COMPANYNOTES TO CONSOLIDATED FINANCIAL STATEMENTS (Continued)
61
recognition provisions of FAS 123 been applied from its original effective date. Prior to 2004, FPL Group accounted for itsstock-based compensation plans under the intrinsic value based method as permitted by FAS 123.
The following table illustrates the effect on net income and earnings per share of common stock as if FPL Group’scompensation expense had been determined using the fair value based method in each period:
Years Ended December 31,2005 2004 2003
(millions, except per share amounts)
Net income, as reported $ 885 $ 887 $ 890
Add: total stock-based employee compensation expense included in reported net income, net of related income tax effects 18 17 12
Deduct: total stock-based employee compensation expense determined under fair value based method, net of related income tax effects (18) (17) (19)
Pro forma net income $ 885 $ 887 $ 883
Earnings per share of common stock: Basic – as reported $ 2.33 $ 2.47 $ 2.51 Basic – pro forma $ 2.33 $ 2.47 $ 2.49
Assuming dilution – as reported $ 2.29 $ 2.45 $ 2.50 Assuming dilution – pro forma $ 2.29 $ 2.45 $ 2.48
On January 1, 2006, FPL Group adopted FAS 123(R), "Share-Based Payment." The statement requires costs related toshare-based payment transactions to be recognized in the financial statements based on grant-date fair value. Because FPLGroup adopted the fair value recognition provisions of FAS 123, "Accounting for Stock-Based Compensation," on January 1,2004, the adoption of FAS 123(R) will not have a significant financial impact for the year ending December 31, 2006.
Retirement of Long-Term Debt – Gains and losses that result from differences in FPL's reacquisition cost and the book valueof long-term debt which is retired are deferred and amortized to interest expense ratably over the remaining life of the originalissue, which is consistent with its treatment in the ratemaking process. FPL Group Capital Inc (FPL Group Capital)recognizes as expense any such excess at time of retirement.
Retirement of Preferred Stock – Gains and losses that result from differences in FPL's reacquisition cost and the book valueof preferred stock which is retired are recognized as gains or losses by FPL Group and as an addition or reduction to netincome available to FPL Group by FPL.
Income Taxes – Deferred income taxes are provided on all significant temporary differences between the financial statementand tax bases of assets and liabilities. In connection with the tax sharing agreement with FPL Group, FPL's income taxprovision reflects the use of the "separate return method." Included in other regulatory liabilities on FPL Group's and FPL'sconsolidated balance sheets is the revenue equivalent of the difference in accumulated deferred income taxes computedunder FAS 109, "Accounting for Income Taxes," as compared to regulatory accounting rules. This amount is being amortizedin accordance with the regulatory treatment over the estimated lives of the assets or liabilities which resulted in the initialrecognition of the deferred tax amount. Investment tax credits (ITC) for FPL are deferred and amortized to income over theapproximate lives of the related property in accordance with the regulatory treatment. Production tax credits (PTCs) arerecognized as wind energy is generated based on a per kwh rate prescribed in applicable federal and state statutes. PTCsgenerated by certain wind operations of FPL Energy are recorded as a reduction of current income taxes payable, unlesslimited by tax law in which instance they are recorded as deferred tax assets. A valuation allowance is recorded to reduce thecarrying amounts of deferred tax assets unless it is more likely than not that such assets will be realized. Accruals forestimated losses from federal and state income tax contingencies are established when it is probable that an income taxliability has been incurred and the amount of such loss is reasonably estimable. See Note 5.
Guarantees – FPL Group and FPL each account for payment guarantees and related contracts, for which it or a subsidiary isthe guarantor, under FIN 45, "Guarantor's Accounting and Disclosure Requirements for Guarantees Including IndirectGuarantees of Indebtedness of Others," which requires that the fair value of guarantees provided to unconsolidated entitiesentered into after December 31, 2002 be recorded on the balance sheet. See Note 16 – Commitments.
Variable Interest Entities (VIEs) – FIN 46, "Consolidation of Variable Interest Entities," requires FPL Group and FPL to assessthe variable interests they hold and determine if those entities are VIEs. See Note 9.

FPL GROUP, INC. AND FLORIDA POWER & LIGHT COMPANYNOTES TO CONSOLIDATED FINANCIAL STATEMENTS (Continued)
62
2. Proposed Merger
In December 2005, FPL Group and Constellation Energy Group, Inc. (Constellation Energy) entered into an agreement andplan of merger (the merger agreement). In a tax free, stock-for-stock exchange, each share of Constellation Energy commonstock outstanding immediately prior to the merger will be converted into 1.444 shares of Constellation Energy common stockand each share of FPL Group common stock outstanding immediately prior to the merger will be converted into one share ofConstellation Energy common stock. Upon completion of the merger, former FPL Group shareholders will own approximately60 percent and Constellation Energy’s shareholders will own approximately 40 percent of the combined company. FPL Groupwill account for the merger as an acquisition of Constellation Energy under the purchase method of accounting. Thecompanies are working to complete the merger by the end of 2006. However, completion of the merger and the actualclosing date depend upon the satisfaction of a number of conditions, including shareholder approvals and the receipt ofrequired regulatory approvals. The merger agreement contains certain termination rights for FPL Group and ConstellationEnergy and provides that, upon termination of the merger agreement under specified circumstances, one of the parties maybe required to pay a termination fee. In the event a termination fee is payable by Constellation Energy to FPL Group, it wouldequal $425 million. In the event a termination fee is payable by FPL Group to Constellation Energy, it would equal $650million.
3. Employee Retirement Benefits
Employee Benefit Plans and Other Postretirement Plan – FPL Group sponsors a qualified noncontributory defined benefitpension plan for substantially all employees of FPL Group and its subsidiaries. FPL Group also has a non-qualifiedsupplemental defined benefit pension plan that provides benefits to higher-level employees. See Supplemental RetirementPlan below. In addition to pension benefits, FPL Group sponsors a substantially contributory postretirement plan for healthcare and life insurance benefits (other benefits) for retirees of FPL Group and its subsidiaries meeting certain eligibilityrequirements.
Benefit Obligations – FPL Group uses a measurement date of September 30 for its pension and other benefits plans. Thefollowing table provides a reconciliation of the changes in the benefit obligations of the plans:
Pension Benefits Other Benefits2005 2004 2005 2004
(millions)
Obligation at October 1 of prior year $ 1,581 $ 1,516 $ 468 $ 488 Service cost 52 52 8 8 Interest cost 87 84 25 27 Participant contributions - - 5 4 Plan amendments (a) 9 3 - - Actuarial (gains) losses – net (27) 12 (42) (25) Benefit payments (103) (86) (29) (34)Obligation at September 30 $ 1,599 $ 1,581 $ 435 $ 468_____________________(a) Relates to union negotiated credits and, for 2005, also relates to Internal Revenue Code (IRC) transfers and various Supplemental Retirement Plan changes.
FPL Group's accumulated benefit obligation, which includes no assumption about future compensation levels, for its pensionplans at September 30, 2005 and 2004 was $1,548 million and $1,525 million, respectively.
The following table provides the weighted-average assumptions used to determine benefit obligations for the plans. Theserates are used in determining net periodic benefit cost in the following year.
Pension Benefits Other Benefits2005 2004 2005 2004
Discount rate 5.5% 5.5% 5.5% 5.5%Rate of compensation increase 4.0% 4.0% 4.0% 4.0%
An 8.5% annual rate of increase in the per capita cost of covered medical benefits and a 10.5% annual rate of increase in theper capita cost of covered prescription drug benefits was assumed for 2006. The rates are assumed to decrease gradually to5.0% by 2013 and 2017 for medical and prescription drug benefits, respectively, and remain at that level thereafter. Assumedhealth care cost trend rates have a significant effect on the amounts reported for postretirement plans providing health carebenefits. An increase or decrease of one percentage point in assumed health care cost trend rates would have acorresponding effect on the other benefits accumulated obligation of approximately $9 million and $(8) million, respectively, atSeptember 30, 2005.

FPL GROUP, INC. AND FLORIDA POWER & LIGHT COMPANYNOTES TO CONSOLIDATED FINANCIAL STATEMENTS (Continued)
63
Plan Assets – The following table provides a reconciliation of the fair value of assets of the plans. Employer contributions andbenefits paid in the table below include only those amounts contributed directly to, or paid directly from, plan assets.
Pension Benefits Other Benefits2005 2004 2005 2004
(millions)
Fair value of plan assets at October 1 of prior year $ 2,907 $ 2,697 $ 50 $ 54 Actual return on plan assets 331 296 2 6 Employer contributions 6 - 21 20 IRC transfers (a) (21) - - - Participant contributions - - 5 4 Benefit payments (103) (86) (29) (34)Fair value of plan assets at September 30 $ 3,120 $ 2,907 $ 49 $ 50_____________________(a) Represents amounts that were transferred from the qualified pension plan as reimbursement for eligible retiree medical expenses paid by FPL Group pursuant
to the provisions of the IRC.
FPL Group's current investment policy for the pension plan recognizes the benefit of protecting the plan's funded status,thereby avoiding the necessity of future employer contributions. Its broad objectives are to achieve a high rate of total returnwith a prudent level of risk taking while maintaining sufficient liquidity and diversification to avoid large losses while preservingcapital.
FPL Group's pension plan fund has a strategic asset allocation that targets a mix of 50% equity investments and 50% fixedincome investments. The fund's investment strategy emphasizes traditional investments, broadly diversified across the globalequity and fixed income markets, utilizing a combination of different investment styles and vehicles. The pension fund'sequity investments include direct equity holdings and assets classified as equity commingled vehicles. Similarly, its fixedincome investments include direct debt security holdings and assets classified as debt security commingled vehicles. Theseequity and debt security commingled vehicles include common and collective trusts, pooled separate accounts, registeredinvestment companies or other forms of pooled investment arrangements.
At September 30, the asset allocation for FPL Group's pension fund is as follows:
2005 2004Asset CategoryEquity 12% 14%Equity commingled vehicles 39 34Debt securities 30 30Debt security commingled vehicles 19 22Total 100% 100%
With regard to its other benefits, FPL Group's policy is to fund claims as incurred during the year through FPL Groupcontributions, participant contributions and plan assets. The other benefits' assets are invested with a focus on assuring theavailability of funds to pay benefits while maintaining sufficient diversification to avoid large losses and preserve capital. Theother benefits plan fund has a strategic asset allocation that targets a mix of 55% equity investments and 45% fixed incomeinvestments. The fund's investment strategy emphasizes traditional investments, diversified among equity and fixed incomeinvestments. The fund's equity investments include direct equity holdings and assets classified as equity commingledvehicles. Similarly, its fixed income investments include direct debt security holdings and assets classified as debt securitycommingled vehicles. These equity and debt commingled vehicles include common and collective trusts, pooled separateaccounts, registered investment companies or other forms of pooled investment arrangements.
At September 30, the asset allocation for FPL Group's other benefits fund is as follows:
2005 2004Asset CategoryEquity 36% 38%Equity commingled vehicles 21 18Debt securities 1 2
42 42Debt security commingled vehiclesTotal 100% 100%

FPL GROUP, INC. AND FLORIDA POWER & LIGHT COMPANYNOTES TO CONSOLIDATED FINANCIAL STATEMENTS (Continued)
64
Funded Status – The following table reconciles the funded status of the plans to the amounts on the consolidated balancesheets:
Pension Benefits Other Benefits2005 2004 2005 2004
(millions)
Fair value of plan assets $ 3,120 $ 2,907 $ 49 $ 50Benefit obligation (1,599) (1,581) (435) (468)Funded status at September 30 1,521 1,326 (386) (418)Unrecognized prior service (benefit) cost (14) (27) - -Unrecognized transition (asset) obligation - - 25 28Unrecognized (gain) loss (644) (509) 43 87Other (23) (21) 10 8Prepaid (accrued) benefit cost at FPL Group at December 31 $ 840 $ 769 $ (308) $ (295)Prepaid (accrued) benefit cost at FPL at December 31 $ 798 $ 746 $ (282) $ (271)
FPL Group's and FPL's prepaid (accrued) benefit cost shown above are included in the consolidated balance sheets asfollows:
FPL Group FPLPension Benefits Other Benefits Pension Benefits Other Benefits2005 2004 2005 2004 2005 2004 2005 2004
(millions)Prepaid benefit cost included in other assets $ 849 $ 779 $ - $ - $ 803 $ 750 $ - $ -Accrued benefit cost included in other liabilities (14) (19) (308) (295) (6) (5) (282) (271)Intangible asset included in other assets 3 3 - - 1 1 - -Accumulated other comprehensive income 2 6 - - - - - -Prepaid (accrued) benefit cost at December 31 $ 840 $ 769 $ (308) $ (295) $ 798 $ 746 $ (282) $ (271)
Expected Cash Flows – In December 2005, $24 million was transferred from the qualified pension plan as reimbursement foreligible retiree medical expenses paid by FPL Group during the year pursuant to the provisions of the Internal RevenueCode. FPL Group anticipates paying approximately $27 million for eligible retiree medical expenses on behalf of the otherbenefits plan during 2006 with substantially all amounts being reimbursed through a transfer of assets from the qualifiedpension plan pursuant to the provisions of the Internal Revenue Code.
The following table provides information about gross benefit payments expected to be paid by the plans for each of thefollowing calendar years:
PensionBenefits
OtherBenefits
(millions)
2006 $121 $ 342007 $127 $ 372008 $133 $ 402009 $139 $ 402010 $139 $ 402011–2015 $731 $ 187

FPL GROUP, INC. AND FLORIDA POWER & LIGHT COMPANYNOTES TO CONSOLIDATED FINANCIAL STATEMENTS (Continued)
65
Net Periodic Cost – The following table provides the components of net periodic benefit (income) cost for the plans:
Pension Benefits Other BenefitsYears Ended December 31, Years Ended December 31,2005 2004 2003 2005 2004 2003
(millions)
Service cost $ 52 $ 52 $ 52 $ 8 $ 8 $ 7Interest cost 87 84 84 25 27 27Expected return on plan assets (211) (207) (199) (3) (4) (4)Amortization of transition (asset) obligation - (23) (23) 3 3 3Amortization of prior service (benefit) cost (5) (5) (5) - - -Amortization of (gains) losses (15) (21) (28) 4 5 6Supplemental Retirement Plan settlements 3 - 2 - - -Net periodic benefit (income) cost at FPL Group $ (89) $ (120) $ (117) $ 37 $ 39 $ 39Net periodic benefit (income) cost at FPL $ (71) $ (97) $ (95) $ 32 $ 35 $ 35
The following table provides the weighted-average assumptions used to determine net periodic benefit (income) cost for theplans:
Pension Benefits Other BenefitsYears Ended December 31, Years Ended December 31,2005 2004 2003 2005 2004 2003
Discount rate 5.50% 5.50% 6.00% 5.50% 5.50% 6.00%Salary increase 4.00% 4.00% 4.50% 4.00% 4.00% 4.50%Expected long-term rate of return (a) 7.75% 7.75% 7.75% 7.75% 7.75% 7.75%_____________________(a) In developing the expected long-term rate of return on assets assumption for its plans, FPL Group evaluated input from its actuaries as well as information
available in the marketplace. FPL Group considered the 10-year and 20-year historical median returns for a portfolio with an equity/bond asset mix similar to itsfunds. FPL Group also considered its funds’ historical compounded returns. No specific adjustments were made to reflect expectations of future returns.
Assumed health care cost trend rates can have a significant effect on the amounts reported for postretirement plans providinghealth care benefits. An increase or decrease of one percentage point in assumed health care cost trend rates would haveaffected the total service and interest cost recognized at September 30, 2005 by less than $1 million.
Supplemental Retirement Plan – FPL Group also has a non-qualified supplemental defined benefit pension plan that providesbenefits to higher-level employees. The cost of this plan is included in the determination of net periodic benefit income forpension benefits in the preceding tables and amounted to $5 million, $2 million and $5 million for FPL Group for years endedDecember 31, 2005, 2004 and 2003, respectively. The projected benefit obligation is included in the pension benefitsobligation in the preceding tables and amounted to $21 million and $22 million for FPL Group at December 31, 2005 and2004, respectively. Further, the accumulated benefit obligation was $13 million and $19 million for FPL Group ($6 million and$5 million for FPL) at December 31, 2005 and 2004, respectively.
FPL Group established a trust to provide assets that may be used for the benefits payable under the non-qualifiedsupplemental defined benefit pension plan. The trust is irrevocable and, although subject to creditors' claims, assetscontributed to the trust can only be used to pay such benefits with certain exceptions. These assets are included in otherinvestments on the consolidated balance sheets and amounted to $5 million and $11 million for FPL Group ($3 million and$3 million for FPL) at December 31, 2005 and December 31, 2004, respectively.
Employee Contribution Plans – FPL Group offers employee retirement savings plans which allow eligible participants tocontribute a percentage of qualified compensation through payroll deductions. FPL Group makes matching contributions toparticipants' accounts. Defined contribution expense pursuant to these plans was approximately $27 million, $27 million and$25 million for FPL Group ($25 million, $23 million and $21 million for FPL) for years ended December 31, 2005, 2004 and2003, respectively. See Note 12 – Employee Stock Ownership Plan (ESOP).
4. Derivative Instruments
Derivative instruments, when required to be marked to market under FAS 133, "Accounting for Derivative Instruments andHedging Activities," as amended, are recorded on FPL Group's and FPL's consolidated balance sheets as either an asset orliability measured at fair value.

FPL GROUP, INC. AND FLORIDA POWER & LIGHT COMPANYNOTES TO CONSOLIDATED FINANCIAL STATEMENTS (Continued)
66
FPL Group’s and FPL’s mark-to-market derivative instrument assets (liabilities) are included in the consolidated balancesheets as follows:
FPL Group FPLDecember 31, December 31,
2005 2004 2005 2004(millions)
Current derivative assets $ 1,074 $ 110 $ 828 $ 26Other assets 62 24 - -Current derivative liabilities (463) (118) - (6)Other liabilities (387) (111) - -Total mark-to-market derivative instrument assets (liabilities) $ 286 $ (95) $ 828 $ 20
FPL Group and FPL use derivative instruments (primarily swaps, options and forwards) to manage the commodity price riskinherent in the purchase and sale of fuel and electricity, as well as interest rate risk associated with long-term debt. Inaddition, FPL Group uses derivatives to optimize the value of power generation assets. At FPL, substantially all changes infair value are deferred as a regulatory asset or liability until the contracts are settled. Upon settlement, any gains or lossesare passed through the fuel clause and the capacity clause. For FPL Group’s non-rate regulated operations, predominantlyFPL Energy, essentially all changes in the derivatives’ fair value for power purchases and sales and trading activities arerecognized on a net basis in operating revenues; fuel purchases and sales are recognized on a net basis in fuel, purchasedpower and interchange expense; and the equity method investees’ related activity is recognized in equity in earnings of equitymethod investees in FPL Group’s consolidated statements of income unless hedge accounting is applied. While substantiallyall of FPL Energy’s derivative transactions are entered into for the purposes described above, hedge accounting is onlyapplied where specific criteria are met and it is practicable to do so. In order to apply hedge accounting, the transaction mustbe designated as a hedge and it must be highly effective in offsetting the hedged risk. Additionally, for hedges of commodityprice risk physical delivery for forecasted commodity transactions must be probable. FPL Group believes that whereoffsetting positions exist at the same location for the same time, the transactions are considered to have been netted andtherefore physical delivery has not occurred. Transactions for which physical delivery is deemed to have not occurred arepresented on a net basis. Generally, the hedging instrument’s effectiveness is assessed utilizing regression analysis at theinception of the hedge and on at least a quarterly basis throughout its life.
At December 31, 2005, FPL Group had cash flow hedges with expiration dates through December 2010 for energy contractderivative instruments, and interest rate cash flow hedges with expiration dates through November 2019. The effectiveportion of the gain or loss on a derivative instrument designated as a cash flow hedge is reported as a component of othercomprehensive income and is reclassified into earnings in the period(s) during which the transaction being hedged affectsearnings. The ineffective portion of net unrealized losses on these hedges flows through earnings in the current period andamounted to $33 million, $7 million and $2 million for the years ended December 31, 2005, 2004 and 2003,respectively. Settlement gains and losses are included within the line items in the statements of income to which they relate.
Unrealized mark-to-market gains (losses) on derivative transactions for both consolidated subsidiaries and equity methodinvestees are as follows:
Years Ended December 31,2005 2004 2003
(millions)
Consolidated subsidiaries $ (191) $ (23) $ 16Equity method investees $ 1 $ 13 $ 21

FPL GROUP, INC. AND FLORIDA POWER & LIGHT COMPANYNOTES TO CONSOLIDATED FINANCIAL STATEMENTS (Continued)
67
5. Income Taxes
The components of income taxes, including deferred regulatory credit, are as follows:
FPL Group FPLYears Ended December 31, Years Ended December 31,
2005 2004 2003 2005 2004 2003(millions)
Federal: Current $ 26 $ (207) $ (181) $ (80) $ (125) $ 214 Deferred 225 464 507 445 490 145 ITC (19) (20) (20) (19) (20) (20) Total federal 232 237 306 346 345 339State: Current (67) 66 (21) (24) - 37 Deferred 107 (36) 83 86 64 27 Total state 40 30 62 62 64 64Total income taxes $ 272 $ 267 $ 368 $ 408 $ 409 $ 403
A reconciliation between the effective income tax rates and the applicable statutory rates is as follows:
FPL Group FPLYears Ended December 31, Years Ended December 31,
2005 2004 2003 2005 2004 2003
Statutory federal income tax rate 35.0% 35.0% 35.0% 35.0% 35.0% 35.0%Increases (reductions) resulting from: State income taxes – net of federal income tax benefit 2.3 1.7 3.2 3.5 3.6 3.6 Allowance for other funds used during construction (1.0) (1.1) (0.4) (1.0) (1.1) (0.4) Amortization of ITC (1.7) (1.7) (1.6) (1.7) (1.7) (1.7) Production tax credits – FPL Energy (10.8) (9.2) (6.2) - - - Amortization of deferred regulatory credit – income taxes (0.6) (0.6) (0.8) (0.6) (0.6) (0.8) Adjustments of prior years' tax matters - (0.9) (0.6) - (0.2) (0.7) Preferred stock dividends – FPL - - 0.4 - - - Other – net 0.3 (0.1) 0.2 0.1 0.3 (0.2)Effective income tax rate 23.5% 23.1% 29.2% 35.3% 35.3% 34.8%
The income tax effects of temporary differences giving rise to consolidated deferred income tax liabilities and assets are asfollows:
FPL Group FPLDecember 31, December 31,
2005 2004 2005 2004(millions)
Deferred tax liabilities: Property-related $ 3,498 $ 2,996 $ 2,451 $ 2,105 Investment-related 177 274 - - Pension 324 298 310 289 Deferred fuel costs 406 57 406 57 Storm reserve deficiency 417 174 417 174 Other 347 378 156 160 Total deferred tax liabilities 5,169 4,177 3,740 2,785
Deferred tax assets and valuation allowance: Unamortized ITC and deferred regulatory credit – income taxes 15 35 15 35 Decommissioning reserves 268 253 268 253 Postretirement benefits 130 126 120 115 Net operating loss carryforwards 680 213 381 - Tax credit carryforwards 404 235 - - Other 915 763 413 378 Valuation allowance (35) (23) - - Net deferred tax assets 2,377 1,602 1,197 781Net accumulated deferred income taxes $ 2,792 $ 2,575 $ 2,543 $ 2,004

FPL GROUP, INC. AND FLORIDA POWER & LIGHT COMPANYNOTES TO CONSOLIDATED FINANCIAL STATEMENTS (Continued)
68
Deferred tax liabilities associated with property- and investment-related assets reflect additional first year depreciation as allowedby tax legislation. During 2005 and 2004, FPL Group recognized net tax benefits of approximately $25 million and $30 million,respectively, related to certain state tax benefits resulting from the growth of FPL Energy outside the state of Florida and, in 2004,from the resolution of various tax issues. Valuation allowances for 2005 and 2004 relate to the deferral of production tax creditsand operating loss carryforwards.
Deferred tax assets and liabilities are included in the consolidated balance sheets as follows:
FPL Group FPLDecember 31, December 31,
2005 2004 2005 2004(millions)
Other current assets $ 223 $ 110 $ 104 $ -Other current liabilities - - - 55Accumulated deferred income taxes 3,015 2,685 2,647 1,949Net accumulated deferred income taxes $ 2,792 $ 2,575 $ 2,543 $ 2,004
The components of FPL Group’s deferred tax assets relating to net operating loss carryforwards and tax credit carryforwardsat December 31, 2005 are as follows:
AmountExpiration
Date(millions)
Net operating loss carryforwards: Federal $ 539 2024–2025 State 141 2007–2025Total net operating loss carryforwards $ 680
Tax credit carryforwards: Federal $ 378 2023–2025 State 26 2008–2013Total tax credit carryforwards $ 404
6. Restructuring and Impairment Charges
During 2005, FPL Energy recorded a net gain of approximately $13 million ($8 million after-tax) related to the termination of a gassupply contract at one of its investments in joint ventures. The gain is included in equity in earnings of equity method investees inFPL Group's consolidated statements of income. This agreement was terminated in connection with an amended powerpurchase agreement that allows the investee to source power from the wholesale market.
Restructuring charges in 2004 reflect contract restructuring to take advantage of changed market conditions. FPL Energyrecorded a net gain of approximately $52 million ($31 million after tax) related to the termination of a gas supply contract and asteam agreement at one of its investments in joint ventures. These agreements were terminated in connection with an amendedpower purchase agreement that allows the investee to source power from the wholesale market. In addition, FPL Energyrecorded an impairment loss of approximately $47 million ($29 million after tax) to write down its investment in a combined-cyclepower plant in Texas to its fair value as a result of agreeing to sell its interest in the project. The sale was completed in thesecond quarter of 2004. The results of the above transactions are reflected in equity in earnings of equity method investees inFPL Group's consolidated statements of income. Also in 2004, FPL Energy restructured a steam sales agreement on a naturalgas-fired facility in Pennsylvania due to a downturn in market conditions where the plant is operating. The restructuring resultedin a loss of approximately $81 million ($48 million after tax) which includes the write-off of an auxiliary boiler of approximately $33million and a $48 million contract termination payment which was included in other current liabilities on FPL Group's consolidatedbalance sheet at December 31, 2004 and was paid in 2005.

FPL GROUP, INC. AND FLORIDA POWER & LIGHT COMPANYNOTES TO CONSOLIDATED FINANCIAL STATEMENTS (Continued)
69
7. Comprehensive Income
The following table provides the components of comprehensive income and accumulated other comprehensive income (loss):
AccumulatedOther Comprehensive Income (Loss)
NetIncome
Net UnrealizedGains (Losses)
On CashFlow Hedges Other Total
ComprehensiveIncome
(millions)
Balances, December 31, 2002 $ 19 $ (3) $ 16 Net income of FPL Group $ 890 $ 890 Net unrealized gains (losses) on commodity cash flow hedges: Effective portion of net unrealized gain: Consolidated subsidiaries (net of $7 tax expense) 11 - 11 11 Equity method investees (net of $7 tax expense) 11 - 11 11 Reclassification adjustment: (a)
Consolidated subsidiaries (net of $23 tax benefit) (35) - (35) (35) Equity method investees (net of $7 tax benefit) (12) - (12) (12) Net unrealized gains (losses) on interest rate cash flow hedges: Effective portion of net unrealized loss on interest rate swaps (net of $5 tax benefit) (8) - (8) (8) Reclassification from other comprehensive income (OCI) to net income (net of $3 tax expense) 4 - 4 4 Net unrealized gains on available for sale securities (net of $11 tax expense) - 17 17 17Balances, December 31, 2003 (10) 14 4 $ 878 Net income of FPL Group $ 887 $ 887 Net unrealized gains (losses) on commodity cash flow hedges: Effective portion of net unrealized losses: Consolidated subsidiaries (net of $40 tax benefit) (61) - (61) (61) Net unrealized gains (losses) on interest rate cash flow hedges: Effective portion of net unrealized loss on interest rate swaps (net of $4 tax benefit) (6) - (6) (6) Reclassification from OCI to net income (net of $6 tax expense) 10 - 10 10 Net unrealized gains on available for sale securities (net of $4 tax expense) - 7 7 7Balances, December 31, 2004 (67) 21 (46) $ 837 Net income of FPL Group $ 885 $ 885 Net unrealized gains (losses) on commodity cash flow hedges: Effective portion of net unrealized losses: Consolidated subsidiaries (net of $143 tax benefit) (209) - (209) (209) Reclassification from OCI to net income (net of $37 tax expense) 55 - 55 55 Net unrealized gains (losses) on interest rate cash flow hedges: Effective portion of net unrealized gain on interest rate swaps (net of $3 tax expense) 4 - 4 4 Reclassification from OCI to net income (net of $1 tax expense) 2 - 2 2 Net unrealized losses on available for sale securities (net of $0.4 tax benefit) - (1) (1) (1) Supplemental retirement plan liability adjustment (net of $2 tax expense) - 2 2 2Balances, December 31, 2005 $ (215) (b) $ 22 $ (193) $ 738
_____________________(a) Includes amounts reclassified into earnings due to settlements of approximately $44 million and discontinuance of cash flow hedges of approximately $3 million for which
the hedged transaction is no longer probable of occurring.(b) Approximately $62 million of losses included in FPL Group’s accumulated other comprehensive income at December 31, 2005 will be reclassified into earnings within the
next 12 months as either the hedged fuel is consumed, electricity is sold or interest payments are made. Such amount assumes no change in fuel prices, power prices orinterest rates.

FPL GROUP, INC. AND FLORIDA POWER & LIGHT COMPANYNOTES TO CONSOLIDATED FINANCIAL STATEMENTS (Continued)
70
8. Jointly-Owned Electric Plants
The following FPL Group subsidiaries own undivided interests in the jointly-owned facilities described below, and are entitledto a proportionate share of the output from those facilities. FPL and FPL Energy are responsible for their share of theoperating costs, as well as providing their own financing. Accordingly, each subsidiary includes its proportionate share of thefacilities and related revenues and expenses in the appropriate balance sheet and income statement captions. FPL Group’sand FPL’s share of direct expenses for these facilities are included in fuel, purchased power and interchange, otheroperations and maintenance, depreciation and amortization and taxes other than income taxes on FPL Group’s and FPL’sconsolidated statements of income.
FPL Group’s and FPL’s proportionate ownership interest in jointly-owned facilities is as follows:
December 31, 2005Ownership
InterestGross
InvestmentAccumulatedDepreciation
Construction Workin Progress
(millions)
FPL: St. Lucie Unit No. 2 85% $ 1,174 $ 832 $ 106 St. Johns River Power Park units and coal terminal 20% $ 327 $ 197 $ 2 Scherer Unit No. 4 76% $ 588 $ 362 $ - Transmission substation assets located in Seabrook, New Hampshire 88.23% $ 30 $ 10 $ -FPL Energy: (a)
Seabrook 88.23% $ 941 $ 134 $ 18 Wyman Station Unit No. 4 61.78% $ 76 $ 25 $ -_____________________(a) In January 2006, FPL Energy purchased a 70% interest, or approximately 415 megawatts (mw), in the Duane Arnold Energy Center (Duane Arnold), a nuclear
power plant located in Iowa.
9. Variable Interest Entities
FIN 46, as revised (FIN 46R), requires the consolidation of entities which are determined to be VIEs when the reportingcompany determines that it will absorb a majority of the VIE’s expected losses, receive a majority of the VIE’s residual returns,or both. The company that is required to consolidate the VIE is called the primary beneficiary. Conversely, the reportingcompany would not consolidate VIEs in which it has a majority ownership interest when the company is not considered to bethe primary beneficiary. Variable interests are contractual, ownership or other monetary interests in an entity that change asthe fair value of the entity’s net assets, excluding variable interests, change. An entity is considered to be a VIE when itscapital is insufficient to permit it to finance its activities without additional subordinated financial support or its equity investors,as a group, lack the characteristics of having a controlling financial interest.
FPL Group adopted the requirements of FIN 46R in two phases. At the original effective date, July 1, 2003, FPL Groupidentified two VIEs which were consolidated. Revised guidance was issued and became effective March 31, 2004. Asdiscussed below, no additional VIEs were identified for consolidation. The cumulative effect of a change in accountingprinciple of implementing FIN 46 at July 1, 2003 for the VIEs discussed below was approximately a $3 million loss (net ofincome tax benefit of $2 million) for FPL Group and zero for FPL.
FPL – Effective July 1, 2003, FPL consolidates a VIE from which it leases nuclear fuel for its nuclear units. For ratemakingpurposes, these leases are treated as operating leases. For financial reporting, prior to July 1, 2003 the capital leaseobligation was recorded at the amount due to the lessor in the event of lease termination. FPL makes quarterly payments tothe lessor for the lease commitments. The lessor has issued senior secured notes to fund the procurement of nuclear fueland has established a revolving credit facility to support its commercial paper program. FPL has provided an unconditionalguarantee of the payment obligations of the lessor under the notes and credit facility. The consolidated assets of the VIEconsist primarily of nuclear fuel, which had a carrying value of $380 million and $370 million at December 31, 2005 and 2004,respectively.
In its evaluation of the revised guidance as of March 31, 2004, FPL identified two potential VIEs, both of which are consideredqualifying facilities (QFs) as defined by the Public Utility Regulatory Policies Act of 1978, as amended (PURPA). InNovember 2005, the purchased power agreement (PPA) with one of the projects expired and was not renewed. Therefore,FPL has no further involvement with this project. PURPA requires FPL to purchase the electricity output of the remainingproject. As a result, FPL has entered into a PPA with this QF to purchase substantially all of the project's electrical outputover a substantial portion of its estimated useful life. For each megawatt-hour (mwh) provided, FPL pays a per mwh price(energy payment) based upon FPL's avoided cost, which is determined at the time the PPA is executed, and is based on thecost of avoiding the construction and operation of a coal unit. The energy component is primarily based on the cost of coal atan FPL jointly-owned coal-fired facility. The avoided cost is the incremental cost to the utility of the electric energy or

FPL GROUP, INC. AND FLORIDA POWER & LIGHT COMPANYNOTES TO CONSOLIDATED FINANCIAL STATEMENTS (Continued)
71
capacity, or both, which is avoided by neither generating the electricity nor purchasing it from another source. The projecthas a capacity of 250 mw. After making exhaustive efforts, FPL was unable to obtain the information from the projectnecessary to determine whether the project is a VIE or whether FPL is the primary beneficiary of the project. The PPA withthe project contains no provision which legally obligates the project to release this information to FPL. The energy paymentspaid by FPL will fluctuate as coal prices change. This does not expose FPL to losses since the energy payments paid by FPLto the project are passed on to FPL’s customers through the fuel clause as approved by the FPSC. Notwithstanding the factthat FPL’s energy payments are recovered through the fuel clause, if the project was determined to be a VIE, the absorptionof some of the project’s fuel price variability might cause FPL to be considered the primary beneficiary. During the yearsended December 31, 2005 and 2004, FPL purchased 1,813,114 mwh and 1,802,467 mwh, respectively, from the project at atotal cost of approximately $144 million and $141 million, respectively. FPL will continue to make exhaustive efforts to obtainthe necessary information from the project in order to determine if it is a VIE and, if so, whether FPL is the primarybeneficiary.
Additionally, FPL entered into a PPA with a 330 mw coal-fired cogeneration facility (the Facility) in 1995 to purchasesubstantially all of the Facility’s electrical output through 2025. The Facility is considered a QF as defined by PURPA. InNovember 2004, FPL and the Facility reached an agreement to change the index related to the energy payment, triggering anew analysis under FIN 46R. FPL determined that (a) the Facility is a VIE and (b) the PPA represents a variable interest inthe Facility. However, FPL determined that it is not the Facility’s primary beneficiary. During the first quarter of 2005, achange in ownership of the facility occurred, triggering the need to reevaluate whether FPL is the facility’s primarybeneficiary. After making exhaustive efforts, FPL was unable to obtain the information necessary to perform thisreevaluation. The PPA with the Facility contains no provisions which legally obligate the Facility to release this information toFPL. During the years ended December 31, 2005 and 2004, FPL purchased 2,332,000 mwh and 2,265,371 mwh,respectively, from the Facility at a total cost of approximately $191 million and $186 million, respectively. Additionally, thePPA does not expose FPL to losses since the energy payments made by FPL to the Facility are passed on to FPL’scustomers through the fuel clause as approved by the FPSC. FPL will continue to make exhaustive efforts to obtain thenecessary information from the Facility in order to determine if FPL is the Facility’s primary beneficiary.
FPL Energy – In 2000, an FPL Energy subsidiary entered into an operating lease agreement with a special purpose entity(SPE) lessor to lease a 550 mw combined-cycle power generation plant through 2007. The FPL Energy subsidiary beganmaking quarterly lease payments on March 31, 2003. The quarterly lease payments are intended to cover the lessor's debtservice, which includes a stated yield to equity holders and certain other costs. The FPL Energy subsidiary has the option topurchase the plant at any time during the remaining lease term for 100% of the outstanding principal balance of the loans andequity contributions made to the SPE, all accrued and unpaid interest and yield, and all other fees, costs and amounts thendue and owing pursuant to the provisions of the related financing documents. However, under certain limited events ofdefault, the FPL Energy subsidiary can be required to purchase the plant for the same cost. If the FPL Energy subsidiarydoes not elect to purchase the plant at the end of the lease term, a residual value guarantee must be paid, and the plant willbe sold. Any sale proceeds received by the lessor in excess of the outstanding debt and equity will be given to the FPLEnergy subsidiary. FPL Group Capital has guaranteed certain obligations of the FPL Energy subsidiary under the leaseagreement.
In the initial implementation of FIN 46, the FPL Energy subsidiary was determined to be the primary beneficiary of the lessorand, accordingly, effective July 1, 2003, consolidates the assets and liabilities of the lessor on FPL Group's consolidatedfinancial statements. The assets of the lessor primarily consist of the power generation plant, which had a carrying value of$331 million and $343 million at December 31, 2005 and 2004, respectively, and is reported in electric utility plant in serviceand other property in FPL Group's consolidated balance sheets. The liabilities of the lessor consist primarily of debt (which issecured by the power generation plant), which had a carrying value of $333 million and $345 million at December 31, 2005and 2004, respectively, and is reported in long-term debt in FPL Group's consolidated balance sheets. The equity interests ofthe lessor not owned by the FPL Energy subsidiary are reported as minority interest.
FPL Group – In March 2004, a trust created by FPL Group sold 12 million 5 7/8% preferred trust securities to the public andcommon trust securities to FPL Group. The trust is considered a VIE because FPL Group's investment through the commontrust securities is not considered equity at risk in accordance with FIN 46R. The proceeds from the sale of the preferred andcommon trust securities were used to buy 5 7/8% junior subordinated debentures maturing in March 2044, from FPL GroupCapital. The trust exists only to issue its preferred trust securities and common trust securities and to hold the juniorsubordinated debentures of FPL Group Capital as trust assets. Since FPL Group, as the common security holder, is notconsidered to have equity at risk and will therefore not absorb any variability of the trust, FPL Group is not the primarybeneficiary and does not consolidate the trust in accordance with FIN 46R. FPL Group includes the junior subordinateddebentures issued by FPL Group Capital on its consolidated balance sheets. See Note 11 – FPL Group.
FPL Group and FPL expect additional implementation guidance to be issued regarding FIN 46R and are unable to determinewhat effect, if any, this additional guidance might have on FPL Group's and FPL's financial statements.
10. Financial Instruments
The carrying amounts of cash equivalents, commercial paper and notes payable approximate fair values. At December 31, 2005and 2004, other investments of FPL Group included financial instruments of approximately $43 million and $294 million,

FPL GROUP, INC. AND FLORIDA POWER & LIGHT COMPANYNOTES TO CONSOLIDATED FINANCIAL STATEMENTS (Continued)
72
respectively, and primarily consist of notes receivable that are carried at estimated fair value or cost, which approximates fairvalue. See Note 11.
The following estimates of the fair value of financial instruments have been made using available market information. However,the use of different market assumptions or methods of valuation could result in different estimated fair values.
December 31, 2005 December 31, 2004CarryingAmount
EstimatedFair Value
CarryingAmount
EstimatedFair Value
(millions)FPL Group: Long-term debt, including current maturities $ 9,443 $ 9,540(a) $ 9,247 $ 9,611(a)
Nuclear decommissioning reserve funds $ 2,401 $ 2,401(b) $ 2,271 $ 2,271(b)
Other investments $ 80 $ 80(b) $ 72 $ 72(b)
Interest rate swaps – net unrealized loss $ (9) $ (9) (c) $ (11) $ (11)
(c)
FPL: Long-term debt, including current maturities $ 3,406 $ 3,416(a) $ 3,311 $ 3,438(a)
Nuclear decommissioning reserve funds $ 2,083 $ 2,083(b) $ 1,971 $ 1,971(b)
Interest rates swaps – net unrealized loss $ - $ - $ (2) $ (2) (c)
_____________________(a) Based on market prices provided by external sources.(b) Based on quoted market prices for these or similar issues.(c) Based on market prices modeled internally.
Nuclear Decommissioning Reserve Funds and Other Investments – Securities held in the nuclear decommissioning reservefunds and other investments are carried at estimated fair value based on quoted market prices. FPL Group's nucleardecommissioning funds consist of approximately 46% equity securities and 54% municipal, government, corporate andmortgage- and other asset-backed debt securities (45% and 55% for FPL, respectively) with a weighted-average maturity ofapproximately 7 years at December 31, 2005. The cost of securities sold is determined on the specific identification method.
The following tables provide the nuclear decommissioning and storm reserve funds and other investments approximate gainsand losses and proceeds from the sale of securities:
FPL Group FPLYears Ended December 31, Years Ended December 31,
2005 2004 2003 2005 2004 2003(millions)
Realized gains $ 18 $ 11 $ 26 $ 14 $ 9 $ 25Realized losses $ 17 $ 13 $ 20 $ 16 $ 12 $ 19Proceeds from sale of securities $ 2,928 $ 2,207 $ 2,735 $ 2,759 $ 2,072 $2,702
The following tables provide the unrealized gains and losses for the nuclear decommissioning reserve funds and otherinvestments. There were no storm reserve funds at December 31, 2005 or at December 31, 2004.
FPL Group FPLDecember 31, December 31,
2005 2004 2005 2004(millions)
Unrealized gains Equity securities $ 382 $ 345 $ 342 $ 304 Debt securities $ 27 $ 49 $ 26 $ 46Unrealized losses (a)
Equity securities $ 1 $ - $ - $ - Debt securities $ 4 $ 6 $ 3 $ 5_____________________(a) At December 31, 2005, FPL Group had 22 securities in an unrealized loss position for greater than twelve months. The total unrealized loss on these securities was
less than $1 million and the fair value was approximately $21 million for FPL Group. For accounting treatment description, see Note 1 – Decommissioning of NuclearPlants, Dismantlement of Plants and Other Accrued Asset Removal Costs and Note 1 – Storm Reserve Deficiency.
Regulations issued by the FERC and the NRC provide general risk management guidelines to protect nuclear decommissioningtrust funds and to allow such funds to earn a reasonable return. The FERC regulations prohibit investments in any securities ofFPL Group or its subsidiaries, affiliates or associates, excluding investments tied to market indices or other mutual funds. Similarrestrictions applicable to the decommissioning trust fund for FPL Energy’s Seabrook nuclear plant are contained in the NRCoperating license for that facility. NRC regulations applicable to NRC licensees not in cost-of-service environments require similarinvestment restrictions. The NRC’s regulations permit licensees with operating licenses containing conditions restricting the useof decommissioning trust funds to rely on those conditions in lieu of compliance with NRC regulations. FPL Energy’s Seabrooknuclear plant contains such restrictions in its NRC operating license. With respect to the decommissioning trust fund for FPL

FPL GROUP, INC. AND FLORIDA POWER & LIGHT COMPANYNOTES TO CONSOLIDATED FINANCIAL STATEMENTS (Continued)
73
Energy’s Seabrook nuclear plant, decommissioning trust fund withdrawals are also regulated by the NDFC pursuant to NewHampshire law.
The nuclear decommissioning reserve funds are managed by investment managers who must comply with the guidelines andrules of the applicable regulatory authorities, FPL Group and FPL. The funds’ assets are invested in order to optimize theafter-tax earnings of these funds, giving consideration to liquidity, risk, diversification and other prudent investment objectives.
Interest Rate Swaps – FPL Group and its subsidiaries use a combination of fixed rate and variable rate debt to manageinterest rate exposure. Interest rate swaps are used to adjust and mitigate interest rate exposure when deemed appropriatebased upon market conditions or when required by financing agreements. At December 31, 2005, the estimated fair value forFPL Group interest rate swaps was as follows:
NotionalAmount
EffectiveDate
MaturityDate
RatePaid
RateReceived
EstimatedFair Value
(millions) (millions)
Fair value hedges – FPL Group Capital:$ 150 July 2003 September 2006 variable(a) 7.625% $ (3)$ 150 July 2003 September 2006 variable(b) 7.625% (3)$ 195 October 2004 April 2006 variable(c) 3.250% (2)$ 55 October 2004 April 2006 variable(d) 3.250% -$ 195 October 2004 April 2006 variable(e) 3.250% (2)$ 55 October 2004 April 2006 variable(f) 3.250% -$ 300 November 2004 February 2007 variable(g) 4.086% (5)$ 275 December 2004 February 2007 variable(h) 4.086% (4)
Total fair value hedges (19)
Cash flow hedges – FPL Energy:$ 90 August 2002 December 2007 4.410% variable (i) 1$ 185 August 2003 November 2007 3.557% variable (i) 4$ 6 February 2005 June 2008 4.255% variable (i) 1$ 85 December 2003 December 2017 4.245% variable (i) 3$ 28 April 2004 December 2017 3.845% variable (i) 1$ 266 December 2005 November 2019 4.905% variable (i) -
Total cash flow hedges 10Total interest rate hedges $ (9)_____________________(a) Six-month LIBOR plus 4.9900%(b) Six-month LIBOR plus 4.9925%(c) Six-month LIBOR plus 0.0153%(d) Six-month LIBOR plus 0.0100%(e) Six-month LIBOR plus 0.1500%(f) Six-month LIBOR plus 0.1525%(g) Three-month LIBOR plus 0.50577%(h) Three-month LIBOR plus 0.4025%(i) Three-month LIBOR
11. Investments in Partnerships and Joint Ventures
FPL Energy – FPL Energy has non-controlling non-majority owned interests in various partnerships and joint ventures, essentiallyall of which are electricity producers. At December 31, 2005 and 2004, FPL Energy's investment in partnerships and jointventures totaled approximately $313 million and $288 million, respectively, which is included in other investments on FPL Group'sconsolidated balance sheets. FPL Energy's interest in these partnerships and joint ventures range from approximately 5.5% to50%. At December 31, 2005, the principal entities included in FPL Energy's investments in partnerships and joint ventures wereNortheast Energy, LP, Cherokee County Cogeneration Partners, LP, Green Ridge Power, LLC, Mojave 16/17/18 LLC,Windpower Partners 1993, LP and, in 2004, included Cameron Ridge LLC. FPL Energy's interest in Cameron Ridge was sold in2005.

FPL GROUP, INC. AND FLORIDA POWER & LIGHT COMPANYNOTES TO CONSOLIDATED FINANCIAL STATEMENTS (Continued)
74
Summarized combined information for these principal entities is as follows:
2005 2004(millions)
Net income $ 176 $ 227Total assets $ 1,313 $ 1,369Total liabilities $ 711 $ 791Partners’/members’ equity $ 602 $ 578
FPL Energy’s share of underlying equity in the principal entities $ 301 $ 289Difference between investment carrying amount and underlying equity in net assets (a) (33) (49)FPL Energy’s investment carrying amount for the principal entities $ 268 $ 240____________________(a) The majority of the difference between the investment carrying amount and the underlying equity in net assets is being amortized over the remaining life of the
investee’s assets.
Certain subsidiaries of FPL Energy provide services to the partnerships and joint ventures, including O&M expenses andbusiness management services. FPL Group’s operating revenues for the years ended December 31, 2005, 2004 and 2003include approximately $19 million, $16 million and $16 million, respectively, related to such services. The net receivables atDecember 31, 2005 and 2004, for these services, as well as for affiliate energy commodity transactions, payroll and otherpayments made on behalf of these investees, were approximately $65 million and $23 million, respectively, and are included inother current assets on FPL Group’s consolidated balance sheets.
Notes receivable (long- and short-term) include approximately $21 million and $99 million at December 31, 2005 and 2004,respectively, due from partnerships and joint ventures in which FPL Energy has an ownership interest. The notes receivablebalance at December 31, 2005 matures in 2011 and bears interest at a fixed rate of 8.5%. The majority of the notesreceivable balance at December 31, 2004 bear interest at variable rates, which ranged from approximately 6.1% to8.5%. Interest income related to notes receivable totaled approximately $7 million, $7 million and $6 million for the yearsended December 31, 2005, 2004 and 2003, respectively, and is included in interest income in FPL Group’s consolidatedstatements of income. There was no interest receivable associated with these notes as of December 31, 2005 and 2004.
FPL Group – In March 2004, a trust created by FPL Group sold $300 million of preferred trust securities to the public and $9million of common trust securities to FPL Group. The trust is an unconsolidated 100%-owned finance subsidiary. The trustused the proceeds to purchase $309 million of 5 7/8% junior subordinated debentures maturing in March 2044 from FPLGroup Capital. FPL Group has fully and unconditionally guaranteed the preferred trust securities and the junior subordinateddebentures.
12. Common Stock
Earnings Per Share – The reconciliation of FPL Group's basic and diluted earnings per share of common stock is shown below:
Years Ended December 31,2005 2004 2003(millions, except per share amounts)
Numerator – net income $ 885 $ 887 $ 890
Denominator: Weighted-average number of common shares outstanding – basic 380.1 358.6 355.1 Restricted stock, performance share and shareholder value awards, options, warrants and equity units (a) 5.6 3.1 1.2 Weighted-average number of common shares outstanding – assuming dilution 385.7 361.7 356.3
Earnings per share of common stock: Basic $ 2.33 $ 2.47 $ 2.51 Assuming dilution $ 2.29 $ 2.45 $ 2.50_____________________(a) Performance share awards and shareholder value awards are included in diluted weighted-average number of shares outstanding based upon what would be issued
if the end of the reporting period were the end of the term of the award. Restricted stock, performance share awards, shareholder value awards, options, warrants andequity units (known as Corporate Units, see Note 14) are included in diluted weighted-average number of common shares outstanding by applying the treasury stockmethod.
In 2005, 2004 and 2003, there were no securities that could potentially dilute basic earnings per share in the future that were notincluded in the computation of diluted earnings per share because to do so would have been antidilutive.

FPL GROUP, INC. AND FLORIDA POWER & LIGHT COMPANYNOTES TO CONSOLIDATED FINANCIAL STATEMENTS (Continued)
75
In February 2005, FPL Group’s board of directors approved a two-for-one stock split of FPL Group’s common stock effectiveMarch 15, 2005 (2005 stock split). FPL Group’s authorized common stock increased from 400 million to 800 million shares. Allshare or per share information included in FPL Group’s consolidated financial statements reflect the effect of the 2005 stock split.
Common Stock Dividend Restrictions – FPL Group's charter does not limit the dividends that may be paid on its commonstock. FPL's mortgage securing FPL's first mortgage bonds contains provisions that, under certain conditions, restrict thepayment of dividends and other distributions to FPL Group. These restrictions do not currently limit FPL's ability to pay dividendsto FPL Group.
Employee Stock Ownership Plan (ESOP) – The employee thrift plans of FPL Group include a leveraged ESOP feature. Sharesof common stock held by the trust for the thrift plans (Trust) are used to provide all or a portion of the employers' matchingcontributions. Dividends received on all shares, along with cash contributions from the employers, are used to pay principal andinterest on an ESOP loan held by FPL Group Capital. Dividends on shares allocated to employee accounts and used by theTrust for debt service are replaced with an equivalent amount of shares of common stock at prevailing market prices. Forpurposes of computing basic and fully diluted earnings per share, ESOP shares that have been committed to be released areconsidered outstanding.
ESOP-related compensation expense of approximately $27 million, $27 million and $25 million in 2005, 2004 and 2003,respectively, was recognized based on the fair value of shares allocated to employee accounts during the period. Interest incomeon the ESOP loan is eliminated in consolidation. ESOP-related unearned compensation included as a reduction of commonshareholders' equity at December 31, 2005 was approximately $140 million, representing unallocated shares at the original issueprice. The fair value of the ESOP-related unearned compensation account using the closing price of FPL Group common stockat December 31, 2005 was approximately $401 million.
Incentive Plans – At December 31, 2005, approximately 26.6 million shares of common stock were authorized and 19.7 millionwere available for awards (including outstanding awards) to officers, employees and non-employee directors of FPL Group andits subsidiaries under FPL Group's long-term incentive plan (LTIP) and non-employee directors stock plan. Restricted stock isissued at market value at the date of grant, typically vests within four years and is subject to, among other things, restrictions ontransferability. Performance share awards and shareholder value awards are typically payable at the end of a three- or four-yearperformance period if the specified performance criteria are met. The exercise price of each option granted in 2005, 2004 and2003 equaled the market price of FPL Group common stock on the date of grant. Options typically vest within three years andhave a maximum term of ten years. See Note 1 – Stock-Based Compensation.
The changes in awards under the incentive plans are as follows:
OptionsRestricted
Stock
PerformanceShare and
ShareholderValue
Awards NumberWeighted-Average
Exercise Price
Balances, December 31, 2002 597,410 836,978 7,290,260 $ 28.65 Granted 468,690(a) 420,866(b) 3,211,940(c) $ 28.07 Paid/released/exercised (225,836) (338,190) (236,602) $ 23.94 Forfeited (74,888) (128,362) (704,774) $ 27.82Balances, December 31, 2003 765,376 791,292 9,560,824 $ 28.62 Granted 310,910(a) 481,752(b) 790,000(c) $ 32.46 Paid/released/exercised (229,040) (185,554) (987,350) $ 29.41 Forfeited (25,890) (49,080) (190,448) $ 28.15Balances, December 31, 2004 821,356 1,038,410 9,173,026 $ 28.92 Granted 565,950(a) 483,293(b) 421,000(c) $ 36.95 Paid/released/exercised (302,317) (256,348) (2,078,533) $ 28.65 Forfeited (62,444) (119,853) (286,876) $ 29.98Balances, December 31, 2005 1,022,545 1,145,502 7,228,617(d) $ 27.48____________________(a) The weighted-average grant date fair value of restricted stock granted in 2005, 2004 and 2003 was $39.92, $32.58 and $29.50 per share, respectively.(b) The weighted-average grant date fair value of performance share and shareholder value awards in 2005, 2004 and 2003 was $39.38, $32.52 and $30.67 per share,
respectively.(c) The weighted-average fair value of options granted was $6.30, $5.10 and $4.19 in 2005, 2004 and 2003, respectively. The fair value of the options granted in 2005,
2004 and 2003 were estimated on the date of the grant using the Black-Scholes option-pricing model with a weighted-average expected dividend yield of 3.68%,3.93% and 3.97%, a weighted-average expected volatility of 20.00%, 20.11% and 19.99%, a weighted-average risk-free interest rate of 4.08%, 3.78% and 3.48%,respectively, and a weighted-average expected term of 7 years.
(d) Of the options outstanding at December 31, 2005, 4,587,394 options were exercisable and had exercise prices ranging from $19.06 to $36.95 per share with aweighted-average exercise price of $29.04 per share and a weighted-average remaining contractual life of 6.0 years. The remainder of the outstanding options hadexercise prices ranging from $27.56 to $36.95 per share with a weighted-average exercise price of $30.08 per share and a weighted-average remaining contractuallife of 7.6 years.

FPL GROUP, INC. AND FLORIDA POWER & LIGHT COMPANYNOTES TO CONSOLIDATED FINANCIAL STATEMENTS (Continued)
76
In addition, as a result of certain employees voluntarily electing to convert a cash bonus, net of taxes, into fully-vested sharesof FPL Group common stock, approximately 36 thousand common shares were issued under the LTIP during 2004.
Other – Each share of common stock has been granted a Preferred Share Purchase Right (Right), at an exercise price of $120,subject to adjustment, in the event of certain attempted business combinations. The Rights will cause substantial dilution to aperson or group attempting to acquire FPL Group on terms not approved by FPL Group's board of directors.
In June 2005, a wholly-owned subsidiary of FPL Group completed the acquisition of Gexa Corp., a retail electric provider inTexas, which serves approximately 1,200 mw of peak load to over 160,000 commercial and residential customers as ofDecember 31, 2005. Each share of Gexa Corp.'s outstanding common stock was converted into 0.1682 of a share of FPLGroup common stock. Assuming the exercise of Gexa Corp.'s options and warrants net of cash to be received upon exercise,the aggregate value of the consideration for the acquisition of Gexa Corp. was approximately $73 million, payable in shares ofFPL Group common stock. At December 31, 2005, there were Gexa Corp. options and warrants outstanding for a total of219,086 shares of FPL Group common stock.
13. Preferred Stock
FPL Group's charter authorizes the issuance of 100 million shares of serial preferred stock, $0.01 par value. None of theseshares are outstanding. FPL Group has reserved 3 million shares for issuance upon exercise of preferred share purchaserights which expire in June 2006. At December 31, 2005, FPL had no preferred stock outstanding. Preferred stock of FPL atDecember 31, 2004 consisted of the following: (a)
December 31, 2004Shares
Outstanding (b)
RedemptionPrice December 31, 2004
(millions)Cumulative, $100 Par Value, without sinking fund requirements, authorized 10,664,100 shares: 4 1/2% Series A 50,000 $ 103.25 $ 5 4 1/2% Series V 200,000 $ 100.00 20Total preferred stock of FPL 250,000 25(c)
Less 4 1/2% Series V preferred stock held by FPL Group (eliminated in consolidation) 200,000 20Total preferred stock of FPL reported at FPL Group 50,000 $ 5(c)
____________________(a) FPL’s charter also authorizes the issuance of 5 million shares of subordinated preferred stock, no par value. None of these shares are outstanding. In November
2003, FPL redeemed 2.2 million shares of preferred stock with an aggregate par value of $221 million for redemption prices per share ranging from $101.00 to$103.52. In January 2004, FPL sold 200,000 shares of 4 1/2% Series V preferred stock with an aggregate par value of $20 million to FPL Group. In January2005, FPL redeemed all 250,000 shares of its $100 Par Value 4 1/2% (Series A and Series V) preferred stock outstanding at December 31, 2004.
(b) FPL’s preferred shares are entitled to dividends at the stated rates in preference to FPL’s common stockholder, FPL Group. In the event of voluntary liquidation,the outstanding preferred shares have preference over common shares until an amount equal to the current redemption price of all shares has been paid. In theevent of involuntary liquidation, outstanding preferred shares shall have preference over common shares until the full par value of all shares and all unpaidaccumulated dividends thereon have been paid.
(c) Included in current maturities of long-term debt and preferred stock on the consolidated balance sheets.

FPL GROUP, INC. AND FLORIDA POWER & LIGHT COMPANYNOTES TO CONSOLIDATED FINANCIAL STATEMENTS (Continued)
77
14. Debt
Long-term debt consists of the following:
December 31,2005 2004
FPL: (millions) First mortgage bonds: Maturing in 2005 – 6 7/8% $ - $ 500 Maturing 2008 through 2013 – 4.85% to 6.00% 825 825 Maturing 2033 through 2035 – 4.95% to 5.95% 1,840 1,240 Medium-term note – maturing 2006 – 2.34% 135 135 Pollution control, solid waste disposal and industrial development revenue bonds – maturing 2020 through 2029 – variable, 3.5% and 2.1% weighted-average annual interest rates, respectively 633 633 Fair value swaps (see Note 10) - (2) Unamortized discount (27) (20) Total long-term debt of FPL 3,406 3,311 Less current maturities of long-term debt 135 500 Less fair value swaps on current maturities of long-term debt (see Note 10) - (2) Long-term debt of FPL, excluding current maturities 3,271 2,813FPL Group Capital: Debentures – maturing 2005 – variable, 2.86% - 400 Debentures – maturing 2006 through 2009 – 3 1/4% to 7 5/8% 2,800 3,000 Debentures, related to FPL Group's equity units – maturing 2008 – 5.551% and 5.00%, respectively (a) 506 506 Junior Subordinated Debentures – maturing 2044 – 5 7/8% 309 309 Other long-term debt – maturing 2013 – 7.35% (b) - 5 Fair value swaps (see Note 10) (15) (9) Unamortized discount (3) (4) Total long-term debt of FPL Group Capital 3,597 4,207 Less current maturities of long-term debt 1,100 605 Less fair value swap on current maturities of long-term debt (see Note 10) (7) (1) Long-term debt of FPL Group Capital, excluding current maturities 2,504 3,603FPL Energy: Senior secured bonds – maturing 2017 through 2024 – 5.608% to 7.52% 1,189 789 Senior secured notes – maturing 2020 – 7.11% 107 111 Construction term facility – maturing 2008 – variable, 5.70% and 4.31% weighted-average annual interest rates, respectively 381 349 Other long-term debt – maturing 2007 through 2017 – variable, 5.765% and 3.89% weighted-average annual interest rates, respectively 751 468 Other long-term debt – maturing 2018 through 2020 – 6.65% to 10.63% 12 12 Total long-term debt of FPL Energy 2,440 1,729 Less current maturities of long-term debt 176 118 Long-term debt of FPL Energy, excluding current maturities 2,264 1,611Total long-term debt $ 8,039 $ 8,027____________________(a) During 2005, these debentures were remarketed. See discussion below.(b) The other long-term debt was redeemed in January 2005 and is included in current maturities of long-term debt and preferred stock on FPL Group’s consolidated
balance sheet at December 31, 2004.
Minimum annual maturities of long-term debt for FPL Group are approximately $1,411 million, $1,617 million, $1,155 million, $976million and $127 million for 2006, 2007, 2008, 2009 and 2010, respectively. The amounts for FPL are $135 million, $200 million,and $225 million for 2006, 2008 and 2009, respectively, with no long-term debt scheduled to mature in 2007 and 2010.
At December 31, 2005, commercial paper borrowings had a weighted-average interest rate of 4.36% for FPL Group (4.36%for FPL). Available lines of credit aggregated approximately $4.6 billion ($2.5 billion for FPL Group Capital and $2.1 billion forFPL) at December 31, 2005, all of which were based on firm commitments. These facilities provide for the issuance of lettersof credit of up to $4.5 billion. The issuance of letters of credit is subject to the aggregate commitment under the applicablefacility. While no direct borrowings were outstanding at December 31, 2005, letters of credit totaling $598 million wereoutstanding under the FPL Group Capital credit facilities. No letters of credit were outstanding under the FPL credit facilities.
FPL Group Capital has guaranteed certain debt and other obligations of FPL Energy and its subsidiaries. FPL Group hasguaranteed certain payment obligations of FPL Group Capital, including most of those under FPL Group Capital’s debt, includingall of its debentures and commercial paper issuances, as well as most of its guarantees.
In June 2002, FPL Group sold concurrently a total of 11.5 million shares of common stock and 10.12 million 8% CorporateUnits. In connection with the corporate units financing, FPL Group Capital issued $506 million principal amount of 5%debentures due February 16, 2008. During 2005, FPL Group Capital remarketed these debentures and the annual interestrate was reset to 5.551%. Payment of FPL Group Capital debentures is absolutely, irrevocably and unconditionallyguaranteed by FPL Group. Each 8% Corporate Unit initially consisted of a $50 FPL Group Capital debenture and a purchase

FPL GROUP, INC. AND FLORIDA POWER & LIGHT COMPANYNOTES TO CONSOLIDATED FINANCIAL STATEMENTS (Continued)
78
contract pursuant to which the holder will purchase $50 of FPL Group common shares on or before February 16, 2006, andFPL Group will make payments of 3% of the unit’s $50 stated value until the shares are purchased. In February 2006, FPLGroup paid net approximately $48 million to cancel approximately 4.2 million of its Corporate Units sold in June 2002. Also inFebruary 2006, FPL Group issued approximately 8.7 million shares of common stock in return for approximately $296 millionin proceeds, upon settlement of the stock purchase contracts issued in connection with its Corporate Units sold in June2002. In addition, in February 2005, FPL Group received approximately $575 million in settlement of the purchase contractsassociated with the Corporate Units sold in February 2002 and issued approximately 18.5 million shares of FPL Groupcommon stock.
Prior to the issuance of FPL Group’s common stock, the purchase contracts are reflected in FPL Group’s diluted earnings pershare calculations using the treasury stock method. Under this method, the number of shares of FPL Group common stockused in calculating diluted earnings per share is deemed to be increased by the excess, if any, of the number of shares thatwould be issued upon settlement of the purchase contracts over the number of shares that could be purchased by FPL Groupin the market, at the average market price during the period, using the proceeds receivable upon settlement.
In January 2006, FPL issued $400 million principal amount of 5.65% first mortgage bonds maturing in February 2037. Theproceeds were used to repay FPL’s short-term borrowings and for other corporate purposes.
15. Asset Retirement Obligations
FPL Group and FPL adopted FAS 143, “Accounting for Asset Retirement Obligations” and FIN 47, “Accounting for ConditionalAsset Retirement Obligations” effective January 1, 2003 and December 31, 2005, respectively. FAS 143 and FIN 47 requirethat a liability for the fair value of an ARO be recognized in the period in which it is incurred if it can be reasonably estimated,with the offsetting associated asset retirement costs capitalized as part of the carrying amount of the long-lived assets. Theasset retirement cost is subsequently allocated to expense using a systematic and rational method over its usefullife. Changes in the ARO resulting from the passage of time are recognized as an increase in the carrying amount of theliability and as accretion expense, which is included in depreciation and amortization expense in the consolidated statementsof income. Changes resulting from revisions to the timing or amount of the original estimate of cash flows are recognized asan increase or a decrease in the asset retirement cost and ARO. Prior to the adoption of FIN 47, FPL Group and FPLrecognized obligations related to conditional AROs when the condition occurred.
FPL Group and FPL have identified but not recognized ARO liabilities related to electric transmission and distribution andtelecommunications assets resulting from easements over property not owned by FPL Group or FPL. In addition, FPL Grouphas identified but not recognized ARO liabilities related to the majority of FPL Energy's hydro facilities. These easements aregenerally perpetual and, along with the hydro facilities, only require retirement action upon abandonment or cessation of useof the property or facility for its specified purpose. The ARO liability is not estimable for such easements and hydro facilitiesas FPL Group and FPL intend to utilize these properties and facilities indefinitely. In the event FPL Group and FPL decide toabandon or cease the use of a particular easement and/or hydro facility, an ARO liability would be recorded at that time.
The cumulative effect of a change in accounting principle of adopting each of FAS 143 and FIN 47 was not material to FPLGroup’s net income in the period of adoption and had no effect on FPL’s net income due to the regulatory treatmentdiscussed below. Had FIN 47 been applied in 2004 and 2003, FPL Group would have recorded conditional AROs ofapproximately $12 million ($10 million FPL) and $12 million ($11 million FPL), respectively. Pro forma net income for FPLGroup and FPL and earnings per share for FPL Group have not been presented for the years ended December 31, 2004 and2003 because the pro forma application of FIN 47 to prior periods would result in the same net income and earnings pershare as actual reported amounts.
FPL – FPL’s ARO relates primarily to the nuclear decommissioning obligation of its nuclear units. FPL’s AROs other thannuclear decommissioning are not significant. The provisions of FAS 143 and FIN 47 result in timing differences in therecognition of legal asset retirement costs for financial reporting purposes and the method the FPSC allows FPL to recover inrates. Accordingly, any differences between the ongoing expense recognized under FAS 143 and FIN 47 and the amountrecoverable through rates are deferred in accordance with FAS 71. See Note 1 – Decommissioning of Nuclear Plants,Dismantlement of Plants and Other Accrued Asset Removal Costs.
Upon adoption of FIN 47, FPL recorded a conditional ARO of approximately $12 million, capitalized a net asset related to theARO of approximately $2 million and reversed the approximately $27 million it had previously recorded in accumulateddepreciation. The difference, approximately $17 million, was deferred as a regulatory liability. FPL's conditional AROs arerelated to the removal of asbestos primarily from its fossil generating plants.
At December 31, 2005 and 2004, FPL’s ARO was approximately $1,474 million and $2,015 million, respectively. During2005, FPL recognized accretion expense of approximately $112 million, reduced the ARO by approximately $665 million,primarily as a result of changing the useful lives of the nuclear units to reflect their extended license terms, and increased theARO approximately $12 million as a result of implementing FIN 47. During 2004, FPL recognized accretion expense of $106million. No other adjustments were made to FPL’s ARO during the year ended December 31, 2004. Restricted trust funds forthe payment of future expenditures to decommission FPL’s nuclear units are included in nuclear decommissioning reserve

FPL GROUP, INC. AND FLORIDA POWER & LIGHT COMPANYNOTES TO CONSOLIDATED FINANCIAL STATEMENTS (Continued)
79
funds of FPL and approximated $2,083 million and $1,971 million at December 31, 2005 and 2004, respectively. See Note10.
FPL Energy – FPL Energy's ARO relates primarily to the nuclear decommissioning obligation of Seabrook and also includesthe current estimated fair value of obligations to dismantle its wind facilities located on leased property and certain hydrofacilities. See Note 1 – Decommissioning of Nuclear Plants, Dismantlements of Plants and Other Accrued Asset RemovalCosts.
In addition to the amounts recorded by FPL, upon adoption of FIN 47, FPL Energy recorded a conditional ARO ofapproximately $1 million, which primarily relates to the removal of asbestos and lead paint from its generating facilities, andcapitalized a net asset related to the ARO of approximately $1 million.
At December 31, 2005 and 2004, FPL Energy's ARO was approximately $211 million and $192 million, respectively. Thenuclear decommissioning liability for Seabrook represents the fair value of FPL Energy's ultimate decommissioning liability asdetermined by an independent study. The liability is being accreted using the interest method over an assumed licenseextension period that runs through 2050. FPL Energy recorded accretion expense of approximately $15 million and $13million for the years ended December 31, 2005 and 2004, respectively. Further, FPL Energy recorded approximately $3million and $1 million for the years ended December 31, 2005 and 2004, respectively, in additional ARO liabilities relating tonew wind assets. A restricted trust fund for the payment of future expenditures to decommission Seabrook is included in FPLGroup's nuclear decommissioning reserve funds and approximated $318 million and $299 million at December 31, 2005 and2004, respectively. See Note 10.
16. Commitments and Contingencies
Commitments – FPL Group and its subsidiaries have made commitments in connection with a portion of their projected capitalexpenditures. Capital expenditures at FPL include, among other things, the cost for construction or acquisition of additionalfacilities and equipment to meet customer demand, as well as capital improvements to and maintenance of existing facilities. AtFPL Energy, capital expenditures include, among other things, the cost, including capitalized interest, for construction of windprojects and the procurement of nuclear fuel, as well as announced acquisitions. FPL FiberNet's capital expenditures primarilyinclude costs to meet customer specific requirements and sustain its fiber-optic network. At December 31, 2005, planned capitalexpenditures for 2006 through 2010 are estimated as follows:
2006 2007 2008 2009 2010 TotalFPL: (millions) Generation: (a)
New (b) $ 255 $ 520 $ 605 $ 660 $ 500 $ 2,540 Existing 450 455 330 395 285 1,915 Transmission and distribution 750 665 640 640 645 3,340 Nuclear fuel 75 120 85 125 135 540 General and other 145 170 165 160 165 805 Total $ 1,675 $ 1,930 $ 1,825 $ 1,980 $ 1,730 $ 9,140
FPL Energy: Wind (c) $ 960 $ 930 $ 5 $ 5 $ 5 $ 1,905 Nuclear (d) 495 85 40 85 100 805 Gas 45 15 15 5 - 80 Other 10 10 10 10 10 50 Total $ 1,510 $ 1,040 $ 70 $ 105 $ 115 $ 2,840
FPL FiberNet $ 11 $ 11 $ 11 $ 11 $ 11 $ 55_____________________(a) Includes AFUDC of approximately $39 million, $30 million, $51 million, $72 million and $71 million in 2006, 2007, 2008, 2009 and 2010, respectively.(b) Includes generating structures, transmission interconnection and integration, licensing and AFUDC.(c) Capital expenditures for new wind projects are estimated through 2007, when eligibility for PTC’s for new wind projects is scheduled to expire.(d) Includes nuclear fuel and, in 2006, the acquisition of a 70% interest in Duane Arnold.
In addition to estimated capital expenditures listed above, FPL and FPL Energy have long-term contracts related topurchased power and/or fuel (see Contracts below). At December 31, 2005, FPL Energy had approximately $2.9 billion infirm commitments primarily for the supply of wind turbines and towers, natural gas transportation, supply and storage, firmtransmission service, nuclear fuel and a portion of its projected capital expenditures, including the acquisition of a 70%interest in Duane Arnold for approximately $373 million. In addition, FPL Group has guaranteed certain payment obligationsof FPL Group Capital, including most payment obligations under FPL Group Capital's debt.
FPL Group and FPL each account for payment guarantees and related contracts, for which it or a subsidiary is the guarantor,under FIN 45, "Guarantor's Accounting and Disclosure Requirements for Guarantees Including Indirect Guarantees ofIndebtedness of Others," which requires that the fair value of guarantees provided to unconsolidated entities entered into afterDecember 31, 2002, be recorded on the balance sheet. At December 31, 2005, subsidiaries of FPL Group, other than FPL,
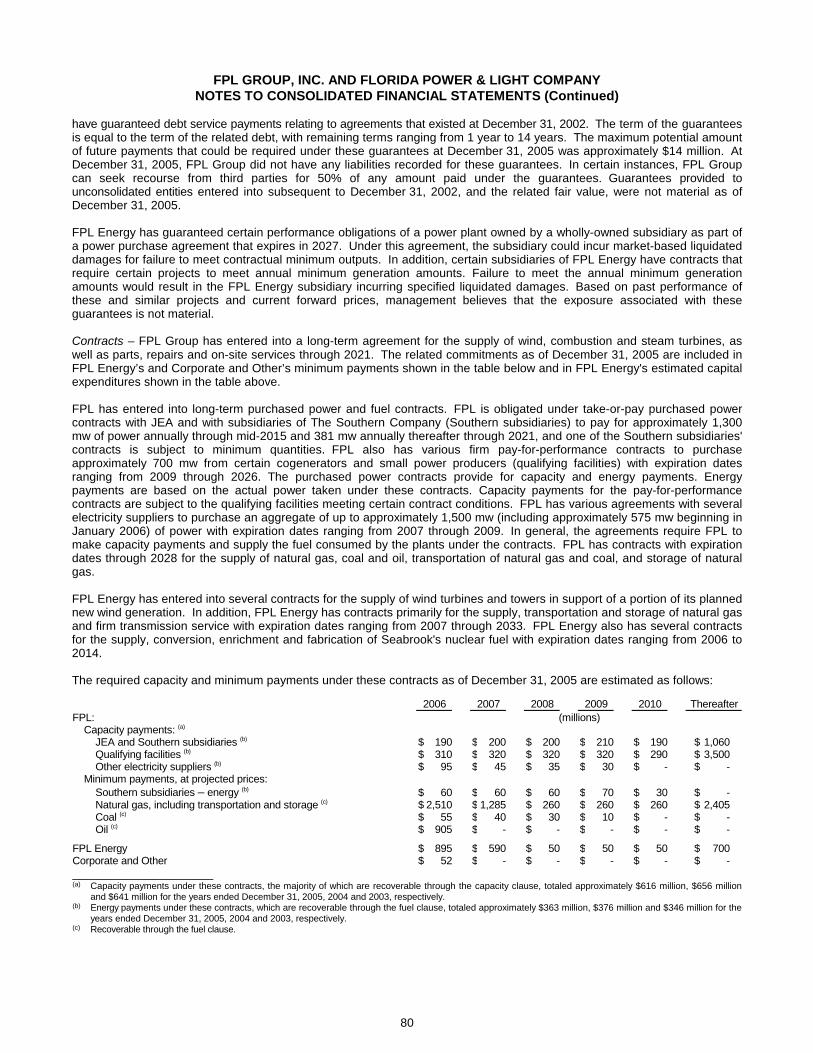
FPL GROUP, INC. AND FLORIDA POWER & LIGHT COMPANYNOTES TO CONSOLIDATED FINANCIAL STATEMENTS (Continued)
80
have guaranteed debt service payments relating to agreements that existed at December 31, 2002. The term of the guaranteesis equal to the term of the related debt, with remaining terms ranging from 1 year to 14 years. The maximum potential amountof future payments that could be required under these guarantees at December 31, 2005 was approximately $14 million. AtDecember 31, 2005, FPL Group did not have any liabilities recorded for these guarantees. In certain instances, FPL Groupcan seek recourse from third parties for 50% of any amount paid under the guarantees. Guarantees provided tounconsolidated entities entered into subsequent to December 31, 2002, and the related fair value, were not material as ofDecember 31, 2005.
FPL Energy has guaranteed certain performance obligations of a power plant owned by a wholly-owned subsidiary as part ofa power purchase agreement that expires in 2027. Under this agreement, the subsidiary could incur market-based liquidateddamages for failure to meet contractual minimum outputs. In addition, certain subsidiaries of FPL Energy have contracts thatrequire certain projects to meet annual minimum generation amounts. Failure to meet the annual minimum generationamounts would result in the FPL Energy subsidiary incurring specified liquidated damages. Based on past performance ofthese and similar projects and current forward prices, management believes that the exposure associated with theseguarantees is not material.
Contracts – FPL Group has entered into a long-term agreement for the supply of wind, combustion and steam turbines, aswell as parts, repairs and on-site services through 2021. The related commitments as of December 31, 2005 are included inFPL Energy’s and Corporate and Other’s minimum payments shown in the table below and in FPL Energy's estimated capitalexpenditures shown in the table above.
FPL has entered into long-term purchased power and fuel contracts. FPL is obligated under take-or-pay purchased powercontracts with JEA and with subsidiaries of The Southern Company (Southern subsidiaries) to pay for approximately 1,300mw of power annually through mid-2015 and 381 mw annually thereafter through 2021, and one of the Southern subsidiaries'contracts is subject to minimum quantities. FPL also has various firm pay-for-performance contracts to purchaseapproximately 700 mw from certain cogenerators and small power producers (qualifying facilities) with expiration datesranging from 2009 through 2026. The purchased power contracts provide for capacity and energy payments. Energypayments are based on the actual power taken under these contracts. Capacity payments for the pay-for-performancecontracts are subject to the qualifying facilities meeting certain contract conditions. FPL has various agreements with severalelectricity suppliers to purchase an aggregate of up to approximately 1,500 mw (including approximately 575 mw beginning inJanuary 2006) of power with expiration dates ranging from 2007 through 2009. In general, the agreements require FPL tomake capacity payments and supply the fuel consumed by the plants under the contracts. FPL has contracts with expirationdates through 2028 for the supply of natural gas, coal and oil, transportation of natural gas and coal, and storage of naturalgas.
FPL Energy has entered into several contracts for the supply of wind turbines and towers in support of a portion of its plannednew wind generation. In addition, FPL Energy has contracts primarily for the supply, transportation and storage of natural gasand firm transmission service with expiration dates ranging from 2007 through 2033. FPL Energy also has several contractsfor the supply, conversion, enrichment and fabrication of Seabrook's nuclear fuel with expiration dates ranging from 2006 to2014.
The required capacity and minimum payments under these contracts as of December 31, 2005 are estimated as follows:
2006 2007 2008 2009 2010 ThereafterFPL: (millions) Capacity payments: (a)
JEA and Southern subsidiaries (b) $ 190 $ 200 $ 200 $ 210 $ 190 $ 1,060 Qualifying facilities (b) $ 310 $ 320 $ 320 $ 320 $ 290 $ 3,500 Other electricity suppliers (b) $ 95 $ 45 $ 35 $ 30 $ - $ - Minimum payments, at projected prices: Southern subsidiaries – energy (b) $ 60 $ 60 $ 60 $ 70 $ 30 $ - Natural gas, including transportation and storage (c) $ 2,510 $ 1,285 $ 260 $ 260 $ 260 $ 2,405 Coal (c) $ 55 $ 40 $ 30 $ 10 $ - $ - Oil (c) $ 905 $ - $ - $ - $ - $ -
FPL Energy $ 895 $ 590 $ 50 $ 50 $ 50 $ 700Corporate and Other $ 52 $ - $ - $ - $ - $ -_____________________(a) Capacity payments under these contracts, the majority of which are recoverable through the capacity clause, totaled approximately $616 million, $656 million
and $641 million for the years ended December 31, 2005, 2004 and 2003, respectively.(b) Energy payments under these contracts, which are recoverable through the fuel clause, totaled approximately $363 million, $376 million and $346 million for the
years ended December 31, 2005, 2004 and 2003, respectively.(c) Recoverable through the fuel clause.

FPL GROUP, INC. AND FLORIDA POWER & LIGHT COMPANYNOTES TO CONSOLIDATED FINANCIAL STATEMENTS (Continued)
81
Insurance – Liability for accidents at nuclear power plants is governed by the Price-Anderson Act, which limits the liability ofnuclear reactor owners to the amount of insurance available from both private sources and an industry retrospective paymentplan. In accordance with this act, FPL Group maintains $300 million of private liability insurance per site, which is themaximum obtainable, and participates in a secondary financial protection system under which it is subject to retrospectiveassessments of up to $503 million ($402 million for FPL), plus any applicable taxes, per incident at any nuclear reactor in theUnited States, payable at a rate not to exceed $75 million ($60 million for FPL) per incident per year. FPL Group and FPL arecontractually entitled to recover a proportionate share of such assessments from the owners of minority interests in Seabrookand St. Lucie Unit No. 2, which approximates $12 million and $15 million, plus any applicable taxes, per incident, respectively.
FPL Group participates in nuclear insurance mutual companies that provide $2.75 billion of limited insurance coverage peroccurrence per site for property damage, decontamination and premature decommissioning risks at its nuclear plants. Theproceeds from such insurance, however, must first be used for reactor stabilization and site decontamination before they canbe used for plant repair. FPL Group also participates in an insurance program that provides limited coverage for replacementpower costs if a nuclear plant is out of service for an extended period of time because of an accident. In the event of anaccident at one of FPL Group's or another participating insured's nuclear plants, FPL Group could be assessed up to $112million ($89 million for FPL) in retrospective premiums. FPL Group and FPL are contractually entitled to recover aproportionate share of such assessments from the owners of minority interests in Seabrook and St. Lucie Unit No. 2, whichapproximates $2 million and $3 million, respectively.
Due to the high cost and limited coverage available from third-party insurers, FPL has essentially no insurance coverage onits transmission and distribution property and FPL Group has no insurance coverage for FPL FiberNet's fiber-optic cablelocated throughout Florida. Under the terms of the 2005 rate agreement, FPL may recover prudently incurred stormrestoration costs either through securitization pursuant to Section 366.8260 of the Florida Statutes or throughsurcharges. See Note 1 − Storm Reserve Deficiency.
In the event of a loss, the amount of insurance available might not be adequate to cover property damage and otherexpenses incurred. Uninsured losses, to the extent not recovered from customers in the case of FPL, would be borne by FPLGroup and FPL and could have a material adverse effect on FPL Group's and FPL's financial condition and results ofoperations.
Litigation – In 1999, the Attorney General of the United States, on behalf of the U.S. Environmental Protection Agency (EPA),brought an action against Georgia Power Company and other subsidiaries of The Southern Company for certain allegedviolations of the Clean Air Act. In May 2001, the EPA amended its complaint. The amended complaint alleges, among otherthings, that Georgia Power Company constructed and is continuing to operate Scherer Unit No. 4, in which FPL owns a 76%interest, without obtaining proper permitting, and without complying with performance and technology standards as requiredby the Clean Air Act. It also alleges that unspecified major modifications have been made at Scherer Unit No. 4 that requireits compliance with the aforementioned Clean Air Act provisions. The EPA seeks injunctive relief requiring the installation ofbest available control technology and civil penalties of up to $25,000 per day for each violation from an unspecified date afterJune 1, 1975 through January 30, 1997 and $27,500 per day for each violation thereafter. The EPA further revised its civilpenalty rule in February 2004, such that the maximum penalty is $32,500 per day for each violation after March 15,2004. Georgia Power Company has answered the amended complaint, asserting that it has complied with all requirements ofthe Clean Air Act, denying the plaintiff's allegations of liability, denying that the plaintiff is entitled to any of the relief that itseeks and raising various other defenses. In June 2001, a federal district court stayed discovery and administratively closedthe case pending resolution of the EPA's motion for consolidation of discovery in several Clean Air Act cases that was filedwith a Multi-District Litigation (MDL) panel. In August 2001, the MDL panel denied the motion for consolidation. InSeptember 2001, the EPA moved that the federal district court reopen this case for purposes of discovery. Georgia PowerCompany opposed that motion asking that the case remain closed until the Eleventh Circuit Court of Appeals ruled on theTennessee Valley Authority's (TVA) appeal of an EPA administrative compliance order relating to legal issues that are alsocentral to this case. In August 2002, the federal district court denied without prejudice the EPA's motion to reopen. In June2003, the Eleventh Circuit issued its order dismissing the TVA's appeal because it found the provision of the Clean Air Actallowing the EPA to issue binding administrative compliance orders was unconstitutional, and hence found that the TVA orderwas a non-final order that courts of appeal do not have jurisdiction to review. In September 2003, the Eleventh Circuit deniedthe EPA's motion for rehearing. In May 2004, the U.S. Supreme Court denied the EPA's petition for review of the EleventhCircuit order. The EPA has not yet moved to reopen the Georgia Power Company case.
In 2001, Florida Municipal Power Agency (FMPA) filed with the U.S. Court of Appeals for the District of Columbia (DC Circuit)a petition for review asking the DC Circuit to reverse and remand orders of the FERC denying FMPA's request for credits fortransmission facilities owned by FMPA members. The transmission credits sought by FMPA would offset the transmissioncharges that FPL bills FMPA for network transmission service to FMPA's member cities. FMPA member cities have beentaking network transmission service under FPL's open access transmission tariff since 1996. In the orders appealed byFMPA, the FERC ruled that FMPA would be entitled to credits for any FMPA facilities that were "integrated" with the FPLtransmission system. Based on the evidence submitted, the FERC concluded that none of the FMPA facilities met theintegration test and, therefore, FMPA was not entitled to credits against FPL's charges for transmission service. In January2003, the DC Circuit upheld the FERC's order denying FMPA credits for its facilities; in March 2003, the DC Circuit denied

FPL GROUP, INC. AND FLORIDA POWER & LIGHT COMPANYNOTES TO CONSOLIDATED FINANCIAL STATEMENTS (Continued)
82
FMPA’s rehearing request of the DC Circuit’s decision; and in October 2003, the U.S. Supreme Court denied FMPA’s petitionfor review of the DC Circuit’s decision.
FMPA also has requested that the FERC decide the same crediting issue in a separate FERC proceeding. That proceedingdates back to a filing by FPL in 1993 of a comprehensive restructuring of its then-existing tariff structure. All issues in thatcase were settled in September 2000 except for three issues reserved by FMPA: (i) the crediting issue, (ii) treatment ofbehind-the-meter generation and load ratio pricing for network integration transmission service, and (iii) exclusions from FPL’stransmission rates of the costs of FPL’s facilities that failed to meet the same integration test that was applied to FMPA’sfacilities with respect to the crediting issue. In December 2003, the FERC issued an order addressing the three reservedissues. With respect to the crediting issue, the FERC stated that it had previously determined that FMPA was not entitled tocredits for its facilities in the related proceeding discussed above and saw no persuasive reason to revisit that determinationin this proceeding. Regarding the issue of behind-the-meter generation, the FERC stated that it had addressed the issue ofload ratio pricing for network integration transmission service and the related issue of behind-the-meter generation in OrderNos. 888 and 888-A, and saw no persuasive reason to revisit that determination in this proceeding. With respect to the thirdissue, the FERC directed FPL to make a compliance filing of a proposed rate schedule that does not include those facilities ofFPL that fail to meet the same integration test applied to the FMPA facilities.
In January 2004, FMPA requested a "conditional rehearing on the Commission’s failure to order rate credits solely in theevent that Commission does not adequately reduce FPL’s rate base to achieve comparability," and challenging the FERC’sdetermination not to revisit the issue of behind-the-meter generation and load ratio pricing for network integrationtransmission service. In March 2004, the FERC issued an order denying FMPA’s rehearing request. In April 2004, FMPApetitioned the DC Circuit for review of the FERC’s December 2003 order and March 2004 order. FMPA filed its initial brief inthat proceeding in October 2004. FMPA’s arguments are limited to the issue of behind-the-meter generation and load ratiopricing for network integration transmission service in instances when, according to FMPA, FPL cannot provide transmissionservice because of "physical transmission limitations." In June 2005, the DC Circuit remanded the case to the FERC forfurther consideration. The DC Circuit concluded that the FERC failed to explain in its orders why network customers shouldbe charged by the transmission provider for network service that the provider is physically constrained from offering and whyphysical impossibility should not be recognized as an exception to the general rule against permitting partial load ratio pricingfor network customers. The DC Circuit noted that it was not reaching a determination on whether charging on a full load basisin fact is unjust and unreasonable under the circumstances, that it was not defining what constitutes physical impossibility,and that it was not determining whether FMPA made a showing of impossibility. In December 2005, the FERC issued anorder on remand answering the DC Circuit’s question by finding that FPL is entitled to load ratio share pricing,notwithstanding constraints on a third-party’s system. In January 2006, FMPA filed a rehearing request of this order with theFERC.
In May 2004, FPL made a compliance filing of a proposed rate schedule that does not include those facilities of FPL that failto meet the same integration test that was applied to the FMPA facilities. Pursuant to this filing, 1.63% of FPL's transmissionfacilities do not satisfy the integration standard and FPL's current network transmission rate would be reduced by $0.02 perkilowatt (kw) per month. In June 2004, FMPA filed a protest to FPL's compliance filing, which protest would excludeapproximately 30% of FPL's transmission facilities and reduce FPL's current network transmission rate by approximately$0.41 per kw per month. In January 2005, the FERC issued an order on FPL's compliance filing. In the order, the FERCaccepted FPL's standards for analyzing the transmission system and agreed that FPL's "Georgia Ties" and "Turkey PointLines" are part of FPL's integrated grid. The FERC required FPL to make an additional compliance filing removing the cost ofall radial transmission lines from transmission rates, rather than only radial lines that serve one customer, analyzing the FPLtransmission system to remove the cost of any transmission facilities that provide only "unneeded redundancy," andcalculating rate adjustments using 1993 data rather than 1998 data. FPL made this compliance filing in April 2005, reducingFPL’s rate $0.04 per kw per month resulting in a refund obligation to FMPA of approximately $3 million at December 31,2005. In May 2005, FMPA protested FPL’s compliance filing, claiming that FPL had not followed the FERC’s mandate andargued that FPL’s rates should be reduced by an additional $0.20, potentially resulting in a refund obligation to FMPA ofapproximately $18 million at December 31, 2005. Any reduction in FPL’s network service rate also would apply effectiveJanuary 1, 2004 to Seminole Electric Cooperative Inc. (Seminole), FPL’s other network customer. The refund obligation toSeminole at December 31, 2005 would be approximately $1 million under FPL’s filing and approximately $5 million based onFMPA’s position.
In December 2005, the FERC issued an order accepting FPL’s April 2005 compliance filing in part, rejecting it in part, anddirecting the submission of a further compliance filing. The FERC accepted FPL’s compliance filing wherein FPL proposed areduction in its rate base created by the exclusion of certain radial lines valued at $29 million net plant. However, the FERCconcluded that it is not clear whether FPL failed to test its non-radial facilities in a manner comparable to the way it testedFMPA’s facilities. The December 2005 order asks FPL to make a further compliance filing in 60 days to explain the meaningof "unserved load" as it applies to Florida Reliability Coordinating Council (FRCC) standards, and to remove from rates anyfacility where the unserved load occurred only as a result of the contingency facility. The FERC noted that FRCC and NorthAmerican Electric Reliability Council (NERC) standards allow for the controlled loss of load on radial facilities and that FPLtested FMPA facilities for loss of local load as well as load at other load centers. FPL filed a rehearing request in January2006, contending that the FERC misapplied FRCC/NERC planning criteria for radial facilities to network systems andmisinterpreted the test FPL applied to FMPA facilities. FPL also filed a request to delay the compliance filing pending FERCaction on FPL’s rehearing request.

FPL GROUP, INC. AND FLORIDA POWER & LIGHT COMPANYNOTES TO CONSOLIDATED FINANCIAL STATEMENTS (Continued)
83
In 1995 and 1996, FPL Group, through an indirect subsidiary, purchased from Adelphia Communications Corporation(Adelphia) 1,091,524 shares of Adelphia common stock and 20,000 shares of Adelphia preferred stock (convertible into2,358,490 shares of Adelphia common stock) for an aggregate price of approximately $35,900,000. On January 29, 1999,Adelphia repurchased all of these shares for $149,213,130 in cash. On June 24, 2004, Adelphia, Adelphia Cablevision,L.L.C. and the Official Committee of Unsecured Creditors of Adelphia filed a complaint against FPL Group and its indirectsubsidiary in the U.S. Bankruptcy Court, Southern District of New York. The complaint alleges that the repurchase of theseshares by Adelphia was a fraudulent transfer, in that at the time of the transaction Adelphia (i) was insolvent or was renderedinsolvent, (ii) did not receive reasonably equivalent value in exchange for the cash it paid, and (iii) was engaged or about toengage in a business or transaction for which any property remaining with Adelphia had unreasonably small capital. Thecomplaint seeks the recovery for the benefit of Adelphia’s bankruptcy estate of the cash paid for the repurchased shares, plusinterest. FPL Group has filed an answer to the complaint and discovery has commenced. FPL Group believes that thecomplaint is without merit because, among other reasons, Adelphia will be unable to demonstrate that (i) Adelphia’srepurchase of shares from FPL Group, which repurchase was at the market value for those shares, was not for reasonablyequivalent value, (ii) Adelphia was insolvent at the time of the repurchase, or (iii) the repurchase left Adelphia withunreasonably small capital. The case has been set for trial in August 2007.
In 2003, Scott and Rebecca Finestone brought an action on behalf of themselves and their son Zachary Finestone in the U.S.District Court for the Southern District of Florida alleging that their son has developed cancer (neuroblastoma) as a result ofthe release and/or dissipation into the air, water, soil and underground areas of radioactive and non-radioactive hazardousmaterials, including strontium 90, and the release of other toxic materials from FPL’s St. Lucie nuclear power plant. Thecomplaint, as subsequently amended, includes counts against FPL for strict liability for allegedly engaging in an ultra-hazardous activity and for alleged negligence in operating the plant in a manner that allowed emissions of the foregoingmaterials and failing to limit its release of nuclear fission products as prescribed by federal and state laws andregulations. The plaintiffs seek damages in excess of $1 million. In January 2006, the court granted FPL’s motion for finalsummary judgment and dismissed the case. On February 8, 2006, the plaintiffs filed a notice of appeal of the court’s decisiongranting final summary judgment for FPL.
In 2003, Tish Blake and John Lowe, as personal representatives of the Estate of Ashton Lowe, on behalf of the estate andthemselves, as surviving parents, brought an action in the U.S. District Court for the Southern District of Florida alleging thattheir son developed cancer (medulo-blastoma) as a result of the release and/or dissipation into the air, water, soil andunderground areas of radioactive and non-radioactive hazardous materials, including strontium 90, and the release of othertoxic materials from FPL’s St. Lucie nuclear power plant. The allegations, counts and damages demanded in the complaint,as subsequently amended, are virtually identical to those contained in the Finestone lawsuit described above. In January2006, the court granted FPL’s motion for final summary judgment and dismissed the case. On February 8, 2006, the plaintiffsfiled a notice of appeal of the court’s decision granting final summary judgment for FPL.
In 2003, Pedro C. and Emilia Roig brought an action on behalf of themselves and their son, Pedro Anthony Roig, in theCircuit Court of the 11th Judicial Circuit in and for Miami-Dade County, Florida (the state court), which was removed in October2003 to the U.S. District Court for the Southern District of Florida, against Aventis Pasteur and a number of other named andunnamed drug manufacturing and distribution companies and FPL, alleging that their son has suffered toxic neurologicaleffects from mercury poisoning. The sources of mercury exposure are alleged to be vaccines containing a preservative calledthimerosal that were allegedly manufactured and distributed by the drug companies, mercury amalgam dental fillings, andemissions from FPL power plants in southeast Florida. The complaint includes counts against all defendants for civil batteryand against FPL for alleged negligence in operating the plants such that the son was exposed to mercury and other heavymetals emissions. The damages demanded from FPL are for injuries and losses allegedly suffered by the son as a result ofhis exposure to the plants’ mercury emissions and the parents’ alleged pain and suffering, medical expenses, loss of wages,and loss of their son’s services and companionship. No amount of damages is specified. The U.S. District Court remandedthe action back to the state court. The drug manufacturing and distribution companies have moved to dismiss theaction. Plaintiffs and FPL have agreed that FPL will not respond to the complaint until the state court rules on those motions.
In 2003, Edward and Janis Shiflett brought an action on behalf of themselves and their son, Phillip Benjamin Shiflett, in theCircuit Court of the 18th Judicial Circuit in and for Brevard County, Florida (the state court), which was removed in January2004 to the U.S. District Court for the Middle District of Florida, against Aventis Pasteur and a number of other named andunnamed drug manufacturing and distribution companies, FPL and the Orlando Utilities Commission, alleging that their sonhas suffered toxic neurological effects from mercury poisoning. The allegations, counts and damages demanded in thecomplaint with respect to FPL are virtually identical to those contained in the Roig lawsuit described above. FPL’s motion todismiss the complaint was denied. The U.S. District Court subsequently remanded the action back to the state court. Allparties anticipate that the drug manufacturing and distribution companies will move to dismiss the action. Plaintiffs and FPLhave agreed that FPL will not respond to the complaint until the state court rules on those motions.
In October 2004, TXU Portfolio Management Company (TXU) served FPL Energy Pecos Wind I, LP, FPL Energy Pecos WindI GP, LLC, FPL Energy Pecos Wind II, LP, FPL Energy Pecos Wind II GP, LLC and Indian Mesa Wind Farm, LP (FPL EnergyAffiliates) as defendants in a civil action filed in the District Court in Dallas County, Texas. The petition alleges that the FPLEnergy Affiliates had a contractual obligation to produce and sell to TXU a minimum quantity of energy each year and that the

FPL GROUP, INC. AND FLORIDA POWER & LIGHT COMPANYNOTES TO CONSOLIDATED FINANCIAL STATEMENTS (Continued)
84
FPL Energy Affiliates failed to meet this obligation. The plaintiff has asserted claims for breach of contract and declaratoryjudgment and seeks damages of approximately $21 million. The FPL Energy Affiliates filed their answer and counterclaim inNovember 2004, denying the allegations. The counterclaim, as now amended, asserts claims for conversion, breach offiduciary duty, breach of warranty, conspiracy, breach of contract and fraud and seeks termination of the contract anddamages. At the end of 2005, TXU amended its complaint to add FPL Group, FPL Energy, FPL Group Capital and ESIEnergy, LLC, as defendants. Motions to dismiss those entities as defendants have been filed. The case is in discovery andhas been set for trial in October 2006.
In November 2005, Peter Rabbino and Legal Computer Consultants, Inc. brought a civil action against FPL in the CircuitCourt for Broward County, Florida. This action is purportedly on behalf of all customers of FPL that lost power due toHurricane Wilma. No class certification motion has been filed to date. The two count complaint alleges, in Count I, breach ofcontract and, in Count II, violation of a statute. Count I alleges that FPL failed to sufficiently maintain its system to preventpower outages due to inclement weather, including hurricanes. This count seeks injunctive relief requiring FPL to bury itslines or install stronger poles and consequential damages. Count II alleges that FPL is statutorily obligated to providesufficient, adequate and efficient service and that FPL was grossly negligent in carrying out this obligation resulting indamages to its customers due to Hurricane Wilma. This count seeks injunctive relief and consequential damages identical tothat sought in Count I. FPL filed a motion to dismiss based on a number of legal grounds, including the exclusive jurisdictionof the FPSC to govern these types of disputes. On February 8, 2006, the court granted FPL’s motion to dismiss, dismissingall claims in Count I with prejudice, and dismissing Count II without prejudice except as to any claims for injunctive relief,which were dismissed with prejudice.
In addition to those legal proceedings discussed above, FPL Group and its subsidiaries, including FPL, are involved in anumber of other legal proceedings and claims in the ordinary course of their businesses. In addition, generating plants inwhich FPL Group or FPL have an ownership interest are involved in legal proceedings and claims, the liabilities from which, ifany, would be shared by FPL Group or FPL.
FPL Group and FPL believe that they have meritorious defenses to all the pending litigation and proceedings discussedabove under the heading Litigation and are vigorously defending the lawsuits. While management is unable to predict withcertainty the outcome of the legal proceedings and claims discussed or described herein, based on current knowledge it isnot expected that their ultimate resolution, individually or collectively, will have a material adverse effect on the financialstatements.
17. Segment Information
FPL Group's reportable segments include FPL, a rate-regulated utility, and FPL Energy, a competitive energysubsidiary. Corporate and Other represents other business activities, other segments that are not separately reportable andeliminating entries. FPL Group's operating revenues derived from the sale of electricity represented approximately 98% of FPLGroup's operating revenues for each of the three years ended December 31, 2005, 2004 and 2003. Less than 1% of operatingrevenues were from foreign sources for each of the three years ended December 31, 2005, 2004 and 2003. At December 31,2005 and 2004, less than 1% of long-lived assets were located in foreign countries.

FPL GROUP, INC. AND FLORIDA POWER & LIGHT COMPANYNOTES TO CONSOLIDATED FINANCIAL STATEMENTS (Continued)
85
FPL Group’s segment information is as follows:
2005 2004 2003
FPLFPL
Energy (a)
Corp.and
Other Total FPLFPL
Energy (a)
Corp.and
Other Total FPLFPL
Energy (a)
Corp.and
Other Total(millions)
Operating revenues $ 9,528 $ 2,221 $ 97 $ 11,846 $ 8,734 $ 1,705 $ 83 $ 10,522 $ 8,293 $ 1,252 $ 85 $ 9,630Operating expenses $ 8,181 $ 2,093 $ 108 $ 10,382 $ 7,419 $ 1,541 $ 90 $ 9,050 $ 6,964 $ 1,059 $ 76 $ 8,099Interest charges $ 224 $ 223 $ 146 $ 593 $ 183 $ 180 $ 126 $ 489 $ 173 $ 124 $ 82 $ 379Depreciation and amortization $ 951 $ 311 $ 23 $ 1,285 $ 915 $ 264 $ 19 $ 1,198 $ 898 $ 187 $ 20 $ 1,105Equity in earnings of equity method investees $ - $ 124 $ - $ 124 $ - $ 94 $ - $ 94 $ - $ 89 $ - $ 89Income tax expense (benefit) (b) $ 408 $ (65) $ (71) $ 272 $ 409 $ (65) $ (77) $ 267 $ 403 $ (4) $ (31) $ 368Income (loss) before cumulative effect of changes in accounting principle $ 748 $ 187 $ (50) $ 885 $ 749 $ 172(c) $ (34) $ 887 $ 733 $ 197 $ (37) $ 893Cumulative effect of changes in accounting principle, net of income taxes $ - $ - $ - $ - $ - $ - $ - $ - $ - $ (3)
(d) $ - $ (3)Net income (loss) $ 748 $ 187 $ (50) $ 885 $ 749 $ 172(c) $ (34) $ 887 $ 733 $ 194 $ (37) $ 890Capital expenditures, independent power investments and nuclear fuel purchases $ 1,711 $ 822 $ 13 $ 2,546 $ 1,484 $ 527 $ 6 $ 2,017 $ 1,409 $ 1,478 $ 7 $ 2,894Property, plant and equipment $ 24,407 $ 8,611 $ 333 $ 33,351 $ 23,515 $ 7,888 $ 317 $ 31,720 $ 22,489 $ 7,495 $ 288 $ 30,272Accumulated depreciation $ 9,530 $ 1,253 $ 105 $ 10,888 $ 9,467 $ 940 $ 87 $ 10,494 $ 9,237 $ 671 $ 67 $ 9,975Total assets (d) $ 22,726 $ 9,408 $ 870 $ 33,004 $ 19,114 $ 8,507 $ 712 $ 28,333 $ 17,817 $ 8,446 $ 672 $ 26,935Investment in equity method investees $ - $ 313 $ 10 $ 323 $ - $ 288 $ 9 $ 297 $ - $ 346 $ - $ 346____________________(a) FPL Energy’s interest charges are based on a deemed capital structure of 50% debt for operating projects and 100% debt for projects under construction. Residual non-utility
interest charges are included in Corporate and Other.(b) FPL Energy’s tax benefits relate primarily to production tax credits that were recognized based on its tax sharing agreement with FPL Group.(c) Includes contract restructuring and impairment charges of $46 million after tax. See Note 6.(d) Reflects the adoption of FIN 46 in July 2003. See Note 9.
18. Summarized Financial Information of FPL Group Capital
FPL Group Capital, a 100% owned subsidiary of FPL Group, provides funding for and holds ownership interest in FPL Group’soperating subsidiaries other than FPL. Most of FPL Group Capital’s debt, including its debentures, and payment guarantees arefully and unconditionally guaranteed by FPL Group. Condensed consolidating financial information is as follows:
Condensed Consolidating Statements of Income
Year EndedDecember 31, 2005
Year EndedDecember 31, 2004
Year EndedDecember 31, 2003
FPLGroup
FPLGroupCapital Other(a)
FPLGroup
Consoli-dated
FPLGroup
FPLGroupCapital Other(a)
FPLGroup
Consoli-dated
FPLGroup
FPLGroupCapital Other(a)
FPLGroup
Consoli-dated
(millions)
Operating revenues $ - $ 2,323 $ 9,523 $ 11,846 $ - $ 1,789 $ 8,733 $ 10,522 $ - $ 1,337 $ 8,293 $ 9,630Operating expenses - (2,205) (8,177) (10,382) - (1,632) (7,418) (9,050) - (1,135) (6,964) (8,099)Interest charges (25) (366) (202) (593) (28) (303) (158) (489) (28) (204) (147) (379)Other income (de- ductions) – net 893 273 (880) 286 905 163 (897) 171 903 154 (948) 109Income (loss) before income taxes and cumulative effect of changes in accounting principle 868 25 264 1,157 877 17 260 1,154 875 152 234 1,261Income tax expense (benefit) (17) (119) 408 272 (10) (132) 409 267 (15) (20) 403 368Net income (loss) before cumulative effect of changes in accounting principle 885 144 (144) 885 887 149 (149) 887 890 172 (169) 893Cumulative effect of changes in accounting principle, net of income taxes - - - - - - - - - (3) - (3)Net income (loss) $ 885 $ 144 $ (144) $ 885 $ 887 $ 149 $ (149) $ 887 $ 890 $ 169 $ (169) $ 890
_____________________(a) Represents FPL and consolidating adjustments.

FPL GROUP, INC. AND FLORIDA POWER & LIGHT COMPANYNOTES TO CONSOLIDATED FINANCIAL STATEMENTS (Continued)
86
Condensed Consolidating Balance SheetsDecember 31, 2005 December 31, 2004
FPLGroup
FPLGroupCapital Other(a)
FPLGroup
Consoli-dated
FPLGroup
FPLGroupCapital Other(a)
FPLGroup
Consoli-dated
(millions)PROPERTY, PLANT AND EQUIPMENT Electric utility plant in service and other property $ - $ 8,945 $ 24,406 $ 33,351 $ - $ 8,204 $ 23,516 $ 31,720 Less accumulated depreciation and amortization - (1,359) (9,529) (10,888) - (1,026) (9,468) (10,494) Total property, plant and equipment – net - 7,586 14,877 22,463 - 7,178 14,048 21,226CURRENT ASSETS Cash and cash equivalents 7 467 56 530 26 134 65 225 Receivables 5 584 841 1,430 32 423 590 1,045 Other 63 518 2,446 3,027 137 285 835 1,257 Total current assets 75 1,569 3,343 4,987 195 842 1,490 2,527OTHER ASSETS Investment in subsidiaries 8,647 - (8,647) - 7,674 - (7,674) - Other 140 1,339 4,075 5,554 121 1,448 3,011 4,580 Total other assets 8,787 1,339 (4,572) 5,554 7,795 1,448 (4,663) 4,580TOTAL ASSETS $ 8,862 $ 10,494 $ 13,648 $ 33,004 $ 7,990 $ 9,468 $ 10,875 $ 28,333
CAPITALIZATION Common shareholders' equity $ 8,499 $ 1,911 $ (1,911) $ 8,499 $ 7,537 $ 1,525 $ (1,525) $ 7,537 Long-term debt - 4,768 3,271 8,039 - 5,214 2,813 8,027 Total capitalization 8,499 6,679 1,360 16,538 7,537 6,739 1,288 15,564CURRENT LIABILITIES Debt due within one year - 1,269 1,294 2,563 - 722 995 1,717 Accounts payable 17 365 863 1,245 - 156 606 762 Other 85 803 2,571 3,459 155 458 1,156 1,769 Total current liabilities 102 2,437 4,728 7,267 155 1,336 2,757 4,248OTHER LIABILITIES AND DEFERRED CREDITS Asset retirement obligations - 211 1,474 1,685 - 192 2,015 2,207 Accumulated deferred income taxes (5) 464 2,556 3,015 (5) 816 1,874 2,685 Regulatory liabilities - - 2,971 2,971 - - 2,465 2,465 Other 266 703 559 1,528 303 385 476 1,164 Total other liabilities and deferred credits 261 1,378 7,560 9,199 298 1,393 6,830 8,521COMMITMENTS AND CONTINGENCIESTOTAL CAPITALIZATION AND LIABILITIES $ 8,862 $ 10,494 $ 13,648 $ 33,004 $ 7,990 $ 9,468 $ 10,875 $ 28,333
_____________________(a) Represents FPL and consolidating adjustments.
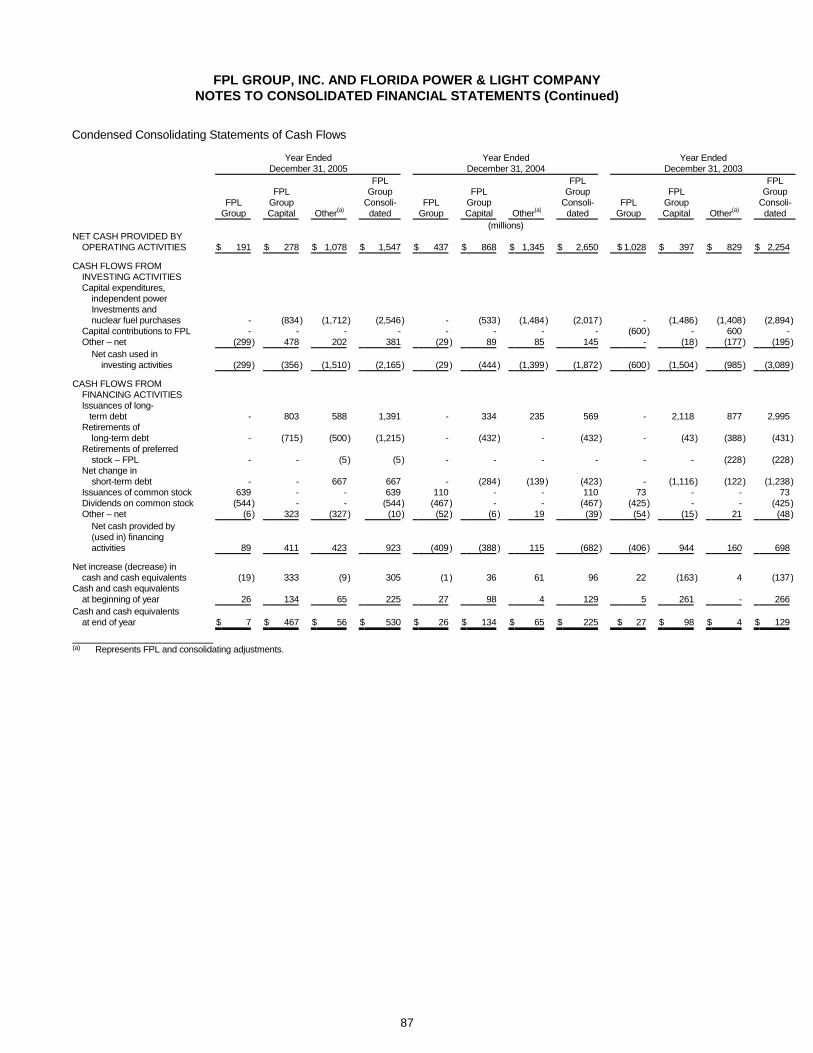
FPL GROUP, INC. AND FLORIDA POWER & LIGHT COMPANYNOTES TO CONSOLIDATED FINANCIAL STATEMENTS (Continued)
87
Condensed Consolidating Statements of Cash Flows
Year EndedDecember 31, 2005
Year EndedDecember 31, 2004
Year EndedDecember 31, 2003
FPLGroup
FPLGroupCapital Other(a)
FPLGroup
Consoli-dated
FPLGroup
FPLGroupCapital Other(a)
FPLGroup
Consoli-dated
FPLGroup
FPLGroupCapital Other(a)
FPLGroup
Consoli-dated
(millions)NET CASH PROVIDED BY OPERATING ACTIVITIES $ 191 $ 278 $ 1,078 $ 1,547 $ 437 $ 868 $ 1,345 $ 2,650 $ 1,028 $ 397 $ 829 $ 2,254
CASH FLOWS FROM INVESTING ACTIVITIES Capital expenditures, independent power Investments and nuclear fuel purchases - (834) (1,712) (2,546) - (533) (1,484) (2,017) - (1,486) (1,408) (2,894) Capital contributions to FPL - - - - - - - - (600) - 600 - Other – net (299) 478 202 381 (29) 89 85 145 - (18) (177) (195) Net cash used in investing activities (299) (356) (1,510) (2,165) (29) (444) (1,399) (1,872) (600) (1,504) (985) (3,089)
CASH FLOWS FROM FINANCING ACTIVITIES Issuances of long- term debt - 803 588 1,391 - 334 235 569 - 2,118 877 2,995 Retirements of long-term debt - (715) (500) (1,215) - (432) - (432) - (43) (388) (431) Retirements of preferred stock – FPL - - (5) (5) - - - - - - (228) (228) Net change in short-term debt - - 667 667 - (284) (139) (423) - (1,116) (122) (1,238) Issuances of common stock 639 - - 639 110 - - 110 73 - - 73 Dividends on common stock (544) - - (544) (467) - - (467) (425) - - (425) Other – net (6) 323 (327) (10) (52) (6) 19 (39) (54) (15) 21 (48) Net cash provided by (used in) financing activities 89 411 423 923 (409) (388) 115 (682) (406) 944 160 698
Net increase (decrease) in cash and cash equivalents (19) 333 (9) 305 (1) 36 61 96 22 (163) 4 (137)Cash and cash equivalents at beginning of year 26 134 65 225 27 98 4 129 5 261 - 266Cash and cash equivalents at end of year $ 7 $ 467 $ 56 $ 530 $ 26 $ 134 $ 65 $ 225 $ 27 $ 98 $ 4 $ 129
_____________________(a) Represents FPL and consolidating adjustments.

FPL GROUP, INC. AND FLORIDA POWER & LIGHT COMPANYNOTES TO CONSOLIDATED FINANCIAL STATEMENTS (Concluded)
88
19. Quarterly Data (Unaudited)
Condensed consolidated quarterly financial information is as follows:
March 31 (a) June 30 (a) September 30 (a) December 31 (a)
(millions, except per share amounts)FPL GROUP:
2005Operating revenues (b) $2,437 $2,741 $3,504 $3,164Operating income (b) $ 234 $ 320 $ 559 $ 351Net income (b) $ 137 $ 203 $ 339 $ 206Earnings per share (c) $ 0.37 $ 0.53 $ 0.88 $ 0.54Earnings per share – assuming dilution (c) $ 0.36 $ 0.52 $ 0.87 $ 0.53Dividends per share $0.355 $0.355 $0.355 $0.355High-low common stock sales prices $41.38-35.90 $42.72-39.16 $48.11-40.30 $48.05-40.75
2004Operating revenues (b) $2,331 $2,619 $2,983 $2,589Operating income (b) $ 261 $ 434 $ 523 $ 254Net income (b) $ 138 $ 257 $ 320 $ 173Earnings per share (c) $ 0.39 $ 0.72 $ .89 $ 0.48Earnings per share – assuming dilution (c) $ 0.39 $ 0.71 $ .88 $ 0.47Dividends per share $ 0.31 $ 0.31 $ 0.34 $ 0.34High-low common stock sales prices $34.41-31.67 $33.63-30.10 $34.93-31.21 $38.05-33.67
FPL:2005
Operating revenues (b) $2,041 $2,298 $2,891 $2,298Operating income (b) $ 201 $ 343 $ 551 $ 252Net income (b) $ 111 $ 201 $ 311 $ 124
2004Operating revenues (b) $1,942 $2,172 $2,485 $2,135Operating income (b) $ 199 $ 357 $ 466 $ 294Net income (b) $ 105 $ 205 $ 275 $ 164Net income available to FPL Group (b) $ 105 $ 205 $ 275 $ 164_____________________(a) In the opinion of FPL Group and FPL, all adjustments, which consist of normal recurring accruals necessary to present a fair statement of the amounts shown for such
periods, have been made. Results of operations for an interim period generally will not give a true indication of results for the year.(b) The sum of the quarterly amounts may not equal the total for the year due to rounding.(c) The sum of the quarterly amounts may not equal the total for the year due to rounding and changes in weighted-average number of common shares outstanding.

89
Item 9. Changes in and Disagreements with Accountants on Accounting and Financial Disclosure
None
Item 9A. Controls and Procedures
Disclosure Controls and Procedures
As of December 31, 2005, each of FPL Group and FPL had performed an evaluation, under the supervision and with theparticipation of its management, including FPL Group’s and FPL’s chief executive officer and chief financial officer, of theeffectiveness of the design and operation of each company’s disclosure controls and procedures (as defined in Exchange Act Rule13a-15(e) or 15d-15(e)). Based upon that evaluation, the chief executive officer and chief financial officer of each of FPL Group andFPL concluded that the company’s disclosure controls and procedures are effective in timely alerting them to material informationrelating to the company and its consolidated subsidiaries required to be included in the company’s reports filed or submitted underthe Exchange Act and ensuring that information required to be disclosed in the company’s reports filed or submitted under theExchange Act is accumulated and communicated to management, including its principal executive and principal financial officers, toallow timely decisions regarding required disclosure. FPL Group and FPL each have a Disclosure Committee, which is made up ofseveral key management employees and reports directly to the chief executive officer and chief financial officer of each company,to monitor and evaluate these disclosure controls and procedures. Due to the inherent limitations of the effectiveness of anyestablished disclosure controls and procedures, management of FPL Group and FPL cannot provide absolute assurance that theobjectives of their respective disclosure controls and procedures will be met.
Internal Control Over Financial Reporting
(a) Management’s Annual Report on Internal Control Over Financial Reporting
See Item 8. Financial Statements and Supplementary Data.
(b) Attestation Report of the Independent Registered Public Accounting Firm
See Item 8. Financial Statements and Supplementary Data.
(c) Changes in Internal Control Over Financial Reporting
FPL Group and FPL are continuously seeking to improve the efficiency and effectiveness of their operations and of theirinternal controls. This results in refinements to processes throughout FPL Group and FPL. However, there has been nochange in FPL Group’s or FPL’s internal control over financial reporting that occurred during FPL Group’s and FPL’s mostrecent fiscal quarter that has materially affected, or is reasonably likely to materially affect, FPL Group’s or FPL’s internalcontrol over financial reporting.
In June 2005, a wholly-owned subsidiary of FPL Group completed the acquisition of Gexa Corp., which was valued atapproximately $73 million, payable in shares of FPL Group common stock. FPL Group’s management elected to excludefrom its assessment of internal control over financial reporting for the year ended December 31, 2005 the entities that directlyown the interests in each of the entities acquired in connection with the acquisition of Gexa Corp., and whose financialstatements reflect total assets and operating revenues representing less than 1% and approximately 3%, respectively, of FPLGroup’s consolidated total assets and total operating revenues as of and for the year ended December 31, 2005. FPL Groupdoes not consider the acquisition of Gexa Corp. material to FPL Group’s results of operations, financial position and cashflows. FPL Group is in the process of evaluating the impact of Gexa’s business on FPL Group’s internal control over financialreporting and has noted numerous inadequacies throughout Gexa’s operations, including the contract approval andadministration process, the customer enrollment process, billing system security and accounting and financial controls. FPLGroup is in the process of remediating these inadequacies and expects to complete this process in 2006. FPL Group’smanagement does not believe these inadequacies affect the adequacy of FPL Group’s internal control over financial reportingbecause of the relative immateriality of Gexa’s activities.
Item 9B. Other Information
On February 16, 2006, Frank G. Zarb announced his retirement from FPL Group’s board of directors effective at FPL Group’s2006 Annual Meeting of Shareholders. In addition, H. Jesse Arnelle has reached mandatory retirement age and will also retirefrom the board of directors effective at FPL Group’s 2006 Annual Meeting of Shareholders. The board has adopted a resolutionreducing its size from twelve to ten effective upon the retirements of Messrs. Arnelle and Zarb.
90
PART III
Item 10. Directors and Executive Officers of Registrant
The information required by this item will be included in FPL Group’s Proxy Statement which will be filed with the SEC inconnection with the 2006 Annual Meeting of Shareholders (FPL Group’s Proxy Statement) and is incorporated herein byreference, or is included in Item 1. Business – Executive Officers of FPL Group.
Item 11. Executive Compensation
The information required by this item will be included in FPL Group's Proxy Statement and is incorporated herein byreference, provided that the Compensation Committee Report, the Audit Committee Report (to the extent permitted by therules of the SEC) and Performance Graph which are contained in FPL Group's Proxy Statement shall not be deemed to beincorporated herein by reference.
Item 12. Security Ownership of Certain Beneficial Owners and Management and Related StockholderMatters
The information required by this item relating to security ownership of certain beneficial owners and management will beincluded in FPL Group's Proxy Statement and is incorporated herein by reference.
SECURITIES AUTHORIZED FOR ISSUANCE UNDER EQUITY COMPENSATION PLANS
FPL Group's equity compensation plan information as of December 31, 2005 is as follows:
Plan category
Number of securities to beissued upon exercise of
outstanding options, warrantsand rights
(a)
Weighted-average exerciseprice of outstanding options,
warrants and rights(b)
Number of securities remainingavailable for future issuanceunder equity compensationplans (excluding securities
reflected in column (a))(c)
Equity compensation plans approved by security holders 7,228,617 $27.48 12,477,628 (a)
Equity compensation plans not approved by security holders (b) 79,614 $17.77 -_____________________(a) These shares are also available for issuance as restricted stock and as performance-based stock awards.(b) Represents options granted by Gexa Corp. under its Amended and Restated 2004 Incentive Plan and pursuant to various individual grants, all of which were made
prior to the acquisition of Gexa Corp. All such options were assumed by FPL Group in connection with the acquisition of Gexa Corp. and are fully vested andexercisable for shares of FPL Group common stock. No further grants of stock options will be made under this plan.
Item 13. Certain Relationships and Related Transactions
The information required by this item will be included in FPL Group's Proxy Statement under a similar heading, if applicable,and under the headings Executive Compensation, Employment Agreements and Director Compensation and is incorporatedherein by reference.
Item 14. Principal Accountant Fees and Services
FPL Group – The information required by this item will be included in FPL Group's Proxy Statement under the headings "FeesPaid to Deloitte & Touche LLP" and "Policy on Audit Committee Pre-Approval of Audit and Non-Audit Services of IndependentAuditor" and is incorporated herein by reference.

91
FPL – The following table presents fees billed for professional services rendered by Deloitte & Touche LLP, the member firmsof Deloitte Touche Tohmatsu, and their respective affiliates (collectively, Deloitte & Touche) for the fiscal years endedDecember 31, 2005 and 2004. The amounts presented below reflect allocations from FPL Group for FPL's portion of thefees, as well as amounts billed directly to FPL.
2005 2004
Audit fees (a) $ 2,410,000 $ 2,340,000Audit-related fees (b) 237,000 308,000Tax fees (c) 101,000 86,000All other fees (d) - -Total $ 2,748,000 $ 2,734,000_____________________(a) Audit fees consist of fees billed for professional services rendered for the audit of FPL’s and FPL Group’s annual consolidated financial statements for the fiscal year,
the reviews of the financial statements included in FPL’s and FPL Group’s Quarterly Reports on Form 10-Q for the fiscal year, attestation of management’sassessment of internal control over financial reporting and the audit of the effectiveness of internal control over financial reporting, comfort letters, consents, and otherservices related to SEC matters, services in connection with annual and semi-annual filings of FPL Group’s financial statements with the Japanese Ministry of Financeand accounting consultations to the extent necessary for Deloitte & Touche to fulfill their responsibility under Public Company Accounting Oversight Board standards.
(b) Audit-related fees consist of fees billed for assurance and related services that are reasonably related to the performance of the audit or review of FPL’s and FPLGroup’s consolidated financial statements and are not reported under "Audit Fees." These fees primarily related to audits of subsidiary financial statements, comfortletters, consents and other services related to subsidiary (non-SEC registrant) financing activities, audits of employee benefit plans and consultation on accountingstandards and on transactions.
(c) Tax fees consist of fees billed for professional services rendered for tax compliance, tax advice and tax planning. In 2005, approximately $21,000 was paid related totax advice and planning services. All other tax fees in 2005 and all tax fees in 2004 related to tax compliance services.
(d) All other fees consist of fees for products and services other than the services reported under the other named categories. In 2005 and 2004, there were no other feesincurred in this category.
In accordance with the requirements of Section 404 of the Sarbanes-Oxley Act of 2002 (Sarbanes-Oxley), FPL Group's AuditCommittee's pre-approval policy for services provided by the independent auditor, and the Charter of the Audit Committee, allservices performed by Deloitte & Touche are approved in advance by the Audit Committee. Audit and audit-related servicesspecifically identified in an appendix to the pre-approval policy are pre-approved by the Audit Committee each year. This pre-approval allows management to request the specified audit and audit-related services on an as-needed basis during the year,provided any such services are reviewed with the Audit Committee at its next regularly scheduled meeting. Any audit oraudit-related service for which the fee is expected to exceed $250,000, or that involves a service not listed on the pre-approval list, must be specifically approved by the Audit Committee prior to commencement of such work. In addition, theAudit Committee approves all services other than audit and audit-related services performed by Deloitte & Touche in advanceof the commencement of such work or, in cases which meet the de minimus pre-approval exception established by Sarbanes-Oxley, prior to completion of the audit. The Audit Committee has delegated to the chairman of the committee the right toapprove audit, audit-related, tax and other services, within certain limitations, between meetings of the Audit Committee,provided any such decision is presented to the Audit Committee at its next regularly scheduled meeting. The AuditCommittee reviews on a quarterly basis a schedule of all services for which Deloitte & Touche has been engaged and theestimated fees for those services. In fiscal years 2005 and 2004, no services provided by Deloitte & Touche to FPL orallocated to FPL under the categories Audit-related, Tax and All other fees described above were approved by the AuditCommittee after services were rendered pursuant to the de minimus exception established by Sarbanes-Oxley.

92
PART IV
Item 15. Exhibits and Financial Statement SchedulesPage(s)
(a) 1. Financial Statements
Management’s Report on Internal Control Over Financial Reporting 44Attestation Report of Independent Registered Public Accounting Firm 45Report of Independent Registered Public Accounting Firm 46FPL Group:
Consolidated Statements of Income 47Consolidated Balance Sheets 48Consolidated Statements of Cash Flows 49Consolidated Statements of Common Shareholders’ Equity 50
FPL:Consolidated Statements of Income 51Consolidated Balance Sheets 52Consolidated Statements of Cash Flows 53Consolidated Statements of Common Shareholder’s Equity 54
Notes to Consolidated Financial Statements 55-88
2. Financial Statement Schedules – Schedules are omitted as not applicable or not required.
3. Exhibits (including those incorporated by reference)
ExhibitNumber Description
FPLGroup FPL
*2 Agreement and Plan of Merger among FPL Group, Inc., Constellation Energy Group,Inc. and CF Merger Corporation dated as of December 18, 2005 (filed as Exhibit 2.1 toForm 8-K dated December 19, 2005, File No. 1-8841)
x x
*3(i)a Restated Articles of Incorporation of FPL Group dated December 31, 1984,as amended through March 10, 2005 (filed as Exhibit 3(i) to Form S-4,File No. 333-124438)
x
*3(i)b Restated Articles of Incorporation of FPL dated March 23, 1992 (filed asExhibit 3(i)a to Form 10-K for the year ended December 31, 1993, File No.1-3545)
x
*3(i)c Amendment to FPL's Restated Articles of Incorporation dated March 23, 1992(filed as Exhibit 3(i)b to Form 10-K for the year ended December 31, 1993,File No. 1-3545)
x
*3(i)d Amendment to FPL's Restated Articles of Incorporation dated May 11, 1992(filed as Exhibit 3(i)c to Form 10-K for the year ended December 31, 1993,File No. 1-3545)
x
*3(i)e Amendment to FPL's Restated Articles of Incorporation dated March 12, 1993(filed as Exhibit 3(i)d to Form 10-K for the year ended December 31, 1993,File No. 1-3545)
x
*3(i)f Amendment to FPL's Restated Articles of Incorporation dated June 16, 1993(filed as Exhibit 3(i)e to Form 10-K for the year ended December 31, 1993,File No. 1-3545)
x
*3(i)g Amendment to FPL's Restated Articles of Incorporation dated August 31, 1993(filed as Exhibit 3(i)f to Form 10-K for the year ended December 31, 1993,File No. 1-3545)
x
*3(i)h Amendment to FPL's Restated Articles of Incorporation dated November 30,1993 (filed as Exhibit 3(i)g to Form 10-K for the year ended December 31,1993, File No. 1-3545)
x

93
ExhibitNumber Description
FPLGroup FPL
*3(i)i Amendment to FPL’s Restated Articles of Incorporation dated January 20, 2004(filed as Exhibit 3(i)j to Form 10-K dated December 31, 2003, File No. 2-27612)
x
*3(i)j Amendment to FPL’s Restated Articles of Incorporation dated January 20, 2004(filed as Exhibit 3(i)k to Form 10-K dated December 31, 2003, File No. 2-27612)
x
*3(i)k Amendment to FPL’s Restated Articles of Incorporation dated February 11, 2005(filed as Exhibit 3(i)m to Form 10-K for the year ended December 31, 2004,File No. 1-8841)
x
*3(ii)a Bylaws of FPL Group as amended February 12, 2001 (filed as Exhibit 3(ii)ato Form 10-K for the year ended December 31, 2000, File No. 1-8841)
x
*3(ii)b Bylaws of FPL dated May 11, 1992 (filed as Exhibit 3 to Form 8-K datedMay 1, 1992, File No. 1-3545)
x
*4(a) Form of Rights Agreement, dated as of July 1, 1996, between FPL Groupand EquiServe Trust Company, N.A. as successor to Fleet National Bank(f/k/a The First National Bank of Boston), as Rights Agent (filed as Exhibit4 to Form 8-K dated June 17, 1996, File No. 1-8841)
x
*4(b) Second Amendment to Rights Agreement, dated as of December 26, 2002,between FPL Group and EquiServe Trust Company, N.A. as successor toFleet National Bank (f/k/a The First National Bank of Boston), as the RightsAgent (filed as Exhibit 3 to Form 8-A/A dated January 3, 2003, File No. 1-8841)
x
*4(c) Third Amendment to Rights Agreement, dated as of January 1, 2004, betweenFPL Group, Computershare Investor Services, LLC as successor rights agent,and EquiServe Trust Company, N.A. as predecessor rights agent (filed asExhibit 4 to Form 8-A/A dated December 19, 2003, File No. 1-8841)
x
*4(d) Fourth Amendment to Rights Agreement, dated as of December 18, 2005,between FPL Group, Inc. and Computershare Investor Services, LLC, assuccessor rights agent to EquiServe Trust Company, N.A., predecessor rightsagent (filed as Exhibit 5 to Form 8-A/A dated December 19, 2005, File No. 1-8841)
x
*4(e) Certificate of Adjustment, dated March 15, 2005, to the Rights Agreement, datedJuly 1, 1996, as amended, between FPL Group, Inc. and Computershare InvestorServices, LLC, as successor rights agent (filed as Exhibit 4(b) to Form 8-K datedMarch 11, 2005, File No. 1-8841)
x
*4(f) Mortgage and Deed of Trust dated as of January 1, 1944, and One hundred andnine Supplements thereto, between FPL and Deutsche Bank Trust CompanyAmericas, Trustee (filed as Exhibit B-3, File No. 2-4845; Exhibit 7(a), FileNo. 2-7126; Exhibit 7(a), File No. 2-7523; Exhibit 7(a), File No. 2-7990; Exhibit 7(a),File No. 2-9217; Exhibit 4(a)-5, File No. 2-10093; Exhibit 4(c), File No. 2-11491;Exhibit 4(b)-1, File No. 2-12900; Exhibit 4(b)-1, File No. 2-13255; Exhibit 4(b)-1,File No. 2-13705; Exhibit 4(b)-1, File No. 2-13925; Exhibit 4(b)-1, File No. 2-15088;Exhibit 4(b)-1, File No. 2-15677; Exhibit 4(b)-1, File No. 2-20501; Exhibit 4(b)-1,File No. 2-22104; Exhibit 2(c), File No. 2-23142; Exhibit 2(c), File No. 2-24195;Exhibit 4(b)-1, File No. 2-25677; Exhibit 2(c), File No. 2-27612; Exhibit 2(c), FileNo. 2-29001; Exhibit 2(c), File No. 2-30542; Exhibit 2(c), File No. 2-33038;Exhibit 2(c), File No. 2-37679; Exhibit 2(c), File No. 2-39006; Exhibit 2(c), FileNo. 2-41312; Exhibit 2(c), File No. 2-44234; Exhibit 2(c), File No. 2-46502;Exhibit 2(c), File No. 2-48679; Exhibit 2(c), File No. 2-49726; Exhibit 2(c), FileNo. 2-50712; Exhibit 2(c), File No. 2-52826; Exhibit 2(c), File No. 2-53272;Exhibit 2(c), File No. 2-54242; Exhibit 2(c), File No. 2-56228; Exhibits 2(c) and2(d), File No. 2-60413; Exhibits 2(c) and 2(d), File No. 2-65701; Exhibit 2(c), FileNo. 2-66524; Exhibit 2(c), File No. 2-67239; Exhibit 4(c), File No. 2-69716;Exhibit 4(c), File No. 2-70767; Exhibit 4(b), File No. 2-71542; Exhibit 4(b),File No. 2-73799; Exhibits 4(c), 4(d) and 4(e), File No. 2-75762; Exhibit 4(c),File No. 2-77629; Exhibit 4(c), File No. 2-79557; Exhibit 99(a) to Post-EffectiveAmendment No. 5 to Form S-8, File No. 33-18669; Exhibit 99(a) to Post-EffectiveAmendment No. 1 to Form S-3, File No. 33-46076; Exhibit 4(b) to Form 10-K
x x

94
ExhibitNumber Description
FPLGroup FPL
for the year ended December 31, 1993, File No. 1-3545; Exhibit 4(i) to Form 10-Qfor the quarter ended June 30, 1994, File No. 1-3545; Exhibit 4(b) to Form 10-Qfor the quarter ended June 30, 1995, File No. 1-3545; Exhibit 4(a) to Form 10-Qfor the quarter ended March 31,1996, File No. 1-3545; Exhibit 4 to Form 10-Q forthe quarter ended June 30, 1998, File No. 1-3545; Exhibit 4 to Form 10-Q for thequarter ended March 31, 1999, File No. 1-3545; Exhibit 4(f) to Form 10-K for theyear ended December 31, 2000, File No. 1-3545; Exhibit 4(g) to Form 10-K for theyear ended December 31, 2000, File No. 1-3545; Exhibit 4(o), File No. 333-102169;Exhibit 4(k) to Post-Effective Amendment No. 1 to Form S-3, File No. 333-102172;Exhibit 4(l) to Post-Effective Amendment No. 2 to Form S-3, File No. 333-102172;Exhibit 4(m) to Post-Effective Amendment No. 3 to Form S-3, File No. 333-102172;Exhibit 4(a) to Form 10-Q for the quarter ended September 30, 2004, FileNo. 2-27612); Exhibit 4(f) to Amendment No. 1 to Form S-3, File No.333-125275;Exhibit 4(y) to Post-Effective Amendment No. 2 to Form S-3, File Nos. 333-116300,333-116300-01 and 333-116300-02; and Exhibit 4(z) to Post-Effective AmendmentNo. 3 to Form S-3, File Nos. 333-116300, 333-116300-01 and 333-116300-02)
*4(g) Indenture, dated as of June 1, 1999, between FPL Group Capital andThe Bank of New York, as Trustee (filed as Exhibit 4(a) to Form 8-Kdated July 16, 1999, File No. 1-8841)
x
*4(h) Guarantee Agreement between FPL Group (as Guarantor) andThe Bank of New York (as Guarantee Trustee) dated as of June 1, 1999(filed as Exhibit 4(b) to Form 8-K dated July 16, 1999, File No. 1-8841)
x
*4(i) Officer’s Certificate of FPL Group Capital, dated June 29, 1999,creating the 7 3/8% Debentures, Series due June 1, 2009 (filed asExhibit 4(d) to Form 8-K dated July 16, 1999, File No. 1-8841)
x
*4(j) Officer’s Certificate of FPL Group Capital, dated September 7, 1999,creating the 7 5/8% Debentures, Series due September 15, 2006(filed as Exhibit 4 to Form 10-Q for the quarter ended September 30,1999, File No. 1-8841)
x
*4(k) Officer’s Certificate of FPL Group Capital, dated May 11, 2001, creatingthe 6 1/8% Debentures, Series due May 15, 2007 (filed as Exhibit 4 toForm 10-Q for the quarter ended June 30, 2001, File No. 1-8841)
x
*4(l) Officer’s Certificate of FPL Group Capital, dated February 4, 2002,creating the Series A Debentures due February 16, 2007 (filed as Exhibit 4(j)to Form 10-K for the year ended December 31, 2001, File No. 1-8841)
x
*4(m) Supplemental Officer’s Certificate of FPL Group Capital, dated October 27, 2004,to the Officer’s Certificate creating the Series A Debentures due February 16, 2007(filed as Exhibit 4(b) to Form 10-Q for the quarter ended September 30, 2004,File No. 1-8841)
x
*4(n) Officer’s Certificate of FPL Group Capital, dated April 11, 2003, creating the3 1/4% Debentures, Series due April 11, 2006 (filed as Exhibit 4(ao) toPost-Effective Amendment No. 1 to Form S-3, File Nos. 333-102173,333-102173-01, 333-102173-02 and 333-102173-03)
x
*4(o) Officer’s Certificate of FPL Group Capital, dated June 12, 2002, creatingthe Series B Debentures due February 16, 2008 (filed as Exhibit 4(a) toForm 10-Q for the quarter ended June 30, 2002, File No. 1-8841)
x
*4(p) Indenture (For Unsecured Subordinated Debt Securities relating to Trust Securities) of FPLGroup Capital, dated as of March 1, 2004 (filed as Exhibit 4(au) to Post-EffectiveAmendment No. 3 to Form S-3, File Nos. 333-102173, 333-102173-01, 333-102173-02and 333-102173-03)
x
95
ExhibitNumber Description
FPLGroup FPL
*4(q) Officer’s Certificate of FPL Group Capital, dated March 15, 2004, creating the 5 7/8%Junior Subordinated Debentures, Series due March 15, 2044 (filed as Exhibit 4(av) to Post-Effective Amendment No. 3 to Form S-3, File Nos. 333-102173, 333-102173-01, 333-102173-02 and 333-102173-03)
x
*4(r) Preferred Trust Securities Guarantee Agreement between FPL Group (as Guarantor) andThe Bank of New York (as Guarantee Trustee), dated as of March 15, 2004 (filedas Exhibit 4(aw) to Post-Effective Amendment No. 3 to Form S-3, File Nos. 333-102173,333-102173-01, 333-102173-02 and 333-102173-03)
x
*4(s) Amended and Restated Trust Agreement relating to FPL Group Capital Trust I, datedas of March 15, 2004 (filed as Exhibit 4(at) to Post-Effective Amendment No. 3 toForm S-3, File No. 333-102173, 333-102173-01, 333-102173-02 and 333-102173-03)
x
*4(t) Agreement as to Expenses and Liabilities of FPL Group Capital Trust I, dated as of March15, 2004 (filed as Exhibit 4(ax) to Post-Effective Amendment No. 3 to Form S-3, File No.333-102173, 333-102173-01, 333-102173-02 and 333-102173-03)
x
*4(u) Warrant Agreement by and between Gexa Corp. and Highbridge/Zwirn SpecialOpportunities Fund, L.P., dated as of July 8, 2004, assumed by FPL Group effectiveJune 17, 2005 (filed by Gexa Corp. as Exhibit 4.1 to Form 8-K dated July 8, 2004,File No. 1-31435)
x
*4(v) Warrant Agreement by and between Gexa Corp. and Cappello Capital Corp., datedas of November 1, 2004, assumed by FPL Group effective June 17, 2005 (filed byGexa Corp. as Exhibit 4.1 to Form 8-K dated December 3, 2004, File No. 1-31435)
x
*4(w) Warrant Agreement by and between Gexa Corp. and Prospect Street Ventures Ltd.,dated as of July 19, 2004, assumed by FPL Group effective June 17, 2005 (filed asExhibit 4(d) to Form 10-Q for the quarter ended June 30, 2005, File No. 1-8841)
x
*4(x) Warrant Agreement by and between Gexa Corp. and Prospect Street Ventures I LLC,dated as of September 9, 2004, assumed by FPL Group effective June 17, 2005(filed as Exhibit 4(e) to Form 10-Q for the quarter ended June 30, 2005, File No.1-8841)
x
*4(y) Form of Warrant Agreement to Purchase Shares of Common Stock of Gexa Corp.,dated as of November 23, 2004, assumed by FPL Group effective June 17, 2005(filed as Exhibit 4(f) to Form 10-Q for the quarter ended June 30, 2005, File No.1-8841)
x
*10(a) FPL Group Supplemental Executive Retirement Plan, amended and restatedeffective April 1, 1997 (filed as Exhibit 10(a) to Form 10-K for the year endedDecember 31, 1999, File No. 1-8841)
x x
*10(b) Amendments # 1 and 2 effective January 1, 1998 to FPL Group SupplementalExecutive Retirement Plan, amended and restated effective April 1, 1997(filed as Exhibit 10(b) to Form 10-K for the year ended December 31, 1999,File No. 1-8841)
x x
*10(c) Amendment #3 effective January 1, 1999 to FPL Group SupplementalExecutive Retirement Plan, amended and restated effective April 1, 1997(filed as Exhibit 10(c) to Form 10-K for the year ended December 31,1999, File No. 1-8841)
x x
*10(d) Amendment #4 adopted October 13, 2005 to FPL Group Supplemental ExecutiveRetirement Plan, amended and restated effective April 1, 1997 (filed as Exhibit 10(a)to Form 10-Q for the quarter ended September 30, 2005, File No. 1-8841)
x x
*10(e) Supplement to the FPL Group Supplemental Executive Retirement Planas it applies to Lewis Hay, III effective March 22, 2002 (filed as Exhibit 10(g)to Form 10-K for the year ended December 31, 2001, File No. 1-8841)
x x

96
ExhibitNumber Description
FPLGroup FPL
*10(f) FPL Group, Inc. Amended and Restated Long Term Incentive Plan, as amended andrestated October 14, 2005 (filed as Exhibit 10(b) to Form 10-Q for the quarterended September 30, 2005, File No. 1-8841)
x x
*10(g) Form of FPL Group, Inc. Amended and Restated Long-Term Incentive PlanPerformance Share Award Agreement (filed as Exhibit 10(a) to Form 8-K datedDecember 29, 2004, File No. 1-8841)
x x
*10(h) Form of FPL Group, Inc. Amended and Restated Long-Term Incentive PlanRestricted Stock Award Agreement (filed as Exhibit 10(b) to Form 8-K datedDecember 29, 2004, File No. 1-8841)
x x
*10(i) Form of FPL Group, Inc. Amended and Restated Long-Term Incentive PlanRestricted Stock Award Agreement (filed as Exhibit 10 to Form 8-K datedJanuary 28, 2005, File No. 1-8841)
x x
*10(j) Form of FPL Group, Inc. Amended and Restated Long Term Incentive PlanStock Option Award - Non-Qualified Stock Option Agreement (filed asExhibit 10(c) to Form 8-K dated December 29, 2004, File No. 1-8841)
x x
*10(k) Form of FPL Group, Inc. Amended and Restated Long Term Incentive Plan StockOption Award - Non-Qualified Stock Option Agreement (filed as Exhibit 10(d) toto Form 8-K dated December 29, 2004, File No. 1-8841)
x x
*10(l) Form of FPL Group, Inc. Amended and Restated Long-Term Incentive PlanShareholder Value Award Agreement (filed as Exhibit 10(l) to Form 10-K for the yearended December 31, 2004, File No. 1-8841)
x x
*10(m) Form of 2004 Annual Incentive Plan (filed as Exhibit 10(h) to Form 10-K for the yearended December 31, 2003, File No. 1-8841)
x x
*10(n) Form of FPL Group, Inc. Annual Incentive Plan (filed as Exhibit 10(n) to Form 10-Kfor the year ended December 31, 2004, File No. 1-8841)
x x
*10(o) FPL Group Deferred Compensation Plan, amended and restatedeffective January 1, 2001 (filed as Exhibit 10(a) to Form 10-Q for thequarter ended June 30, 2001, File No. 1-8841)
x x
*10(p) FPL Group Deferred Compensation Plan, amended and restated effectiveJanuary 1, 2003 (filed as Exhibit 10(k) to Form 10-K for the year endedDecember 31, 2002, File No. 1-8841)
x x
*10(q) FPL Group Executive Long Term Disability Plan effective January 1, 1995(filed as Exhibit 10(g) to Form 10-K for the year ended December 31,1995, File No. 1-8841)
x x
*10(r) FPL Group Non-Employee Directors Stock Plan dated as of March 17,1997 (filed as Appendix A to FPL Group’s 1997 Proxy Statement, File No.1-8841)
x
*10(s) Summary of Non-Employee Director Compensation effective January 1, 2006 (filed asExhibit 10(c) to Form 10-Q for the quarter ended September 30, 2005, File No.1-8841)
x
*10(t) Form of Split Dollar Agreement between FPL Group and each of itsexecutive officers who elect to participate, including provisions relatingto Certain Officers (as of February 25, 2005 all executive officers participateexcept Moray P. Dewhurst, and "Certain Officers" include Armando J. Oliveraand Antonio Rodriguez (filed as Exhibit 10(s) to Form 10-K for the year endedDecember 31, 2004, File No. 1-8841)
x x

97
ExhibitNumber Description
FPLGroup FPL
*10(u) Form of Executive Retention Employment Agreement betweenFPL Group and each of Lewis Hay, III, Armando J. Oliveraand Antonio Rodriguez (filed as Exhibit 10(a) to Form 10-Q for the quarterended June 30, 2002, File No. 1-8841)
x x
*10(v) Form of Executive Retention Employment Agreement betweenFPL Group and each of Moray P. Dewhurst, John A. Stall and James L. Robo(filed as Exhibit 10(b) to Form 10-Q for the quarter ended June 30, 2002,File No. 1-8841)
x x
*10(w) Amendment to Executive Retention Employment Agreement between FPL Groupand Armando J. Olivera, dated as of October 17, 2003 (filed as Exhibit 10(a)to Form 10-Q for the quarter ended September 30, 2003, File No. 1-8841)
x x
*10(x) Form of Executive Retention Employment Agreement between FPL Groupand each of Robert H. Escoto, Robert L. McGrath and Edward F. Tancer (filed asExhibit 10(x) to Form 10-K for the year ended December 31, 2004, File No. 1-8841)
x x
10(y) Amendment dated as of December 18, 2005 to the Executive Retention EmploymentAgreement dated as of June 17, 2002 by and between FPL Group, Inc. and Lewis Hay, III
x x
10(z) Amendment dated as of December 18, 2005 to the Executive Retention EmploymentAgreement dated as of June 10, 2002 by and between FPL Group, Inc. and Moray P.Dewhurst
x x
10(aa) Form of Amendment dated as of December 18, 2005 to the Executive RetentionEmployment Agreement between FPL Group, Inc. and each of Robert H. Escoto, Robert L.McGrath, Armando J. Olivera, James L. Robo, Antonio Rodriguez, John A. Stall, andEdward F. Tancer
x x
*10(bb) Employment Agreement between FPL Group, Inc. and Lewis Hay, III datedFebruary 25, 2005 (filed as Exhibit 10(y) to Form 10-K for the year endedDecember 31, 2004, File No. 1-8841)
x x
10(cc) Amendment dated as of December 15, 2005 to the Employment Agreement dated as ofFebruary 25, 2005 between FPL Group, Inc. and Lewis Hay, III
x x
10(dd) Form of FPL Group, Inc. Amended and Restated Long-Term Incentive PlanDeferred Stock Award Agreement
x x
10(ee) FPL Group, Inc. Employee Retention Bonus Plan x x
10(ff) Form of FPL Group, Inc. Employee Retention Bonus Plan Agreement x x
*10(gg) Guarantee Agreement between FPL Group and FPL Group Capital,dated as of October 14, 1998 (filed as Exhibit 10(y) to Form 10-K for theyear ended December 31, 2001, File No. 1-8841)
x
12(a) Computation of Ratios x
12(b) Computation of Ratios x
21 Subsidiaries of FPL Group, Inc. x
23 Consent of Independent Registered Public Accounting Firm x x
31(a) Rule 13a-14(a)/15d-14(a) Certification of Chief Executive Officer of FPL Group x
31(b) Rule 13a-14(a)/15d-14(a) Certification of Chief Financial Officer of FPL Group x
31(c) Rule 13a-14(a)/15d-14(a) Certification of Chief Executive Officer of FPL x
31(d) Rule 13a-14(a)/15d-14(a) Certification of Chief Financial Officer of FPL x

98
ExhibitNumber Description
FPLGroup FPL
32(a) Section 1350 Certification of FPL Group x
32(b) Section 1350 Certification of FPL x_____________________*Incorporated herein by reference
FPL Group and FPL agree to furnish to the SEC upon request any instrument with respect to long-term debt that FPL Groupand FPL have not filed as an exhibit pursuant to the exemption provided by Item 601(b)(4)(iii)(A) of Regulation S-K.

99
FPL GROUP, INC. SIGNATURES
Pursuant to the requirements of Section 13 or 15(d) of the Securities Exchange Act of 1934, the registrant has duly caused thisreport to be signed on its behalf by the undersigned, thereunto duly authorized.
FPL Group, Inc.
LEWIS HAY, IIILewis Hay, III
Chairman of the Board, President,Chief Executive Officer and Director
(Principal Executive Officer)
Date: February 22, 2006
Pursuant to the requirements of the Securities Exchange Act of 1934, this report has been signed below by the following personson behalf of the registrant and in the capacities and on the date indicated.
Signature and Title as of February 23, 2006:
MORAY P. DEWHURST K. MICHAEL DAVISMoray P. DewhurstVice President, Finance andChief Financial Officer(Principal Financial Officer)
K. Michael DavisController and Chief Accounting Officer(Principal Accounting Officer)
Directors:
H. JESSE ARNELLE RUDY E. SCHUPPH. Jesse Arnelle Rudy E. Schupp
SHERRY S. BARRAT MICHAEL H. THAMANSherry S. Barrat Michael H. Thaman
ROBERT M. BEALL, II HANSEL E. TOOKES, IIRobert M. Beall, II Hansel E. Tookes, II
J. HYATT BROWN PAUL R. TREGURTHAJ. Hyatt Brown Paul R. Tregurtha
JAMES L. CAMAREN FRANK G. ZARBJames L. Camaren Frank G. Zarb
J. BRIAN FERGUSONJ. Brian Ferguson

100
FLORIDA POWER & LIGHT COMPANY SIGNATURES
Pursuant to the requirements of Section 13 or 15(d) of the Securities Exchange Act of 1934, the registrant has duly caused thisreport to be signed on its behalf by the undersigned, thereunto duly authorized.
Florida Power & Light Company
ARMANDO J. OLIVERAArmando J. OliveraPresident and Director
Date: February 22, 2006
Pursuant to the requirements of the Securities Exchange Act of 1934, this report has been signed below by the following personson behalf of the registrant and in the capacities and on the date indicated.
Signature and Title as of February 22, 2006:
LEWIS HAY, IIILewis Hay, IIIChairman of the Board, Chief Executive Officerand Director (Principal Executive Officer)
MORAY P. DEWHURSTMoray P. DewhurstSenior Vice President, Financeand Chief Financial Officer and Director(Principal Financial Officer)
K. MICHAEL DAVISK. Michael DavisVice President, Accounting,Controller and Chief Accounting Officer(Principal Accounting Officer)
Directors:
ANTONIO RODRIGUEZAntonio Rodriguez
JOHN A. STALLJohn A. Stall
EDWARD F. TANCEREdward F. Tancer

101
Exhibit 12(a)
FPL GROUP, INC. AND SUBSIDIARIESCOMPUTATION OF RATIO OF EARNINGS TO FIXED CHARGES AND
RATIO OF EARNINGS TO COMBINED FIXED CHARGES AND PREFERRED STOCK DIVIDENDS(a)
Years Ended December 31,2005 2004 2003 2002 2001
(millions of dollars)Earnings, as defined: Income before cumulative effect of changes in accounting principles $ 885 $ 887 $ 893 $ 695 $ 781 Preferred stock dividends of a consolidated subsidiary - (b) - (b) 13 15 15 Income taxes 272 267 368 244 379 Fixed charges included in the determination of net income, as below 609 505 397 328 337 Amortization of capitalized interest 11 8 4 2 1 Distributed income of equity method investees 86 83 68 96 62
124 94 89 76 81 Less: Equity in earnings of equity method investees$1,739 $1,656 $1,654 $1,304 $1,494 Total earnings, as defined
Fixed charges, as defined: Interest charges $ 593 $ 489 $ 379 $ 311 $ 324 Rental interest factor 16 16 17 14 8
- - 1 3 5 Fixed charges included in nuclear fuel cost Fixed charges included in the determination of net income 609 505 397 328 337 Capitalized interest 21 54 88 91 55 Dividend requirements on preferred stock of a consolidated subsidiary before income taxes - (b) - (b) 20 23 23
$ 630 $ 559 $ 505 $ 442 $ 415 Total fixed charges, as defined
Ratio of earnings to fixed charges and ratio of earnings to combined fixed charges and preferred stock dividends (a) 2.76 2.96 3.28 2.95 3.60_____________________(a) FPL Group, Inc. has no preference equity securities outstanding; therefore, the ratio of earnings to fixed charges is the same as the ratio of earnings to combined fixed
charges and preferred stock dividends.(b) A portion of Florida Power & Light Company’s preferred stock was owned by FPL Group, Inc. and was eliminated in consolidation. Accordingly, those dividends are not
included herein.
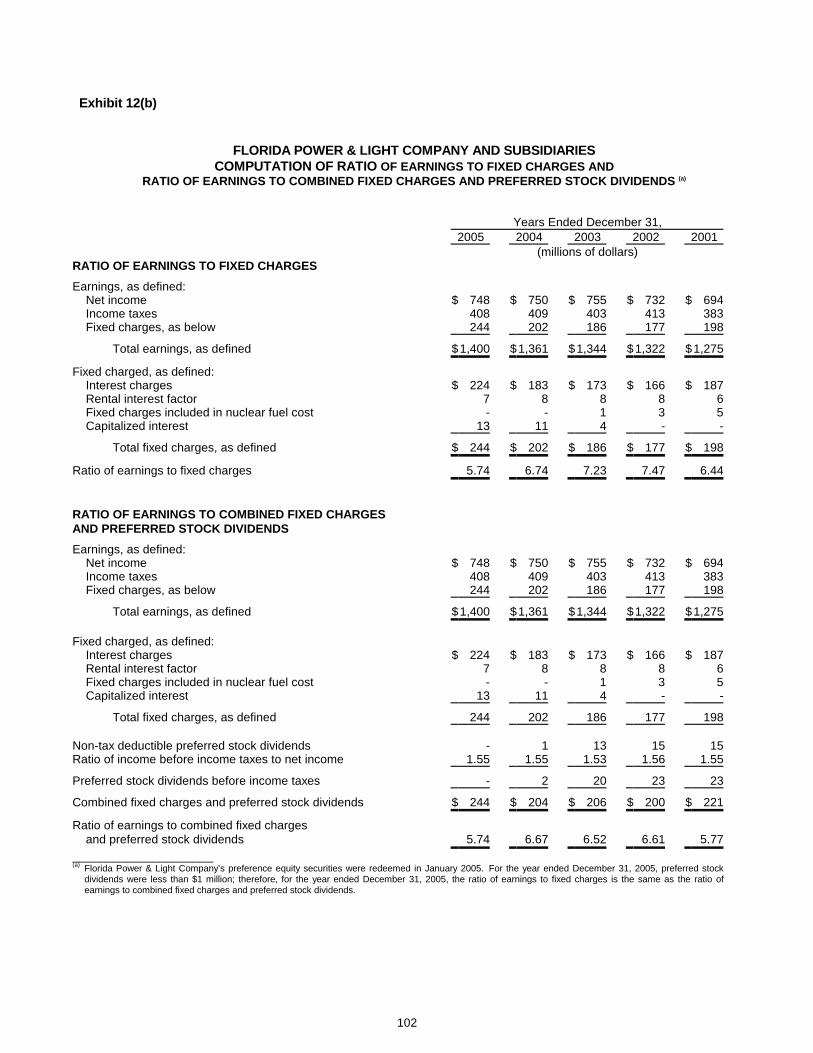
102
Exhibit 12(b)
FLORIDA POWER & LIGHT COMPANY AND SUBSIDIARIESCOMPUTATION OF RATIO OF EARNINGS TO FIXED CHARGES AND
RATIO OF EARNINGS TO COMBINED FIXED CHARGES AND PREFERRED STOCK DIVIDENDS (a)
Years Ended December 31,2005 2004 2003 2002 2001
(millions of dollars)RATIO OF EARNINGS TO FIXED CHARGES
Earnings, as defined: Net income $ 748 $ 750 $ 755 $ 732 $ 694 Income taxes 408 409 403 413 383
244 202 186 177 198 Fixed charges, as below
$1,400 $1,361 $1,344 $1,322 $1,275 Total earnings, as defined
Fixed charged, as defined: Interest charges $ 224 $ 183 $ 173 $ 166 $ 187 Rental interest factor 7 8 8 8 6 Fixed charges included in nuclear fuel cost - - 1 3 5
13 11 4 - - Capitalized interest
$ 244 $ 202 $ 186 $ 177 $ 198 Total fixed charges, as defined
5.74 6.74 7.23 7.47 6.44Ratio of earnings to fixed charges
RATIO OF EARNINGS TO COMBINED FIXED CHARGESAND PREFERRED STOCK DIVIDENDS
Earnings, as defined: Net income $ 748 $ 750 $ 755 $ 732 $ 694 Income taxes 408 409 403 413 383
244 202 186 177 198 Fixed charges, as below
$1,400 $1,361 $1,344 $1,322 $1,275 Total earnings, as defined
Fixed charged, as defined: Interest charges $ 224 $ 183 $ 173 $ 166 $ 187 Rental interest factor 7 8 8 8 6 Fixed charges included in nuclear fuel cost - - 1 3 5
13 11 4 - - Capitalized interest
244 202 186 177 198 Total fixed charges, as defined
Non-tax deductible preferred stock dividends - 1 13 15 151.55 1.55 1.53 1.56 1.55Ratio of income before income taxes to net income
- 2 20 23 23Preferred stock dividends before income taxes
$ 244 $ 204 $ 206 $ 200 $ 221Combined fixed charges and preferred stock dividends
Ratio of earnings to combined fixed charges5.74 6.67 6.52 6.61 5.77 and preferred stock dividends
_____________________(a) Florida Power & Light Company’s preference equity securities were redeemed in January 2005. For the year ended December 31, 2005, preferred stock
dividends were less than $1 million; therefore, for the year ended December 31, 2005, the ratio of earnings to fixed charges is the same as the ratio ofearnings to combined fixed charges and preferred stock dividends.

103
Exhibit 21
SUBSIDIARIES OF FPL GROUP, INC.
FPL Group Inc.’s principal subsidiaries as of December 31, 2005 are listed below. All other subsidiaries, if considered in theaggregate as a single subsidiary, would not constitute a significant subsidiary.
SubsidiaryState or Jurisdiction
of Incorporation
1. Florida Power & Light Company (100%-owned) Florida2. FPL Group Capital Inc (100%-owned) Florida3. FPL Energy, LLC (a) (b) Delaware4. Bay Loan and Investment Bank (b) Rhode Island5. Palms Insurance Company, Limited (b) Cayman Islands_____________________(a) Includes 322 subsidiaries that operate in the United States in the same line of business as FPL Energy, LLC(b) 100%-owned subsidiary of FPL Group Capital Inc

104
Exhibit 23
CONSENT OF INDEPENDENT REGISTERED PUBLIC ACCOUNTING FIRM
We consent to the incorporation by reference in the following Registration Statements of our report dated February 22, 2006,relating to the financial statements of FPL Group, Inc. and Florida Power & Light Company and our report dated February 22,2006 relating to management’s report on the effectiveness of internal control over financial reporting, appearing in this AnnualReport on Form 10-K of FPL Group, Inc. and Florida Power & Light Company for the year ended December 31, 2005:
FPL Group, Inc.Form S-8 No. 33-57673Form S-8 No. 33-11631Form S-3 No. 33-57470Form S-8 No. 333-27079Form S-8 No. 333-88067Form S-3 No. 333-102169Form S-3 No. 333-102173Form S-8 No. 333-114911Form S-3 No. 333-116209Form S-8 No. 333-116501Form S-3 No. 333-125275Form S-8 No. 333-125954Form S-3 No. 333-129482Form S-8 No. 333-130479
FPL Group Trust IForm S-3 No. 333-116209-02
FPL Group Trust IIForm S-3 No. 333-116209-01
Florida Power & Light CompanyForm S-3 No. 33-40123
FPL Group Capital IncForm S-3 No. 333-102173-01Form S-3 No. 333-116209-05
FPL Group Capital Trust IIForm S-3 No. 333-102173-02Form S-3 No. 333-116209-04
FPL Group Capital Trust IIIForm S-3 No. 333-116209-03
DELOITTE & TOUCHE LLP
Miami, FloridaFebruary 22, 2006

105
Exhibit 31(a)
Rule 13a-14(a)/15d-14(a) Certification
I, Lewis Hay, III, certify that:
1. I have reviewed the annual report on Form 10-K for the year ended December 31, 2005 of FPL Group, Inc. (theregistrant);
2. Based on my knowledge, this report does not contain any untrue statement of a material fact or omit to state a materialfact necessary to make the statements made, in light of the circumstances under which such statements were made,not misleading with respect to the period covered by this report;
3. Based on my knowledge, the financial statements, and other financial information included in this report, fairly presentin all material respects the financial condition, results of operations and cash flows of the registrant as of, and for, theperiods presented in this report;
4. The registrant’s other certifying officer and I are responsible for establishing and maintaining disclosure controls andprocedures (as defined in Exchange Act Rules 13a-15(e) and 15d-15(e)) and internal control over financial reporting(as defined in Exchange Act Rules 13a-15(f) and 15d-15(f)) for the registrant and have:
a) Designed such disclosure controls and procedures, or caused such disclosure controls and procedures to bedesigned under our supervision, to ensure that material information relating to the registrant, including itsconsolidated subsidiaries, is made known to us by others within those entities, particularly during the period inwhich this report is being prepared;
b) Designed such internal control over financial reporting, or caused such internal control over financial reporting tobe designed under our supervision, to provide reasonable assurance regarding the reliability of financialreporting and the preparation of financial statements for external purposes in accordance with generallyaccepted accounting principles;
c) Evaluated the effectiveness of the registrant’s disclosure controls and procedures and presented in this reportour conclusions about the effectiveness of the disclosure controls and procedures, as of the end of the periodcovered by this report based on such evaluation; and
d) Disclosed in this report any change in the registrant’s internal control over financial reporting that occurred duringthe registrant’s most recent fiscal quarter (the registrant’s fourth fiscal quarter in the case of an annual report)that has materially affected, or is reasonably likely to materially affect, the registrant’s internal control overfinancial reporting; and
5. The registrant’s other certifying officer and I have disclosed, based on our most recent evaluation of internal controlover financial reporting, to the registrant’s auditors and the audit committee of the registrant’s board of directors (orpersons performing the equivalent functions):
a) All significant deficiencies and material weaknesses in the design or operation of internal control over financialreporting which are reasonably likely to adversely affect the registrant’s ability to record, process, summarize andreport financial information; and
b) Any fraud, whether or not material, that involves management or other employees who have a significant role inthe registrant’s internal control over financial reporting.
Date: February 23, 2006
LEWIS HAY, IIILewis Hay, III
Chairman of the Board, Presidentand Chief Executive Officer
of FPL Group, Inc.

106
Exhibit 31(b)
Rule 13a-14(a)/15d-14(a) Certification
I, Moray P. Dewhurst, certify that:
1. I have reviewed the annual report on Form 10-K for the year ended December 31, 2005 of FPL Group, Inc. (theregistrant);
2. Based on my knowledge, this report does not contain any untrue statement of a material fact or omit to state a materialfact necessary to make the statements made, in light of the circumstances under which such statements were made,not misleading with respect to the period covered by this report;
3. Based on my knowledge, the financial statements, and other financial information included in this report, fairly presentin all material respects the financial condition, results of operations and cash flows of the registrant as of, and for, theperiods presented in this report;
4. The registrant’s other certifying officer and I are responsible for establishing and maintaining disclosure controls andprocedures (as defined in Exchange Act Rules 13a-15(e) and 15d-15(e)) and internal control over financial reporting(as defined in Exchange Act Rules 13a-15(f) and 15d-15(f)) for the registrant and have:
a) Designed such disclosure controls and procedures, or caused such disclosure controls and procedures to bedesigned under our supervision, to ensure that material information relating to the registrant, including itsconsolidated subsidiaries, is made known to us by others within those entities, particularly during the period inwhich this report is being prepared;
b) Designed such internal control over financial reporting, or caused such internal control over financial reporting tobe designed under our supervision, to provide reasonable assurance regarding the reliability of financialreporting and the preparation of financial statements for external purposes in accordance with generallyaccepted accounting principles;
c) Evaluated the effectiveness of the registrant’s disclosure controls and procedures and presented in this reportour conclusions about the effectiveness of the disclosure controls and procedures, as of the end of the periodcovered by this report based on such evaluation; and
d) Disclosed in this report any change in the registrant’s internal control over financial reporting that occurred duringthe registrant’s most recent fiscal quarter (the registrant’s fourth fiscal quarter in the case of an annual report)that has materially affected, or is reasonably likely to materially affect, the registrant’s internal control overfinancial reporting; and
5. The registrant’s other certifying officer and I have disclosed, based on our most recent evaluation of internal controlover financial reporting, to the registrant’s auditors and the audit committee of the registrant’s board of directors (orpersons performing the equivalent functions):
a) All significant deficiencies and material weaknesses in the design or operation of internal control over financialreporting which are reasonably likely to adversely affect the registrant’s ability to record, process, summarize andreport financial information; and
b) Any fraud, whether or not material, that involves management or other employees who have a significant role inthe registrant’s internal control over financial reporting.
Date: February 23, 2006
MORAY P. DEWHURSTMoray P. Dewhurst
Vice President, Financeand Chief Financial Officer
of FPL Group, Inc.

107
Exhibit 31(c)
Rule 13a-14(a)/15d-14(a) Certification
I, Lewis Hay, III, certify that:
1. I have reviewed the annual report on Form 10-K for the year ended December 31, 2005 of Florida Power & LightCompany (the registrant);
2. Based on my knowledge, this report does not contain any untrue statement of a material fact or omit to state a materialfact necessary to make the statements made, in light of the circumstances under which such statements were made,not misleading with respect to the period covered by this report;
3. Based on my knowledge, the financial statements, and other financial information included in this report, fairly presentin all material respects the financial condition, results of operations and cash flows of the registrant as of, and for, theperiods presented in this report;
4. The registrant’s other certifying officer and I are responsible for establishing and maintaining disclosure controls andprocedures (as defined in Exchange Act Rules 13a-15(e) and 15d-15(e)) and internal control over financial reporting(as defined in Exchange Act Rules 13a-15(f) and 15d-15(f)) for the registrant and have:
a) Designed such disclosure controls and procedures, or caused such disclosure controls and procedures to bedesigned under our supervision, to ensure that material information relating to the registrant, including itsconsolidated subsidiaries, is made known to us by others within those entities, particularly during the period inwhich this report is being prepared;
b) Designed such internal control over financial reporting, or caused such internal control over financial reporting tobe designed under our supervision, to provide reasonable assurance regarding the reliability of financialreporting and the preparation of financial statements for external purposes in accordance with generallyaccepted accounting principles;
c) Evaluated the effectiveness of the registrant’s disclosure controls and procedures and presented in this reportour conclusions about the effectiveness of the disclosure controls and procedures, as of the end of the periodcovered by this report based on such evaluation; and
d) Disclosed in this report any change in the registrant’s internal control over financial reporting that occurred duringthe registrant’s most recent fiscal quarter (the registrant’s fourth fiscal quarter in the case of an annual report)that has materially affected, or is reasonably likely to materially affect, the registrant’s internal control overfinancial reporting; and
5. The registrant’s other certifying officer and I have disclosed, based on our most recent evaluation of internal controlover financial reporting, to the registrant’s auditors and the audit committee of the registrant’s board of directors (orpersons performing the equivalent functions):
a) All significant deficiencies and material weaknesses in the design or operation of internal control over financialreporting which are reasonably likely to adversely affect the registrant’s ability to record, process, summarize andreport financial information; and
b) Any fraud, whether or not material, that involves management or other employees who have a significant role inthe registrant’s internal control over financial reporting.
Date: February 23, 2006
LEWIS HAY, IIILewis Hay, III
Chairman of the Boardand Chief Executive Officer
of Florida Power & Light Company

108
Exhibit 31(d)
Rule 13a-14(a)/15d-14(a) Certification
I, Moray P. Dewhurst, certify that:
1. I have reviewed the annual report on Form 10-K for the year ended December 31, 2005 of Florida Power & LightCompany (the registrant);
2. Based on my knowledge, this report does not contain any untrue statement of a material fact or omit to state a materialfact necessary to make the statements made, in light of the circumstances under which such statements were made,not misleading with respect to the period covered by this report;
3. Based on my knowledge, the financial statements, and other financial information included in this report, fairly presentin all material respects the financial condition, results of operations and cash flows of the registrant as of, and for, theperiods presented in this report;
4. The registrant’s other certifying officer and I are responsible for establishing and maintaining disclosure controls andprocedures (as defined in Exchange Act Rules 13a-15(e) and 15d-15(e)) and internal control over financial reporting(as defined in Exchange Act Rules 13a-15(f) and 15d-15(f)) for the registrant and have:
a) Designed such disclosure controls and procedures, or caused such disclosure controls and procedures tobe designed under our supervision, to ensure that material information relating to the registrant, including itsconsolidated subsidiaries, is made known to us by others within those entities, particularly during the periodin which this report is being prepared;
b) Designed such internal control over financial reporting, or caused such internal control over financialreporting to be designed under our supervision, to provide reasonable assurance regarding the reliability offinancial reporting and the preparation of financial statements for external purposes in accordance withgenerally accepted accounting principles;
c) Evaluated the effectiveness of the registrant’s disclosure controls and procedures and presented in thisreport our conclusions about the effectiveness of the disclosure controls and procedures, as of the end ofthe period covered by this report based on such evaluation; and
d) Disclosed in this report any change in the registrant’s internal control over financial reporting that occurredduring the registrant’s most recent fiscal quarter (the registrant’s fourth fiscal quarter in the case of anannual report) that has materially affected, or is reasonably likely to materially affect, the registrant’s internalcontrol over financial reporting; and
5. The registrant’s other certifying officer and I have disclosed, based on our most recent evaluation of internal controlover financial reporting, to the registrant’s auditors and the audit committee of the registrant’s board of directors (orpersons performing the equivalent functions):
a) All significant deficiencies and material weaknesses in the design or operation of internal control overfinancial reporting which are reasonably likely to adversely affect the registrant’s ability to record, process,summarize and report financial information; and
b) Any fraud, whether or not material, that involves management or other employees who have a significantrole in the registrant’s internal control over financial reporting.
Date: February 23, 2006
MORAY P. DEWHURSTMoray P. Dewhurst
Senior Vice President, Financeand Chief Financial Officer
of Florida Power & Light Company

109
Exhibit 32(a)
Section 1350 Certification
We, Lewis Hay, III and Moray P. Dewhurst, certify, pursuant to Section 906 of the Sarbanes-Oxley Act of 2002, that:
(1) The Annual Report on Form 10-K of FPL Group, Inc. (FPL Group) for the year ended December 31, 2005 (Report)fully complies with the requirements of Section 13(a) or 15(d) of the Securities Exchange Act of 1934; and
(2) The information contained in the Report fairly presents, in all material respects, the financial condition and resultsof operations of FPL Group.
Dated: February 23, 2006
LEWIS HAY, IIILewis Hay, III
Chairman of the Board, Presidentand Chief Executive Officer of FPL Group, Inc.
MORAY P. DEWHURSTMoray P. Dewhurst
Vice President, Financeand Chief Financial Officer of FPL Group, Inc.
A signed original of this written statement required by Section 906 has been provided to FPL Group and will beretained by FPL Group and furnished to the Securities and Exchange Commission or its staff upon request.
The foregoing certification is being furnished as an exhibit to the Report pursuant to Item 601(b)(32) of Regulation S-Kand Section 906 of the Sarbanes-Oxley Act of 2002 and, accordingly, is not being filed with the Securities andExchange Commission as part of the Report and is not to be incorporated by reference into any filing of FPL Groupunder the Securities Act of 1933 or the Securities Exchange Act of 1934 (whether made before or after the date of theReport, irrespective of any general incorporation language contained in such filing).

110
Exhibit 32(b)
Section 1350 Certification
We, Lewis Hay, III and Moray P. Dewhurst, certify, pursuant to Section 906 of the Sarbanes-Oxley Act of 2002, that:
(1) The Annual Report on Form 10-K of Florida Power & Light Company (FPL) for the year ended December 31, 2005(Report) fully complies with the requirements of Section 13(a) or 15(d) of the Securities Exchange Act of 1934;and
(2) The information contained in the Report fairly presents, in all material respects, the financial condition and resultsof operations of FPL.
Dated: February 23, 2006
LEWIS HAY, IIILewis Hay, III
Chairman of the Boardand Chief Executive Officer of
Florida Power & Light Company
MORAY P. DEWHURSTMoray P. Dewhurst
Senior Vice President, Financeand Chief Financial Officer of
Florida Power & Light Company
A signed original of this written statement required by Section 906 has been provided to FPL and will be retained byFPL and furnished to the Securities and Exchange Commission or its staff upon request.
The foregoing certification is being furnished as an exhibit to the Report pursuant to Item 601(b)(32) of Regulation S-Kand Section 906 of the Sarbanes-Oxley Act of 2002 and, accordingly, is not being filed with the Securities andExchange Commission as part of the Report and is not to be incorporated by reference into any filing of FPL under theSecurities Act of 1933 or the Securities Exchange Act of 1934 (whether made before or after the date of the Report,irrespective of any general incorporation language contained in such filing).

Board of Directors
FPL GROUP, INC.Lewis Hay, IIIChairman, President andChief Executive Officer
Moray P. DewhurstVice President, Finance andChief Financial Officer
Edward F. TancerVice President & GeneralCounsel
James L. RoboVice President, CorporateDevelopment and Strategy
Robert H. EscotoVice President, HumanResources
Paul I. CutlerTreasurer
K. Michael Davis Controller and ChiefAccounting Officer
James P. HigginsVice President, Tax
Robert L. McGrathVice President, Engineering,Construction & CorporateServices
Mary Lou KromerVice President, Marketing &Communications
Alissa E. BallotVice President & Corporate Secretary
FLORIDA POWER &LIGHT COMPANYLewis Hay, IIIChairman and Chief Executive Officer
Armando J. OliveraPresident
Moray P. DewhurstSenior Vice President,Finance and Chief Financial Officer
Edward F. TancerSenior Vice President & General Counsel
Robert H. EscotoSenior Vice President, Human Resources
Robert L. McGrathSenior Vice President,Engineering, Construction & Corporate Services
Antonio RodriguezSenior Vice President, Power Generation Division
John A. StallSenior Vice President,Nuclear Division
FPL ENERGY, LLC Lewis Hay, IIIChief Executive Officer
James L. RoboPresident
Michael L. LeightonSenior Vice President and Chief Operating Officer
Mark MaistoPresident, Power Marketing, Inc.
Mitch DavidsonSenior Vice President, Business Management
Michael O’SullivanSenior Vice President,Development
Mark R. SorensenVice President, Finance and Chief Financial Officer
TJ TuscaiPresident,GEXA Energy GP, LLC
FPL FIBERNET, LLCMark IanniPresident
COMMUNICATIONS WITH THE BOARD: Shareholders may communicatedirectly with any of the company’s directors, including the presiding director,by writing to them c/o FPL Group, Inc., P.O. Box 14000, Juno Beach, FL33408-0420. Communications intended for the non-management direc-tors should be directed to the presiding director. Employees and others whowish to contact the board or any member of the audit committee to reportcomplaints or concerns with respect to accounting, internal accountingcontrols or auditing matters, may do so anonymously using this address.
Officers
H. JESSE ARNELLERetired. Formerly of Counsel,Womble, Carlyle, Sandridge &Rice (law firm) Director since1990. Member finance &investment committee, gover-nance & nominating committee.
SHERRY S. BARRATPresident, Personal FinancialServices, The Northern TrustCompany (banking corporation)Director since 1998. Chairmancompensation committee.Member governance & nominating committee, executive committee.
ROBERT M. BEALL, IIChairman and Chief ExecutiveOfficer, Beall’s, Inc. (depart-ment stores) Director since1989. Chairman audit commit-tee. Member governance & nominating committee, executive committee.
J. HYATT BROWNChairman and Chief ExecutiveOfficer, Brown & Brown, Inc. (insurance broker) Directorsince 1989. Member auditcommittee, governance &nominating committee.
JAMES L. CAMARENChairman and Chief ExecutiveOfficer, Utilities, Inc. (water utilities) Director since 2002.Member compensation com-mittee, finance & investmentcommittee, governance &nominating committee.
J. BRIAN FERGUSON Chairman and Chief ExecutiveOfficer, Eastman ChemicalCompany (chemical company)Director since July 2005. Membercompensation committee.
LEWIS HAY, IIIChairman, President and ChiefExecutive Officer, FPL Group, Inc.Director since 2001. Chairmanexecutive committee.
RUDY E. SCHUPPPresident and Chief ExecutiveOfficer, 1st United Bank, and Chief Executive Officer, 1st United Bancorp, Inc. (commercial bank) Directorsince March 2005. Memberaudit committee.
MICHAEL H. THAMANChairman and Chief FinancialOfficer, Owens Corning (manufacturer) Director since 2003. Member finance & investment committee, auditcommittee, compensationcommittee.
HANSEL E. TOOKES, IIRetired. Formerly President,Raytheon International (defenseand aerospace systems) Directorsince March 2005. Memberfinance & investment committee.
PAUL R. TREGURTHAChairman and Chief ExecutiveOfficer, Mormac Marine Group,Inc. (maritime shipping com-pany) Director since 1989.Chairman governance & nomi-nating committee. Membercompensation committee,finance & investment commit-tee, executive committee.
FRANK G. ZARBChairman, Frank ZarbAssociates, LLC (consultingfirm to the financial industry)Formerly Chairman and ChiefExecutive Officer, NationalAssociation of Securities Dealers,Inc. (NASD) Director since2002. Chairman finance &investment committee.Member audit committee,executive committee.

CORPORATE OFFICESFPL Group, Inc.700 Universe Blvd.Juno Beach, FL 33408-0420
EXCHANGE LISTINGCommon StockNew York Stock ExchangeTicker Symbol: FPL5 7/8% Preferred Trust SecuritiesNew York Stock ExchangeTicker Symbol: FPL PRC
NEWSPAPER LISTINGCommon Stock: FPL Gp5 7/8% Preferred Trust Securities: FPL Gp Trups
REGISTRAR, TRANSFER AND PAYING AGENTSFPL Group Common StockFPL Group, Inc.c/o Computershare Investor Services2 N. LaSalle StreetChicago, IL 60602(888) 218-4392
Florida Power & Light CompanyFirst Mortgage BondsDeutsche Bank Trust Co. AmericaCorporate Trust & Agency Group648 Grassmere Park RoadNashville, TN 37211(800) 735-7777
FPL Group Capital Trust I Preferred Trust Securities
FPL Group Capital DebenturesBank of New YorkCorporate Trust Operations111 Sanders Creek ParkwayEast Syracuse, NY 13057(800) 254-2826
CERTIFICATIONSFPL Group has included as Exhibits 31(a) and(b) to its Annual Report on Form 10-K for thefiscal year ended December 31, 2005 filedwith the Securities and Exchange Commissioncertifications of the chief executive officer andchief financial officer of FPL Group certifyingthe quality of FPL Group’s public disclosure,and FPL Group has submitted to the NewYork Stock Exchange a certificate of the chiefexecutive officer of FPL Group certifying thathe is not aware of any violation by FPL Groupof New York Stock Exchange corporate gover-nance listing standards.
SHAREHOLDER INQUIRIESCommunications concerning transfer
requirements, lost certificates, dividend
checks, address changes, stock accounts
and the dividend reinvestment plan should
be directed to Computershare: (888) 218-4392 or www.computershare.com
Other shareholder communications to:Shareholder Services (800) 222-4511 or(561) 694-4694, (561) 694-4718 (Fax)
ANNUAL MEETINGGenerally held in May, the annual meeting of shareholders in 2006 will be scheduledlater this year and is expected to include aproposal relating to shareholder approval of the pending merger with ConstellationEnergy Group, Inc.
ELECTRONIC PROXY MATERIALRegistered shareholders may receive proxymaterials electronically by accessingwww.computershare.com/us/sc/fpl. Beneficialshareholders should contact their brokeragefirm to determine the availability of electronicproxy material distribution.
DUPLICATE MAILINGSFinancial reports must be mailed to eachaccount unless you instruct us otherwise. Ifyou wish to discontinue multiple mailings toyour address, please call Computershare.
DIRECT DEPOSIT OF DIVIDENDSCash dividends may be deposited directly topersonal accounts at financial institutions.Call Computershare for authorization forms.
DIVIDEND REINVESTMENT PLANFPL Group offers a plan for holders of common stock to reinvest their dividends or make optional cash payments for the purchase of additional common stock.Enrollment materials may be obtained by calling Computershare or by accessingwww.computershare.com. The table belowshows the dates during which optional cashpayments can be made.
ONLINE INVESTOR INFORMATIONVisit our investor information site atwww.fplgroup.com/investors to get stockquotes, earnings reports, financial releases,SEC filings and other news. You can alsorequest and receive information via e-mail.Shareholders of record can receive secureonline account access through a link to ourtransfer agent, Computershare.
SEC FILINGSAll Securities and Exchange Commission filings appear on our Web site atwww.fplgroup.com/investors. Copies of SECfilings also are available without charge bywriting to FPL Group, Shareholder Services.
NEWS AND FINANCIAL INFORMATIONGet the latest news and financial informationabout FPL Group by calling (866) FPL-NEWS.Besides hearing recorded announcements,you can request information to be sent via fax or mail.
ANALYST INQUIRIESInvestor Relations (561) 694-4697 (561) 694-4718 (Fax)
NEWS MEDIA INQUIRIESMedia Relations (305) 552-3888(305) 552-2144 (Fax)
CERTIFIED PUBLIC ACCOUNTANTSDeloitte & Touche LLP200 S. Biscayne Boulevard, Suite 400Miami, FL 33131-2310
Investor Information
Proposed 2006 Common Stock Dividend Dates*Declaration Ex-Dividend Record Payment
February 17 March 3 March 7 March 15May 26 June 7 June 9 June 15August 4 August 23 August 25 September 15October 13 November 21 November 24 December 15
Optional Cash Payment Dates*Qtr./Yr. Acceptance begins Must be received by
2nd/06 May 16 June 83rd/06 August 16 September 84th/06 November 15 December 8
*Declaration of dividends and dates shown are subject to the discretion of the board of directors of FPL Group. Dates shown are based on the assumption that past patterns will prevail.