Powering Cellular Networks with Renewable Energy...
50
Powering Cellular Networks with Renewable Energy Sources Marco Ajmone Marsan Politecnico di Torino, Italy IMDEA Networks Institute, Spain
Transcript of Powering Cellular Networks with Renewable Energy...
Powering Cellular Networks with
Renewable Energy Sources
Marco Ajmone Marsan Politecnico di Torino, Italy
IMDEA Networks Institute, Spain
Powering Cellular Networks with
Renewable Energy Sources
joint work with
Michela Meo, Raffaella Gerboni, Yi Zhang
The Problem
Energy is becoming the issue of our future
o Energy production with fossil fuels causes GHG
emissions which produce climate changes
o Energy is becoming expensive
Energy efficiency is a goal in all sectors,
ICT and networking included
Marco Ajmone Marsan 3
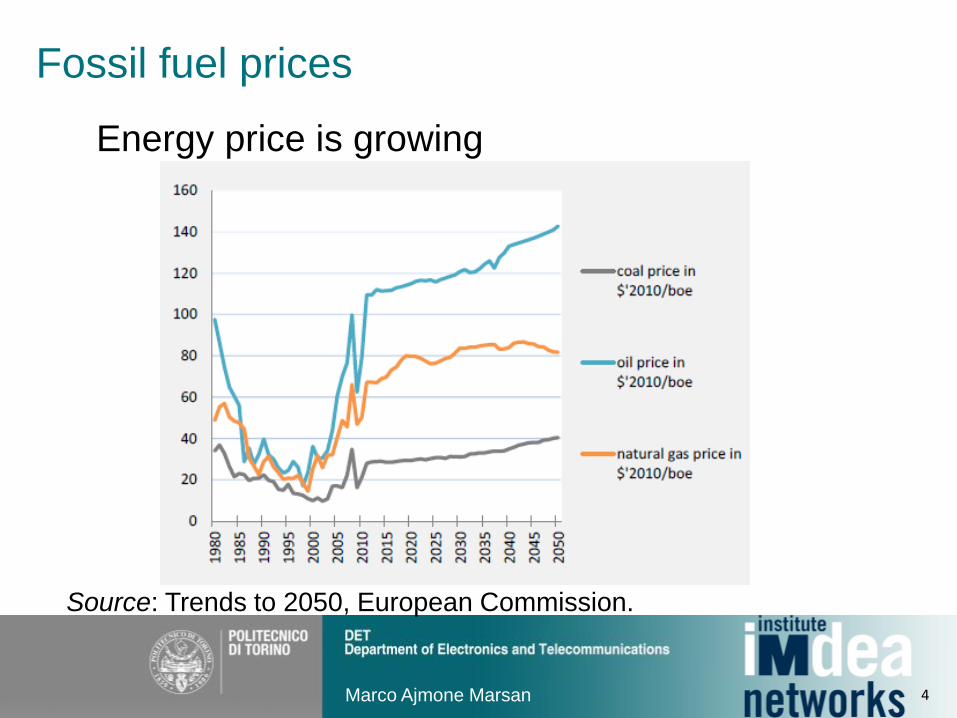
Fossil fuel prices
Marco Ajmone Marsan
Source: Trends to 2050, European Commission.
Energy price is growing
4
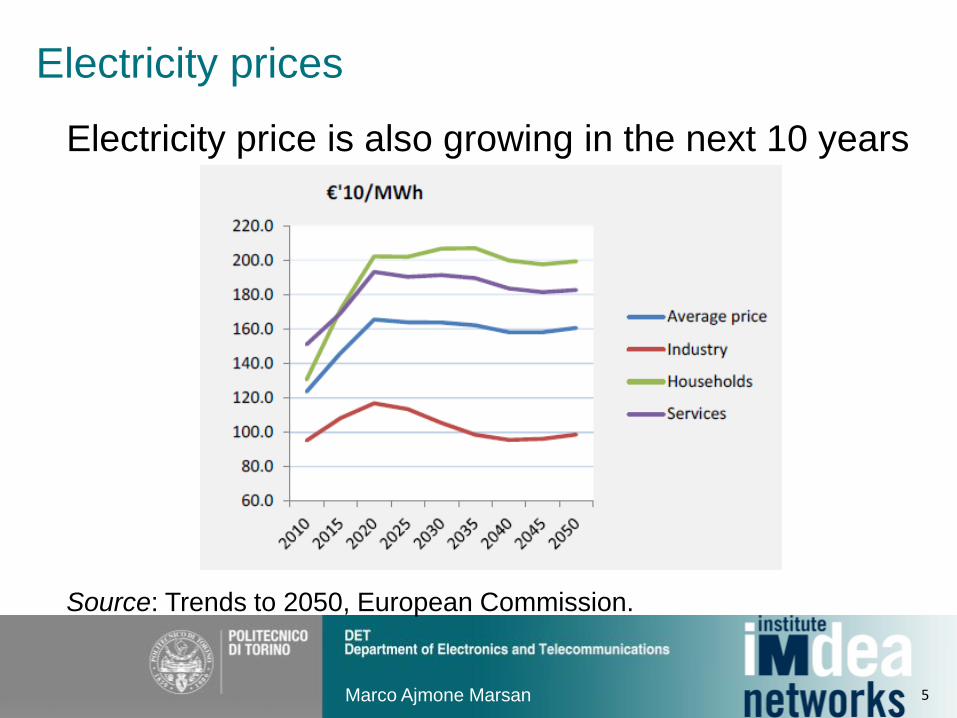
Electricity prices
Marco Ajmone Marsan
Source: Trends to 2050, European Commission.
Electricity price is also growing in the next 10 years
5
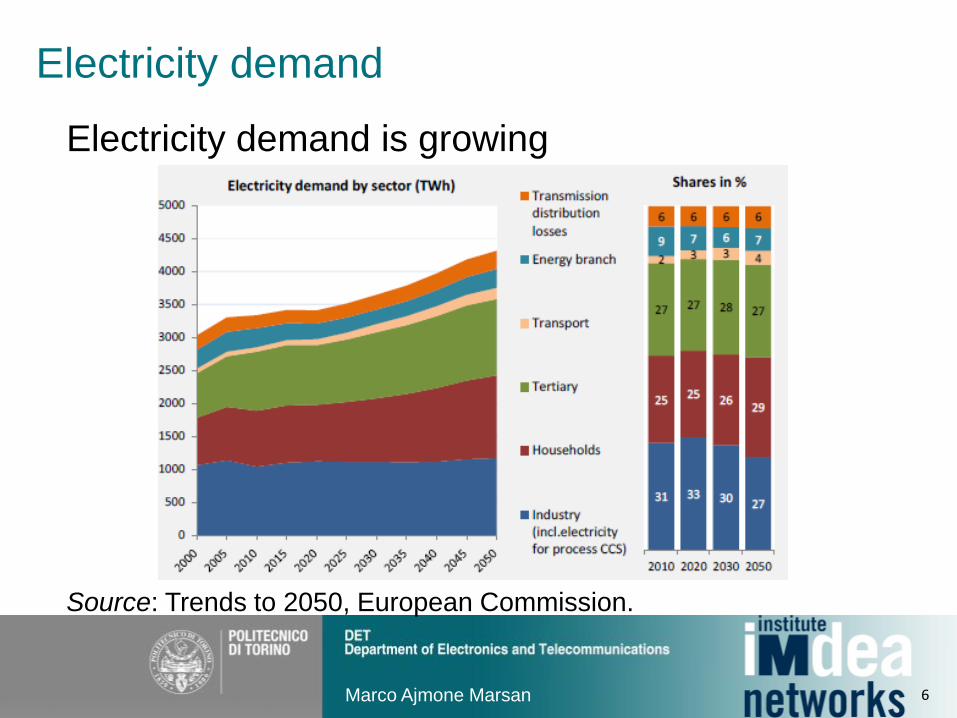
Electricity demand
Marco Ajmone Marsan
Source: Trends to 2050, European Commission.
Electricity demand is growing
6
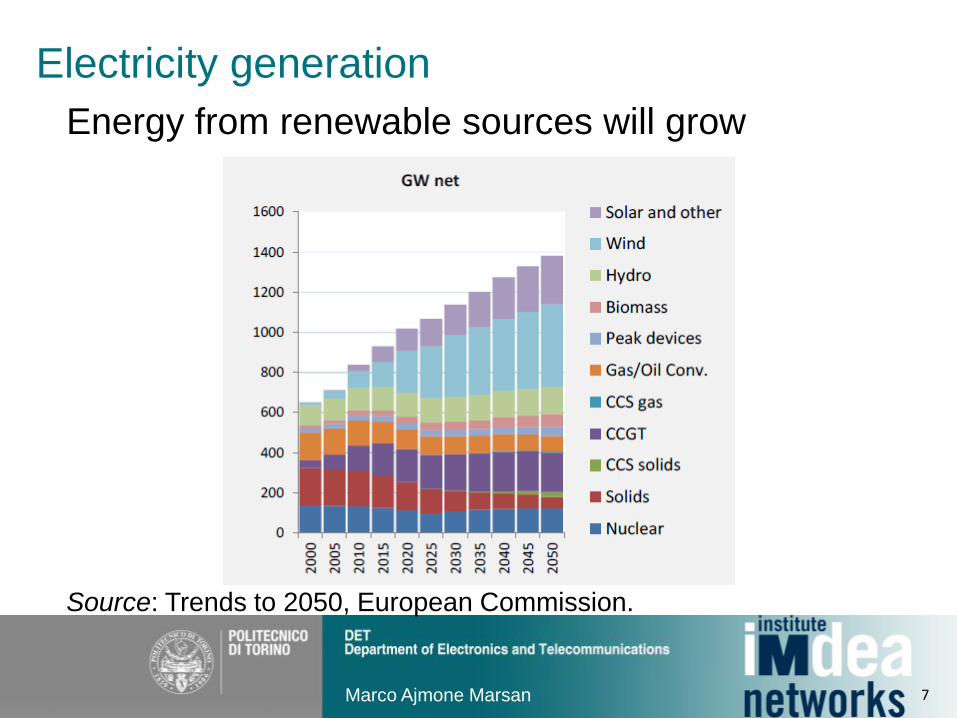
Electricity generation
Marco Ajmone Marsan
Source: Trends to 2050, European Commission.
Energy from renewable sources will grow
7

Information and Communication Technologies
(ICT) play a positive role for energy efficiency:
– moving bits instead of atoms
• intelligent transport systems
• teleworking and telecommuting
• e-commerce
• electronic billing
– new manufacturing systems
– sensors to monitor and manage our environment
• smart buildings, neighborhoods, cities …
What about ICT?
Marco Ajmone Marsan 8
ICT will allow savings of the order of
– 25-30% in manufacturing
– 20-30% in transport
– 5-15% in buildings
for a total of about 17-22%
Moreover, ICT is expected to significantly improve the
energy generation, transport and utilization through the
adoption of Smart Grids
Source: Ad-hoc Advisory Group “ICT for Energy Efficiency” of the European
Commission DG INFSO, 2008.
Marco Ajmone Marsan
What about ICT?
9
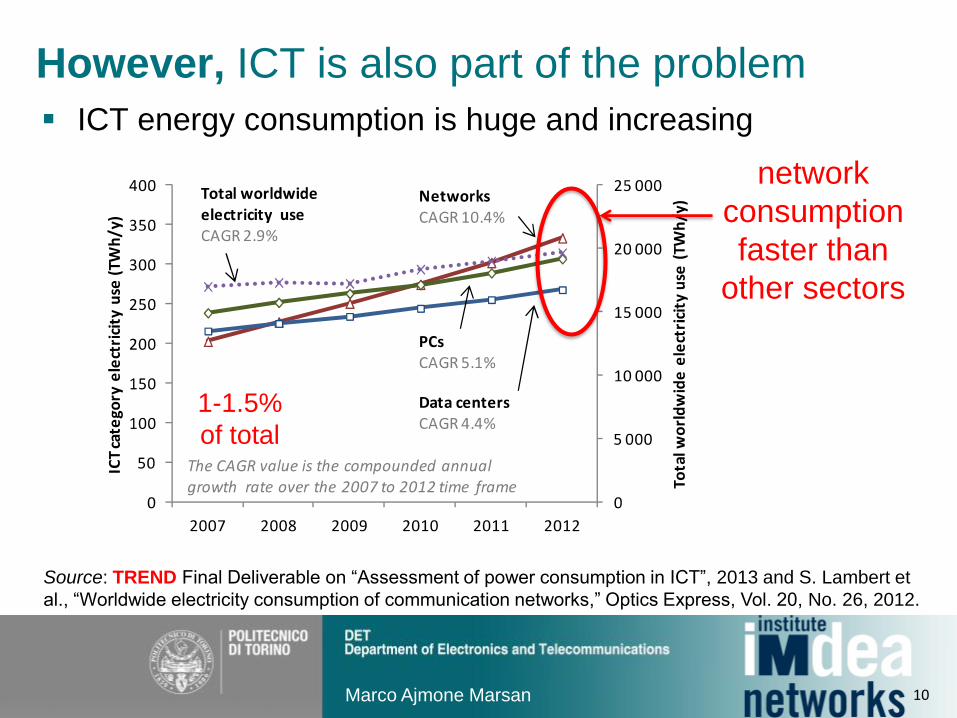
However, ICT is also part of the problem
ICT energy consumption is huge and increasing
Marco Ajmone Marsan
Source: TREND Final Deliverable on “Assessment of power consumption in ICT”, 2013 and S. Lambert et
al., “Worldwide electricity consumption of communication networks,” Optics Express, Vol. 20, No. 26, 2012.
network
consumption
faster than
other sectors
1-1.5%
of total
10

Traffic growth
Source: Cisco VNI, 2014.
number of
devices grows
(new markets)
new and more
traffic intensive
services
Marco Ajmone Marsan Marco Ajmone Marsan 11
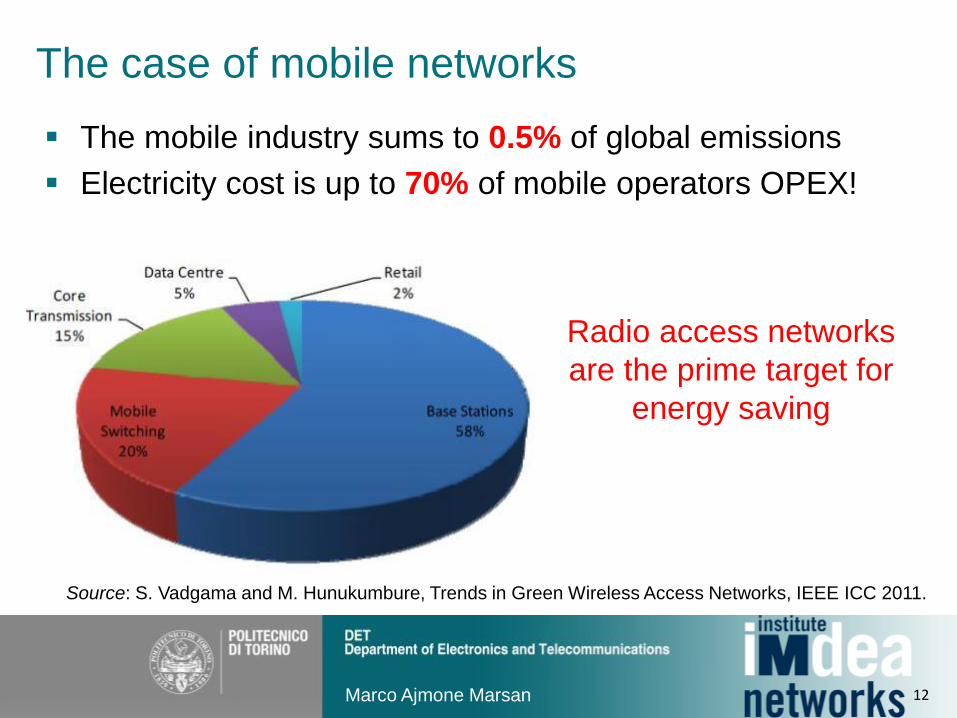
The case of mobile networks
The mobile industry sums to 0.5% of global emissions
Electricity cost is up to 70% of mobile operators OPEX!
Radio access networks
are the prime target for
energy saving
Marco Ajmone Marsan
Source: S. Vadgama and M. Hunukumbure, Trends in Green Wireless Access Networks, IEEE ICC 2011.
12
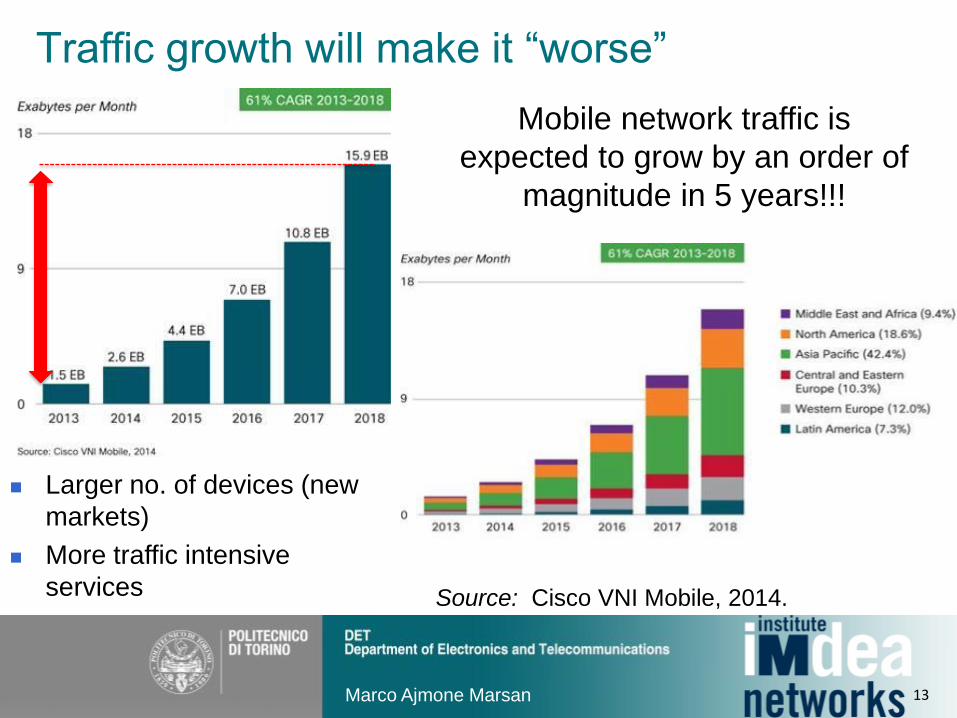
Traffic growth will make it “worse”
Source: Cisco VNI Mobile, 2014.
Mobile network traffic is
expected to grow by an order of
magnitude in 5 years!!!
Larger no. of devices (new
markets)
More traffic intensive
services
Marco Ajmone Marsan 13
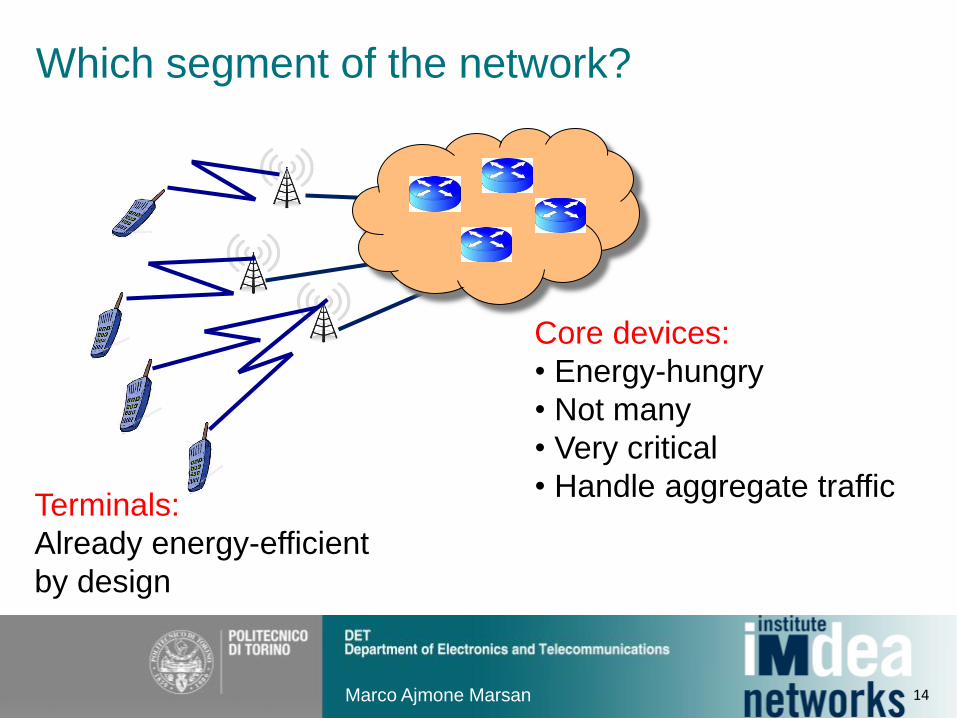
Which segment of the network?
Terminals:
Already energy-efficient
by design
Core devices:
• Energy-hungry
• Not many
• Very critical
• Handle aggregate traffic
Marco Ajmone Marsan 14

Which segment of the network?
Access network:
• Energy-hungry
• Many devices
• Some redundancy
• Less critical than core devices
• Very close to the user, hence high
traffic variability
Marco Ajmone Marsan 15
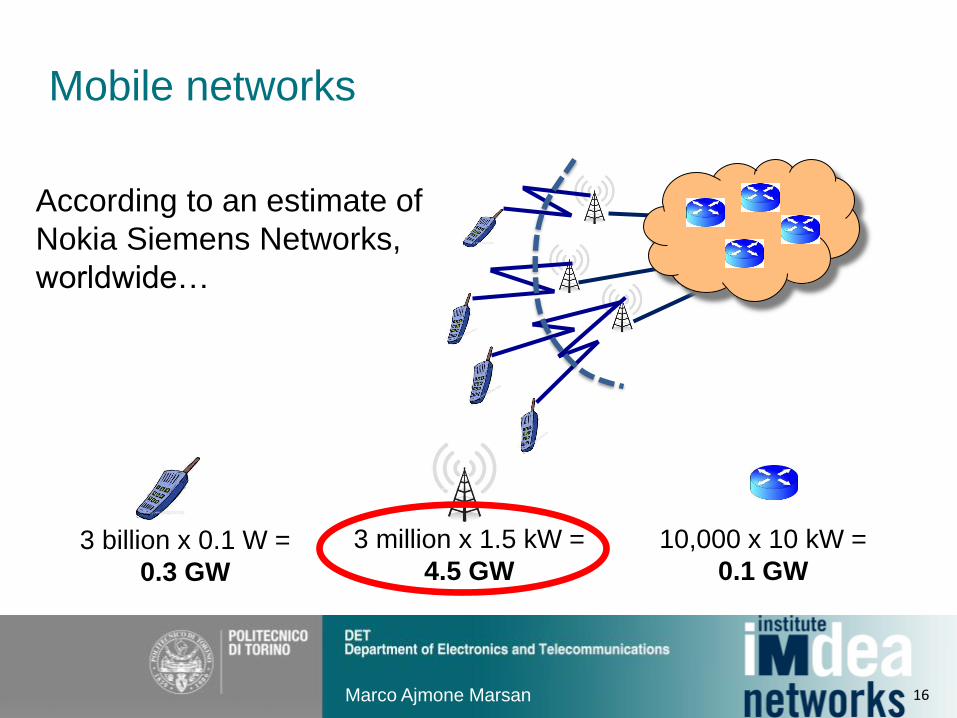
Mobile networks
3 billion x 0.1 W =
0.3 GW
3 million x 1.5 kW =
4.5 GW
10,000 x 10 kW =
0.1 GW
According to an estimate of
Nokia Siemens Networks,
worldwide…
Marco Ajmone Marsan 16
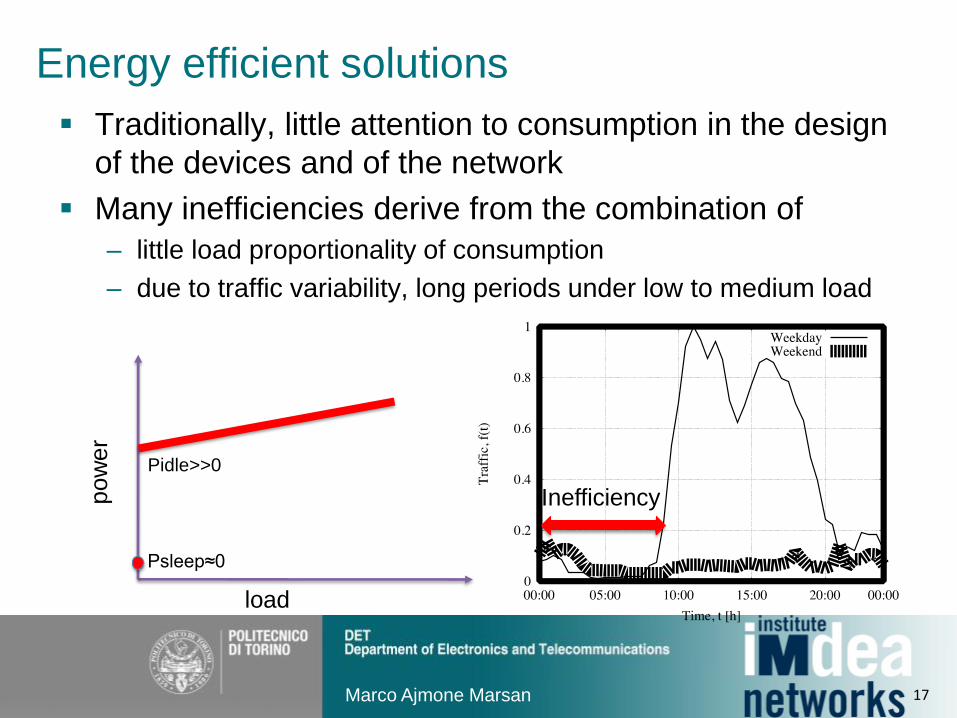
Energy efficient solutions
Traditionally, little attention to consumption in the design
of the devices and of the network
Many inefficiencies derive from the combination of
– little load proportionality of consumption
– due to traffic variability, long periods under low to medium load
Marco Ajmone Marsan
Inefficiency
Pidle>>0
Psleep≈0
load
pow
er
17
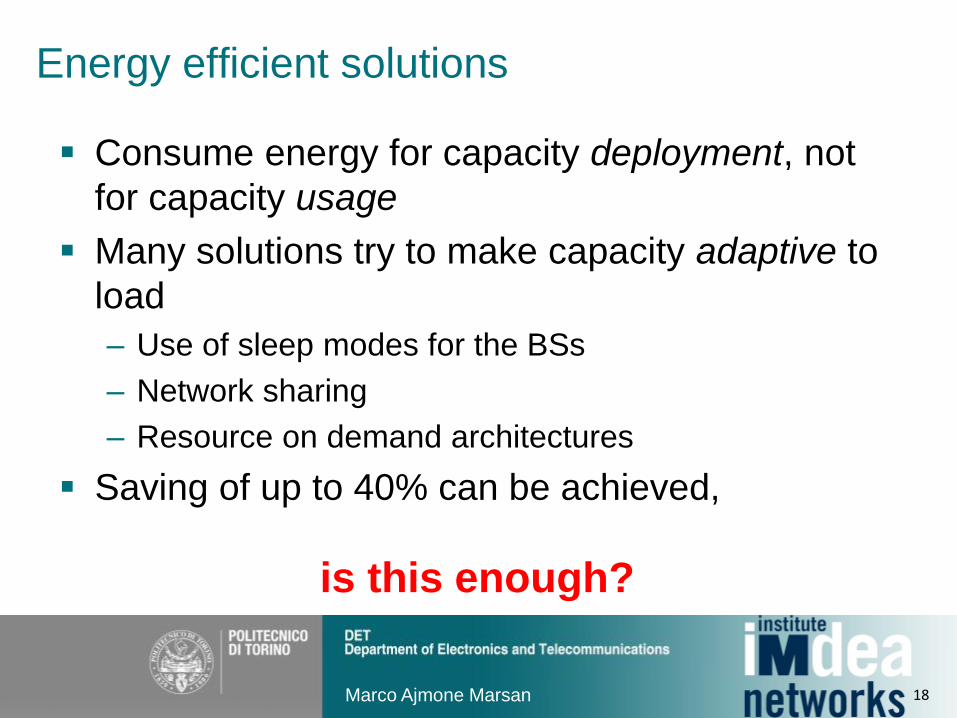
Energy efficient solutions
Consume energy for capacity deployment, not
for capacity usage
Many solutions try to make capacity adaptive to
load
– Use of sleep modes for the BSs
– Network sharing
– Resource on demand architectures
Saving of up to 40% can be achieved,
Marco Ajmone Marsan
is this enough?
18
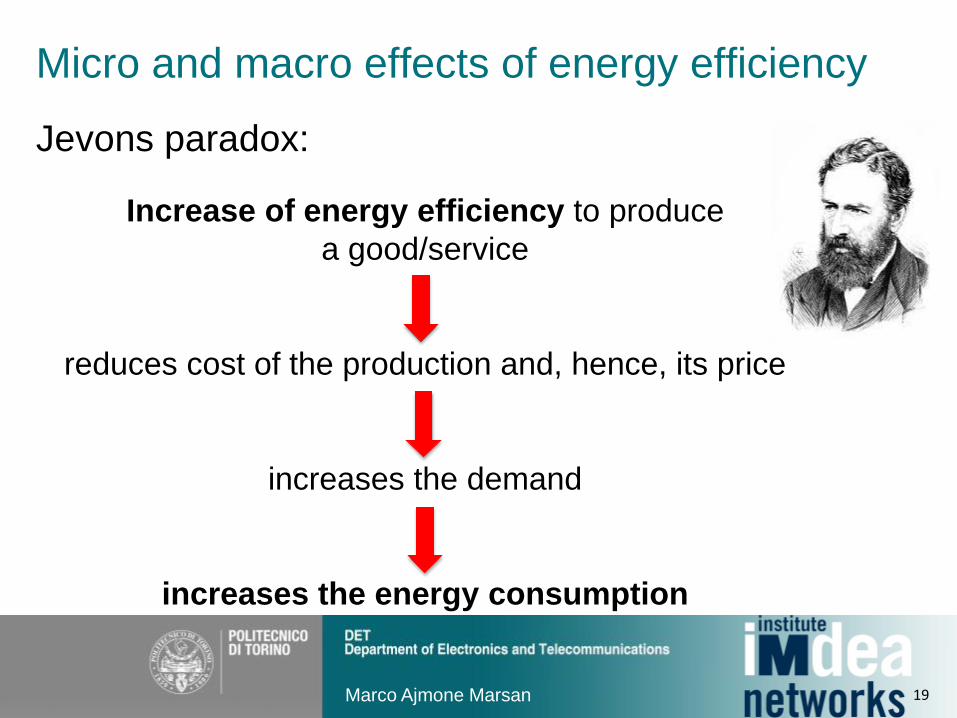
Micro and macro effects of energy efficiency
Increase of energy efficiency to produce
a good/service
reduces cost of the production and, hence, its price
increases the demand
increases the energy consumption
Jevons paradox:
Marco Ajmone Marsan 19
From energy efficient networking to
sustainable networking
Energy efficiency is good since, through cost reduction,
it leads to
Higher production better quality of life for more people
Reduction of price increase and energy shortage
Global environmental advantage if coupled with green taxes to
keep the price constant
but, for sustainability,
it must be coupled with new energy generation principles
(RES – Renewable Energy Sources)
Marco Ajmone Marsan 20
Powering BSs with renewables
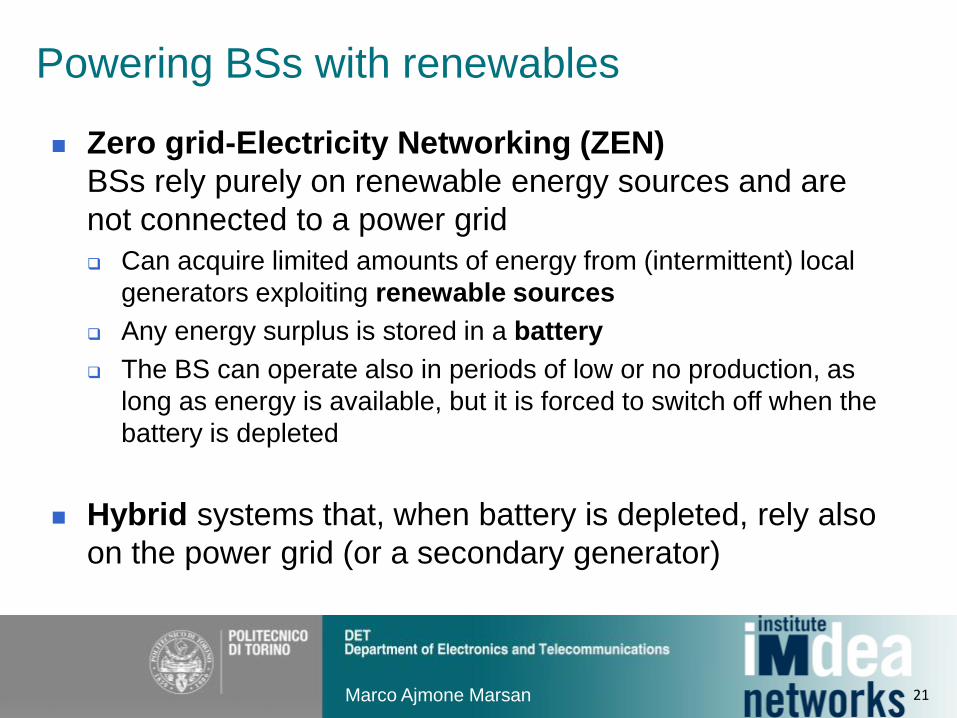
Zero grid-Electricity Networking (ZEN)
BSs rely purely on renewable energy sources and are
not connected to a power grid
Can acquire limited amounts of energy from (intermittent) local
generators exploiting renewable sources
Any energy surplus is stored in a battery
The BS can operate also in periods of low or no production, as
long as energy is available, but it is forced to switch off when the
battery is depleted
Hybrid systems that, when battery is depleted, rely also
on the power grid (or a secondary generator)
Marco Ajmone Marsan 21

Power BSs with Renewable Energy Sources
To deploy networks where the power grid does not exist, is not
ubiquitous or is not reliable
To achieve extremely low carbon footprints
To reduce operational cost
To survive to power grid outages or natural disasters which damage
the power grid
Possible scenarios: 1. New opportunities for the deployment of networks in emerging regions
Marco Ajmone Marsan
Powering BSs with renewables
22
Marco Ajmone Marsan
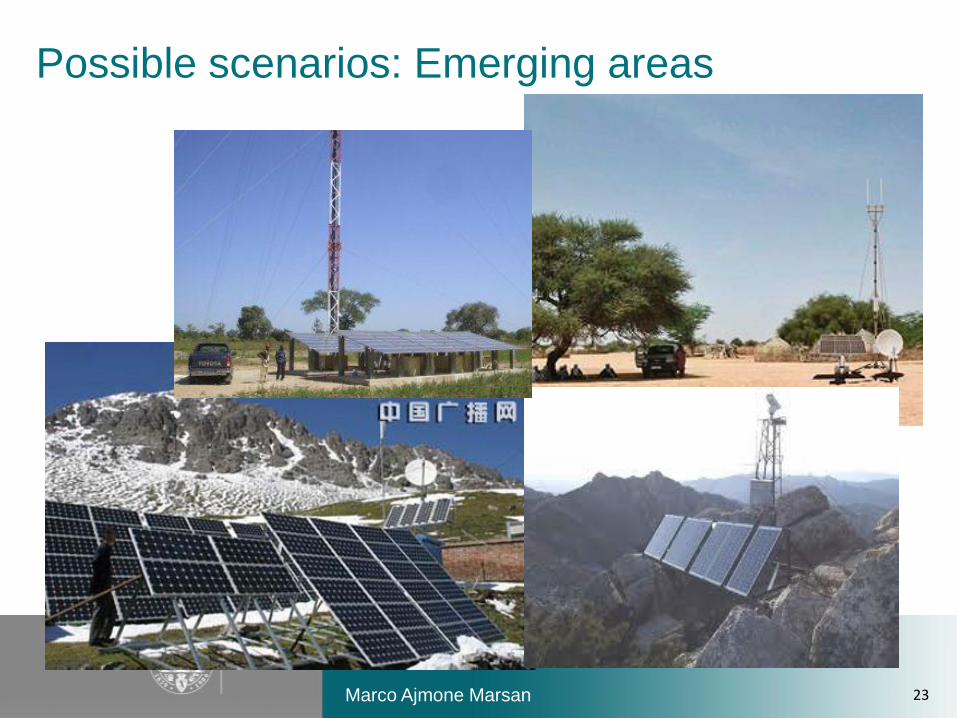
Possible scenarios: Emerging areas
23
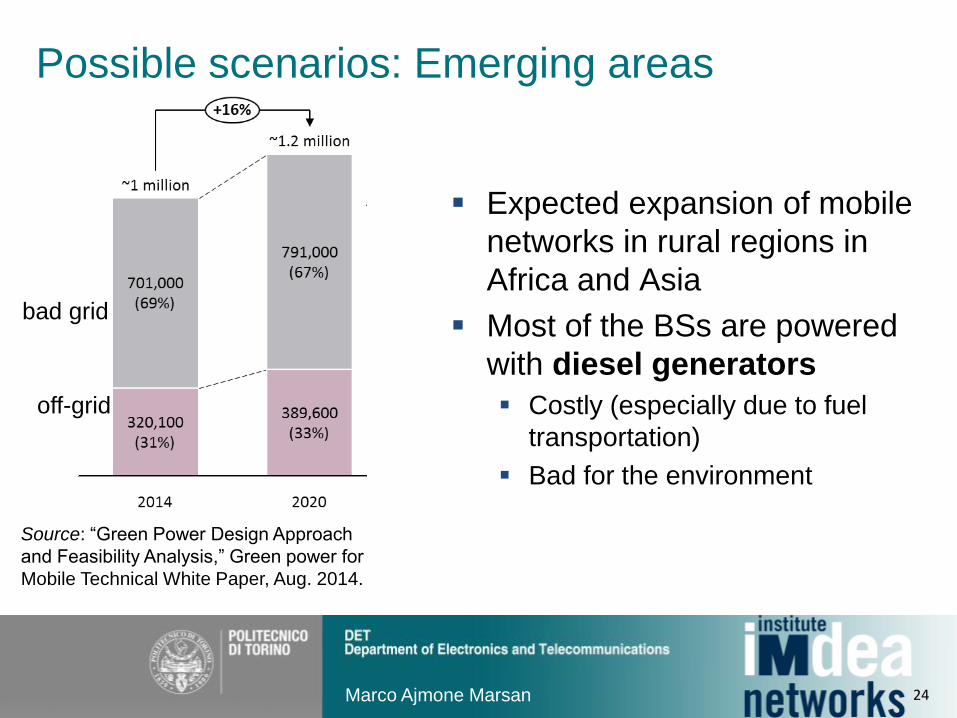
Possible scenarios: Emerging areas
Expected expansion of mobile
networks in rural regions in
Africa and Asia
Most of the BSs are powered
with diesel generators
Costly (especially due to fuel
transportation)
Bad for the environment
Marco Ajmone Marsan
Source: “Green Power Design Approach
and Feasibility Analysis,” Green power for
Mobile Technical White Paper, Aug. 2014.
GPM Technical Paper, June 2014
6
However, the implementation of green power alternatives is far from reaching its true potential. There are 320,000 off-
grid and over 700,000 unreliable-grid telecom sites in the world today (2014)1. The off-grid and bad-grid network globally
is estimated to reach a total of approximately 1.2 million tower sites by 2020 from the current size of 1 million off-grid and
bad-grid towers in 2014. Therefore, The MNOs and Tower Cos will deploy an additional 160,000 off-grid and bad-grid
tower sites by 2020.
Figure 1: Global Off-grid and Unreliable-grid Mobile Network: Current Size and Future Growth
The major driver of the estimated growth in off-grid and bad-grid towers is the expected expansion of mobile networks
into rural regions in Africa and Asia, large parts of which face limited access to reliable grid electricity and poor grid power
infrastructure. Therefore, green alternatives for telecom power present a huge opportunity for MNOs and other
stakeholders.
This technical paper will focus on the aspects of analyzing the technical and economic feasibility of green power and the
important parameters as well as clear approach to understanding the strategy and benefits of green power for telecoms.
1 GSMA GPM-Dalberg Research and Analysis, June 2014
bad grid
off-grid
24

Possible scenarios: Emerging areas
Marco Ajmone Marsan
Source: “Green Power Design Approach
and Feasibility Analysis,” Green power for
Mobile Technical White Paper, Aug. 2014.
GPM Technical Paper, June 2014
6
However, the implementation of green power alternatives is far from reaching its true potential. There are 320,000 off-
grid and over 700,000 unreliable-grid telecom sites in the world today (2014)1. The off-grid and bad-grid network globally
is estimated to reach a total of approximately 1.2 million tower sites by 2020 from the current size of 1 million off-grid and
bad-grid towers in 2014. Therefore, The MNOs and Tower Cos will deploy an additional 160,000 off-grid and bad-grid
tower sites by 2020.
Figure 1: Global Off-grid and Unreliable-grid Mobile Network: Current Size and Future Growth
The major driver of the estimated growth in off-grid and bad-grid towers is the expected expansion of mobile networks
into rural regions in Africa and Asia, large parts of which face limited access to reliable grid electricity and poor grid power
infrastructure. Therefore, green alternatives for telecom power present a huge opportunity for MNOs and other
stakeholders.
This technical paper will focus on the aspects of analyzing the technical and economic feasibility of green power and the
important parameters as well as clear approach to understanding the strategy and benefits of green power for telecoms.
1 GSMA GPM-Dalberg Research and Analysis, June 2014
bad grid
off-grid
In India,
about 400,000 BSs
75% of rural sites and 33% of urban
sites on RES by 2020
Source: K. Tweed, “Why Cellular Towers in
Developing Nations are Making the Move to Solar
Power,“ Scientific America, 15 Jan. 2013.
Renewables can be convenient
Cost reduction
Environmental concerns
Political issues (related to
energy supply)
25
ZEN – Zero grid-Electricity Networking
Power BSs with Renewable Energy Sources
To deploy networks where the power grid does not exist, is not
ubiquitous or is not reliable
To achieve extremely low carbon footprints
To reduce operational cost
To survive to power grid outages or natural disasters which damage
the power grid
Possible scenarios: 1. New opportunities for the deployment of networks in emerging regions
2. New business models (high electricity price, green incentives and environmental awareness)
3. Dense urban areas where cabling is a problem
4. Critical infrastructure protection
5. …
Marco Ajmone Marsan 26
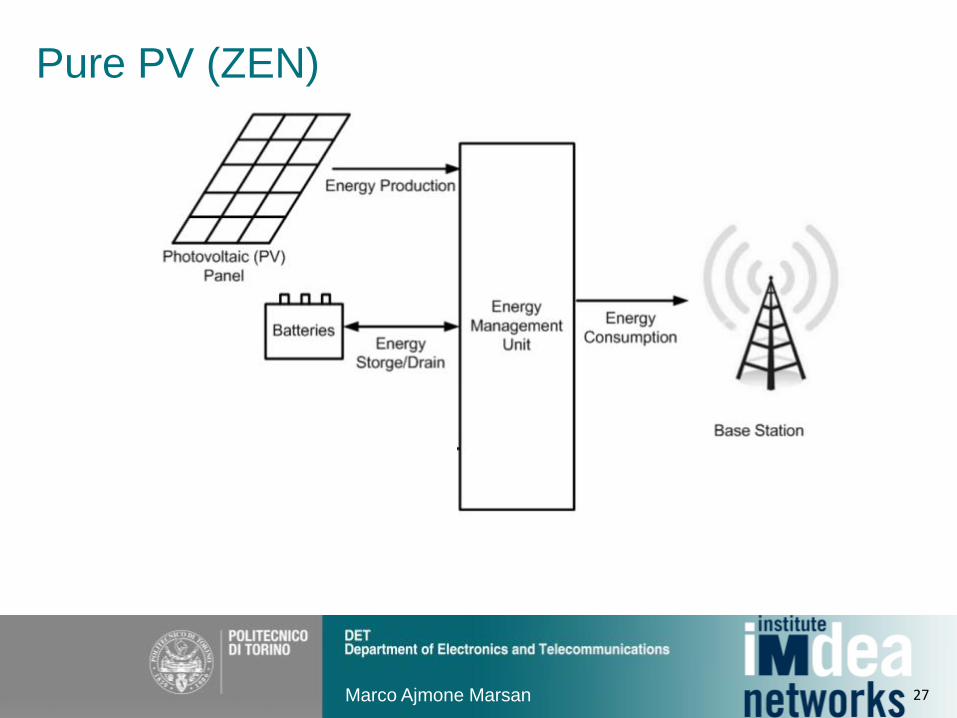
Pure PV (ZEN)
Marco Ajmone Marsan 27
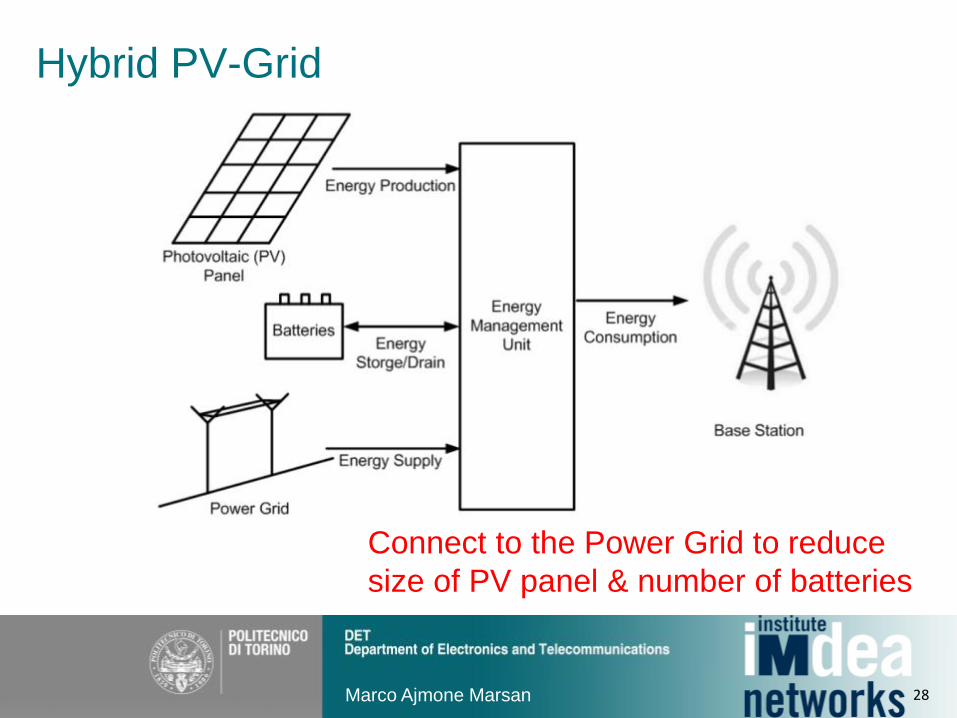
Hybrid PV-Grid
Marco Ajmone Marsan
Connect to the Power Grid to reduce
size of PV panel & number of batteries
28
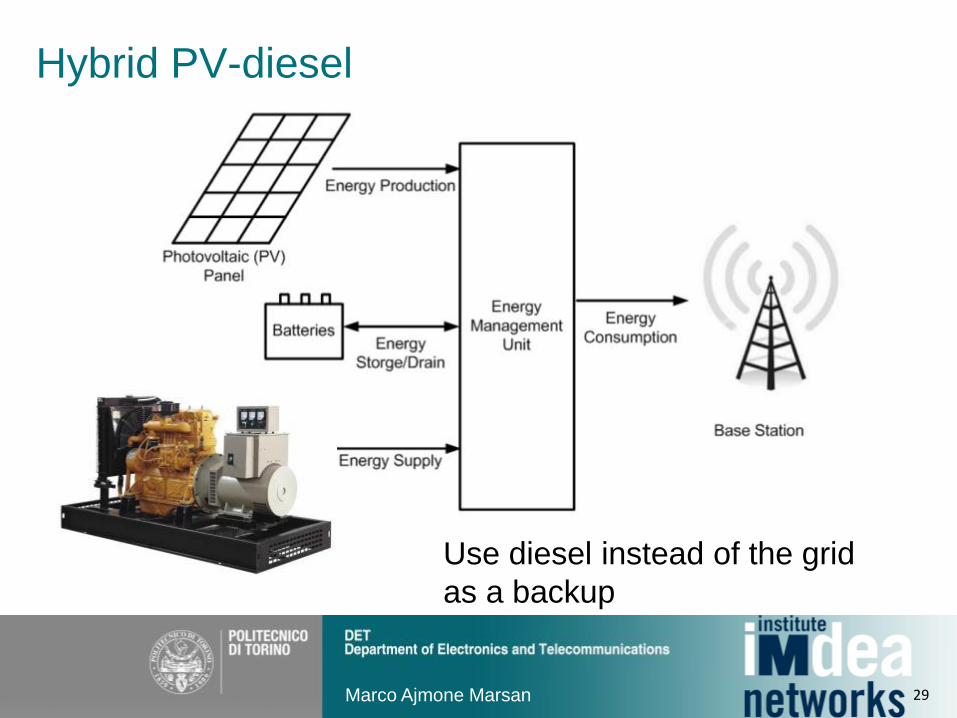
Hybrid PV-diesel
Marco Ajmone Marsan
Use diesel instead of the grid
as a backup
29
Hybrid systems definition
Define parameter PT:
percentage of time the battery charge is above 30%
PT = 100% (ZEN, pure PV): guarantee that the battery
charge is above 30% for 100% of the time in a year
PT < 100% (hybrid system): The battery is above 30% for a
percentage of time equal to PT, buy energy comes from the
power grid when the battery charge becomes 0
Lower values of PT more energy from the grid
– We consider PT in {70,80,90,100}%
Marco Ajmone Marsan 30

Methodology: The scenario
Marco Ajmone Marsan
energy need
Consider 10 year period
Choose a location
Consider a typical BS – macro LTE – Energy consumption
– Traffic (from a real network)
Consider evolution of parameters in 10 years – Traffic increases by 50% Compound Average Growth Rate (CAGR)
– PV panel efficiency decreases by 1% per year
– Electricity price increases by 3% per year
31
Methodology: Dimension the powering system
Marco Ajmone Marsan
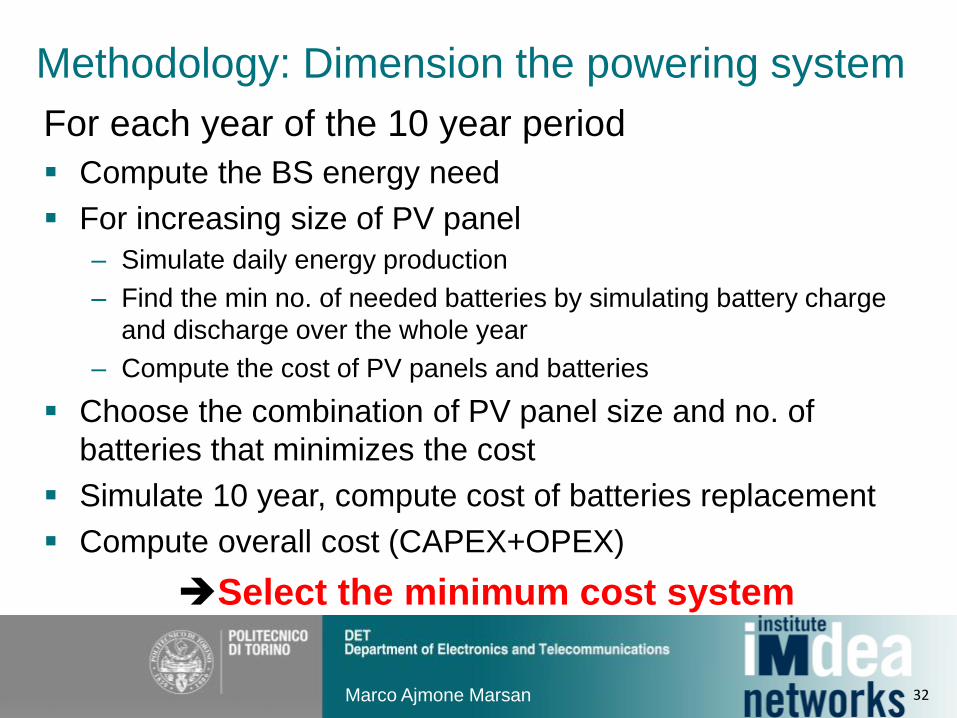
For each year of the 10 year period
Compute the BS energy need
For increasing size of PV panel
– Simulate daily energy production
– Find the min no. of needed batteries by simulating battery charge
and discharge over the whole year
– Compute the cost of PV panels and batteries
Choose the combination of PV panel size and no. of
batteries that minimizes the cost
Simulate 10 year, compute cost of batteries replacement
Compute overall cost (CAPEX+OPEX)
Select the minimum cost system
32
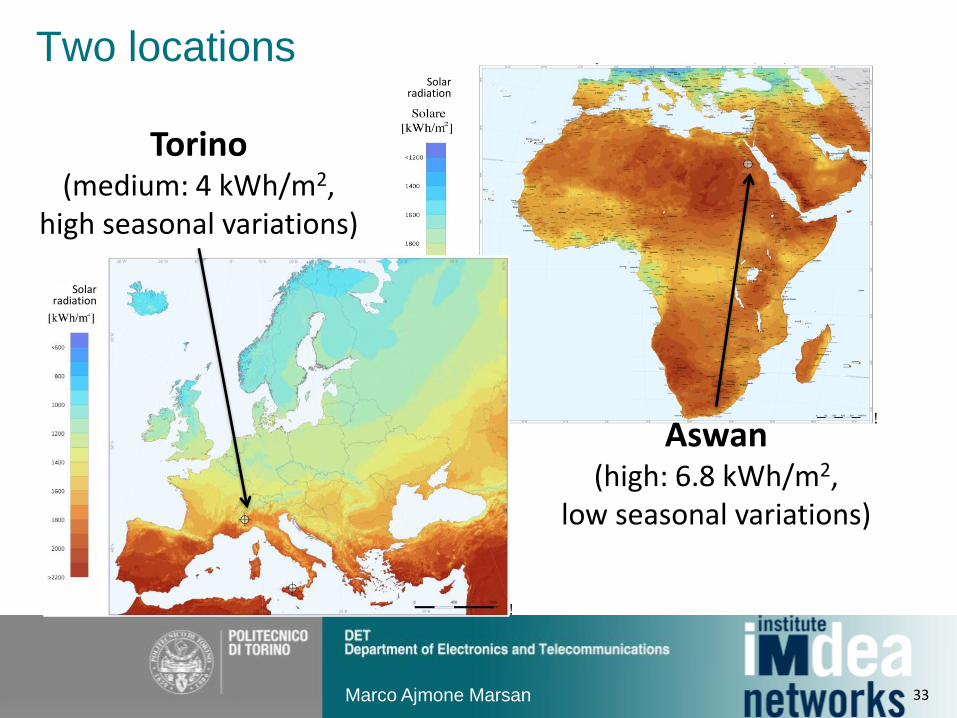
Two locations
!
H̀ !!
!
Figura 28: Radiazione solare annuale in Europa (Fonte: PVGIS, Institute for Energy - Unione Europea,
2012)
!
Figura 29: Radiazione solare annuale in Africa (Fonte: PVGIS, Institute for Energy - Unione Europea, 2012)
!
Torino (medium: 4 kWh/m2,
high seasonal variations)
Aswan (high: 6.8 kWh/m2,
low seasonal variations)
!
H̀ !!
!
Figura 28: Radiazione solare annuale in Europa (Fonte: PVGIS, Institute for Energy - Unione Europea,
2012)
!
Figura 29: Radiazione solare annuale in Africa (Fonte: PVGIS, Institute for Energy - Unione Europea, 2012)
!
Solar radiation
Solar radiation
Marco Ajmone Marsan 33
Real traffic profile
Marco Ajmone Marsan
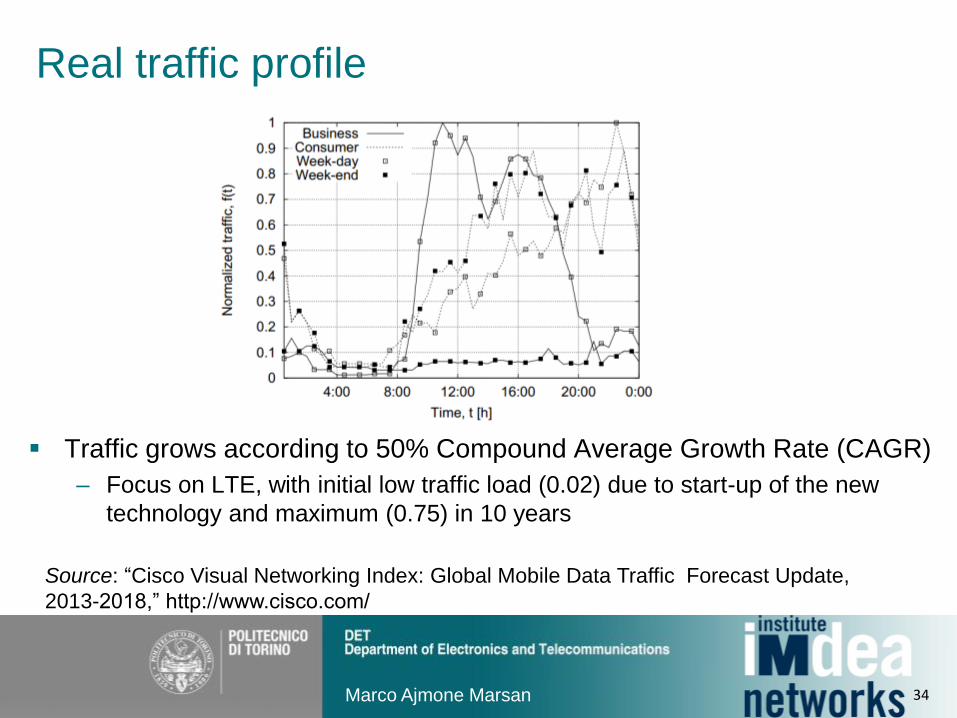
Traffic grows according to 50% Compound Average Growth Rate (CAGR)
– Focus on LTE, with initial low traffic load (0.02) due to start-up of the new
technology and maximum (0.75) in 10 years
Source: “Cisco Visual Networking Index: Global Mobile Data Traffic Forecast Update,
2013-2018,” http://www.cisco.com/
34
Real traffic profile
Marco Ajmone Marsan
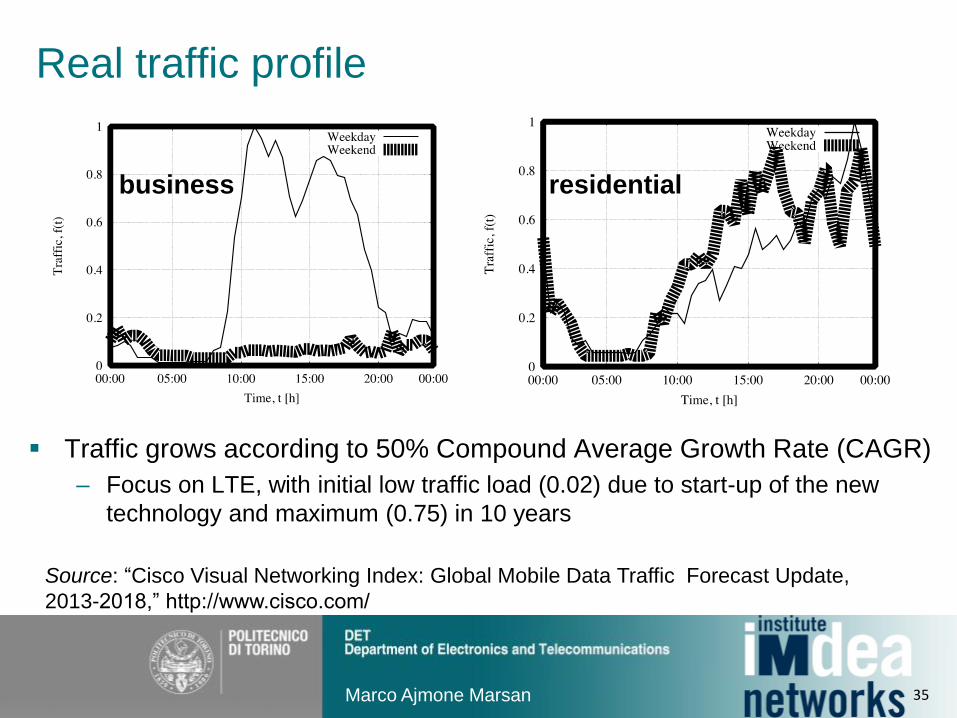
Traffic grows according to 50% Compound Average Growth Rate (CAGR)
– Focus on LTE, with initial low traffic load (0.02) due to start-up of the new
technology and maximum (0.75) in 10 years
Source: “Cisco Visual Networking Index: Global Mobile Data Traffic Forecast Update,
2013-2018,” http://www.cisco.com/
business residential
35
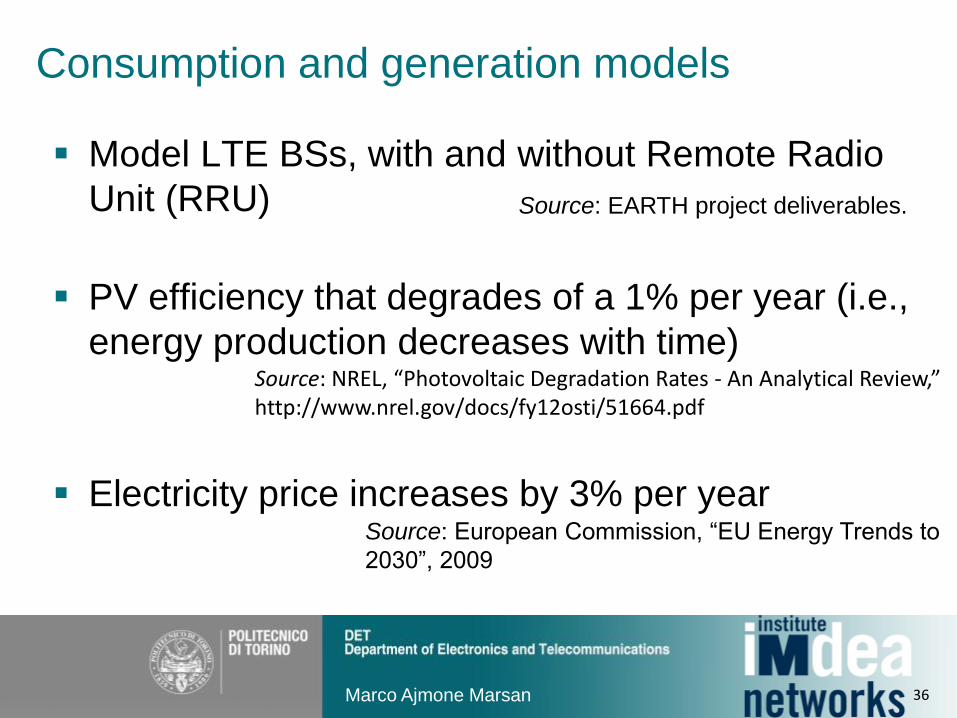
Consumption and generation models
Source: EARTH project deliverables.
Model LTE BSs, with and without Remote Radio
Unit (RRU)
PV efficiency that degrades of a 1% per year (i.e.,
energy production decreases with time)
Electricity price increases by 3% per year
Source: NREL, “Photovoltaic Degradation Rates - An Analytical Review,” http://www.nrel.gov/docs/fy12osti/51664.pdf
Source: European Commission, “EU Energy Trends to
2030”, 2009
Marco Ajmone Marsan 36
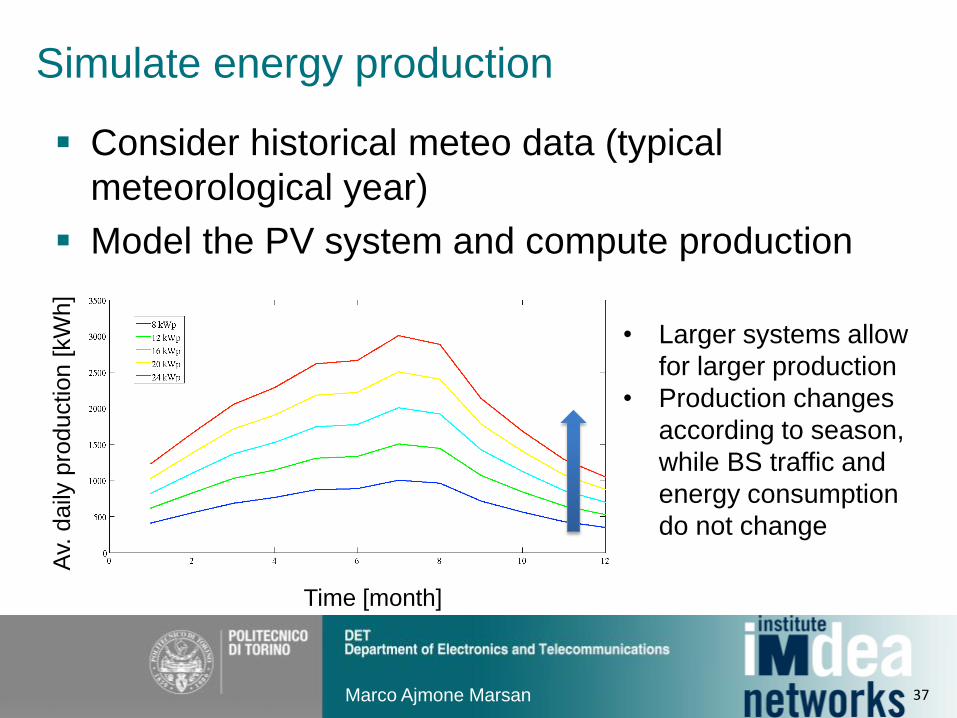
Simulate energy production
Consider historical meteo data (typical
meteorological year)
Model the PV system and compute production !
[ H!!
!
Figura 31: Produzione mensile di energia elettrica (Torino)
!
Figura 32 Produzione mensile di energia elettrica (Palermo)
Av.
daily
pro
duction [
kW
h]
• Larger systems allow
for larger production
• Production changes
according to season,
while BS traffic and
energy consumption
do not change
Time [month]
Marco Ajmone Marsan 37
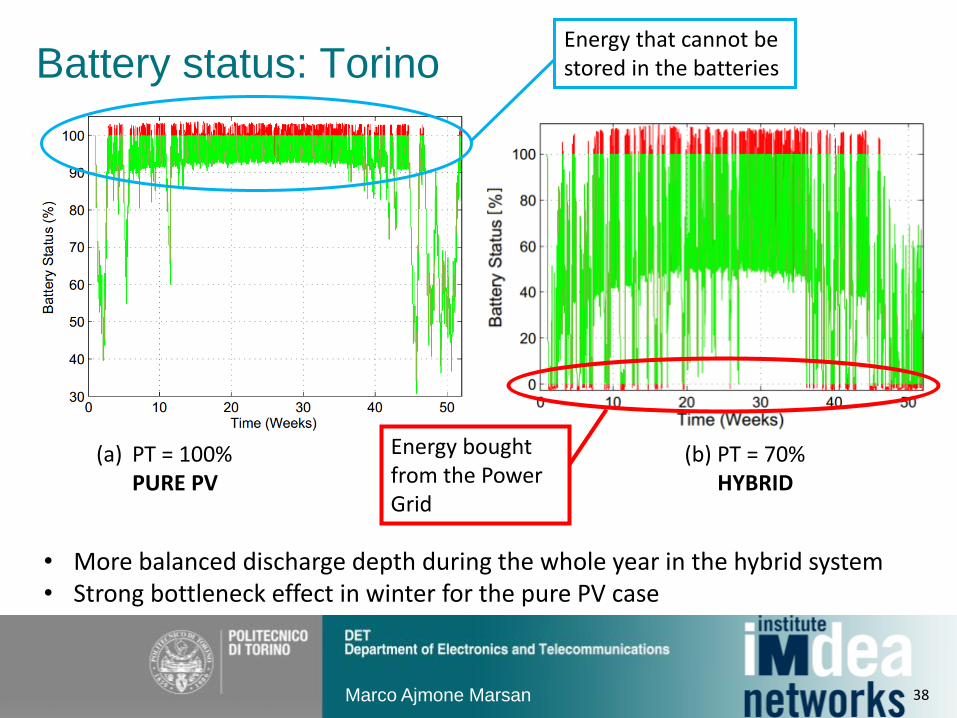
Battery status: Torino
e
Marco Ajmone Marsan
(a) PT = 100% PURE PV
(b) PT = 70% HYBRID
• More balanced discharge depth during the whole year in the hybrid system • Strong bottleneck effect in winter for the pure PV case
Energy that cannot be stored in the batteries
Energy bought from the Power Grid
38
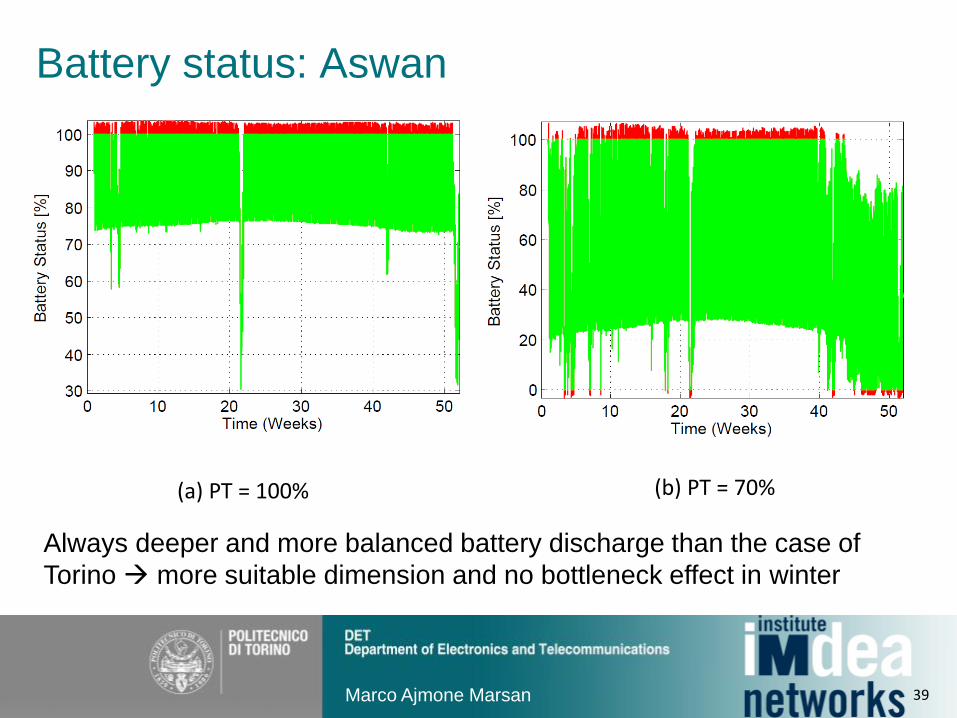
Battery status: Aswan
Marco Ajmone Marsan
(a) PT = 100% (b) PT = 70%
Always deeper and more balanced battery discharge than the case of
Torino more suitable dimension and no bottleneck effect in winter
39
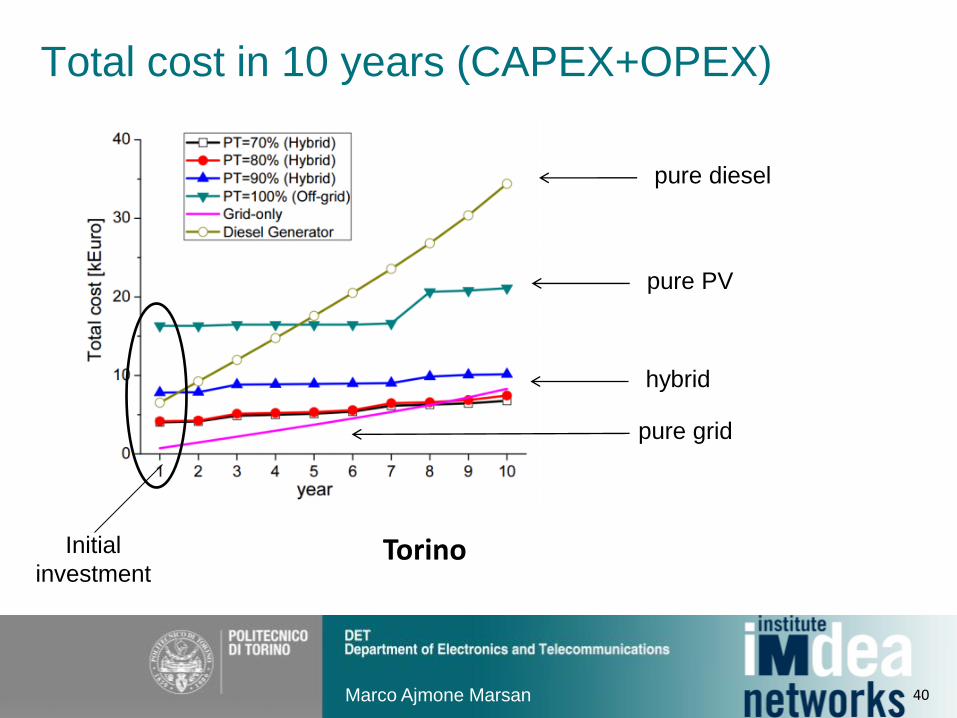
Total cost in 10 years (CAPEX+OPEX)
Marco Ajmone Marsan
Torino
pure diesel
pure PV
pure grid
hybrid
Initial
investment
40
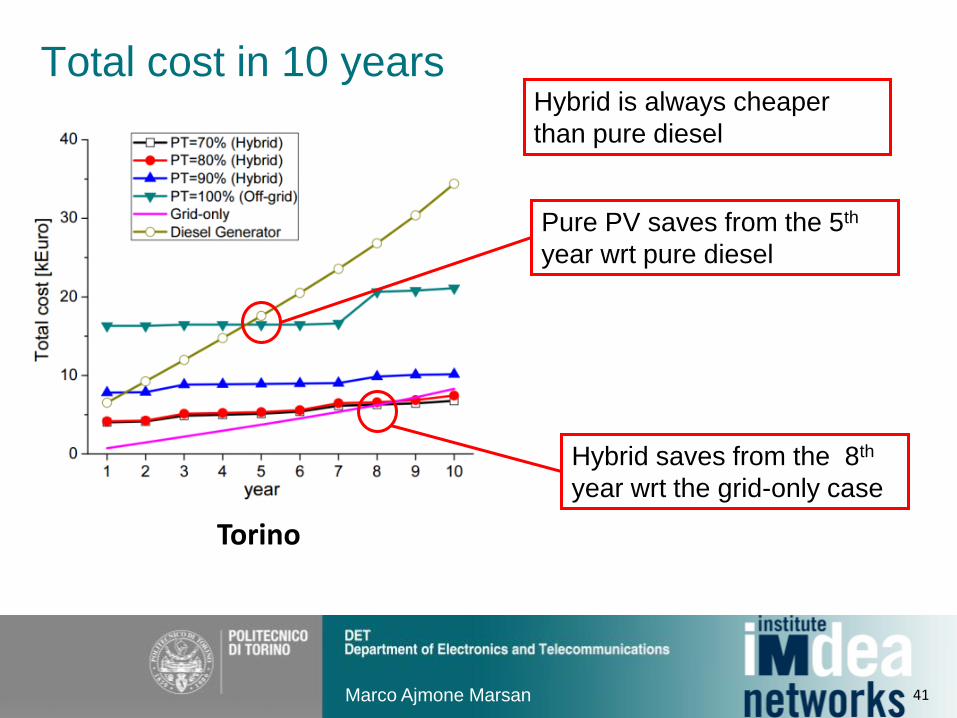
Total cost in 10 years
Marco Ajmone Marsan
Hybrid saves from the 8th
year wrt the grid-only case
Torino
Hybrid is always cheaper
than pure diesel
Pure PV saves from the 5th
year wrt pure diesel
41
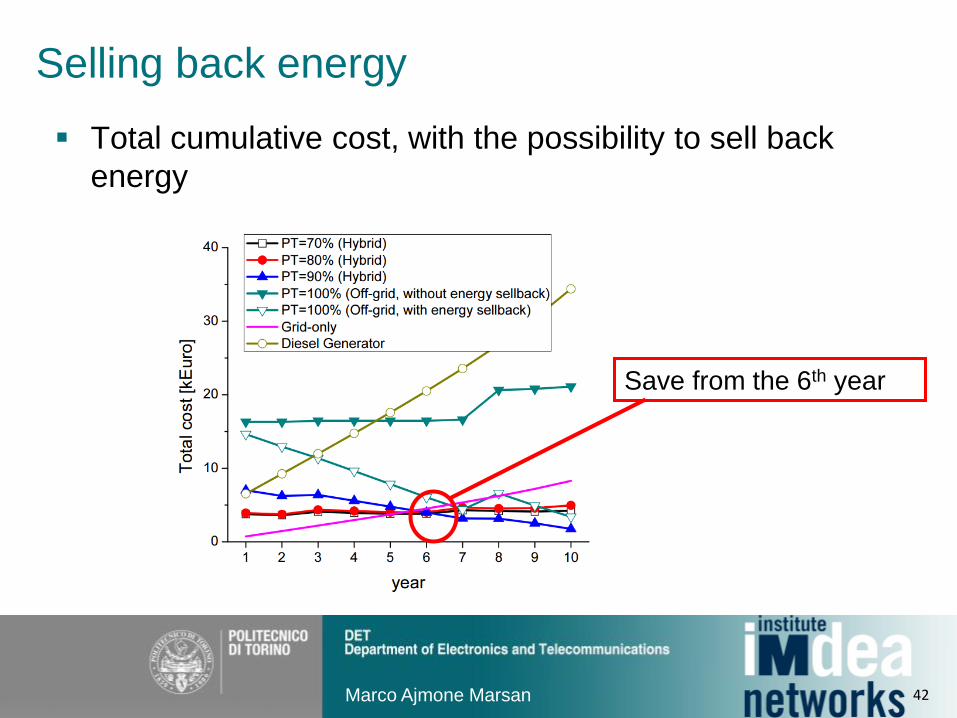
Selling back energy
Total cumulative cost, with the possibility to sell back
energy
Marco Ajmone Marsan
Save from the 6th year
42
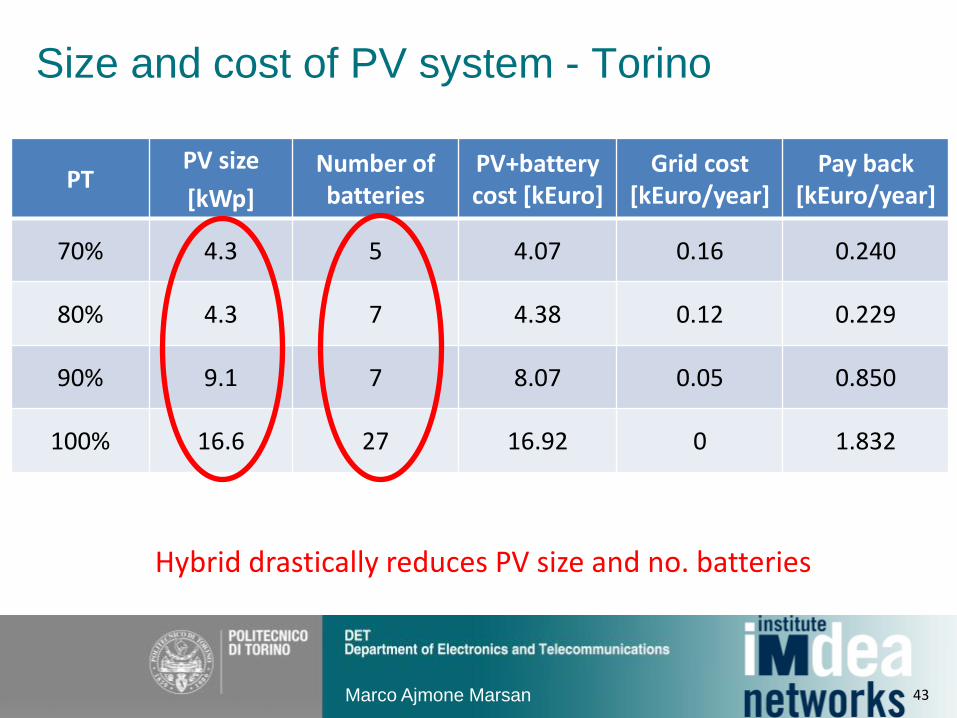
Size and cost of PV system - Torino
PT PV size
[kWp]
Number of batteries
PV+battery cost [kEuro]
Grid cost [kEuro/year]
Pay back [kEuro/year]
70% 4.3 5 4.07 0.16 0.240
80% 4.3 7 4.38 0.12 0.229
90% 9.1 7 8.07 0.05 0.850
100% 16.6 27 16.92 0 1.832
Marco Ajmone Marsan
Hybrid drastically reduces PV size and no. batteries
43
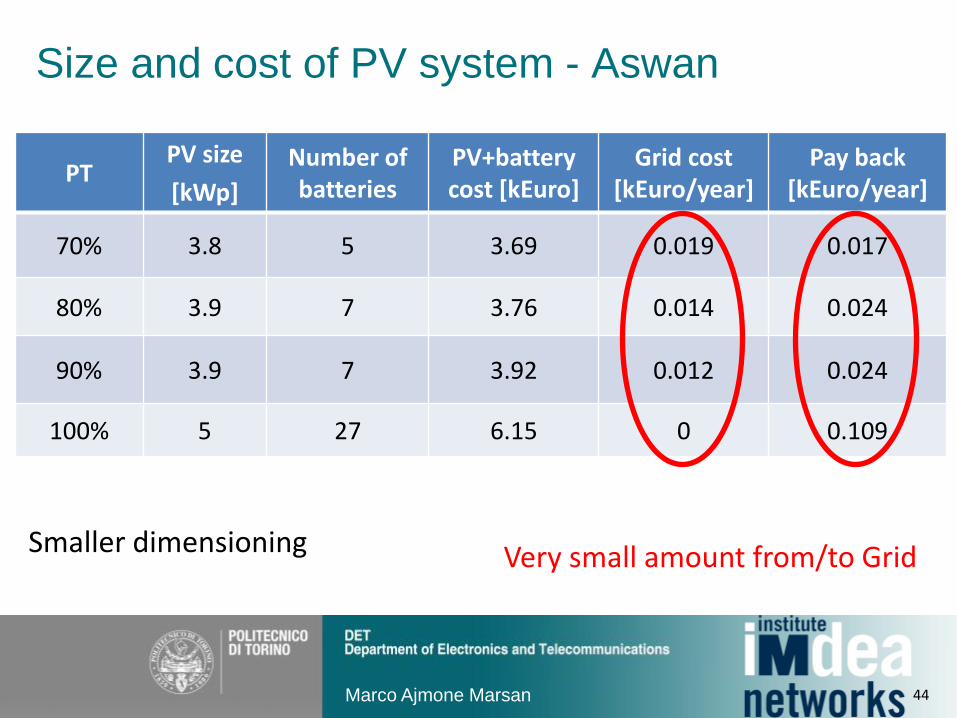
Size and cost of PV system - Aswan
PT PV size
[kWp]
Number of batteries
PV+battery cost [kEuro]
Grid cost [kEuro/year]
Pay back [kEuro/year]
70% 3.8 5 3.69 0.019 0.017
80% 3.9 7 3.76 0.014 0.024
90% 3.9 7 3.92 0.012 0.024
100% 5 27 6.15 0 0.109
Marco Ajmone Marsan
Very small amount from/to Grid Smaller dimensioning
44

• Smaller consumption at low load
• Higher load proportionality
Evolution of BS technology
With new BSs, consumption is reduced
The size of PV panels and the no. of batteries reduce also
Marco Ajmone Marsan
BS model
Full load [W]
No load [W]
Daily [kWh]
new 2x2 MIMO 702.6 114.5 8.65
new 4x4 MIMO 742.2 138.9 9.39
old with RRU 840.0 504.0 14.46
Source: GreenTouch project, 2015.
45
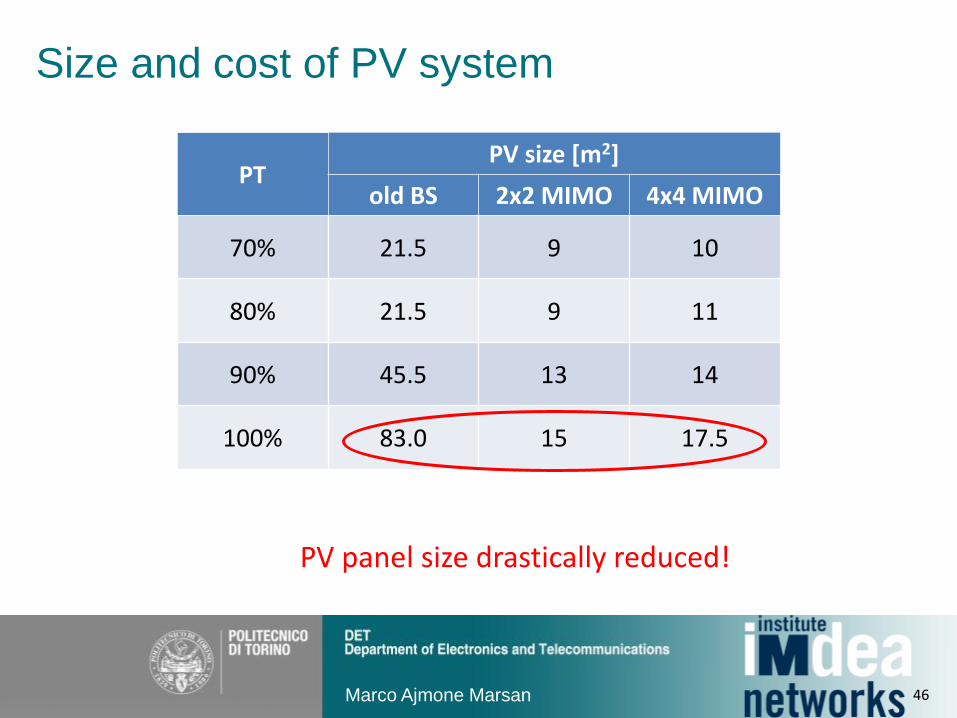
Size and cost of PV system
PT PV size [m2]
old BS 2x2 MIMO 4x4 MIMO
70% 21.5 9 10
80% 21.5 9 11
90% 45.5 13 14
100% 83.0 15 17.5
Marco Ajmone Marsan
PV panel size drastically reduced!
46
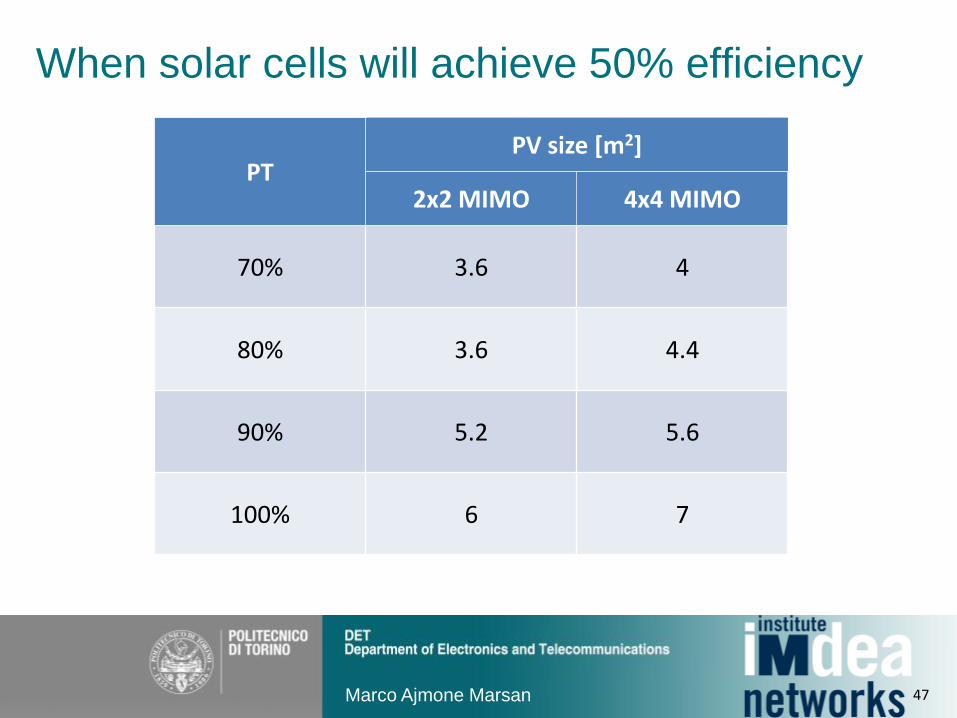
When solar cells will achieve 50% efficiency
PT PV size [m2]
2x2 MIMO 4x4 MIMO
70% 3.6 4
80% 3.6 4.4
90% 5.2 5.6
100% 6 7
Marco Ajmone Marsan 47
Conclusion and discussion
Awareness about the huge energy consumption of
communication networks has led to development
of more energy efficient solutions and
technologies
However, for sustainability, energy efficiency
alone is not enough
Marco Ajmone Marsan 48
Conclusion and discussion
Networking should be combined with new energy
generation principles
Powering BS with renewable sources
– is cost effective
– allows service provisioning in disadvantaged areas
– is well suited to critical infrastructure protection
– allows communications after natural disasters
– avoids cabling difficulties
Marco Ajmone Marsan 49

Questions?
Marco Ajmone Marsan 50
Thank you!
![Powering agriculture with renewable energy [compatibility mode]](https://static.fdocuments.net/doc/165x107/58773c221a28ab342e8b5b33/powering-agriculture-with-renewable-energy-compatibility-mode-591a1162f10b2.jpg)