Power Transmission and Distribution - Siemens...220 kV Substations 400 kV Substations 765 kV...
18
Power Transmission and Distribution A Solid Foundation for Profitable Growth Udo Niehage, Group President Capital Market Days February 23-24, 2006
Transcript of Power Transmission and Distribution - Siemens...220 kV Substations 400 kV Substations 765 kV...

Siemens Capital Market Days, February 23-24, 2006 Page 0
Power Transmission and DistributionA Solid Foundation for Profitable Growth
Udo Niehage, Group President
Capital Market DaysFebruary 23-24, 2006

Siemens Capital Market Days, February 23-24, 2006 Page 1
Safe harbor statement
This presentation contains forward-looking statements and information – that is, statements related to future, not past, events. These statements may be identified either orally or in writing by words as “expects”, “anticipates”, “intends”, “plans”, “believes”, “seeks”, “estimates”, “will” or words of similar meaning. Such statements are based on our current expectations and certain assumptions, and are, therefore, subject to certain risks and uncertainties. A variety of factors, many of which are beyond Siemens’ control, affect its operations, performance, business strategy and results and could cause the actual results, performance or achievements of Siemens worldwide to be materially different from any future results, performance or achievements that may be expressed or implied by such forward-looking statements. For us, particular uncertainties arise, among others, from changes in general economic and business conditions, changes in currency exchange rates and interest rates, introduction of competing products or technologies by other companies, lack of acceptance of new products or services by customers targeted by Siemens worldwide, changes in business strategy and various other factors. More detailed information about certain of these factors is contained in Siemens’ filings with the SEC, which are available on the Siemens website, www.sec.govwww.siemens.com and on the SEC’s website, . Should one or more of these risks or uncertainties materialize, or should underlying assumptions prove incorrect, actual results may vary materially from those described in the relevant forward-looking statement as anticipated, believed, estimated, expected, intended, planned or projected. Siemens does not intend or assume any obligation to update or revise these forward-looking statements in light of developments which differ from those anticipated.

Siemens Capital Market Days, February 23-24, 2006 Page 2
Comprehensive Portfolio
Power transformers up to 1,300MVA and 765kV, distribution transformers with oil or cast-resin insulation
Medium VoltageComponents, switchgear and turnkey projects for power transmission ≤ 52kV (AC and DC)
High VoltageComponents, switchgear and turnkey projects for power transmission > 52kV (AC and DC)
Transformers
Energy AutomationIntegrated control systems, protection and substation automation, telecontrolsystems, power quality
ServicesNetwork planning & consulting, maintenance management for grids & networks, metering services
Complete T&D portfolio with best-in-class products and solutions

Siemens Capital Market Days, February 23-24, 2006 Page 3
Global Presence
Americas
15% 17% 25%
4.0 700 14
€
Europe(excl. Germany)
32% 33% 29%
8.3 1,400 16
€
Germany29%
12% 21%7.4 500 12
€
PTD World
25.8 4,251
€
Asia-Pacific21% 26% 25%5.3 1,100 14
€
Employees (thousands)
Sales ( in € millions)
Manufacturing facilities
€
As of September 30, 2005
56
Well-balanced global engineering, manufacturing and sales setup

Siemens Capital Market Days, February 23-24, 2006 Page 4
FY 2004 FY 2005 Q1-2006
At a glance
New Orders 3.9 5.3 2.5Sales 3.6 4.3 1.5Group profit 0.2 0.2 0.1as percentage of sales 6.6% 5.0% 5.8%
Employees 19 26 26in thousands
values in € billions
3.0
3.5
4.0
4.5
5.0
5.5
6.0
6.5
7.0
FY 2003 FY 2004 FY 2005 FY 2006
New Orders Sales
12 months rolling business volume
values in € billions
Key Financials
Strong growth of all Divisions; sixth consecutive quarterly order intake record; first quarter FY 2006 Orders +72%* compared to Q1 FY 2005
Group profit since FY 2003 in line with target margin range
Transformer restructuring and integration of VATech T&D well under way
* excluding currency translation and portfolio effects

Siemens Capital Market Days, February 23-24, 2006 Page 5
Strategic FocusPortfolio Management
VATech T&DTransformers
Circuit Breakers
Disconnectors
Surge Arresters
HV Instr. Transformers
Air Core Reactors
Line Traps (PLC)
Bushings
Complement portfolio
---
limited
PTD
----
Market coverage, global setup
Power Technologies International (Services)
World market leader in
network consulting
network planning software
Strengthen competenciesVarious setups / Greenfield investments
in China and India
Network and close to the customer

Siemens Capital Market Days, February 23-24, 2006 Page 6
Strategic Focus Innovation
HVDC TransmissionHVDC and FACTS for bulk power transmissionup to 800kV DC
Energy AutomationFirst supplier with complete range of protection and automation equipment with new communicationstandard IEC 61850
New Markets / SolutionsRenewable, Industry solutions (Chemical, Automotive, Oil & Gas)
New Trendsetting Technologies
Medium Power TransformersNew design for material cost reduction (-20%)
High Voltage SwitchgearFrom today 27 product lines to 6 in future
Medium VoltageNew circuit breaker SION: flexible adaptation to customer needs (48 h delivery time for OEMs)
Portfolio Optimization – Platform strategiesPace setting in all business areas
Renewable Energiesproviding enabling technology for couplingrenewable energy sources (e.g. wind parks; solar farms)
Oil & Gasour distribution network coupler SIPLINK is applied in new areas such as industrial plants, ship wharfs and oil rigs
Through continuous R&D-activities and portfolio management PTD is and will be the preferred T&D-supplier

Siemens Capital Market Days, February 23-24, 2006 Page 7
Strategic Focus Global Competitiveness
Queretaro
Sao Paulo
BerlinJackson
Aurangabad
"Old"
HangzhouShanghai
"New"
Sao Paulo
Shanghai
Berlin
Queretaro
JacksonHangzhou
Aurangabad
Prod. CostGermany
Prod. CostChinaSupply /
Sourcing from CHN
2003 2007 with measures
2003 2007 w /omeasures
2007 withmeasures
other cost
importedmaterial
localmaterial
Labor costs
Optimized factory utilization and sourcing on a world wide basis leads to a better cost position and higher profitability in domestic and international businesses
In line with the transformation process operations are getting closer to the customer / local markets and needs
A balanced network of tomorrow leads to competitive advantages such as bundling of international R&D competencies, efficient global sourcing and business risk minimization
Example: High Voltage Circuit Breaker
Transformation is the key lever to secure future competitiveness;successful transformation goes in line with people excellence
Siemens Capital Market Days, February 23-24, 2006 Page 8
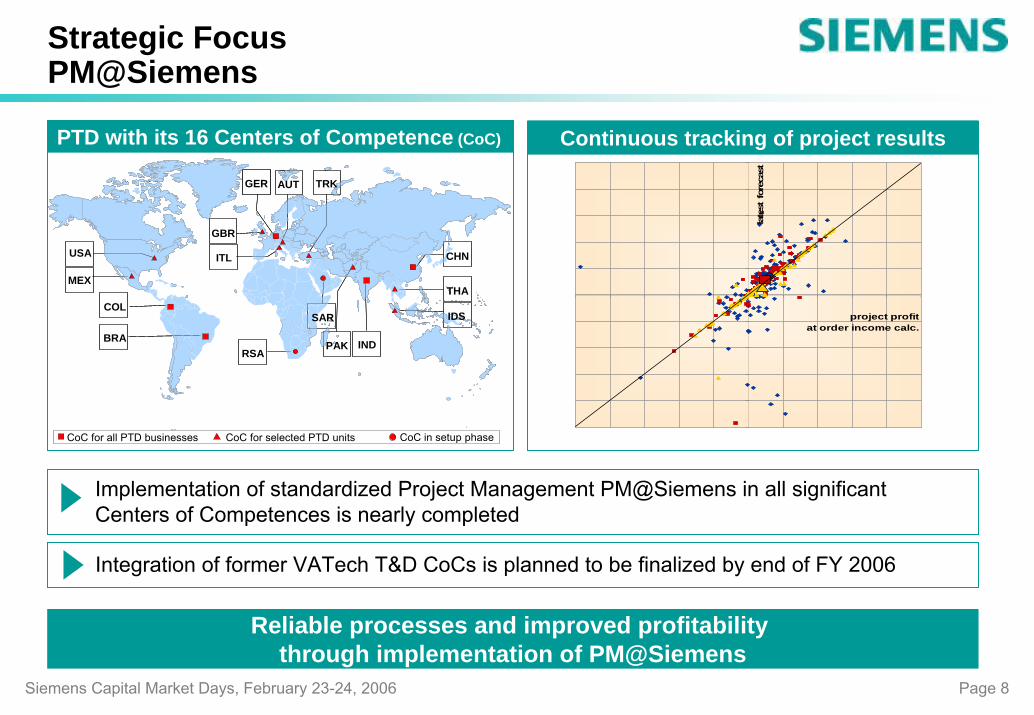
Strategic FocusPM@Siemens
PTD with its 16 Centers of Competence (CoC)
USA
COL
BRA
MEX
CHN
THA
INDPAK
SAR
TRKAUT
ITL
GBR
RSA
GER
Continuous tracking of project results
Reliable processes and improved profitability through implementation of PM@Siemens
Implementation of standardized Project Management PM@Siemens in all significant Centers of Competences is nearly completed
Integration of former VATech T&D CoCs is planned to be finalized by end of FY 2006
project profit at order income calc.
late
st f
orec
ast
IDS
CoC in setup phaseCoC for all PTD businesses CoC for selected PTD units

Siemens Capital Market Days, February 23-24, 2006 Page 9
PTD’s Competition andMarket Share
Market Share Development
16%
10%+
Siemens data with anticipated full FY VATech T&D
8%
4%
3%
17%
3%11%
7%
4%
3% 2003
2005
comparable portfolio
With double digit sales growth closing the gap to # 1and break away from # 3 and followers

Siemens Capital Market Days, February 23-24, 2006 Page 10
Market and Market Characteristics
Equipment phase Optimization phase Replacement phase
Developing in a new competitive environment
Building up reliable and cost-efficient electrical infrastructures
Optimizing the grids for power quality and power-flow efficiency
€20 bn~ 6%
€9 bn~ 1%
€10 bn~ 2%
Market size& growth
Deregulation trend
Time frame: 15 - 30 years ~10 to 15 years ~10 to 15 years
Example UK (Capex spendings)
CapitalExpenditures
Source: Boston Consulting Group
Global but differentiated market approach and ongoing technology developmentsare the success factors for continuous and steady growth

Siemens Capital Market Days, February 23-24, 2006 Page 11
Trends and Market Drivers
Bulk power transmission over long distances from generation to consumer
Distribution within congested areas / megacities
Efficient, reliable and secure supply of electrical energy are the key drivers of our business
Population growth from more than 6 billion to 8 billion by 2025Growth of energy consumption
industrial countries + 1.4%emerging countries + 5.2%
Growing distances between power generation and consumption
Need for more energy
Urbanization
The world’s urban population is estimated at 3 billion in 2003 and is expected to rise to 5 billion by 2030Megacities (> 10 million) :Today: 280 million people2015: 350 million people

Siemens Capital Market Days, February 23-24, 2006 Page 12
Our products and solutions offer answers to global challenges
IEC 61850
Coverage of existing and future challenges for more efficient, reliable and secure power transmission and distribution
Bulk power transmission (3,000 MW) over 940km to megacity Guangzhou, China
Transmission
HVDC project Gui Guang I
Distribution
Modernization of more than 2,000 distribution substations in Hong Kong
Grid Rehabilitation
Technology trendsetter ahead of competition in applying communication standard IEC61850
Energy Automation
Pace Setting
Services
Network Planning & ServicesWorld market leader in network planning software (PSS, NETOMAC) and application

Siemens Capital Market Days, February 23-24, 2006 Page 13
PTD in India
With local manufacturing and developed engineering competencies,PTD will take full advantage of India’s demanding T&D market
values in thousand MVAs
54
116139
185
259
22
61 7494
3 14
132
1990 2002 2005 2007 2012
220 kV Substations
400 kV Substations
765 kV Substations
Key figures7 sales Offices3 factories, 1 CoC
Medium Voltage, Kalwa / MumbaiHigh Voltage, AurangabadTransformers, Kalwa (under construction)
Number of employees > 700Overall investment > €50 million
Summary
India power market with double digit growth in coming years due to high investments in T&D gridPTD covers the full scope of market demand with local manufacturing and competitive designsPM competencies in engineering, procurement and construction for growth in domestic and export markets

Siemens Capital Market Days, February 23-24, 2006 Page 14
Shanghai
Xinjiang
Tibet
Gansu
Qinghai
Yunnan
Guizhou
Guangxi
Hainan
Guangdong
Hunan Jiangxi
Fujian
Hubei Anhui
Jiangsu
ZhejiangSichuan
Chongqing
Shanxi
Inner Mongolia
Heilongjiang
Jilin
Liaoning
Shandong
Beijing
TianjinHebei
Henan
ShaanxiNingxia
PTD Headquarter
PTD sales offices
New PTD sales offices
Joint Venture / Wholly Owned Foreign Company
For 15 years now, PTD is one of the leading players in the Chinese T&D market
PTD in China
Key figures
23 sales Offices2 R&D Centers12 factories (High and Medium Voltage, Energy Automation and Transformers), 2 CoCsNumber of employees >3,000Overall investment until 2005 > €100 million
Market
Chinese T&D market growth approx. 9% p. a. over the next yearsGrid extension into 1,000kV AC and +/- 800kV DC for efficient long distance transmissionMegacities with high load densityOngoing investments in Industry, e.g ChemicalAutomotive and Oil & Gas

Siemens Capital Market Days, February 23-24, 2006 Page 15
Our Mission
Solid foundation for profitable growth!
Market
EmployeesCustomers

Siemens Capital Market Days, February 23-24, 2006 Page 16
Reconciliations and definitions
”Group profit from Operations” is reconciled to ”Income before income taxes” of Operations under ”Reconciliation to financial statements” on the table ”Segment information.” See ”Financial Reports/Fiscal 2006, Quarter 1 / Financial Statements” at our Investor Relations website under www.siemens.com
”ROE” (Return on equity) margin for SFS was calculated as SFS’ income before income taxes divided by the allocated equity for SFS. Allocated equity for SFS as of September 30, 2005 was €983 million. See also Siemens’ Form 20-F at our Investor Relations website under www.siemens.com
The allocated equity for SFS is determined and influenced by the respective credit ratings of the rating agencies and by the expected size and quality of its portfolio of leasing and factoring assets and equity investments and is determined annually. This allocation is designed to cover the risks of the underlying business and is in line with common credit risk management standards in banking. The actual risk profile of the SFS portfolio is monitored and controlled monthly and is evaluated against the allocated equity.
Siemens ties a portion of its executive incentive compensation to achieving economic value added (EVA) targets. EVA measures the profitability of a business (using Group profit for the Operating Groups and income before income taxes for the Financing and Real estate businesses as a base) against the additional cost of capital used to run a business, (using Net capital employed for the Operating Groups and risk-adjusted equity for the Financing and Real estate businesses as a base). A positive EVA means that a business has earned more than its cost of capital, and is therefore defined as value-creating. A negative EVA means that a business is earning less than its cost of capital and is therefore defined as value-destroying. Other organizations that use EVA may define and calculate EVA differently.
A reconciliation of EVA may be found on our Investor Relations website under www.siemens.com

Siemens Capital Market Days, February 23-24, 2006 Page 17
Siemens Investor Relations Team
Webpage: http://www.siemens.com Investor Relations
e-mail: [email protected]
Fax: +49-89-636-32830
Marcus Desimoni +49-89-636-32445
Frank Heffter +49-89-636-34095
Irina Pchelova +49-89-636-33693
Christina Schmöe +49-89-636-32677
Susanne Wölfinger +49-89-636-30639