POWER SYSTEM - Energistyrelsen · 220kV bus bars in transmission grid.1 1 If generation nodes under...
36
Transcript of POWER SYSTEM - Energistyrelsen · 220kV bus bars in transmission grid.1 1 If generation nodes under...


Energy Outlook Report 2019 Grid modeling of RE scenarios and recommendations on power grid
Institute of Energy – P8 Page 2 / 36
Power System Development Department ©
DETAILED GRID MODELING OF THE VIETNAMESE
POWER SYSTEM
This report has been conducted for the Electricity and Renewable Energy Authority
in Vietnam (EREA) and the Danish Energy Agency (DEA). The report should be
cited as EREA & DEA: Detailed grid modelling of the Vietnamese power system.
Background to the Vietnam Energy Outlook Report 2019 (2019)

Energy Outlook Report 2019 Grid modeling of RE scenarios and recommendations on power grid
Institute of Energy – P8 Page 3 / 36
Power System Development Department ©
Contents
1. Introduction ......................................................................................................... 4
2. Methodology ........................................................................................................ 5
2.1. PSS/E model ........................................................................................................... 5
2.2. Grid modelling methodology in this study ............................................................. 5
3. Scope of grid simulation ..................................................................................... 7
4. Power system regions ......................................................................................... 9
5. Input assumptions and harmonization with Balmorel results ....................... 9
5.1. Demand forecast and location of demand nodes in the power system ................... 9
5.2. Location of power sources in transmission grid simulation ................................. 10
5.3. Other assumptions ................................................................................................. 12
6. Calculation scenarios in the transmission grid model ................................... 13
7. Results of grid simulation corresponding to power generation
development scenarios ................................................................................................. 17
7.1. Results of grid simulation in 2020 ........................................................................ 17
7.2. Results of grid simulation in 2030 ........................................................................ 19
7.3. The additional investment cost for transmission grid corresponding to the
generation development scenarios ........................................................................................ 30
8. Conclusions ........................................................................................................ 34
References 35

Energy Outlook Report 2019 Grid modeling of RE scenarios and recommendations on power grid
Institute of Energy – P8 Page 4 / 36
Power System Development Department ©
1. Introduction
This project is carried out in parallel with and in support of the project “Capacity
building within Balmorel and scenarios”, as part of the Development Engagement 1:
“Capacity Development for long-range energy sector planning with Electricity and
Renewable Energy Agency of Viet Nam”, currently being conducted under the Energy
Partnership Programme between Viet Nam and Denmark (DEPP).
The main purpose of this project is to contribute to the Energy Outlook Report (EOR)
2019 with a detailed analysis of the transmission grid in Vietnam under a range of
scenarios and conditions of the future power system. In particular, the work herein
reported aims at:
Verifying the Balmorel modelling with respect to the grid representation.
The Balmorel model uses a simplified approach to the transmission grid with,
in total, seven transmission lines interconnecting six transmission regions. The
capacity of each of these (aggregated) lines must be the practical maximum
capacity for secure operation. This capacity may be much smaller than the sum
of the technical capacity of the lines between the transmission regions. To
verify whether the approach can be applied without overseeing essential
restrictions, the PSS/E model is used to model the transmission grid in more
detail. This aims at verifying whether any assumptions for capacity between the
regions should be revised in Balmorel. Also, the assumption about losses in the
transmission system and the investment cost per transmission interface are
reviewed.
Verifying the grid operation with large shares of wind and solar power.
Two scenarios are tested in the PSS/E model, one where the amount of
renewable power is in accordance with the REDS goals and one where the
renewable generation is 50% in 2030. Three detailed aspects are considered in
the study:
o Voltage in all grid elements based on snapshots of selected hours, where
demand and generation (per plant) are transferred from Balmorel to
PSS/E. Over and undervoltage are reported and compared with planning
values with +/- 5-10% deviations in relation to normal voltage.
o Overloading of lines and transformers.
o N-1 cases are computed: these represent the most critical errors that can
occur in the operation of the power system.

Energy Outlook Report 2019 Grid modeling of RE scenarios and recommendations on power grid
Institute of Energy – P8 Page 5 / 36
Power System Development Department ©
2. Methodology
2.1. PSS/E model
Among the power system simulation software used for power development and
planning in Vietnam, Power System Simulator for Engineering (PSS/E) is the most
commonly used. PSS/E was developed by Siemens PTI, integrating many modules
[1], including: (i) Power flow of grid in static state; (ii) Optimal power flow; (iii)
Study of symmetric and asymmetrical incidents; (iv) Simulation of the process of
electromechanical transition and stable analysis of the system [2], [3].
The elements in the grid such as transmission lines, transformers, generators,
capacitors, electric resistors, DC-AC, AC-DC converters, loads at the nodes, are
modeled in the form of mathematics. PSS/E uses algebraic methods for equation
solving, such as Fixed-Slope decoupled Newton-Raphson, Full Newton-Raphson,
Gauss-Seiden, DC Solution to determine solutions of state equations. The set of
solution describe the state of the electrical systems, such as phase angle and voltage at
the bus; active power and reactive power run on branches (lines, capacitors, series
resistance or transformers); power loss on each element and whole power system. For
the simulation of electromechanical transients occurring in the power system, PSS/E
solves the system of consecutive equations with a short time frame of several
milliseconds to observe the evolution of the mode parameters (voltage, frequency,
phase angle) when grid incidents occur.
Due to the availability of grid simulation data as input to the PSS/E software in
Vietnam, along with the popularity of software, this study proposes to use PSS/E as a
tool to simulate grid operation to verify generation development scenarios from
Balmorel.
2.2. Grid modelling methodology in this study
The output of the generation from the optimization model Balmorel is used as input to
the grid modeling with PSS/E. Balmorel optimizes the hourly output power of each
power plant in each region and the loading level of the transmission lines. The most
critical dispatching hours (or snapshots) are selected to be simulated in grid operation,
in order to check the response of the transmission system. The research methodology
follows the steps shown in Figure 1.

Energy Outlook Report 2019 Grid modeling of RE scenarios and recommendations on power grid
Institute of Energy – P8 Page 6 / 36
Power System Development Department ©
Figure 1. Methodology diagram of steps to perform grid simulation
PDP7 Revised [4], approved on March 2016 is based on three main factors in relation
to investment and expansion of the power system: load forecast, generation expansion
plan and grid expansion plan. Among the three factors, only the load forecast of PDP7
Revised is relatively close to the actual development as of today, while the generation
and grid expansion plan have seen many adjustments, such as: suspended construction
of nuclear power plants in Ninh Thuan province; delays for many coal–thermal power
plant projects (Long Phu 1, Song Hau 1, ...) or even cancelled plans (Bac Lieu thermal
power plant); building of two additional circuits of 500kV North – Central
interconnected transmission lines (Vung Ang – Quang Trach – Doc Soi – Pleiku 2)
[5]. Policies encouraging renewable energy development led to the expansion of solar
and wind power farms in South Central, Central Highlands and Western regions in the
last two years. The above mentioned adjustments have been implemented into the grid
modeling, with focus on transmission lines and substations.
The connection between the Balmorel generation and transmission expansion model
and PSS/E is performed on the basis of harmonizing data on the output power of each
Scenarios of RE
Balmorel
Simulation Load Curve
Generator
Dispatching
Boundary
Snapshots PSS/e Grid
Modeling
Power
Development
Plan 7 Revised New
Approved
Projects
Grid Expansion
and Upgrading
Meet
Loading and Voltage
requirement in N-0,
N-1
Investment Volume of
Transmission System
YES
NO
Installed Capacity
Interconnected
capacity
Energy Outlook Report 2019 Grid modeling of RE scenarios and recommendations on power grid
Institute of Energy – P8 Page 7 / 36
Power System Development Department ©
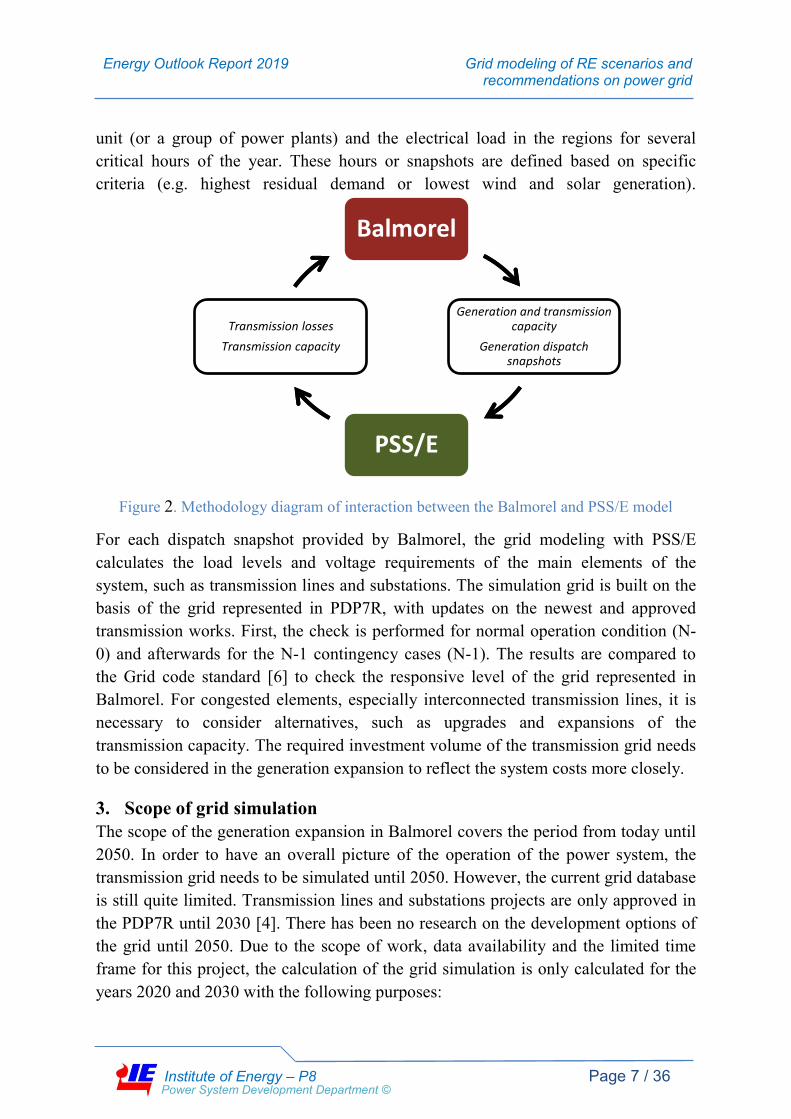
unit (or a group of power plants) and the electrical load in the regions for several
critical hours of the year. These hours or snapshots are defined based on specific
criteria (e.g. highest residual demand or lowest wind and solar generation).
Figure 2. Methodology diagram of interaction between the Balmorel and PSS/E model
For each dispatch snapshot provided by Balmorel, the grid modeling with PSS/E
calculates the load levels and voltage requirements of the main elements of the
system, such as transmission lines and substations. The simulation grid is built on the
basis of the grid represented in PDP7R, with updates on the newest and approved
transmission works. First, the check is performed for normal operation condition (N-
0) and afterwards for the N-1 contingency cases (N-1). The results are compared to
the Grid code standard [6] to check the responsive level of the grid represented in
Balmorel. For congested elements, especially interconnected transmission lines, it is
necessary to consider alternatives, such as upgrades and expansions of the
transmission capacity. The required investment volume of the transmission grid needs
to be considered in the generation expansion to reflect the system costs more closely.
3. Scope of grid simulation
The scope of the generation expansion in Balmorel covers the period from today until
2050. In order to have an overall picture of the operation of the power system, the
transmission grid needs to be simulated until 2050. However, the current grid database
is still quite limited. Transmission lines and substations projects are only approved in
the PDP7R until 2030 [4]. There has been no research on the development options of
the grid until 2050. Due to the scope of work, data availability and the limited time
frame for this project, the calculation of the grid simulation is only calculated for the
years 2020 and 2030 with the following purposes:
Balmorel
Generation and transmission capacity
Generation dispatch snapshots
PSS/E
Transmission losses
Transmission capacity
Energy Outlook Report 2019 Grid modeling of RE scenarios and recommendations on power grid
Institute of Energy – P8 Page 8 / 36
Power System Development Department ©
- Checking the feasibility of the proposed generation expansion scenario for grid
operation according to approved planning.
- Checking load level of regional transmission lines for some critical generation
operation snapshots; and providing recommendations for upgrading and
expanding the interconnected transmission lines.
- Estimating the investment cost for the transmission grid to meet the proposed
generation expansion plans.
According to the Grid code [6], the
transmission voltage level of Vietnam
power system is 500-220kV. According to
PDP7 revised, until 2030, the Vietnam
transmission power system has only 220-
500kV voltage level, while no plans are
outlined for other voltage levels (e.g. 750-
800 kV AC, 1000 kV AC, HVDC).
Therefore, the level 500-220kV is
determined as the initial assumption for the
simulation in PSS/E. In case the output
from Balmorel shows that the power
transmission between regions is large
enough and if the transmission distance is
far enough, higher–voltage transmission
solutions (800 kV, 1000 kV) or HVDC will
need to be considered in future planning.
The grid with voltages under 110kV
voltage level is called distribution grid [7].
Most of renewable energy (RE) sources,
such as PV power, wind power etc., are
connected to the distribution grid. In this
study, the distribution grid will not be
simulated in detail. Generation units and
demands that are connected to the
distribution grid will be equivalent to
220kV bus bars in transmission grid.1
1 If generation nodes under 220kV voltage do not supply enough power to the demand nodes, the power flow
will go down from transmission grid (220kV) to distribution grid via 220kV transformers. If generation nodes
under 220kV voltage can supply enough power to demand nodes and have excess power, the power flow will go
up from distribution grid to transmission grid via 220kV transformers. We simulate under a 220kV grid by flow
through 220kV transformers. The power flow on the 220kV – 500kV grid will be relatively similar to full
distribution grid simulation.
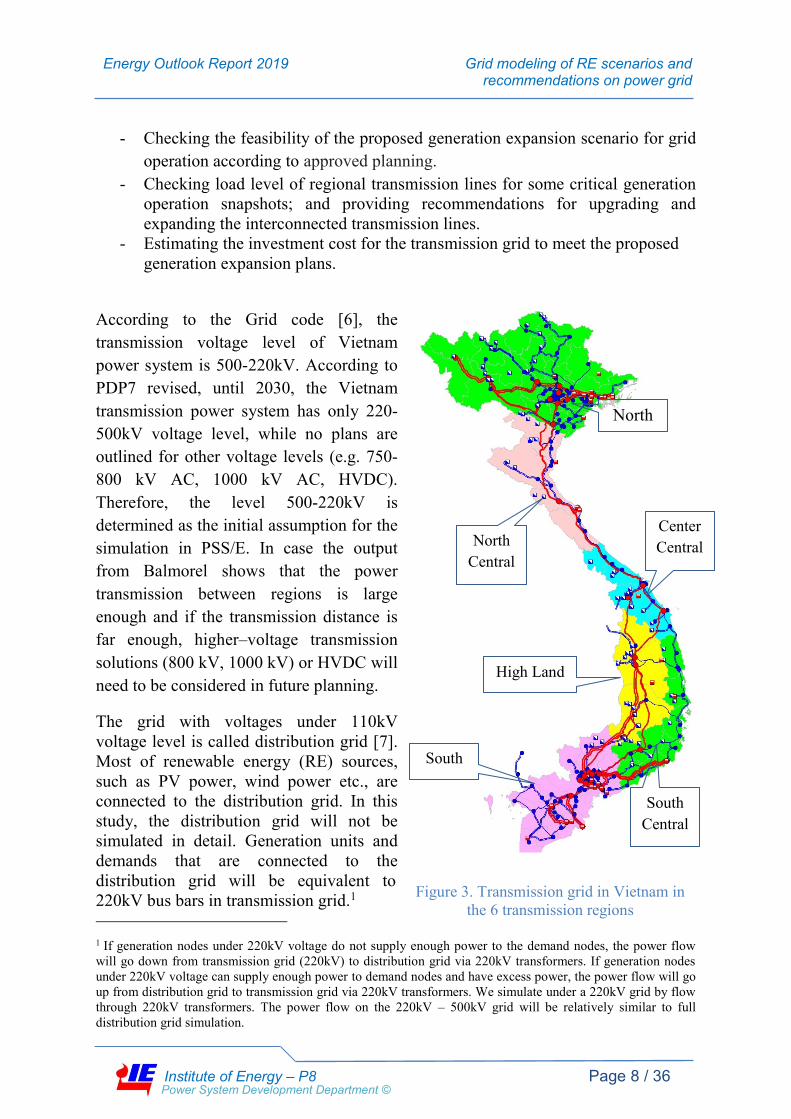
Figure 3. Transmission grid in Vietnam in
the 6 transmission regions
North
North
Central
Center
Central
High Land
South
Central
South

Energy Outlook Report 2019 Grid modeling of RE scenarios and recommendations on power grid
Institute of Energy – P8 Page 9 / 36
Power System Development Department ©
4. Power system regions
In order to simplify the analysis, based on the characteristics and structure of the grid,
the transmission system can be divided into 6 geographical regions, equivalent to the
transmission regions used in Balmorel. The details of the regional division of the
Vietnamese power system are shown in Figure 3.
The net transfer capacity (NTC) between two regions is the total capacity of the 500-
220 kV transmission lines at the interface, considering the N-1 contingency cases. This
calculation was made based on the grid configuration in PDP7R (including some
updates) for 2020 and used in the Balmorel model as the starting point for the current
interconnector capacity between the 6 regions. The transmission flow losses were also
calculated in PSS/E for each transmission line and used in the Balmorel model. They
were calculated at 80% load.
For two of the scenarios modelled by the Balmorel model, the grid simulation
program provides a check of the flow through the interfaces and compares it with the
simulation data of the generation plan, as to provide recommendations about the
response level of the grid.
5. Input assumptions and harmonization with Balmorel results
5.1. Demand forecast and location of demand nodes in the power system
The demand nodes in the power system are determined based on database of PDP7
revised [4]. The loads are updated based on the Balmorel model, to provide grid
operation snapshots, which are the most similar to the results of the Balmorel model.
The peak load (Pmax) and the electricity consumption in the regions until 2030 for
both scenarios are shown in Table 1 and Table 2.
Table 1. The forecast of Pmax in regions (MW)
No. Region PDP7R Balmorel
2020 2030 2020 2030
1 North 16,028 33,644 15,981 31,838
2 North Central 3,322 6,973 3,312 6,598
3 Centre Central 2,773 5,937 2,765 5,618
4 Highland 1,379 2,951 926 1,881
5 South Central 2,600 5,566 2,978 6,050
6 South 20,219 44,524 20,159 42,133
7 Vietnam 42,261 90,989 41,332 84,431
Table 2. The forecast of electricity consumption in regions (GWh)

Energy Outlook Report 2019 Grid modeling of RE scenarios and recommendations on power grid
Institute of Energy – P8 Page 10 / 36
Power System Development Department ©
No. Region PDP7R Balmorel
2020 2030 2020 2030
1 North 93,874 197,044 93,856 186,978
2 North Central 15,878 33,332 15,875 31,629
3 Centre Central 10,352 22,164 10,350 21,032
4 Highland 4,422 9,464 2,978 6,049
5 South Central 9,706 20,780 11,148 22,651
6 South 126,681 278,967 126,657 264,717
7 Vietnam 260,913 561,751 260,864 533,055
From the above tables, it can be seen that the location of load is unevenly distributed
among regions. Power consumption is mainly concentrated in the two extremities of
the country. The North accounts for 35% and the South accounts for 50% of the total
consumption. However, the favorable locations for the development of coal, gas,
LNG, wind and solar power plants are concentrated in low load regions such as North
Central, Highlands and South Central. This can put pressure on investment to improve
the transmission capacity between regions.
5.2. Location of power sources in transmission grid simulation
One of the outputs of the Balmorel model is the generation capacity for the years in
the period of calculation. The transmission region of the investments in new power
plants is determined by the Balmorel model. However, the exact location within each
region is not a model result. Therefore, one of the important tasks of the grid
simulation is to locate the new power plants in the system. This task clearly belongs to
the National Power Development Plan and is a relatively complex and difficult task.
However, due to the scope of the grid simulation until 2030 (i.e. the last planning year
of the approved PDP7 revised) and due to the load forecast in 2030 not being very
different from that forecasted in PDP7 revised (515-523 billion kWh compared to 561
billion kWh in PDP7 revised), the adjustments to the grid configuration in 2030
mainly relate to the adjustment of the power generation mix and the transmission lines
(i.e. replacing traditional sources by RE sources).
To construct the transmission grid in 2030 compatible with Balmorel's output, the
following data should be added:
- Generation capacity of each region (classification according to fuel type) from
the output of Balmorel, including operating time and capacity.
- List of power plants expected to operate in the period 2019-2030 according to
PDP7 revised.
- Location of new power plants that were added to the plan in the period of
2019-2030 (additional to PDP7R).

Energy Outlook Report 2019 Grid modeling of RE scenarios and recommendations on power grid
Institute of Energy – P8 Page 11 / 36
Power System Development Department ©
- 500-220kV transmission grid scheme (transmission line and substation)
approved in PDP7R.
- Potential position of power sources (classified by fuel type).
According to the review of power generation data of PDP7 revised for the period of
2019- 2030, there will be about 64 traditional power plants (coal thermal, LNG, hydro
power plants) in turn operating with total capacity of 60 GW. The locations of these
new power plants are almost clearly defined.
For small hydro power sources, there are currently about 222 power plants with total
capacity of 3000 MW. According to planning data, which is collected from provincial
power plans, the total capacity can reach 7500 MW with 509 plants until 2025. Thus,
the location of new small hydropower plants (about 4500 MW) has also been
completely identified.
Location of renewable energy sources represents the main difficulty in grid
simulation. However, currently there are some advantages as follows:
- Currently, about 100 PV power projects have been approved to provide
additional supply, with a total installed capacity of 7200 MWp. The location of
these projects has been completely determined.
- There are 500MW of wind power farms (10 projects) approved for
supplementation planning, with some of these power plants already put into
commercial operation. The location of these projects is also completely
determined.
Besides, there are currently about 108 PV power projects (total capacity of 10900
MWp) [8] and 149 wind power projects (total capacity of 14800 MW), which have
been located. These projects are preparing an application for investment.
Thus, the total capacity of solar power and wind power sources with a determined
location is about 33300 MW (18000MW of PV power and 15300 MW wind power).
The location of power plants with different types of RE sources is determined
according to the draft national RE plan until 2030 [9]. Accordingly, until 2030, there
will be about 85 power projects from Solid Waste, total capacity of about 830 MW;
100 biomass power projects, total capacity of 3000 MW; 44 geothermal projects, total
capacity of about 700 MW.
With the above reviews, until 2030, the total capacity of power plants which has a
clearly defined location, reaches about 150 GW (50 GW of existing resources and 100
GW of potential sources).

Energy Outlook Report 2019 Grid modeling of RE scenarios and recommendations on power grid
Institute of Energy – P8 Page 12 / 36
Power System Development Department ©
Distribution of solar and wind power sources implemented in PSS/E is shown in
Figure 4.
Figure 4. Location of PV solar and wind power plants.
5.3. Other assumptions
Power factor at load nodes (Cos):
The voltage on the grid depends very much on the power factor Cos at load node.
Cos usually ranges from 0.9 to 1.0. The lower the Cos, the more reactive power the
load consumes. This can lead to the lower voltage. Since the power grid simulated in
this project only represents equivalent electrical load at 220 kV nodes, it is assumed
that Cos = 0.98 – i.e. the average compared to the present (0.95-1.0).
Generator terminal voltage:
Location of PV
power plant
Location of wind
power plant
Energy Outlook Report 2019 Grid modeling of RE scenarios and recommendations on power grid
Institute of Energy – P8 Page 13 / 36
Power System Development Department ©
Traditional generators and modern inverters for wind and solar power can act as
voltage control elements on the grid, by controlling the amount of emitting reactive
power. However, the output voltage of the generators cannot be set too high or too
low and must meet the requirements of the Grid code. In the grid simulation, it is
assumed that the terminal voltage of generators varies within +/- 5% of the rated
voltage.
Limitation capacity of transmission lines: in this project, the thermal limit of
transmission line is used (except for lines over 300 km using the limit capacity
according to the condition of power system stability).
Limit capacity of 500/220 kV transformers: it is set according to the rated power of the
transformer.
Resistor, resistance of line and transformer parameters (R0, X0, B0): typical
parameters on the current transmission grid are used.
6. Calculation scenarios in the transmission grid model
There are around 8760 hours of generation dispatching mix in one year, corresponding
to 8760-time steps of load (with approximate hourly accuracy). Therefore, in theory, it
would be necessary to observe 8760 hours of power grid simulations in a year to test
the ability of the grid to respond to generation dispatching and load at the same time.
However, not all 8760 grid operation modes are critical. In the grid simulation of the
planning problem, it is often only some of most critical operation modes that are
interesting to reduce the calculated volume. If the most critical operation modes are
satisfied, the grid can respond well to the remaining operation cases.

Energy Outlook Report 2019 Grid modeling of RE scenarios and recommendations on power grid
Institute of Energy – P8 Page 14 / 36
Power System Development Department ©
Figure 5. Source operation mode on day with high load in 2020.
Figure 6. Source operation mode on day with low load in 2020.
Peak load in
evening
Off-peak load
at night
Peak load in
afternoon
Off-peak load
in evening
Residual
demand
Peak load in
evening

Energy Outlook Report 2019 Grid modeling of RE scenarios and recommendations on power grid
Institute of Energy – P8 Page 15 / 36
Power System Development Department ©
Figure 7. Source operation mode on day with high load in 2030.
Figure 8. Source operation mode on day with high wind and solar in 2030.
Peak load in
afternoon
Peak load in
evening
Off-peak load
at night
Off-peak
load at night
Residual
demand
Peak load
in evening

Energy Outlook Report 2019 Grid modeling of RE scenarios and recommendations on power grid
Institute of Energy – P8 Page 16 / 36
Power System Development Department ©
Figure 9. Source operation modes on day with low wind and solar in 2030.
The interesting operation snapshots for the simulation of the load flow in the power
system are as follow:
- Highest demand (HD)
- Lowest demand (LD)
- Highest residual demand (HRD)
- Lowest residual demand (LRD)
- Maximum total interconnected transmission capacity (HF)
- Minimum total interconnected transmission capacity (LF)
- Highest Solar and Wind (HWS)
- Lowest Solar and Wind (LWS)
The HD snapshot usually is in the period 10:00-14:00 or 19:00-21:00 [10]. The HD
snapshot is used to check the capability of transmission lines in the heaviest load
condition. The LD snapshot is the lowest load condition (usually the first days of the
lunar year - New Year holidays). In LD snapshot, voltage in the transmission grid is
often high. Therefore, the LD snapshot is used to check the voltage in the grid. In
some other calculations, the LD snapshot is considered locally to check the possibility
of releasing power from coal thermal plants and wind power plants, as this snapshot
represents the heaviest operation condition for transmission lines.
Off-peak
load at night
Residual
demand
Peak load
in evening

Energy Outlook Report 2019 Grid modeling of RE scenarios and recommendations on power grid
Institute of Energy – P8 Page 17 / 36
Power System Development Department ©
At the period 19:00-21:00 in the evening, the load is high while the output power from
PV solar is zero. This is the HRD snapshot. This snapshot is used to check the
possibility of releasing power from traditional power plants (Coal-thermal, LNG,
hydro power plants).
The LRD snapshot represent the condition with maximum output from wind and solar
PV power. This snapshot is used to check grid operation when dispatching of
traditional sources is lowest; supply grid for battery is in charge mode; and, the
possibility of releasing power from wind and PV solar power plants when the output
power of these sources is high.
The HF and LF snapshots are used to check the responsiveness of the transmission
grid in two states: the highest flow and lowest flow on all interconnections. HF is
usually a condition where sources in one region have high output power and transmit
to other regions over a large transmission distance. The LF snapshot shows minimum
level of transmission between regions to achieve the lowest system cost. If the HF and
LF are both high on transmission load for certain lines, this indicates high
transmission over a long distance, leading to large transmission losses in the power
system. This requires large investment for transmission lines.
The HWS and LWS snapshots correspond to the highest and lowest wind and solar
power in the South-Central region. These snapshots are used to assess impact of wind
and solar power on the transmission grid.
7. Results of grid simulation corresponding to power generation
development scenarios
7.1. Results of grid simulation in 2020
The simulation of the transmission grid calculation in 2020 is hardly meaningful for
planning purposes because most of power plants and transmission projects have been
constructed. This work is mostly meaningful to verify the dispatching simulation
results from Balmorel and to provide recommendations on the operation of the
transmissions grid. Especially, there will be significant occurrences of RE sources
such as wind and solar power in the Central and Southern regions in 2020.
PSS/E simulated grid operation in 8 snapshots: HD, LD, HRD, LRD, HF, LF, HWS
and LWS for the year 2020. The results can be summarized as follows.
Under normal operation conditions (N-0):
- In normal operation, i.e. HD and HWS snapshots, the congestion appeared in
some elements which release output power from RE sources in South Central at

Energy Outlook Report 2019 Grid modeling of RE scenarios and recommendations on power grid
Institute of Energy – P8 Page 18 / 36
Power System Development Department ©
HD and HWS. The 500/220kV Vinh Tan substation is 33% overloading. Da
Nhim – Duc Trong – Di Linh 220kV transmission line is 3% to 32%
overloading. 500/220kV Di Linh substation has 100% load level.
- Some elements of the transmission grid in the North and North Central regions
have a high load level in the LWS snapshot (19:00-21:00), as well as some
transmission lines from Hoa Binh hydro power plant to Ha Noi, Nho Quan –
Thanh Hoa TL.
- Transmission lines and substations have relatively light load level in the LD
and LF snapshots.
Figure 10. The overloading elements due to releasing output power of RE sources in South
Central region.
In the N-1 contingency cases (N-1):
When one element in the transmission grid has contingency, other elements could
operate under higher loading or overload in some cases. When N-1 contingency cases
make other elements overload, the N-1 criteria are not satisfied. The effect of
contingency for all 756 grid elements modelled was tested one by one.
The amount of N-1 contingency cases which result in other elements overloading are
summarized for the 8 Balmorel snapshot as follows:
96-98% (HD&HWS)
133% (HWS)
103-132%
(HD&HWS)
Energy Outlook Report 2019 Grid modeling of RE scenarios and recommendations on power grid
Institute of Energy – P8 Page 19 / 36
Power System Development Department ©
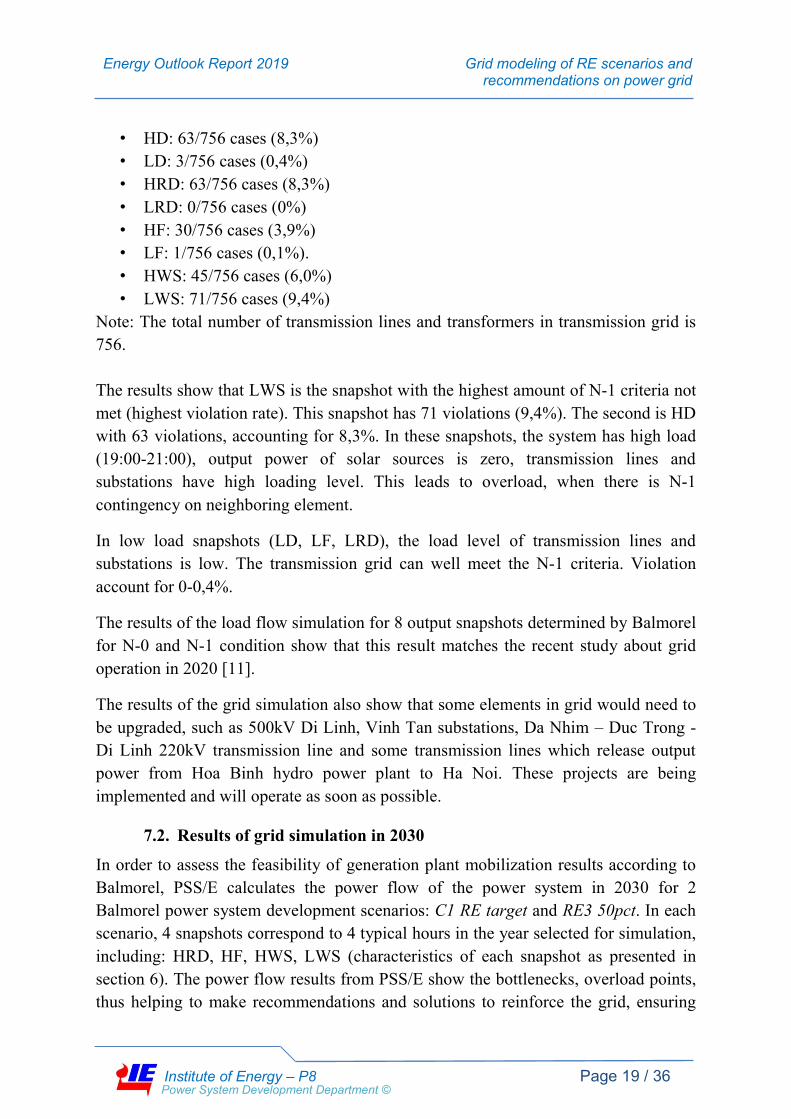
• HD: 63/756 cases (8,3%)
• LD: 3/756 cases (0,4%)
• HRD: 63/756 cases (8,3%)
• LRD: 0/756 cases (0%)
• HF: 30/756 cases (3,9%)
• LF: 1/756 cases (0,1%).
• HWS: 45/756 cases (6,0%)
• LWS: 71/756 cases (9,4%)
Note: The total number of transmission lines and transformers in transmission grid is
756.
The results show that LWS is the snapshot with the highest amount of N-1 criteria not
met (highest violation rate). This snapshot has 71 violations (9,4%). The second is HD
with 63 violations, accounting for 8,3%. In these snapshots, the system has high load
(19:00-21:00), output power of solar sources is zero, transmission lines and
substations have high loading level. This leads to overload, when there is N-1
contingency on neighboring element.
In low load snapshots (LD, LF, LRD), the load level of transmission lines and
substations is low. The transmission grid can well meet the N-1 criteria. Violation
account for 0-0,4%.
The results of the load flow simulation for 8 output snapshots determined by Balmorel
for N-0 and N-1 condition show that this result matches the recent study about grid
operation in 2020 [11].
The results of the grid simulation also show that some elements in grid would need to
be upgraded, such as 500kV Di Linh, Vinh Tan substations, Da Nhim – Duc Trong -
Di Linh 220kV transmission line and some transmission lines which release output
power from Hoa Binh hydro power plant to Ha Noi. These projects are being
implemented and will operate as soon as possible.
7.2. Results of grid simulation in 2030
In order to assess the feasibility of generation plant mobilization results according to
Balmorel, PSS/E calculates the power flow of the power system in 2030 for 2
Balmorel power system development scenarios: C1 RE target and RE3 50pct. In each
scenario, 4 snapshots correspond to 4 typical hours in the year selected for simulation,
including: HRD, HF, HWS, LWS (characteristics of each snapshot as presented in
section 6). The power flow results from PSS/E show the bottlenecks, overload points,
thus helping to make recommendations and solutions to reinforce the grid, ensuring

Energy Outlook Report 2019 Grid modeling of RE scenarios and recommendations on power grid
Institute of Energy – P8 Page 20 / 36
Power System Development Department ©
the release of power output and net transfer capacity on interfaces. The grid will be
reinforced to meet technical criteria in the normal operation condition (N-0) as well as
contingency cases (N-1). Main results are presented in the following sections.
7.2.1. C1 RE Target scenario
Transmission interfaces:
As explained above, to simplify calculations, Balmorel has divided the system into 6
geographical regions corresponding to 7 transmission interfaces including: North -
North Central, North Central - Center Central and Center Central - Highland, Center
Central - South Central, Highland - South Central, Highland - South, South Central -
South. Net transfer capacity (NTC) of interfaces considering N-1 criteria used in
PSS/E is determined by PDP7R [4] in Figure 11:
Figure 11. Net transfer capacity of 7 interfaces in 2030
After simulating by PSS/E for 4 snapshots in 2030, for the C1 RE target scenario, the
main results can be summarized as follows:
Under normal operation conditions (N-0):
In N-0 condition, most interfaces ensure transmission within the allowed range.
However, in the HF and LWS snapshots, the Highland - South interface transmits
10212 MW and 7652 MW respectively, exceeding the capacity of 6850 MW.
Specially, in the HF snapshot, many transmission lines in Highland - South interface
8124
MW
4937
MW
5500
MW
900
MW
3309
MW 6850
MW
14644
MW

Energy Outlook Report 2019 Grid modeling of RE scenarios and recommendations on power grid
Institute of Energy – P8 Page 21 / 36
Power System Development Department ©
are overloaded such as: Krongbuk - Chon Thanh 500kV line (15% overload),
Krongbuk - Tay Ninh 500kV line (18% overload), Xuan Thien Easup - Krongbuk
500kV line (25% overload) and Krongbuk 500kV substation overload heavily (229%
overload). Overload occurs mainly due to large concentrated renewable energy
sources in the Highland region, which are transmitted to the South load center. The
cause of this overload is that the transmission grid of PDP7R in 2015 does not
consider the high development of renewable energy sources (wind power, solar
power), which has occurred in the last 2 years.
Therefore, this study recommends building a new 500kV substation in Highlands
region to gather output power of renewable energy sources and directly transmit it to
the Southeast region. At the same time, in order to ensure 10 GW transmission on the
Highland – South interface, it is necessary to build at least 3 new 500kV transmission
lines from Highland to Southeast with distance of 350-400km. It is possible to
consider transmission by HVDC technology in case of difficulties in finding corridors.
As the HVDC lines occupy less land area than HVAC lines, they might be more suited
in mountainous areas.
Figure 12. Tay Nguyen – South interface expansion.
Build newly a
500kV substation
in Highland
Build newly a 500kV
substation in South to
receive power directly
from Highland
Build newly 500kV
transmission lines in
Highland – South
interface

Energy Outlook Report 2019 Grid modeling of RE scenarios and recommendations on power grid
Institute of Energy – P8 Page 22 / 36
Power System Development Department ©
In the N-1 contingency cases (N-1):
- Some 220kV transmission lines of South Central - South interface need to
improve the limit capacity. Some solutions can be considered such as: raising
limit capacity of Da My - Xuan Loc, Bao Loc - Dinh Quan; building newly 2
circuits from Phan Thiet to South.
Internal transmission grid:
Under normal operation conditions (N-0):
- Some overloaded 500kV substations playing an important role in transmitting
power of renewable energy are recommended to increase capacity such as: Lai
Chau, Thanh My and Doc Soi. In particular, Lai Chau 500 kV substation and
Thanh My 500kV substation are important point in transmission small
hydropower and imported power sources from Northern Laos and Southern
Laos.
- With the new generation development areas, it is proposed to build 500kV
substations to transfer transmission capacity to the national power system. For
example, the Dien Bien area (in the North) contributes to increasing the
purchase of electricity from Laos; Thuan Nam, Hong Liem and Thuan Bac
areas (in South Central) contributes to strengthening release of solar power and
wind power; the Huong Hoa area (in Center Central) contributes to
strengthening the release of wind power in Quang Tri; Bac Lieu area (in South)
contributes to strengthening release of wind power in Southwest.
- Towards 220kV, some lines overload such as Hai Duong TPP - Hai Duong,
Vung Ang - Formosa in HF snapshot; Phan Ri - Phan Thiet, Cam Ranh - Nha
Trang, Thap Cham - Vinh Tan, Da Nhim - Duc Trong - Di Linh in HWS
snapshot. These lines need to be upgraded limit capacity by replacing with
thermal resistant conductor.

Energy Outlook Report 2019 Grid modeling of RE scenarios and recommendations on power grid
Institute of Energy – P8 Page 23 / 36
Power System Development Department ©
- Figure 13. Some congestion areas in transmission grid.
Figure 14. Some proposed location of 500kV substation to release power sources output.
Small hydro transmission
area in North
Small hydro transmission
area in Center Central
RE transmission area in
Highland
Solar power
transmission area
in South Central
Wind power
transmission area in
South
Dien Bien
Huong Hoa
Thuan Bac
Hong Liem
Bac Lieu

Energy Outlook Report 2019 Grid modeling of RE scenarios and recommendations on power grid
Institute of Energy – P8 Page 24 / 36
Power System Development Department ©
Example: South Central HWS snapshot
For a detailed view, the report analyzes the transmission grid in South Central for the HWS
snapshot (C1 RE target scenario). According to simulation results, there are some typical
overloaded elements in region such as: Ninh Hoa – Nha Trang 220kV TL (overload 16%), Da
Nhim – Thap Cham 220kV TL (overload 22%), Thap Cham – Thuan Nam 220kV TL
(overload 68%), Phan Ri – Phan Thiets 220kV TL (5%), Ham Thuan – Phan Thiet 220kV TL
(overload 24%), Ham Thuan Nam – Ham Tan (overload 10%).
Figure 15 Overloaded elements in South Central in HWS snapshot for the C1 RE target
scenario
In order to release wind and solar power in South Central, upgrading and extension of the
transmission grid should be considered carefully in other studies. Some preliminary proposals
are as follows:
- Proposal to build 2 of 500kV substations in South Central to gather wind and solar
power in the Ninh Thuan anh Binh Thuan province to transmit to national power
system (considering Thuan Bac and Hong Liem area).
- Proposal to build a 220kV switching substation in the Ninh Son area to reduce the
load level of Da Nhim – Thap Cham 220kV TL and Thap Cham – Thuan Nam
220kV TL.
- Proposal to upgrade capacity limit of some transmission lines such as: Phan Ri –
Phan Thiet 220kV TL, Phan Thiet – Ham Thuan 220kV TL, Da Nhim – Duc Trong –
Di Linh 220kV TL.

Energy Outlook Report 2019 Grid modeling of RE scenarios and recommendations on power grid
Institute of Energy – P8 Page 25 / 36
Power System Development Department ©
In the N-1 contingency cases (N-1):
- All six regions have overloaded circuits when the other circuit fault (in case of
double-circuit line). In these cases, it is recommended to improve the limit capacity
by replacing with thermal resistant conductor or larger cross section conductor.
- Proposing to build the second circuit of current single-circuit lines having an
important role in transmitting power sources in Viet Tri - Son La, Da Nhim - Duc
Trong - Di Linh areas.
According to the simulation results, to meet the requirement of the N-1 criteria, it is
necessary to reinforce about 890km line in North, about 370km line in North Central,
about 20km line in Center Central, about 110km line in South Central, about 390km
line in Highland and about 1300km line in South.
Estimated volume of grid work to connect renewable energy sources:
According to the calculations, more construction of the transmission grid is needed in
order to connecting the power from renewable energy sources to the demand nodes,
including: about 750MVA transformer and 34km line in Center Central; about
8000MVA transformer and 180km line in South Central; about 3500MVA
transformer and 230km line in Highland; about 5500MVA transformer and 94km line
in South. Due to the large concentration of renewable energy in Highland, South
Central and South, as these areas have significant construction volumes compared to
other regions.
The total estimated volume of grid works to be built for the C1 RE target scenario in
comparison with PDP7R in the period 2020-2030 is summarized as follows:
Table 3. Estimated investment volume of grid works additional to PDP7R for C1 RE target
scenario in the period 2020-2030.
Region
500kV
transformer
(MVA)
500kV line
(km)
220kV
transformer
(MVA)
220kV line
(km)
North 6300 390 0 2318
North Central 2700 0 0 382
Center Central 6300 40 750 58
Highland 9000 1748 3500 671
South Central 4500 790 8000 1747
South 7800 60 5500 1833
Total 36600 3028 17750 7009

Energy Outlook Report 2019 Grid modeling of RE scenarios and recommendations on power grid
Institute of Energy – P8 Page 26 / 36
Power System Development Department ©
7.2.2. RE3 50 pct scenario
Transmission interface:
Under normal operation conditions (N-0):
The two generation development scenarios result in different transmission trends in
transmission interfaces. With HRD and LWS snapshots, the flow on interfaces in the
C1 RE target and RE3 50pct scenarios does not change much. However, HF and HWS
snapshots in the RE3 50pct scenario recorded a large amount of transmission power
from Highlands through Center Central and North Central, respectively, to supply
Northern load. The main reason is a strong development of renewable energy in the
South, especially solar power. Balmorel results propose the construction of about
24000 MW of solar power in the South. Demand in the South is supplied mainly by
regional solar power, so renewable energy sources in Highlands (also a strong
development of renewable energy region) mainly transmit back to North.
Figure 16. Flow on interfaces in C1 RE
target scenario (HF snapshot).
Figure 17. Flow on interfaces in RE3 50pct
scenario (HF snapshot).
7118MW
102MW
4766MW 1034MW
120MW 10212MW
8782MW
7689MW
8197MW
4727MW 858MW
228MW 2034MW
1143MW

Energy Outlook Report 2019 Grid modeling of RE scenarios and recommendations on power grid
Institute of Energy – P8 Page 27 / 36
Power System Development Department ©
Figure 18. Flow on interfaces in C1 RE
target scenario (HWS snapshot).
Figure 19. Flow on interfaces in RE3 50pct
scenario (HWS snapshot).
Due to the large amount of transmission power from Highlands to North, the net
transfer capacity of North Central - Center Central interface is not guaranteed in both
HF and HWS snapshots. Geographically, this is a narrow area so building more
transmission lines is difficult to implement. Therefore, it is recommended to consider
building a direct HVDC transmission line from Highlands to North (about 900 -
1000km).
6094MW
3115MW
341MW 225MW
958MW 5895MW
9045MW
7094MW
7697MW
6366MW 1768MW
508MW 1538MW
4812MW

Energy Outlook Report 2019 Grid modeling of RE scenarios and recommendations on power grid
Institute of Energy – P8 Page 28 / 36
Power System Development Department ©
Figure 20. Solution to build transmission line directly from Highland to North.
In the N-1 contingency cases (N-1):
In order to ensure operation in N-1 contingency cases, Dong Hoi - Dong Ha 220kV
transmission line connecting North Central - Center Central needs to be upgraded.
Internal transmission grid:
Under normal operation conditions (N-0):
- Grid reinforcement solutions for RE3 50pct scenario are inherited from C1 RE
target scenario. Here, some areas need to build 500kV substations to gather
power output such as Dien Bien, Huong Hoa, Dak Lak, Thuan Bac, Hong
Liem, Bac Lieu.
Transmission about 4000MW
from Highland to North, with
distance of 900-1000 km
Energy Outlook Report 2019 Grid modeling of RE scenarios and recommendations on power grid
Institute of Energy – P8 Page 29 / 36
Power System Development Department ©
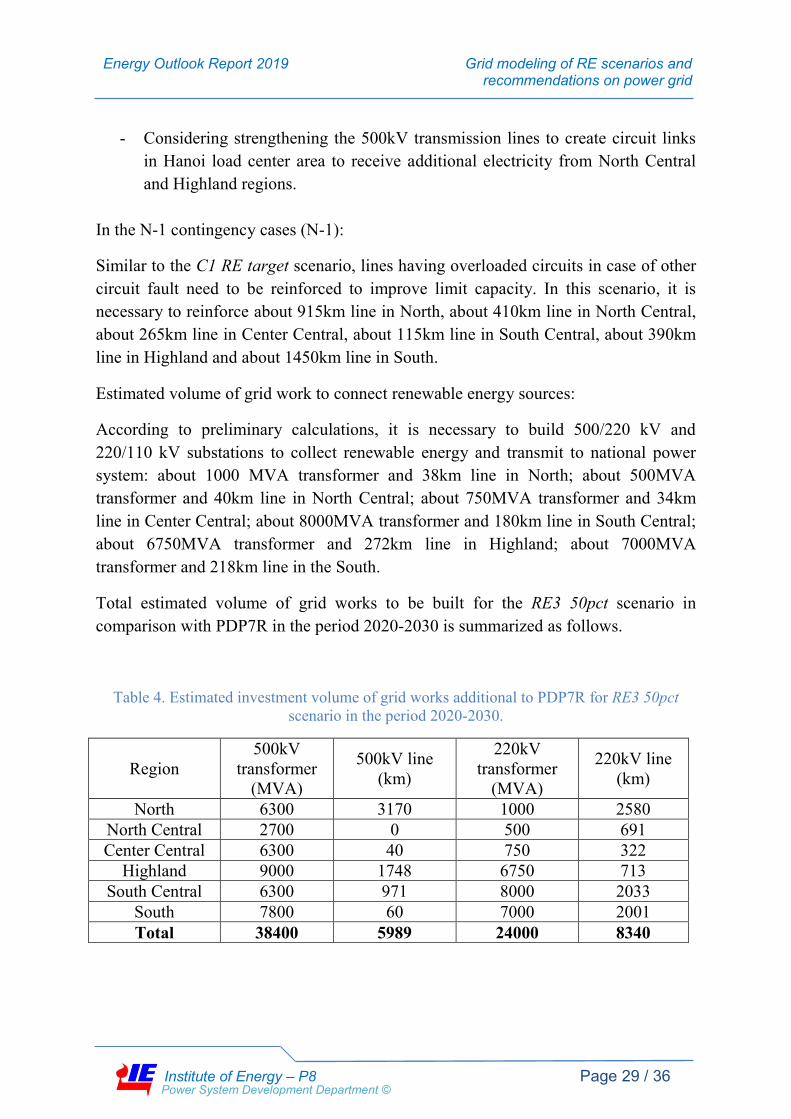
- Considering strengthening the 500kV transmission lines to create circuit links
in Hanoi load center area to receive additional electricity from North Central
and Highland regions.
In the N-1 contingency cases (N-1):
Similar to the C1 RE target scenario, lines having overloaded circuits in case of other
circuit fault need to be reinforced to improve limit capacity. In this scenario, it is
necessary to reinforce about 915km line in North, about 410km line in North Central,
about 265km line in Center Central, about 115km line in South Central, about 390km
line in Highland and about 1450km line in South.
Estimated volume of grid work to connect renewable energy sources:
According to preliminary calculations, it is necessary to build 500/220 kV and
220/110 kV substations to collect renewable energy and transmit to national power
system: about 1000 MVA transformer and 38km line in North; about 500MVA
transformer and 40km line in North Central; about 750MVA transformer and 34km
line in Center Central; about 8000MVA transformer and 180km line in South Central;
about 6750MVA transformer and 272km line in Highland; about 7000MVA
transformer and 218km line in the South.
Total estimated volume of grid works to be built for the RE3 50pct scenario in
comparison with PDP7R in the period 2020-2030 is summarized as follows.
Table 4. Estimated investment volume of grid works additional to PDP7R for RE3 50pct
scenario in the period 2020-2030.
Region
500kV
transformer
(MVA)
500kV line
(km)
220kV
transformer
(MVA)
220kV line
(km)
North 6300 3170 1000 2580
North Central 2700 0 500 691
Center Central 6300 40 750 322
Highland 9000 1748 6750 713
South Central 6300 971 8000 2033
South 7800 60 7000 2001
Total 38400 5989 24000 8340
Energy Outlook Report 2019 Grid modeling of RE scenarios and recommendations on power grid
Institute of Energy – P8 Page 30 / 36
Power System Development Department ©
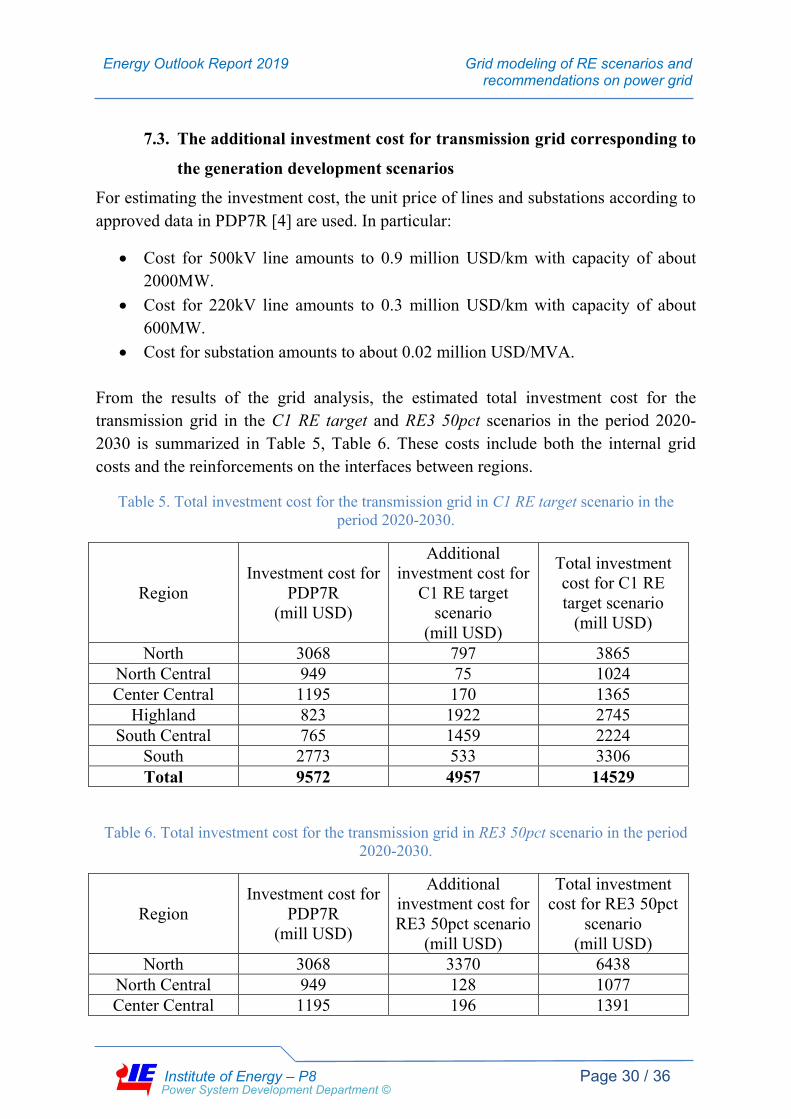
7.3. The additional investment cost for transmission grid corresponding to
the generation development scenarios
For estimating the investment cost, the unit price of lines and substations according to
approved data in PDP7R [4] are used. In particular:
Cost for 500kV line amounts to 0.9 million USD/km with capacity of about
2000MW.
Cost for 220kV line amounts to 0.3 million USD/km with capacity of about
600MW.
Cost for substation amounts to about 0.02 million USD/MVA.
From the results of the grid analysis, the estimated total investment cost for the
transmission grid in the C1 RE target and RE3 50pct scenarios in the period 2020-
2030 is summarized in Table 5, Table 6. These costs include both the internal grid
costs and the reinforcements on the interfaces between regions.
Table 5. Total investment cost for the transmission grid in C1 RE target scenario in the
period 2020-2030.
Region
Investment cost for
PDP7R
(mill USD)
Additional
investment cost for
C1 RE target
scenario
(mill USD)
Total investment
cost for C1 RE
target scenario
(mill USD)
North 3068 797 3865
North Central 949 75 1024
Center Central 1195 170 1365
Highland 823 1922 2745
South Central 765 1459 2224
South 2773 533 3306
Total 9572 4957 14529
Table 6. Total investment cost for the transmission grid in RE3 50pct scenario in the period
2020-2030.
Region
Investment cost for
PDP7R
(mill USD)
Additional
investment cost for
RE3 50pct scenario
(mill USD)
Total investment
cost for RE3 50pct
scenario
(mill USD)
North 3068 3370 6438
North Central 949 128 1077
Center Central 1195 196 1391

Energy Outlook Report 2019 Grid modeling of RE scenarios and recommendations on power grid
Institute of Energy – P8 Page 31 / 36
Power System Development Department ©
Highland 823 1996 2819
South Central 765 1756 2521
South 2773 620 3393
Total 9572 8066 17638
The total investment cost for the transmission grid for the C1 RE target scenario and
the RE3 50pct scenario increased significantly compared to PDP7R (with 150% and
185% respectively). Renewable energy sources are concentrated in South Central and
Highlands, which are low-load area. Therefore, it is necessary to invest in the interface
transmission grid. The scenario with high development of renewable energy sources
(RE3 50pct) will cause RE sources to transmit over a great distance of 900-1000 km
from Highlands to North, therefore investment cost for the transmission grid in the
RE3 50pct scenario is higher than the C1 RE target scenario by about 20%. In general,
the development of many renewable energy sources will save fuel costs and protect
the environment. On the other hand, it could result in high investments in transmission
grids.
The investment cost for the interface transmission grid accounts for about 30% of the
total investment cost. Specifically, the investment cost for each interface is as follows.
Table 7. Investment cost for interfaces in the C1 RE target scenario in the period 2020-2030.
Interface
Investment
cost for
PDP7R
(mill USD)
Additional
investment
cost for C1
RE target
scenario
(mill USD)
Total
investment
cost for C1
RE target
scenario
(mill USD)
Balmorel
investment
costs for C1
RE target
(mill. USD)
North North Central 333 0 333 964
North Central Center Central 0 0 0 0
Center Central Highland 298 0 298 240
Center Central South Central 154 0 154 674
Highland South 542 1210 1752 1328
South Central South 182 802 984 674
Highland South Central 220 69 289 0
Total 1729 2081 3810 3880

Energy Outlook Report 2019 Grid modeling of RE scenarios and recommendations on power grid
Institute of Energy – P8 Page 32 / 36
Power System Development Department ©
Table 8. Investment cost for interfaces in the RE3 50pct scenario in the period 2020-2030.
Interface
Investment
cost for
PDP7R
(mill USD)
Additional
investment
cost for RE3
50pct
scenario
(mill USD)
Total
investment
cost for RE3
50pct
scenario
(mill USD)
Balmorel
investment
costs for
RE3 50pct
(mil. USD)
North North Central 333 12 345 1039
North Central Center Central 0 21 21 682
Center Central Highland 298 0 298 240
Center Central South Central 154 0 154 300
Highland South 542 1210 1752 1211
South Central South 182 802 984 346
Highland South Central 220 69 289 0
North Highland 0 2439 2439 2439
Total 1729 4553 6282 3819
Table 9. Transmission line investment capacity for interfaces in the C1 RE target scenario in
the period 2020-2030.
Interface
Transmission
line for
PDP7R
(MW)
Additional
transmission
line for C1
RE target
scenario
(MW)
Total
transmission
line for C1
RE target
scenario
(MW)
Balmorel
transmission
line for C1
RE target
scenario
(MW)
North North Central 7034 0 7034 5355
North Central Center Central 0 0 0 0
Center Central Highland 1100 0 1100 1600
Center Central South Central 1869 0 1869 3209
Highland South 2200 5500 7700 7377
South Central South 5082 4281 9363 4496
Highland South Central 1408 899 2307 0
Total 18693 10680 29373 22037

Energy Outlook Report 2019 Grid modeling of RE scenarios and recommendations on power grid
Institute of Energy – P8 Page 33 / 36
Power System Development Department ©
Table 10. Transmission line investment for interfaces in the RE3 50pct scenario in the period
2020-2030.
As seen, compared to the investment volume of PDP7R, interface transmission grid
will need to invest twice as much for the C1 RE target scenario and 3 times for the
RE3 50pct scenario.
Interface
Transmission
line for
PDP7R
(MW)
Additional
transmission
line for RE3
50pct
scenario
(MW)
Total
transmission
line for RE3
50pct
scenario
(MW)
Balmorel
transmission
line for RE3
50pct scenario
(MW)
North North Central 7034 450 7484 5771
North Central Center Central 0 537 537 3250
Center Central Highland 1100 0 1100 1600
Center Central South Central 1869 0 1869 1430
Highland South 2200 5500 7700 6730
South Central South 5082 4281 9363 2308
Highland South Central 1408 899 2307 0
North Highland 0 4000 4000 0
Total 18693 15667 34360 21089
Energy Outlook Report 2019 Grid modeling of RE scenarios and recommendations on power grid
Institute of Energy – P8 Page 34 / 36
Power System Development Department ©
8. Conclusions
In this study, a detailed grid assessment of power system scenarios modelled in
Balmorel has been performed in the model PSS/E to analyse the implications of
increased power demand and higher RE shares on the transmission grid. The grid
simulations in PSS/E covered critical snapshots for two milestone years, 2020 and
2030, as to test the viability of the generation and grid configuration found by the
Balmorel least-cost optimization. For each of these snapshots, load levels and voltage
requirements were tested and compared to the Vietnamese grid code. Both normal (N-
0) operation conditions and (N-1) contingency cases have been considered.
For the C1 RE target scenario, some of the recommendations for safe grid operation
include, e.g. a new 500kV substation in Highlands and additional 10 GW transmission
line (three 500kV lines) to be able to transmit renewable power directly to the South
East region. In the internal grid, some additional substations are suggested to support
the system in the most congested nodes (such as in Dien Bien, Huonh Hoa, Bac Lieu,
Hong Liem and Thuan Bac).
In the RE3 50pct scenario, the strong developments of solar generation in the South
region increase the need for grid reinforcements. New solar generation in the
Highland region is mostly transmitted to the demand center in the North region. The
grid analysis results indicate that it could be worthwhile investing in a large HVDC
transmission line directly from Highlands to North, due to the mountainous area
between the two regions. Additional to the internal grid suggestions for the C1 RE
target scenario, reinforcement of the grid around Hanoi would be needed. In total, the
grid related costs (including transmission lines and substations) amount to 14.5 and
17.6 billion USD in the C1 RE target and RE3 50pct scenario respectively, for the
period 2020-2030.
Energy Outlook Report 2019 Grid modeling of RE scenarios and recommendations on power grid
Institute of Energy – P8 Page 35 / 36
Power System Development Department ©
References
[1] PTI, PSS/E Express 34.1.1 GUI Uses Guide, New York: Siemens Industry Inc,
2016.
[2] Siemens Industry, Inc., "PSS®E 34.1.1 - GUI User guide," New York, 2016.
[3] Siemens Industry, Inc., "PSS®E 33.9," New York, 2013.
[4] IE, "Vietnam Power Development Master Plan Period 2016-2025 with view 2030
- Revised edition," Ministry of Industry and Trade, Hanoi, 2016.
[5] MOIT, "Decision 2025/QD-TTg approve the investment of 500 kV Quang Trach
- Doc Soi - Pleiku 2 Transmission line," Prime Minister, Hanoi, 2017.
[6] ERAV, "Circular 12/2016/TT-BCT: Grid Code," Ministry of Industry and Trade,
Hanoi, 2016.
[7] ERAV, "Circular 39/2015/TT-BCT: Distribution code," MOIT, Hanoi, 2015.
[8] IE, "Draft report: Solar power soruce master plan up to 2030," MOIT, Hanoi,
2018.
[9] IE, "Draft Report: Renewable Energy Plan up to 2030," MOIT, Hanoi, 2018.
[10] EVN, "Annual Report 2018," EVN, Hanoi, 2019.
[11] IE, "Transmission Grid Investment Planning period 2019-2023," EVNNPT,
Hanoi, 2018.
[12] IE, Energy Statistic Yearbook 2015, Hanoi: Institute of Energy, 2017.
[13] MONRE, "The First Biannual Update Report of Vietnam under the United
Nations Framework Convention on Climate Change," MONRE, Hanoi, 2014.
[14] GIZ, Review and Update of Viet Nam's Nationally Determined Contribution for
Energy Sector, 2018.
[15] IE, "Assessments of effects of VNEEP2 in 2011-2015," MOIT, 2016.
[16] IEA, Key world energy statistics, Paris: International Energy Agency, 2017.
[17] Ea Energy Analyses and Institute of Energy, Long term fuel price projections for
Vietnam - suggested methods and prices, 2019.
[18] "Viet Nam’s Renewable Energy Development Strategy up to 2020 with an
Outlook to 2050," 2015.
[19] Van Quang Doan et al., "Offshore wind power potential in Vietnam sea," Wind
Energy, 2018.
[20] MOIT, "Draft Vietnam Renewable Energy Development Plan," 2019.
[21] EREA & DEA, "Technical background report to the Energy Outlook Report
2019," Hanoi, 2019.
[22] EREA & DEA, "Vietnam Technology Catalogue. Technology data input for
power system modelling in Vietnam," Hanoi, 2019.

Energy Outlook Report 2019 Grid modeling of RE scenarios and recommendations on power grid
Institute of Energy – P8 Page 36 / 36
Power System Development Department ©
[23] EREA & DEA, "TIMES data report. Background to the Energy Outlook Report
2019," 2019.
[24] EREA & DEA, "Fuel Price Projections for Vietnam. Background to the Vietnam
Energy Outlook Report 2019," Hanoi, 2019.
[25] EREA & DEA, "Balmorel Data Report. Background to the Vietnam Energy
Outlook Report 2019," 2019.