
Power Quality Study Capacitor Bank Failures Politeknik...
23
LOGO Power Quality Study Capacitor Bank Failures Politeknik Seberang Perai Cawangan Kejuruteraan Elektrik – UiTM Pulau Pinang
Transcript of Power Quality Study Capacitor Bank Failures Politeknik...
LOGO
Power Quality Study Capacitor Bank Failures Politeknik Seberang Perai Cawangan Kejuruteraan Elektrik – UiTM Pulau Pinang
LOGO
Cawangan Kejuruteraan Elektrik
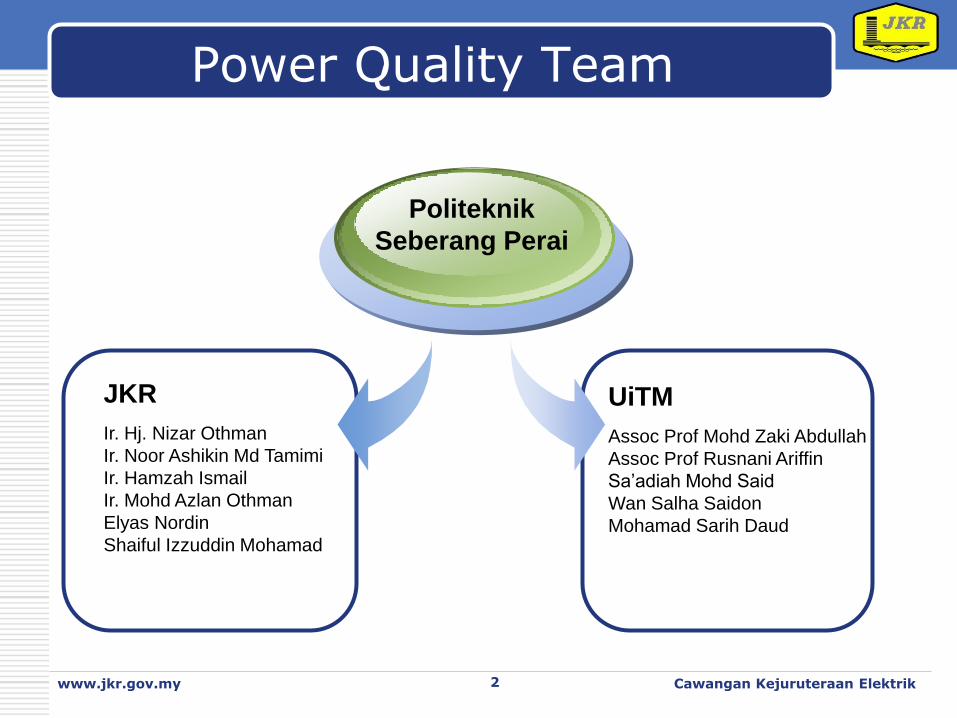
Power Quality Team
JKR
Ir. Hj. Nizar Othman
Ir. Noor Ashikin Md Tamimi
Ir. Hamzah Ismail
Ir. Mohd Azlan Othman
Elyas Nordin
Shaiful Izzuddin Mohamad
Politeknik
Seberang Perai
UiTM
Assoc Prof Mohd Zaki Abdullah
Assoc Prof Rusnani Ariffin
Sa’adiah Mohd Said
Wan Salha Saidon
Mohamad Sarih Daud
2 www.jkr.gov.my

LOGO
Cawangan Kejuruteraan Elektrik
Introduction
Politeknik Seb. Perai was opened on the 1st Sept 1998. The campus was designed to cater for the needs of 2500 people
Several capacitor bank failures are recorded at MSB No.2 located in Sub-station No.2
The types of load connected to this MSB are of inductive components i.e. welding equipment, motors etc.
3 www.jkr.gov.my
LOGO
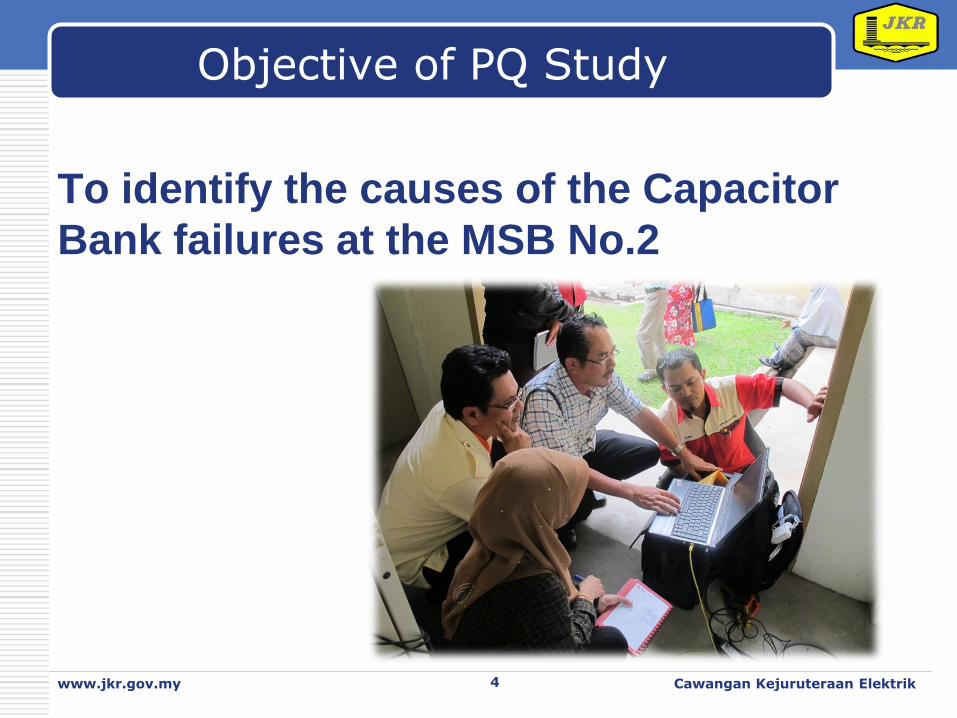
Objective of PQ Study
To identify the causes of the Capacitor
Bank failures at the MSB No.2
www.jkr.gov.my Cawangan Kejuruteraan Elektrik 4
LOGO
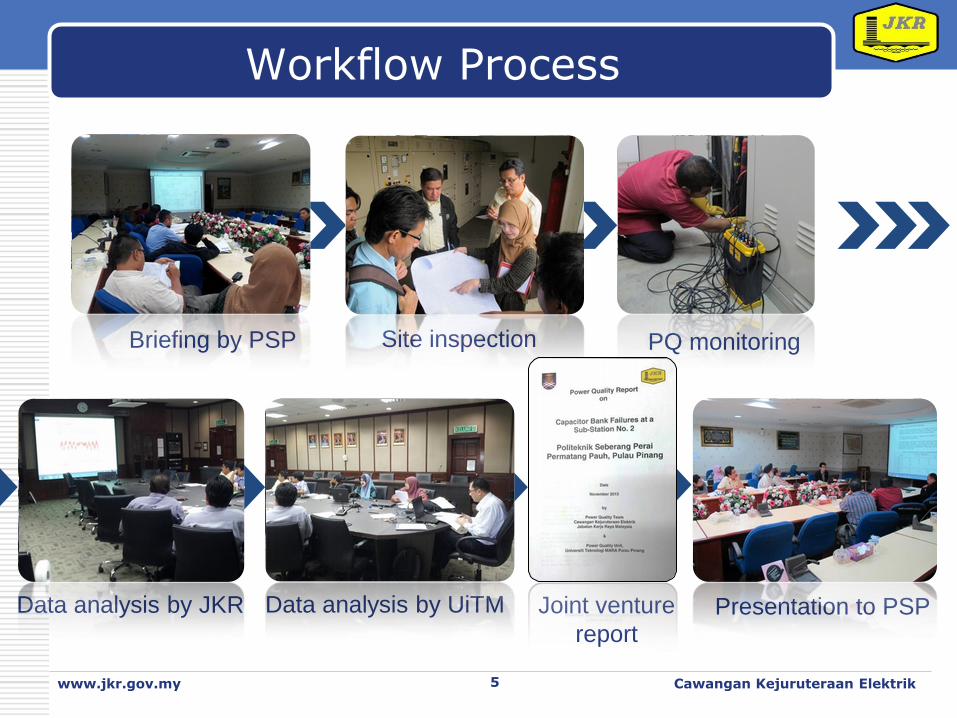
Workflow Process
www.jkr.gov.my Cawangan Kejuruteraan Elektrik 5
Briefing by PSP Site inspection PQ monitoring
Data analysis by JKR Data analysis by UiTM Joint venture
report Presentation to PSP
LOGO
Investigation Procedures
Visual inspection on the existing electrical wiring
installation system was done at the site to
identify the points of measurement required
One set of monitoring was done and a complete
data acquisition of voltage and current were
taken. The monitoring was conducted from 21st
to 31st October 2013
The instrument used was Fluke 1750 Power
Quality Analyzer.
www.jkr.gov.my Cawangan Kejuruteraan Elektrik 6
LOGO
Investigation Procedures
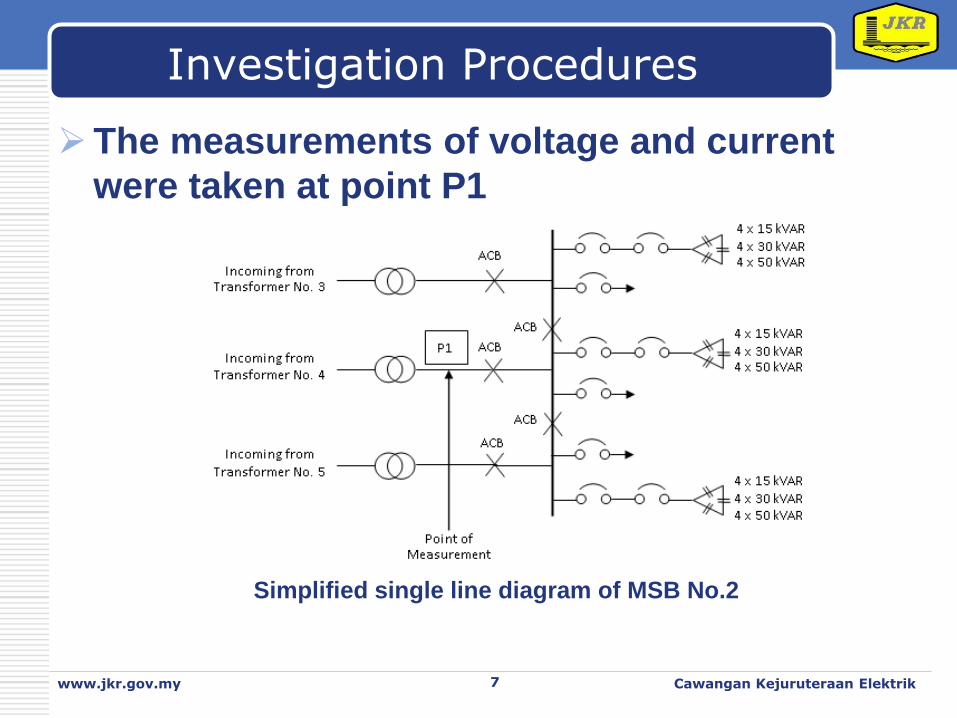
The measurements of voltage and current
were taken at point P1
www.jkr.gov.my Cawangan Kejuruteraan Elektrik 7
Simplified single line diagram of MSB No.2

LOGO
Findings
DPF and TPF are 0.879
and 0.861 respectively
If DPF and TPF differ
greatly, this indicates the
presence of harmonics
In this case, the
difference is very small
www.jkr.gov.my Cawangan Kejuruteraan Elektrik 8
Voltage, Current & Power Summary
LOGO
Findings
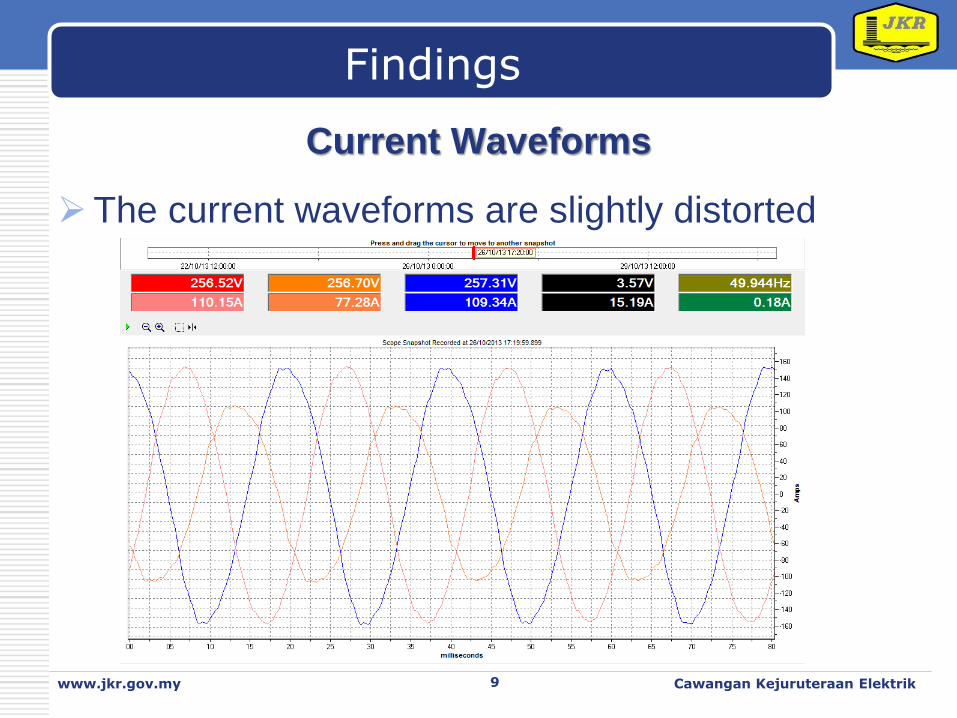
Current Waveforms
The current waveforms are slightly distorted
www.jkr.gov.my Cawangan Kejuruteraan Elektrik 9
LOGO
Findings
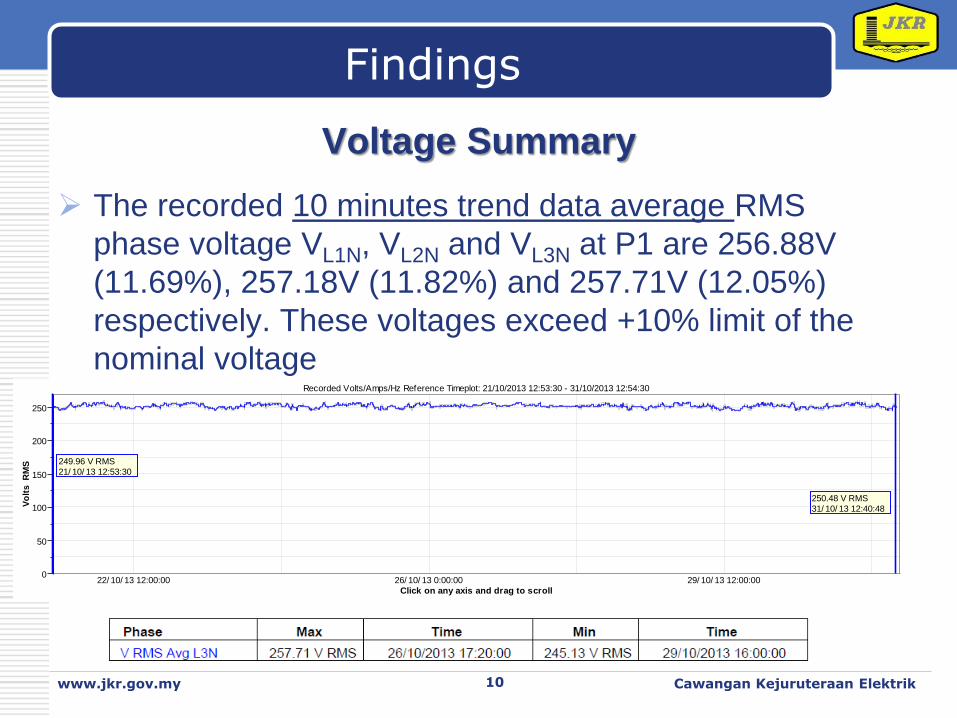
Voltage Summary
The recorded 10 minutes trend data average RMS
phase voltage VL1N, VL2N and VL3N at P1 are 256.88V
(11.69%), 257.18V (11.82%) and 257.71V (12.05%)
respectively. These voltages exceed +10% limit of the
nominal voltage
www.jkr.gov.my Cawangan Kejuruteraan Elektrik 10
22/ 10/ 13 12:00:00 26/ 10/ 13 0:00:00 29/ 10/ 13 12:00:000
50
100
150
200
250
Vo
lts R
MS
Recorded Volts/Amps/Hz Reference Timeplot: 21/10/2013 12:53:30 - 31/10/2013 12:54:30
Click on any axis and drag to scroll
249.96 V RMS
21/ 10/ 13 12:53:30
250.48 V RMS
31/ 10/ 13 12:40:48

LOGO
Findings
Voltage Summary
For recorded 10 minutes trend data of 3-phase voltage,
average RMS 3-phase voltage VL1L2, VL2L3 and VL3L1 at
P1 are 444.81 V (11.20 %), 446.33 V (11.58 %) and
445.61 V (11.40 %) respectively. These voltages exceed
the rated voltage of the capacitor (440 V)
www.jkr.gov.my Cawangan Kejuruteraan Elektrik 11
22/ 10/ 13 12:00:00 26/ 10/ 13 0:00:00 29/ 10/ 13 12:00:00
0
100
200
300
400
Vo
lts R
MS
Recorded Volts/Amps/Hz Reference Timeplot: 21/10/2013 12:53:30 - 31/10/2013 12:54:30
Click on any axis and drag to scroll
433.42 V RMS
21/ 10/ 13 12:53:37
432.98 V RMS
31/ 10/ 13 12:54:24
LOGO
22/ 10/ 13 12:00:00 26/ 10/ 13 0:00:00 29/ 10/ 13 12:00:00
242.0
244.0
246.0
248.0
250.0
252.0
254.0
256.0
258.0
260.0
Vo
lts
Recorded Volts/Amps/Hz Zoomed Detail: 21/10/2013 12:26:26 - 31/10/2013 13:21:38
DD/MM/YY HH:MM:SS
4 - 22:17:37
17.952 V RMS
Findings
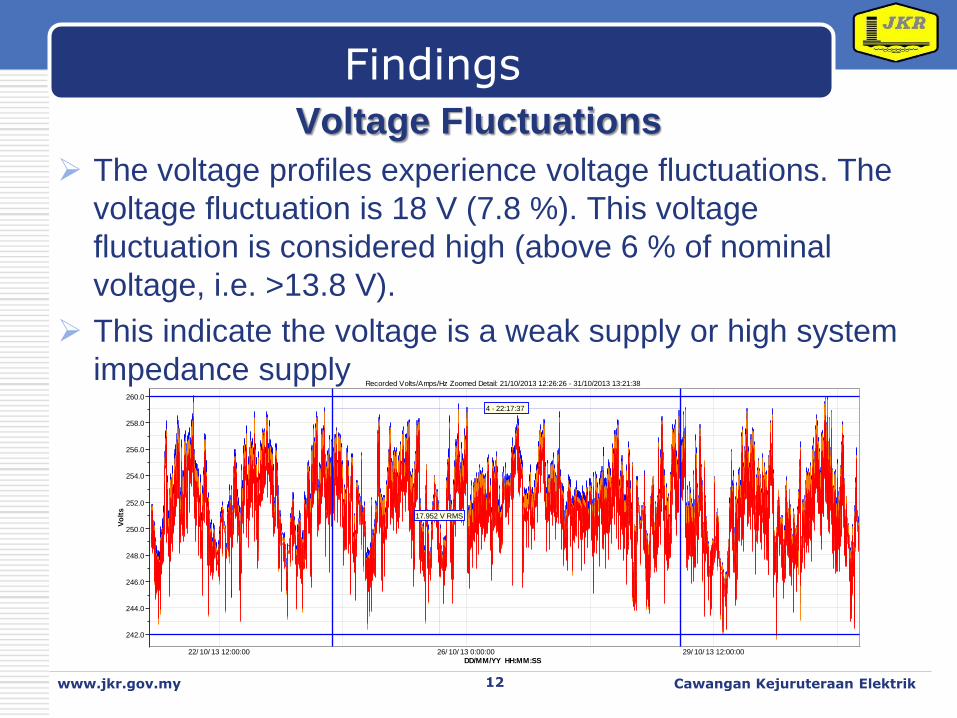
Voltage Fluctuations
The voltage profiles experience voltage fluctuations. The
voltage fluctuation is 18 V (7.8 %). This voltage
fluctuation is considered high (above 6 % of nominal
voltage, i.e. >13.8 V).
This indicate the voltage is a weak supply or high system
impedance supply
www.jkr.gov.my Cawangan Kejuruteraan Elektrik 12
LOGO
Findings
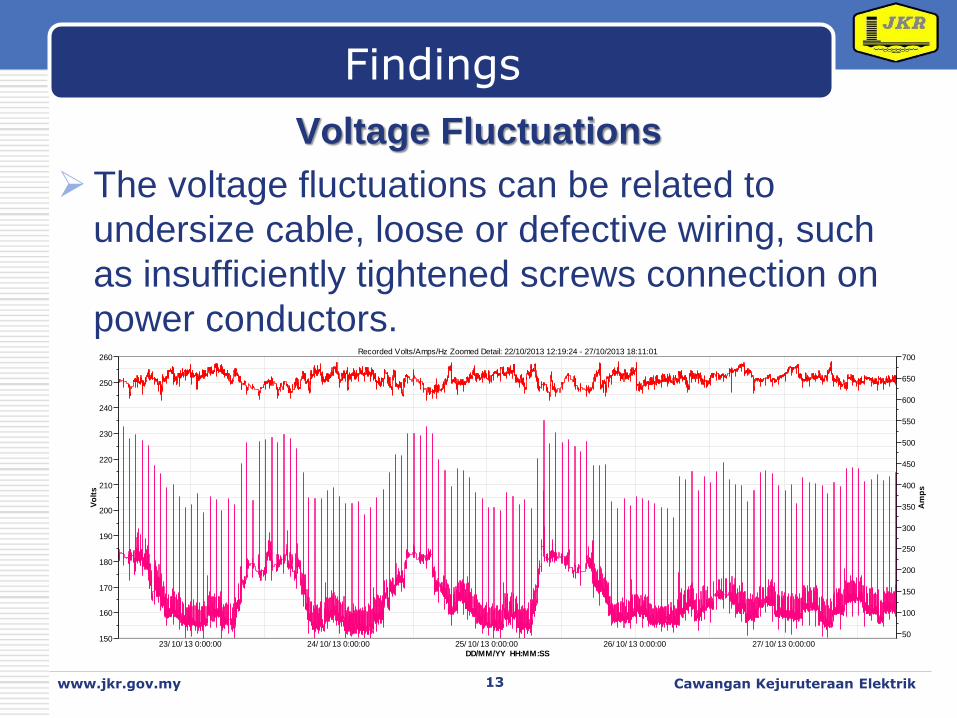
Voltage Fluctuations
The voltage fluctuations can be related to
undersize cable, loose or defective wiring, such
as insufficiently tightened screws connection on
power conductors.
www.jkr.gov.my Cawangan Kejuruteraan Elektrik 13
23/ 10/ 13 0:00:00 24/ 10/ 13 0:00:00 25/ 10/ 13 0:00:00 26/ 10/ 13 0:00:00 27/ 10/ 13 0:00:00150
160
170
180
190
200
210
220
230
240
250
260
Vo
lts
50
100
150
200
250
300
350
400
450
500
550
600
650
700
Am
ps
Recorded Volts/Amps/Hz Zoomed Detail: 22/10/2013 12:19:24 - 27/10/2013 18:11:01
DD/MM/YY HH:MM:SS
LOGO
Findings
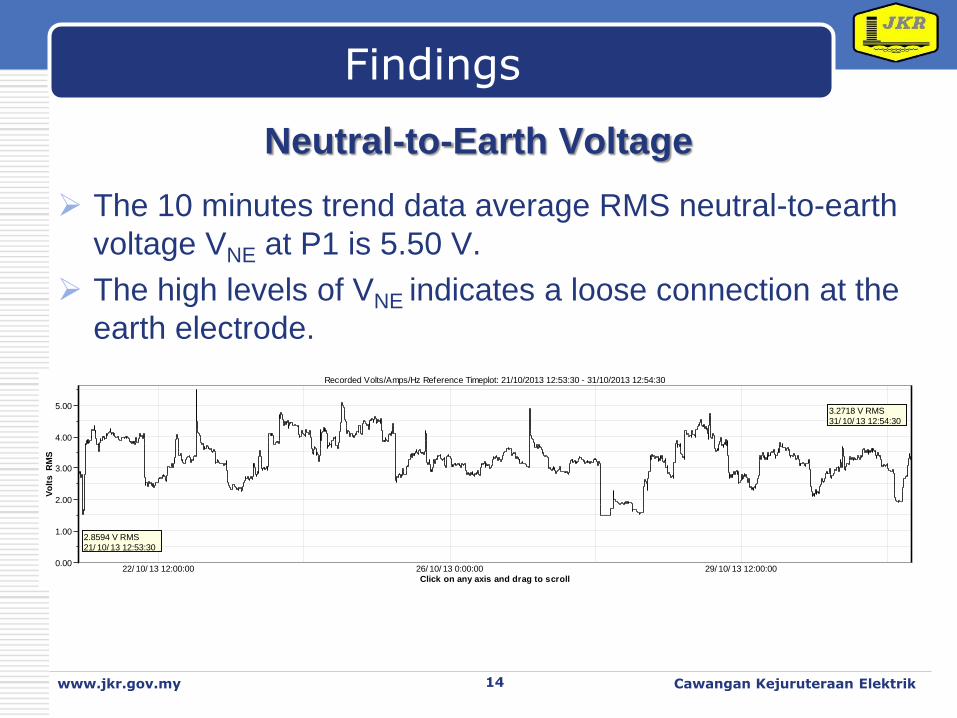
Neutral-to-Earth Voltage
The 10 minutes trend data average RMS neutral-to-earth
voltage VNE at P1 is 5.50 V.
The high levels of VNE indicates a loose connection at the
earth electrode.
www.jkr.gov.my Cawangan Kejuruteraan Elektrik 14
22/ 10/ 13 12:00:00 26/ 10/ 13 0:00:00 29/ 10/ 13 12:00:000.00
1.00
2.00
3.00
4.00
5.00
Vo
lts R
MS
Recorded Volts/Amps/Hz Reference Timeplot: 21/10/2013 12:53:30 - 31/10/2013 12:54:30
Click on any axis and drag to scroll
2.8594 V RMS
21/ 10/ 13 12:53:30
3.2718 V RMS
31/ 10/ 13 12:54:30
LOGO
Findings
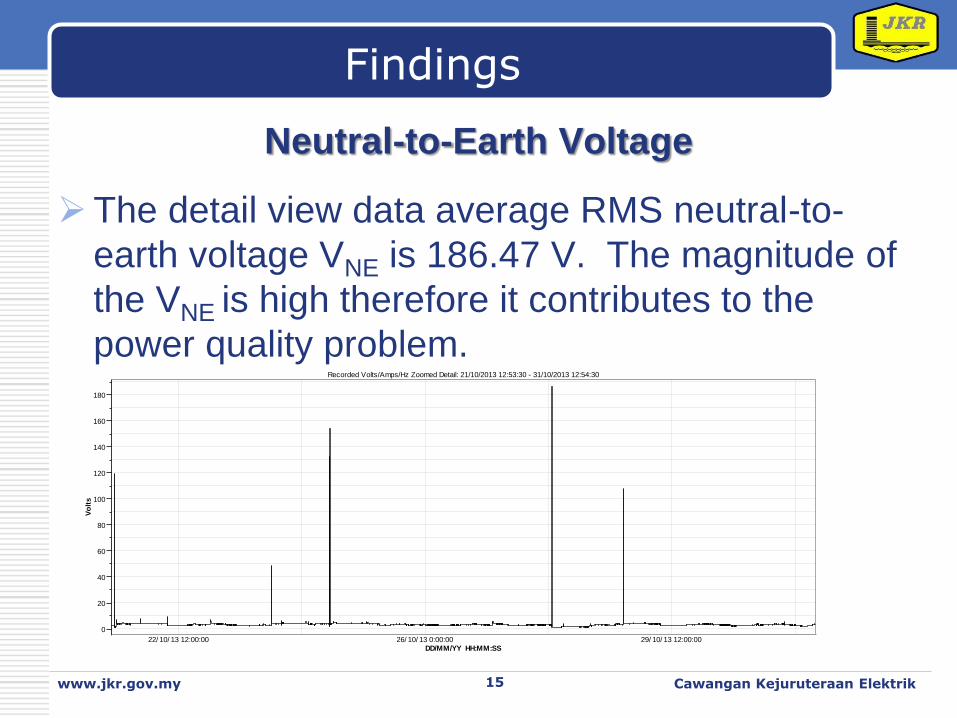
Neutral-to-Earth Voltage
The detail view data average RMS neutral-to-
earth voltage VNE is 186.47 V. The magnitude of
the VNE is high therefore it contributes to the
power quality problem.
www.jkr.gov.my Cawangan Kejuruteraan Elektrik 15
22/ 10/ 13 12:00:00 26/ 10/ 13 0:00:00 29/ 10/ 13 12:00:00
0
20
40
60
80
100
120
140
160
180
Vo
lts
Recorded Volts/Amps/Hz Zoomed Detail: 21/10/2013 12:53:30 - 31/10/2013 12:54:30
DD/MM/YY HH:MM:SS
LOGO
Findings
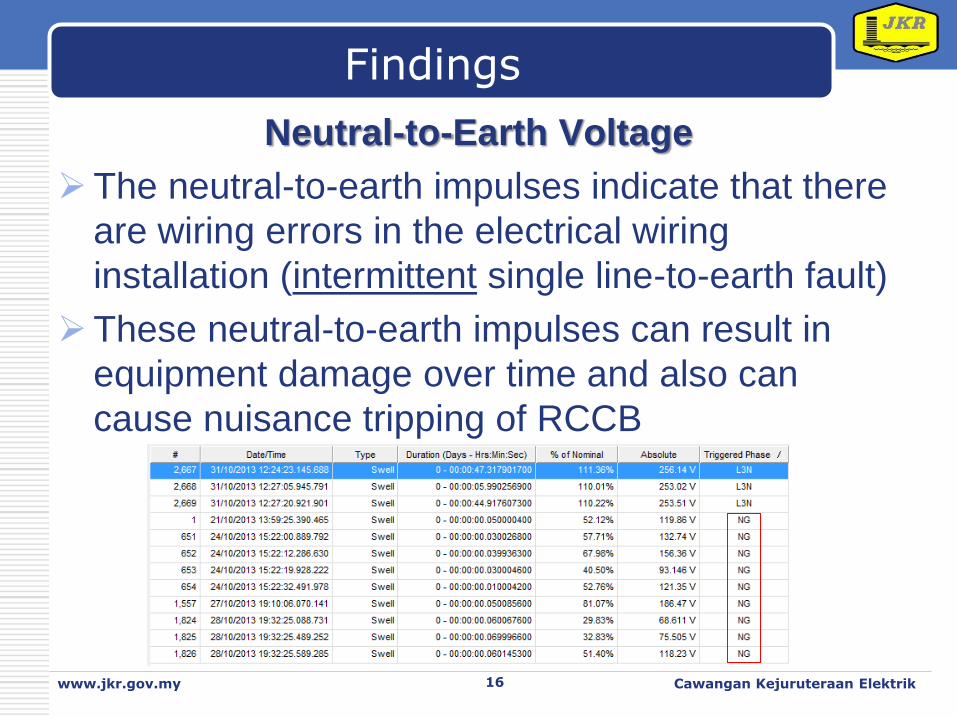
Neutral-to-Earth Voltage
The neutral-to-earth impulses indicate that there
are wiring errors in the electrical wiring
installation (intermittent single line-to-earth fault)
These neutral-to-earth impulses can result in
equipment damage over time and also can
cause nuisance tripping of RCCB
www.jkr.gov.my Cawangan Kejuruteraan Elektrik 16
LOGO
Findings
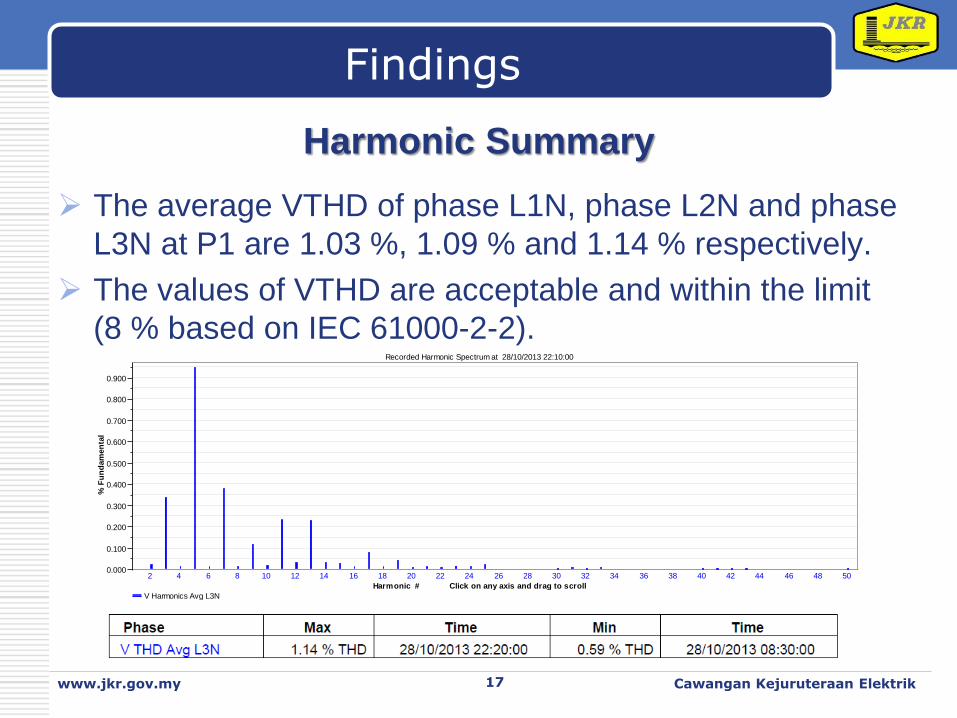
Harmonic Summary
The average VTHD of phase L1N, phase L2N and phase
L3N at P1 are 1.03 %, 1.09 % and 1.14 % respectively.
The values of VTHD are acceptable and within the limit
(8 % based on IEC 61000-2-2).
www.jkr.gov.my Cawangan Kejuruteraan Elektrik 17
2 4 6 8 10 12 14 16 18 20 22 24 26 28 30 32 34 36 38 40 42 44 46 48 500.000
0.100
0.200
0.300
0.400
0.500
0.600
0.700
0.800
0.900
% F
un
dam
en
tal
Recorded Harmonic Spectrum at 28/10/2013 22:10:00
Harmonic # Click on any axis and drag to scroll
V Harmonics Avg L3N

LOGO
Findings
Harmonic Summary
The average ITHD of phase L1, phase L2 and phase L3
at P1 are 2.88 %, 3.43 % and 2.75 % respectively. The
values of ITHD are low therefore they do not contribute
to the distortion of the supply voltage
Evaluation of the results clearly shows that the capacitor
failures at MSB No. 2 are not caused by harmonics.
www.jkr.gov.my Cawangan Kejuruteraan Elektrik 18
2 4 6 8 10 12 14 16 18 20 22 24 26 28 30 32 34 36 38 40 42 44 46 48 500.00
1.00
2.00
3.00
4.00
5.00
6.00
7.00
% F
un
dam
en
tal
Recorded Harmonic Spectrum at 25/10/2013 22:00:00
Harmonic # Click on any axis and drag to scroll
6.85 %
L2 h13
A Harmonics Avg L2
LOGO
Findings
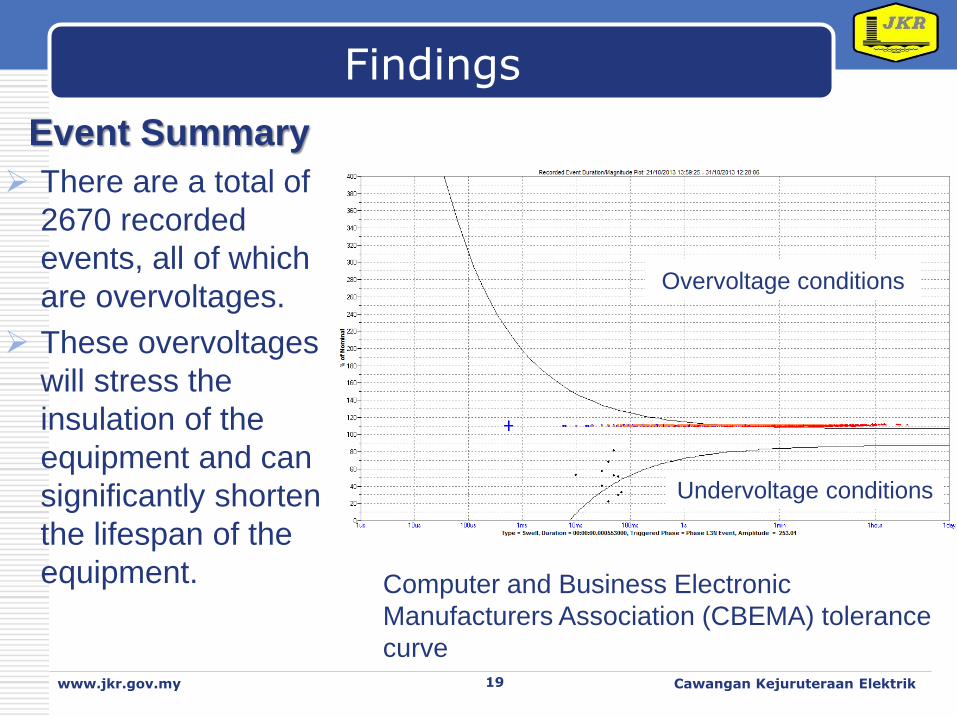
Event Summary
There are a total of
2670 recorded
events, all of which
are overvoltages.
These overvoltages
will stress the
insulation of the
equipment and can
significantly shorten
the lifespan of the
equipment.
www.jkr.gov.my Cawangan Kejuruteraan Elektrik 19
Overvoltage conditions
Undervoltage conditions
Computer and Business Electronic
Manufacturers Association (CBEMA) tolerance
curve
LOGO
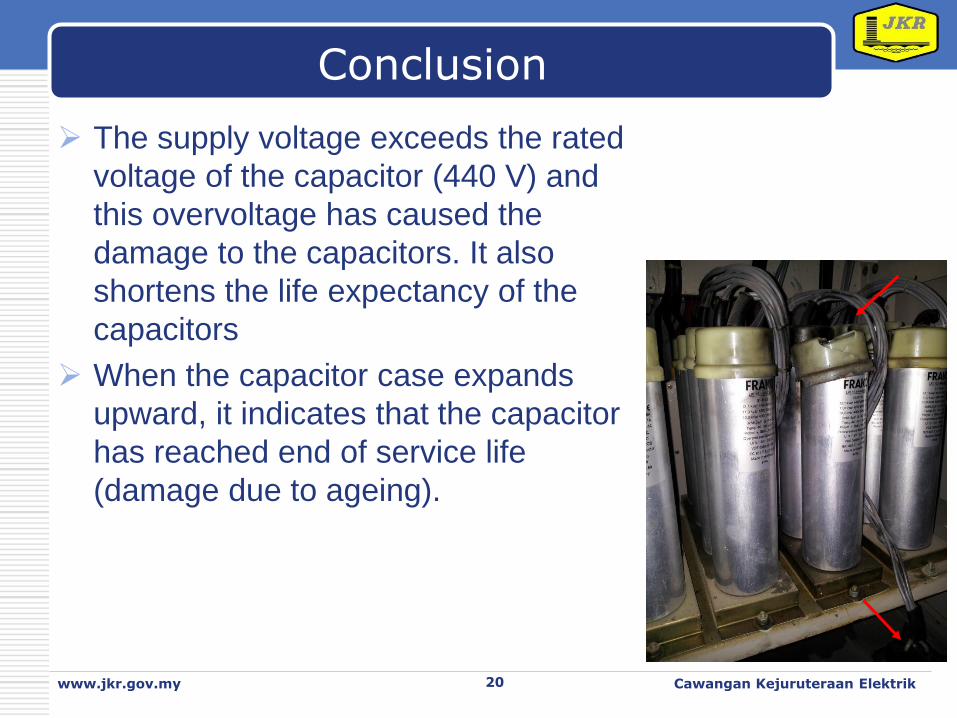
Conclusion
The supply voltage exceeds the rated
voltage of the capacitor (440 V) and
this overvoltage has caused the
damage to the capacitors. It also
shortens the life expectancy of the
capacitors
When the capacitor case expands
upward, it indicates that the capacitor
has reached end of service life
(damage due to ageing).
www.jkr.gov.my Cawangan Kejuruteraan Elektrik 20
LOGO
Recommendations
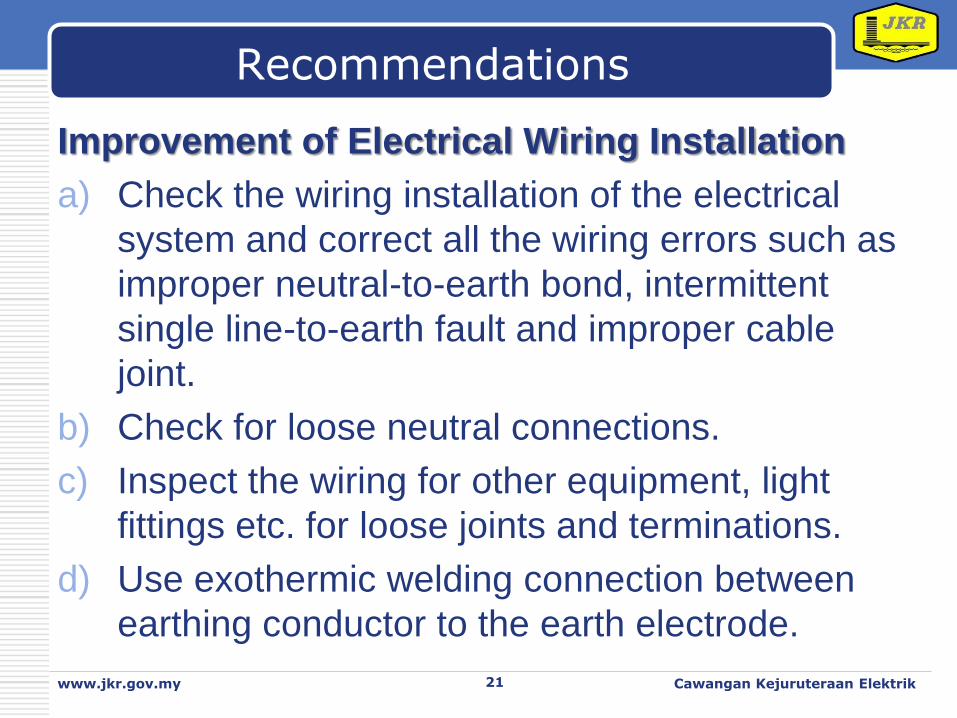
Improvement of Electrical Wiring Installation
a) Check the wiring installation of the electrical
system and correct all the wiring errors such as
improper neutral-to-earth bond, intermittent
single line-to-earth fault and improper cable
joint.
b) Check for loose neutral connections.
c) Inspect the wiring for other equipment, light
fittings etc. for loose joints and terminations.
d) Use exothermic welding connection between
earthing conductor to the earth electrode.
www.jkr.gov.my Cawangan Kejuruteraan Elektrik 21
LOGO
Recommendations
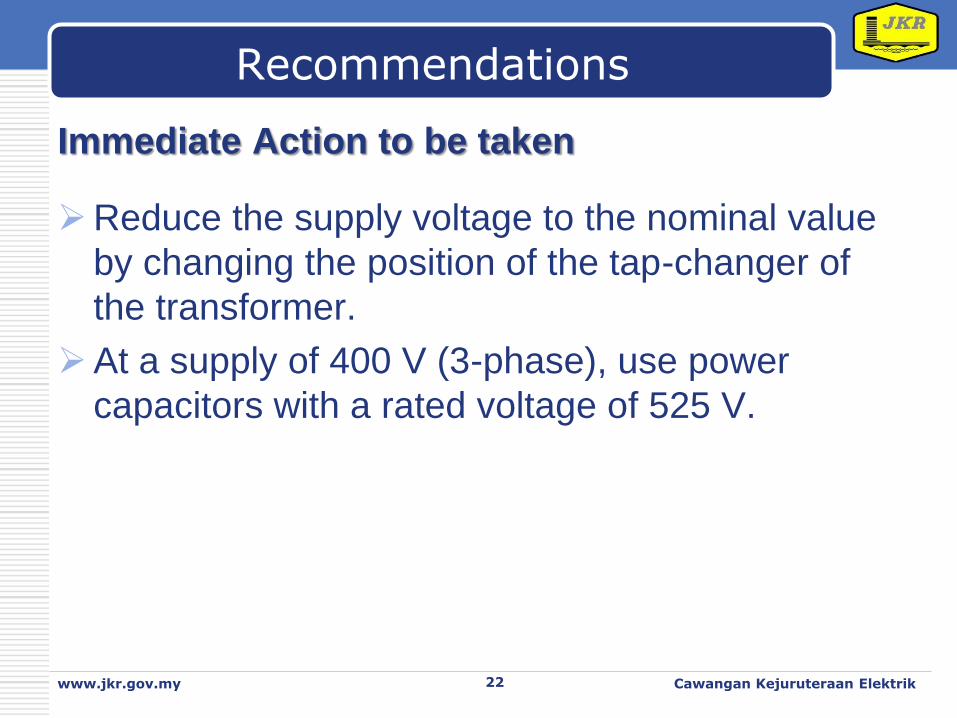
Immediate Action to be taken
Reduce the supply voltage to the nominal value
by changing the position of the tap-changer of
the transformer.
At a supply of 400 V (3-phase), use power
capacitors with a rated voltage of 525 V.
www.jkr.gov.my Cawangan Kejuruteraan Elektrik 22

LOGO
PQ Team, CKE


![PROGRAM PENSIJILAN JABATAN KERJA RAYA MALAYSIA · 2019-05-03 · kerja raya malaysia garis panduan permohonan pensijilan disiplin awam [kejuruteraan jambatan] cawangan jalan, ibu](https://static.fdocuments.net/doc/165x107/5d287f4088c99392328bf54e/program-pensijilan-jabatan-kerja-raya-2019-05-03-kerja-raya-malaysia-garis.jpg)


