
Power Quality Problems Generated by Line Frequency Coreless Induction Furnaces.pdf
27
10 Power Quality Problems Generated by Line Frequency Coreless Induction Furnaces Angela Iagăr Politechnica University Timişoara Romania 1. Introduction The increased problems in power networks impose to identify the sources of power quality deterioration. The most important parameters which affect power quality are harmonics, voltage instability and reactive power burden (Arrillaga et al., 2000). They cause low system efficiency, poor power factor, cause disturbance to other consumers and interference in the nearly communication networks (Lattarulo, 2007; De la Rosa, 2006; Muzi, 2008). In induction melting is noticed mainly the efficiency, high heating rate and the reduced oxidation level of the processed material, the improved work conditions and the possibility of an accurate control of the technological processes (Rudnev et al., 2002). Induction heating equipments do not introduce dust and noise emissions in operation, but cause power quality problems in the electric power system (Nuns et al., 1993). Induction-melt furnaces supplies by medium frequency converters generate fixed and variable frequency harmonics. Both current and voltage-fed inverters generate harmonics back into power lines in the process of rectifying AC to DC (EPRI, 1999). Harmonics flowing in the network causing additional losses and decreasing the equipments lifetime. Also, the harmonics can interfere with control, communication or protection equipments (Arrillaga et al., 2000; George & Agarwal, 2008). In addition to the harmonics that are normally expected from different pulse rectifiers, large furnaces operating at a few hundred hertz can generate interharmonics (EPRI, 1999). Interharmonics can overload power system capacitors, introduce noise into transformers, cause lights to flicker, instigate UPS alarms, and trip adjustable-speed drives. High-frequency systems, which operate at greater than 3 kHz are relatively small and limited to special applications. Electromagnetic pollution produced by the operation of these equipments is small. The induction furnaces supplied at line frequency (50 Hz) are of high capacity and represent great power consumers. Being single-phase loads, these furnaces introduce unbalances that lead to the increasing of power and active energy losses in the network. In case of channel furnaces it was found the presence of harmonics in the current absorbed from the power supply network. These harmonics can be determined by the non-sinusoidal supply voltages or the load’s nonlinearity, owed to the saturation of the magnetic circuit (Nuns et al., 1993). This chapter presents a study about power quality problems introduced by the operation of line frequency coreless induction furnaces. The specialty literature does not offer detailed information regarding the harmonic distortion in the case of these furnaces. www.intechopen.com
-
Upload
ostojic007 -
Category
Documents
-
view
20 -
download
1
Transcript of Power Quality Problems Generated by Line Frequency Coreless Induction Furnaces.pdf

10
Power Quality Problems Generated by Line Frequency Coreless Induction Furnaces
Angela Iagăr Politechnica University Timişoara
Romania
1. Introduction
The increased problems in power networks impose to identify the sources of power quality deterioration. The most important parameters which affect power quality are harmonics, voltage instability and reactive power burden (Arrillaga et al., 2000). They cause low system efficiency, poor power factor, cause disturbance to other consumers and interference in the nearly communication networks (Lattarulo, 2007; De la Rosa, 2006; Muzi, 2008). In induction melting is noticed mainly the efficiency, high heating rate and the reduced oxidation level of the processed material, the improved work conditions and the possibility of an accurate control of the technological processes (Rudnev et al., 2002). Induction heating equipments do not introduce dust and noise emissions in operation, but cause power quality problems in the electric power system (Nuns et al., 1993). Induction-melt furnaces supplies by medium frequency converters generate fixed and variable frequency harmonics. Both current and voltage-fed inverters generate harmonics back into power lines in the process of rectifying AC to DC (EPRI, 1999). Harmonics flowing in the network causing additional losses and decreasing the equipments lifetime. Also, the harmonics can interfere with control, communication or protection equipments (Arrillaga et al., 2000; George & Agarwal, 2008). In addition to the harmonics that are normally expected from different pulse rectifiers, large furnaces operating at a few hundred hertz can generate interharmonics (EPRI, 1999). Interharmonics can overload power system capacitors, introduce noise into transformers, cause lights to flicker, instigate UPS alarms, and trip adjustable-speed drives. High-frequency systems, which operate at greater than 3 kHz are relatively small and limited to special applications. Electromagnetic pollution produced by the operation of these equipments is small. The induction furnaces supplied at line frequency (50 Hz) are of high capacity and represent great power consumers. Being single-phase loads, these furnaces introduce unbalances that lead to the increasing of power and active energy losses in the network. In case of channel furnaces it was found the presence of harmonics in the current absorbed from the power supply network. These harmonics can be determined by the non-sinusoidal supply voltages or the load’s nonlinearity, owed to the saturation of the magnetic circuit (Nuns et al., 1993). This chapter presents a study about power quality problems introduced by the operation of line frequency coreless induction furnaces. The specialty literature does not offer detailed information regarding the harmonic distortion in the case of these furnaces.
www.intechopen.com

Power Quality Harmonics Analysis and Real Measurements Data
236
2. Electrical installation of the induction-melt furnace
The analyzed coreless induction furnace has 12.5 t capacity of cast-iron; the furnace is supplied from the three-phase medium-voltage network (6 kV) through a transformer in
/ connection, with step-variable voltage. Load balancing of the three-phase network is currently achieved by a Steinmetz circuit, and the power factor correction is achieved by means of some step-switching capacitor banks (fig.1). In the electric scheme from fig. 1: Q1 is an indoor three-poles disconnector, type STIm–10–1250 (10 kV, 1250 A), Q2 is an automatic circuit-breaker OROMAX (6 kV, 2500 A), T is the furnace transformer (2625 kVA; 6/1.2 kV), K1 is a contactor (1600 A), (1) is the Steinmetz circuit used to balance the line currents, (2) is the power factor compensation installation, TC1m, TC2m, TC3m (300/5 A) and TC1, TC2, TC3 (1600/5 A) are current transformers, TT1m (6000/100 V), TT1 (1320/110 V) are voltage transformers, and M is the flexible connection of the induction furnace CI. Within the study the following physical aspects were taken into account: - induction heating of ferromagnetic materials involve complex and strongly coupled
phenomena (generating of eddy currents, heat transfer, phase transitions and mechanical stress of the processed material);
- the resistivity of cast-iron increases with temperature; - the relative magnetic permeability of the cast-iron changes very fast against
temperature near to the Curie point (above the Curie temperature the cast-iron becomes paramagnetic).
As consequence, will be present the influence of the following factors upon the energetic
parameters of the installation: furnace charge, furnace supply voltage, load balancing
installation and the one of power factor compensation.
3. Measured signals in electrical installation of the induction furnace
The measurements have been made both in the secondary (Low Voltage Line - LV Line) and
in the primary (Medium Voltage Line - MV Line) of the furnace transformer, using the
CA8334 three-phase power quality analyzer. CA8334 gave an instantaneous image of the
main characteristics of power quality for the analyzed induction furnace. The main
parameters measured by the CA8334 analyser were: TRMS AC phase voltages and TRMS
AC line currents; peak voltage and current; active, reactive and apparent power per phase;
harmonics for voltages and currents up to the 50th order (CA8334, technical handbook,
2007).
CA8334 analyser provide numerous calculated values and processing functions in compliance with EMC standards in use (EN 50160, IEC 61000-4-15, IEC 61000-4-30, IEC 61000-4-7, IEC 61000-3-4). The most significant moments during the induction melting process of the cast-iron charge were considered: - cold state of the charge (after 15 minutes from the beginning of the heating process); - intermediate state (after 5 hours and 40 minutes from the beginning of the heating
process); - the end of the melting (after 8 hours from the beginning of the heating process). Further are presented the waveforms and harmonic spectra of the phase voltages and line
currents measured during the heating of the charge (Iagăr et al, 2009).
www.intechopen.com

Power Quality Problems Generated by Line Frequency Coreless Induction Furnaces
237
Fig. 1. Electric scheme of the analyzed furnace
www.intechopen.com

Power Quality Harmonics Analysis and Real Measurements Data
238
Fig. 2. Waveforms and harmonic spectra of the phase voltages in the cold state of the charge (LV Line)
Fig. 3. Waveforms and harmonic spectra of the phase voltages in the cold state of the charge (MV Line)
In the first heating stage, the electromagnetic disturbances of the phase voltages on LV Line
and on MV Line are very small. The 5th harmonic does not exceed the compatibility limit,
but the voltage interharmonics exceed the compatibility limits (IEC 61000-3-4, 1998; IEC/TR
61000-3-6, 2005).
On MV Line the current I2 was impossible to be measured because the CA8334 three-phase
power quality analyser was connected to the watt-hour meter input. The watt-hour meter
had three voltages (U12, U23, U31) and two currents (I1 and I3).
Waveform distortion of the currents in cold state is large (fig. 4, 5). At the beginning of
the cast-iron heating the 3rd, 5th, 7th, 9th, 11th, 13th, 15th harmonics and even harmonics (2nd,
4th, 6th, 8th) are present in the currents on the LV Line. The 5th and 15th harmonics exceed the
compatibility limits (IEC 61000-3-4, 1998).
In the cold state the 2nd, 3rd, 5th, 7th, 9th, 11th, 13th and 15th harmonics are present in the
currents absorbed from the MV Line. The 5th harmonic exceeds the compatibility limits
(IEC/TR 61000-3-6, 2005).
In the intermediate state, part of the charge is heated above the Curie temperature and
becomes paramagnetic, and the rest of the charge still has ferromagnetic properties. The
furnace charge is partially melted.
www.intechopen.com

Power Quality Problems Generated by Line Frequency Coreless Induction Furnaces
239
Fig. 4. Waveforms and harmonic spectra of the line currents in the cold state of the charge (LV Line)
Fig. 5. Waveforms and harmonic spectra of the line currents in the cold state of the charge (MV Line)
Fig. 6. Waveforms and harmonic spectra of the phase voltages in the intermediate state (LV Line)
www.intechopen.com

Power Quality Harmonics Analysis and Real Measurements Data
240
Fig. 7. Waveforms and harmonic spectra of the voltages in the intermediate state (MV Line)
In the intermediate state of the charge, the voltage interharmonics exceed the compatibility
limits. The 5th harmonic do not exceeds the compatibility limits.
Fig. 8. Waveforms and harmonic spectra of the currents in the intermediate state (LV Line)
Fig. 9. Waveforms and harmonic spectra of the currents in the intermediate state (MV Line)
In the intermediate state, harmonic spectra of the currents absorbed from the LV Line present the 3rd, 5th, 7th, 11th, 13th, 15th, 17th, 25th harmonics and even harmonics (2nd, 4th, 8th). The 5th, 15th, 17th and 25th harmonics exceed the compatibility limits (IEC 61000-3-4, 1998). On MV Line, harmonic spectra of the currents present the 3rd, 5th, 7th, 9th, 11th, 13th, 15th, 17th, 25th harmonics and even harmonics (2nd, 4th, 6th, 8th). The 5th and 25th harmonics exceed the compatibility limits (IEC/TR 61000-3-6, 2005). After 8 hours from the beginning of the heating process the furnace charge is totally melted,
being paramagnetic.
www.intechopen.com

Power Quality Problems Generated by Line Frequency Coreless Induction Furnaces
241
Fig. 10. Waveforms and harmonic spectra of the phase voltages at the end of the melting process (LV Line)
Fig. 11. Waveforms and harmonic spectra of the phase voltages at the end of the melting process (MV Line)
At the end of the melting process, the electromagnetic disturbances of the phase voltages are
very small. Voltage interharmonics exceed the compatibility limits. The 5th harmonic is
within compatibility limits (IEC 61000-3-4, 1998; IEC/TR 61000-3-6, 2005).
Fig. 12. Waveforms and harmonic spectra of the line currents at the end of the melting process (LV Line)
Waveform distortion of the currents at the end of the melting process is smaller than in cold
state, or intermediate state. On LV Line, harmonic spectra of the currents show the presence
of 3rd, 5th, 7th, 9th, 11th, 13th, 15th, 17th, 25th harmonics and even harmonics (2nd, 4th, 6th). The
5th, 15th and 25th harmonics exceed the compatibility limits (IEC 61000-3-4, 1998).
www.intechopen.com

Power Quality Harmonics Analysis and Real Measurements Data
242
Fig. 13. Waveforms and harmonic spectra of the line currents at the end of the melting process (MV Line)
On MV Line, harmonic spectra of the currents show the presence of 3rd, 4th, 5th, 7th, 9th, 11th, 13th harmonics at the end of the melting. The 5th harmonic exceeds the compatibility limits (IEC/TR 61000-3-6, 2005). Fig.14-16 show the values of voltage and current unbalance on LV Line, in all the heating stages.
Fig. 14. Unbalance of the phase voltages and line currents in the cold state of the charge (LV Line)
Fig. 15. Unbalance of the phase voltages and line currents in the intermediate state of the charge (LV Line)
www.intechopen.com
Power Quality Problems Generated by Line Frequency Coreless Induction Furnaces
243
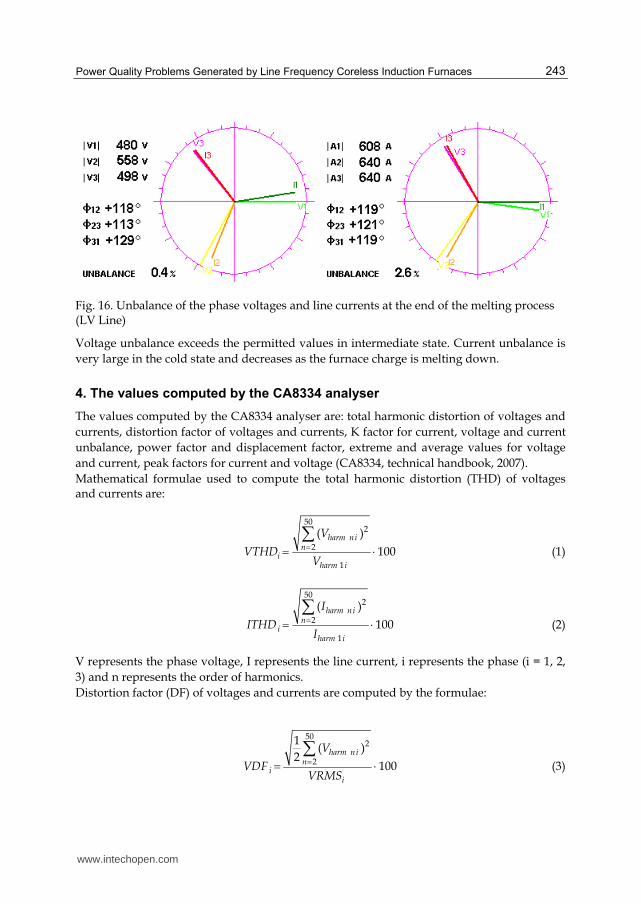
Fig. 16. Unbalance of the phase voltages and line currents at the end of the melting process (LV Line)
Voltage unbalance exceeds the permitted values in intermediate state. Current unbalance is
very large in the cold state and decreases as the furnace charge is melting down.
4. The values computed by the CA8334 analyser
The values computed by the CA8334 analyser are: total harmonic distortion of voltages and
currents, distortion factor of voltages and currents, K factor for current, voltage and current
unbalance, power factor and displacement factor, extreme and average values for voltage
and current, peak factors for current and voltage (CA8334, technical handbook, 2007).
Mathematical formulae used to compute the total harmonic distortion (THD) of voltages and currents are:
502
2
1
( )
100
harm nin
iharm i
V
VTHDV
(1)
502
2
1
( )
100
harm nin
iharm i
I
ITHDI
(2)
V represents the phase voltage, I represents the line current, i represents the phase (i = 1, 2,
3) and n represents the order of harmonics.
Distortion factor (DF) of voltages and currents are computed by the formulae:
502
2
1( )
2100
harm nin
ii
V
VDFVRMS
(3)
www.intechopen.com

Power Quality Harmonics Analysis and Real Measurements Data
244
502
2
1( )
2100
harm nin
ii
I
IDFIRMS
(4)
VRMS and IRMS represent the root mean square values (RMS values or effective values) for phase voltage and line current, computed over 1 second, and i represents the phase (i = 1, 2, 3). K factor (KF) is a weighting of the harmonic load currents according to their effects on transformer heating. K factor for current is computed by relation:
502 2
150
2
1
( )
( )
harm nin
i
harm nin
n I
IKF
I
(5)
In the above relation I represents the line current, i represents the phase (i = 1, 2, 3) and n represents the order of harmonics. A K factor of 1 indicates a linear load (no harmonics); a higher K factor indicates the greater harmonic heating effects. The unbalanced three-phase systems of voltages (or currents) can be reduce into three balanced systems: the positive (+), negative (-) and zero (0) sequence components. The positive voltage True RMS and the negative voltage True RMS are given by the relations:
2
1 2 3
3
V aV a VVRMS
(6)
2
1 2 3
3
V a V aVVRMS
(7)
where 1 2 3, ,V V V represent the phase voltages (using simplified complex) and
2
3j
a e
is
the complex operator. The positive current True RMS and the negative current True RMS are given by the relations:
2
1 2 3
3
I aI a IIRMS
(8)
2
1 2 3
3
I a I aIIRMS
(9)
where 1 2 3, ,I I I represent the line currents (using simplified complex).
Voltage and current unbalances (unb) are:
100unb
VRMSV
VRMS
(10)
www.intechopen.com

Power Quality Problems Generated by Line Frequency Coreless Induction Furnaces
245
100unb
IRMSI
IRMS
(11)
Power factor (PF) and displacement factor (DPF) are computed by relations:
ii
i
PPF
S (12)
cosi iDPF (13)
Pi [W] and Si [VA] represent the active power and the apparent power per phase (i = 1, 2, 3);
i is the phase difference between the fundamental current and voltage, and i represents
the phase. Mathematical formulae used to compute the peak factors (CF) for current and phase voltage are:
1 2
0
max ,
1( )
i ii
N
in
Vpp VpmVCF
V nN
(14)
1 2
0
max ,
1( )
i ii
N
ik
Ipp IpmICF
I kN
(15)
In the relations (14), (15): Vpp is the PEAK+ of the phase voltage; Vpm is the PEAK- of the phase voltage; Ipp is the PEAK+ of the line current; Ipm is the PEAK- of the line current; i represents the phase (i = 1, 2, 3); N represents the number of the samples per period (between two consecutive zeros). Peak values (PEAK+/PEAK-) for voltage (or current) represent the maximum/minimum values of the voltage (or current) for all the samples between two consecutive zeros. For a
sinusoidal signal, the peak factor is equal to 2 (1.41). For a non-sinusoidal signal, the peak
factor can be either greater than or less than 2 . In the latter case, the peak factor signals
divergent peak values with respect to the RMS value. MIN/MAX values for voltage (or current) represent the minimum/maximum values of the half-period RMS voltage (or current). Average values (AVG) for voltage and current are computed over 1 second. Tables 1-25 show the values computed by the CA8334 analyser on LV Line and on MV Line.
Heating moment VTHD1[%] VTHD2[%] VTHD3[%]
Cold state 0 4 5.4
Intermediate state 0 3.8 3.8
End of melting process 0 0 6.3
Table 1. Total harmonic distortion THD [%] for phase voltages (LV Line)
www.intechopen.com

Power Quality Harmonics Analysis and Real Measurements Data
246
Heating moment VTHD1[%] VTHD2[%] VTHD3[%]
Cold state 2.2 0 1.7
Intermediate state 3.4 0 3.1
End of melting process 1.9 0 1.7
Table 2. Total harmonic distortion THD [%] for phase voltages (MV Line)
THD of the phase voltages do not exceed the compatibility limits in all the heating stages.
The values of VTHD on MV Line are higher than the values of VTHD on LV Line.
Heating moment ITHD1[%] ITHD2[%] ITHD3[%]
Cold state 26.5 43 42
Intermediate state 20.1 39 35.5
End of melting process 14.9 16.7 30.3
Table 3. Total harmonic distortion THD [%] for line currents (LV Line)
Heating moment ITHD1[%] ITHD3[%]
Cold state 31 57.5
Intermediate state 34.3 68.7
End of melting process 22.7 24.3
Table 4. Total harmonic distortion THD [%] for line currents (MV Line)
ITHD exceed the limits permitted by norms in all the analyzed situations. The values of
ITHD are higher on MV Line versus LV Line. Because THD of line currents exceed 20%, this
indicates a significant electromagnetic pollution produced by the furnace in MV network.
Heating moment VDF1[%] VDF2[%] VDF3[%]
Cold state 0 0 0
Intermediate state 0 0 0
End of melting process 0 0 5.5
Table 5. Distortion factor DF [%] of phase voltages (LV Line)
Heating moment VDF1[%] VDF2[%] VDF3[%]
Cold state 1.9 0 1.4
Intermediate state 3.4 0 3
End of melting process 1.9 0 1.4
Table 6. Distortion factor DF [%] of phase voltages (MV Line)
Distortion factor of phase voltages is very small during the heating process of cast-iron charge.
In all situations, distortion factor of phase voltages is smaller than total harmonic distortion.
www.intechopen.com

Power Quality Problems Generated by Line Frequency Coreless Induction Furnaces
247
Heating moment IDF1[%] IDF2 [%] IDF3[%]
Cold state 21.7 46.2 32
Intermediate state 19.3 38.1 33.4
End of melting process 15.6 14.8 27.9
Table 7. Distortion factor DF [%] of line currents (LV Line)
Heating moment IDF1[%] IDF3[%]
Cold state 23.9 43.2
Intermediate state 32.2 61.8
End of melting process 22.7 23.4
Table 8. Distortion factor DF [%] of line currents (MV Line)
The values of distortion factor of line currents are very high during the heating process (Table 7 and Table 8). The values of IDF are higher on MV Line versus LV Line.
Heating moment IKF1 IKF2 IKF3
Cold state 2.02 6.07 3.52
Intermediate state 1.88 4.8 4.02
End of melting process 1.59 1.58 2.93
Table 9. K factor KF [-] of line currents (LV Line)
Heating moment IKF1 IKF3
Cold state 2.51 5.59
Intermediate state 3.54 8.7
End of melting process 2.21 2.27
Table 10. K factor KF [-] of line currents (MV Line)
K factor is greater than unity in all the heating stages. The values of K factor in the cold state
and in the intermediate state are very high. This indicates the significant harmonic current
content. K factor decrease at the end of the melting. Harmonics generate additional heat in
the furnace transformer. If the transformer is non-K-rated, overheat possibly causing a fire,
also reducing the life of the transformer.
Heating moment PF DPF
1 2 3 1 2 3
Cold state 0.96 0.84 0.93 0.98 0.93 0.99
Intermediate state 0.93 0.88 0.92 0.95 0.97 0.98
End of melting process 0.97 0.97 0.96 0.99 0.99 0.99
Table 11. PF [-] and DPF [-] per phase (1, 2, 3) on LV line
www.intechopen.com

Power Quality Harmonics Analysis and Real Measurements Data
248
PF is less than unity in all the analyzed situations on LV Line. In the cold state and in the intermediate state, PF is less than neutral value (0.92) per phase 2.
Values u1 u2 u3
MAX [V] 552 624 558
AVG [V] 456 540 468
MIN [V] 0 0 0
PEAK+ [V] 660 786 678
PEAK- [V] -672 -786 -726
Table 12. Extreme and average values for phase voltages in the cold state (LV line)
Values u1 u2 u3
MAX [V] 4176 4182 4158
AVG [V] 3558 3564 3600
MIN [V] 0 2862 2796
PEAK+ [V] 5034 5058 5028
PEAK- [V] -5076 -5076 -5046
Table 13. Extreme and average values for phase voltages in the cold state (MV Line)
Values u1 u2 u3
MAX [V] 498 570 516
AVG [V] 486 564 504
MIN [V] 456 540 474
PEAK+ [V] 708 828 732
PEAK- [V] -732 -810 -768
Table 14. Extreme and average values for phase voltages at the end of melting (LV line)
Values u1 u2 u3
MAX [V] 4140 4068 4146
AVG [V] 3594 3606 3600
MIN [V] 3558 3522 3480
PEAK+ [V] 5052 5118 5028
PEAK- [V] -5094 -5136 -5046
Table 15. Extreme and average values for phase voltages at the end of melting (MV Line)
Tables 12-15 indicate a small unbalance of phase voltages in all the analyzed situations, on LV Line and on MV Line.
www.intechopen.com
Power Quality Problems Generated by Line Frequency Coreless Induction Furnaces
249
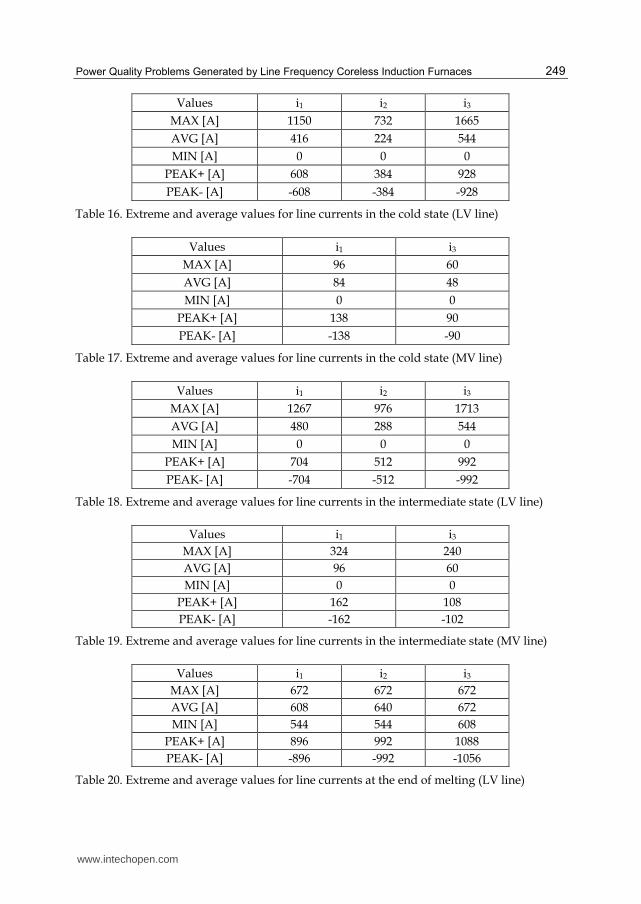
Values i1 i2 i3
MAX [A] 1150 732 1665
AVG [A] 416 224 544
MIN [A] 0 0 0
PEAK+ [A] 608 384 928
PEAK- [A] -608 -384 -928
Table 16. Extreme and average values for line currents in the cold state (LV line)
Values i1 i3
MAX [A] 96 60
AVG [A] 84 48
MIN [A] 0 0
PEAK+ [A] 138 90
PEAK- [A] -138 -90
Table 17. Extreme and average values for line currents in the cold state (MV line)
Values i1 i2 i3
MAX [A] 1267 976 1713
AVG [A] 480 288 544
MIN [A] 0 0 0
PEAK+ [A] 704 512 992
PEAK- [A] -704 -512 -992
Table 18. Extreme and average values for line currents in the intermediate state (LV line)
Values i1 i3
MAX [A] 324 240
AVG [A] 96 60
MIN [A] 0 0
PEAK+ [A] 162 108
PEAK- [A] -162 -102
Table 19. Extreme and average values for line currents in the intermediate state (MV line)
Values i1 i2 i3
MAX [A] 672 672 672
AVG [A] 608 640 672
MIN [A] 544 544 608
PEAK+ [A] 896 992 1088
PEAK- [A] -896 -992 -1056
Table 20. Extreme and average values for line currents at the end of melting (LV line)
www.intechopen.com

Power Quality Harmonics Analysis and Real Measurements Data
250
Values i1 i3
MAX [A] 102 102
AVG [A] 90 90
MIN [A] 90 84
PEAK+ [A] 150 150
PEAK- [A] -150 -150
Table 21. Extreme and average values for line currents at the end of melting (MV line)
The extreme and average values of line currents indicate a large unbalance in the cold state and in intermediate state. At the end of the melting the unbalance of currents is small.
Heating moment VCF1 VCF2 VCF3
Cold state 1.47 1.46 1.53
Intermediate state 1.48 1.44 1.56
End of melting process
1.45 1.47 1.49
Table 22. Peak factors CF [-] of phase voltages (LV Line)
Heating moment VCF1 VCF2 VCF3
Cold state 1.42 1.42 1.39
Intermediate state 1.44 1.42 1.39
End of melting process
1.45 1.47 1.49
Table 23. Peak factors CF [-] of phase voltages (MV Line)
Peak factors of phase voltages do not exceed very much the peak factor for sinusoidal signals (1.41) in all the heating stages. This indicates a small distortion of phase voltages.
Heating moment ICF1 ICF2 ICF3
Cold state 1.59 1.83 1.81
Intermediate state 1.51 1.88 1.83
End of melting process
1.48 1.64 1.66
Table 24. Peak factors CF [-] of line currents (LV Line)
Heating moment ICF1 ICF3
Cold state 1.68 1.82
Intermediate state 1.72 1.79
End of melting process 1.68 1.68
Table 25. Peak factors CF [-] of line currents (MV Line)
www.intechopen.com

Power Quality Problems Generated by Line Frequency Coreless Induction Furnaces
251
Peak factors of line currents are between 1.48 and 1.88. This indicates that the analyzed
furnace is a non-linear load. A high peak factor characterizes high transient overcurrents
which, when detected by protection devices, can cause nuisance tripping.
5. Recorded parameters in the electrical installation of the induction furnace
The recorded parameters in the electrical installation of analyzed furnace are: RMS values of
phase voltages and currents, total harmonic distortion of phase voltages and currents,
power factor and displacement factor per phase 1, active power, reactive power and
apparent power per phase 1.
Fig.17-21 show the recorded parameters on MV Line, in the first stage of the heating. In the
recording period (11:20-12:18), the furnace charge was ferromagnetic.
Fig. 17. RMS values of the phase voltages in the cold state (MV Line)
RMS values of phase voltages in the cold state indicate a small unbalance of the load. THD
of phase voltages are within compatibility limits in the first stage of the heating process.
The RMS values of line currents show a poor balance between the phases. The Steinmetz circuit is not efficient for load balancing in this stage of the melting process. THD of line currents have values of 20%...70%, and exceed very much the compatibility
limits during the recording period. This indicates a significant harmonic pollution with a
risk of temperature rise.
Fig. 18. THD of phase voltages in the cold state (MV Line)
www.intechopen.com

Power Quality Harmonics Analysis and Real Measurements Data
252
Fig. 19. RMS values of the currents in the cold state (MV Line)
Fig. 20. THD of line currents in the cold state (MV Line)
Fig. 21. DPF and PF per phase 1 in the cold state (MV Line)
In the recorded period of the cold state, power factor (PF) per phase 1 and displacement
factor (DPF) per phase 1 are less than unity; in the time period 12:00 - 12:18 PF is less than
neutral value (0.92). PF is smaller than DPF because PF includes fundamental reactive
power and harmonic power, while DPF only includes the fundamental reactive power
caused by a phase shift between voltage and fundamental current.
www.intechopen.com

Power Quality Problems Generated by Line Frequency Coreless Induction Furnaces
253
Fig.22-29 show the recorded parameters in the intermediate state of the heating. The furnace charge was partially melted in the recording period, 13:20-14:18.
Fig. 22. RMS values of phase voltages in the intermediate state (MV Line)
Fig. 23. THD of phase voltages in the intermediate state (MV Line)
In the intermediate state, THD of phase voltages do not exceed the compatibility limits, but
are bigger comparatively with the cold state.
Fig. 24. RMS values of line currents in the intermediate state (MV Line)
www.intechopen.com

Power Quality Harmonics Analysis and Real Measurements Data
254
Fig. 25. THD of line currents in the intermediate state (MV Line)
In the intermediate state, the RMS values of the line currents show a poor balance between the phases. THD of line currents are remarkably high and exceed the compatibility limits.
Fig. 26. DPF and PF per phase 1 in the intermediate state (MV Line)
The difference between the power factor and the displacement factor is significant in the intermediate state. This indicates the significant harmonic pollution and reactive power consumption. PF per phase 1 is less than neutral value (0.92) almost all the time during the intermediate state. In the time period 13:20-13:35, PF is very small.
Fig. 27. Active power per phase 1 in the intermediate state (MV Line)
www.intechopen.com

Power Quality Problems Generated by Line Frequency Coreless Induction Furnaces
255
Fig. 28. Reactive power per phase 1 in the intermediate state (MV Line)
In the time period 13:20 - 13:35, the values of reactive power per phase 1 are almost equal to the values of active power. As a result, the power factor per phase 1 is very poor in the time period 13:20 - 13:35 (fig.26).
Fig. 29. Apparent power per phase 1 in the intermediate state (MV Line)
Fig.30-37 show the recorded parameters in the last stage of the heating. The furnace charge was totally melted in the recording period, 18:02-18:12.
Fig. 30. RMS values of phase voltages in the last stage of the melting process (MV Line)
In the last stage of the melting process, THD of phase voltages are within compatibility
limits, being smaller comparatively with the cold state or the intermediate state.
www.intechopen.com

Power Quality Harmonics Analysis and Real Measurements Data
256
Fig. 31. THD of phase voltages in the last stage of the melting process (MV Line)
Fig. 32. RMS values of line currents in the last stage of the melting process (MV Line)
Fig. 33. THD of line currents in the last stage of the melting process (MV Line)
At the end of the melting process, the RMS values of line currents are much closer
comparatively with cold state or intermediate state. THD of line currents exceed the
compatibility limits, being of 20%…50% during this recording period.
The difference between the power factor and the displacement factor is small in the last stage
of the melting process (fig.34). This indicates a decrease of harmonic disturbances and reactive
power consumption (fig.36), comparatively with the cold state or the intermediate state.
www.intechopen.com

Power Quality Problems Generated by Line Frequency Coreless Induction Furnaces
257
In the time period 18:07 - 18:12, the values of reactive power per phase 1 increase; consequently, the power factor and the displacement factor per phase 1 decrease. Recorded values of active power per phase 1 are close to the apparent power values.
Fig. 34. DPF and PF per phase 1 in the last stage of the melting process (MV Line)
Fig. 35. Active power per phase 1 in the last stage of the melting process (MV Line)
Fig. 36. Reactive power per phase 1 in the last stage of the melting process (MV Line)
www.intechopen.com

Power Quality Harmonics Analysis and Real Measurements Data
258
Fig. 37. Apparent power per phase 1 in the last stage of the melting process (MV Line)
6. Conclusion
The measurements results show that the operation of the analyzed furnace determines interharmonics and harmonics in the phase voltages and harmonics in the currents absorbed from the network. THD of phase voltages are within compatibility limits, but voltage interharmonics exceed the compatibility limits in all the analyzed situations. THD of line currents exceed the compatibility limits in all the heating stages. Because ITHD exceed 30%, which indicates a significant harmonic distortion, the probable malfunction of system components would be very high. THD of line currents are bigger in intermediate state comparatively with the cold state, or comparatively with the end of melting. This situation can be explained by the complex and strongly coupled phenomena (eddy currents, heat transfer, phase transitions) that occur in the intermediate state. Harmonics can be generated by the interaction of magnetic field (caused by the inductor) and the circulating currents in the furnace charge.
Because the furnace transformer is in / connection, the levels of the triple-N harmonics
currents are much smaller on MV Line versus LV Line. These harmonics circulate in the
winding of transformer and do not propagate onto the MV network.
On MV Line, 5th and 25th harmonics currents exceed the compatibility limits. The levels of these harmonics are higher on MV Line versus LV Line. Also, THD of line currents and THD of phase voltages are higher on MV Line versus LV Line, in all the analyzed situations. The harmonic components cause increased eddy current losses in furnace transformer,
because the losses are proportional to the square of the frequency. These losses can lead to
early failure due to overheating and hot spots in the winding.
Shorter transformer lifetime can be very expensive. Equipment such as transformers is
usually expected to last for 30 or 40 years and having to replace it in 7 to 10 years can have
serious financial consequences.
To reduce the heating effects of harmonic currents created by the operation of analyzed
furnace it must replaced the furnace transformer by a transformer with K-factor of an equal
or higher value than 4.
Peak factors of line currents are high during the heating stages, and characterizes high transient overcurrents which, when detected by protection devices, can cause nuisance tripping.
www.intechopen.com

Power Quality Problems Generated by Line Frequency Coreless Induction Furnaces
259
The capacitors for power factor correction and the ones from Steinmetz circuit amplify in fact the harmonic problems. PF is less than unity in all the analyzed situations. But, Steinmetz circuit is efficient only for unity PF, under sinusoidal conditions. Under nonsinusoidal conditions, any attempt to achieve unity PF does not result in harmonic-free current. Similarly, compensation for current harmonics does not yield unity PF. For optimizing the operation of analyzed induction furnace, it’s imposing the simultaneous adoption of three technical measures: harmonics filtering, reactive power compensation and load balancing. That is the reason to introduce harmonic filters in the primary of furnace transformer to solve the power interface problems. In order to eliminate the unbalance, it is necessary to add another load balancing system in the connection point of the furnace to the power supply network.
7. References
Arrillaga, J., Watson, N. R., & Chen, S. (2000). Power System Quality Assessment, John Wiley and Sons, ISBN 978-0-471-98865-6, New York.
Ching-Tzong Su, Chen-Yi Lin, & Ji-Jen Wong (2008). Optimal Size and Location of Capacitors Placed on a Distribution System. WSEAS Transactions on Power Systems, Vol. 3, Issue 4, (april 2008), pp. 247-256, ISSN 1790-5060.
George, S., & Agarwal, V. (2008). Optimum Control of Selective and Total Harmonic Distortion in Current and Voltage Under Nonsinusoidal Conditions, IEEE Transactions on Power Delivery, Vol.23, Issue 2, (april 2008), pp. 937-944, ISSN 0885-8977.
De la Rosa, F. C. (2006). Harmonics and Power Systems, CRC Press, Taylor&Francis Group, ISBN 0-8493-30-16-5, New York.
Iagăr, A., Popa, G. N., & Sora I. (2009). Analysis of Electromagnetic Pollution Produced by Line Frequency Coreless Induction Furnaces, WSEAS TRANSACTIONS on SYSTEMS, Vol. 8, Issue 1, (january 2009), pp. 1-11, ISSN 1109-2777.
Lattarulo, F. (Ed(s).). (2007). Electromagnetic Compatibility in Power System, Elsevier Science&Technology Books, ISBN 978-0-08-045261-6.
Muzi, F. (2008). Real-time Voltage Control to Improve Automation and Quality in Power Distribution, WSEAS Transactions on Circuit and Systems, Vol. 7, Issue 4, (april 2008), pp. 173-183, ISSN 1109-2734.
Nuns, J., Foch, H., Metz, M. & Yang, X. (1993). Radiated and Conducted Interferences in Induction Heating Equipment: Characteristics and Remedies, Proceedings of Fifth European Conference on Power Electronics and Applications, Brighton, UK., Vol. 7, pp. 194-199, september 1993.
Panoiu, M., Panoiu, C., Osaci, M. & Muscalagiu, I. (2008). Simulation Result about Harmonics Filtering Using Measurement of Some Electrical Items in Electrical Installation on UHP EAF, WSEAS Transactions on Circuit and Systems, Vol. 7, Issue 1, (january 2008), pp. 22-31, ISSN 1109-2734.
Rudnev, V., Loveless, D., Cook, R., & Black, M. (2002). Handbook of Induction Heating, CRC Press, Taylor&Francis Group, ISBN 0824708482, New York.
Sekara, T. B., Mikulovic, J.C., & Djurisic, Z.R. (2008). Optimal Reactive Compensators in Power Systems Under Asymmetrical and Nonsinusoidal Conditions, IEEE
www.intechopen.com

Power Quality Harmonics Analysis and Real Measurements Data
260
Transactions on Power Delivery, Vol. 23, Issue 2, (april 2008), pp. 974-984, ISSN 0885-8977.
CA8334, Three Phase Power Quality Analyser, technical handbook, Chauvin Arnoux, France, 2007.
IEC 61000-3-4, EMC, Part 3-4: Limits – Limitation of Emission of Harmonic Currents in Low-Voltage Power Supply Systems for Equipment with Rated Current Greater than 16A, 1998.
IEC/TR 61000-3-6, EMC, Part 3-6: Limits – Assessment of Harmonic Emission Limits for the Connection of Distorting Installations to MV, HV and EHV Power Systems (revision), 2005.
Power Quality for Induction Melting in Metal Production, TechCommentary Electric Power Research Institute (EPRI), U.S.A., 1999, available at:
http://www.energy.ca.gov/process/pubs/pq_inductn_melting_tc114625.pdf
www.intechopen.com

Power Quality Harmonics Analysis and Real Measurements DataEdited by Prof. Gregorio Romero
ISBN 978-953-307-335-4Hard cover, 278 pagesPublisher InTechPublished online 23, November, 2011Published in print edition November, 2011
InTech EuropeUniversity Campus STeP Ri Slavka Krautzeka 83/A 51000 Rijeka, Croatia Phone: +385 (51) 770 447 Fax: +385 (51) 686 166www.intechopen.com
InTech ChinaUnit 405, Office Block, Hotel Equatorial Shanghai No.65, Yan An Road (West), Shanghai, 200040, China
Phone: +86-21-62489820 Fax: +86-21-62489821
Nowadays, the increasing use of power electronics equipment origins important distortions. The perfect ACpower systems are a pure sinusoidal wave, both voltage and current, but the ever-increasing existence of non-linear loads modify the characteristics of voltage and current from the ideal sinusoidal wave. This deviationfrom the ideal wave is reflected by the harmonics and, although its effects vary depending on the type of load,it affects the efficiency of an electrical system and can cause considerable damage to the systems andinfrastructures. Ensuring optimal power quality after a good design and devices means productivity, efficiency,competitiveness and profitability. Nevertheless, nobody can assure the optimal power quality when there is agood design if the correct testing and working process from the obtained data is not properly assured at everyinstant; this entails processing the real data correctly. In this book the reader will be introduced to theharmonics analysis from the real measurement data and to the study of different industrial environments andelectronic devices.
How to referenceIn order to correctly reference this scholarly work, feel free to copy and paste the following:
Angela Iaga ̆r (2011). Power Quality Problems Generated by Line Frequency Coreless Induction Furnaces,Power Quality Harmonics Analysis and Real Measurements Data, Prof. Gregorio Romero (Ed.), ISBN: 978-953-307-335-4, InTech, Available from: http://www.intechopen.com/books/power-quality-harmonics-analysis-and-real-measurements-data/power-quality-problems-generated-by-line-frequency-coreless-induction-furnaces


![determined as a prerequisite. IJSER · of the induction furnaces because of its suitability for all metal industries[1]. The coreless induction furnace is a simple unit consisting](https://static.fdocuments.net/doc/165x107/5aed956b7f8b9a45568fde01/determined-as-a-prerequisite-ijser-the-induction-furnaces-because-of-its-suitability.jpg)


