Power quality measurements: bringing order out of chaos · PDF file ·...
15
Power Quality Measurements: Bringing Order out of Chaos François D. Martzloff National Bureau of Standards Reprinted from Proceedings of the Energy Technology Conference, February 1988, Government Institute Pub. Significance Part 6: Textbooks, tutorials, and reviews The quality of the power supplied to sensitive electronic equipment is an issue that has been debated since the 1970s. This paper presents the perspective as of the mid-eighties, reporting on the progress toward developing power quality-related standards, giving emphasis to the technical aspects of the measurements, specifically field measurements of power quality. After reviewing site surveys and their deficiencies or ambiguities, a plea is presented for improving the usefulness of such surveys by developing uniform procedures and instrumentation algorithms. This need was eventually fulfilled by the development of IEEE Std 1159 on Power Quality Measurements, and reaching the IEC with a standard on the same subject, IEC 61000-4-30:2003, “Testing and Measurement techniques - Power quality measurement methods.”
Transcript of Power quality measurements: bringing order out of chaos · PDF file ·...
Power Quality Measurements:Bringing Order out of Chaos
François D. Martzloff
National Bureau of Standards
Reprinted from Proceedings of the Energy Technology Conference, February 1988, Government Institute Pub.
Significance
Part 6: Textbooks, tutorials, and reviews
The quality of the power supplied to sensitive electronic equipment is an issue that has been debated
since the 1970s. This paper presents the perspective as of the mid-eighties, reporting on the progress
toward developing power quality-related standards, giving emphasis to the technical aspects of the
measurements, specifically field measurements of power quality.
After reviewing site surveys and their deficiencies or ambiguities, a plea is presented for improving the
usefulness of such surveys by developing uniform procedures and instrumentation algorithms. This need
was eventually fulfilled by the development of IEEE Std 1159 on Power Quality Measurements, and
reaching the IEC with a standard on the same subject, IEC 61000-4-30:2003, “Testing and Measurement
techniques - Power quality measurement methods.”
ENERGY TECHNOLOGY
"Repowering America"
Proceedings of the
Energy Technology Conference February 17-19, 1988
Washington, DOCo
overnment Institutes, Inc.
P O W E R Q U A L I T Y M E A S U R E M E N T S : B R I N G I N G O R D E R O U T OF C H A O S
Franfois D. Mardoff National Bureau of Standards
Gaithersburg. MD. 20899
ABSTRACT - The quality of the power supplied t o sensitive electronic equipment is a n important issue. Quantifytng this quality, however, is difficult under the present s ta te o f nonexistent or uncoordinated standards concerning two related questions: ( I ) what levels of power quali ty a r c r equ i red for what types of loads, and (2) what measurement techniques a r e required to determine reliably the level of disturbances that reduce quality. Development of standards by the consensus rocess and voluntary compliance. although a slow process, is a mec e anism for reaching technically sound and cost-effective solutions. Several standards projects are in progress, but need an industry-wide support t o become the generally accepted basis for valid and useful measurements of power quality.
INTRODUCTION
The issue o f Power Quality has gained increased recognition as the result of two unrelated but parallel developments: (1) an increase in the sophistication of electronic systems, sometimes resulting in an unintentional increase in heir sensitwiry t o power suppty disturbances. and (2) a n increase in the number and power ratlng of conversmn equipment, generally resulting in the distortion or::: power system voltage. lmprovernents in the situation described as "poor power quality" can be achieved by reducing the sensitivity of equipment t o power line disturbances, o r by limiting the injection of disturbances -- o r better yet. by reducing both in a coordinated approach. While these remedies might seem obvious in ~ r i n c i p l e . their implementation (enforcement) appears more difficuit. olunra stan- dards provide a guide for .such a n implementation. To that e n 2 three types o f standards a re necessary. The first concerns measurements. to obtain correct and universally acceptable data. The second concerns equipment performance, to define both its tolerance to disturbances and its limits on emission o f disturbances. The third concerns accept- able disturbance levels o n the utility su~p!y. to promole compatibility of equipment with the utility supply. ese standards are develo by reconciling "rely technical objectives with economic reality. Ey a slsndard to & effective and acccptnble, both aspects rnusl have an accurate basis.
This P aper gives emphasis to the technical aspects of the measurements, speci ically field measurements of power quality.
U.S. Covcrnrncnt work not protected by U.S. copyright.
ENERGY TECHNOLOGY CONFERENCE
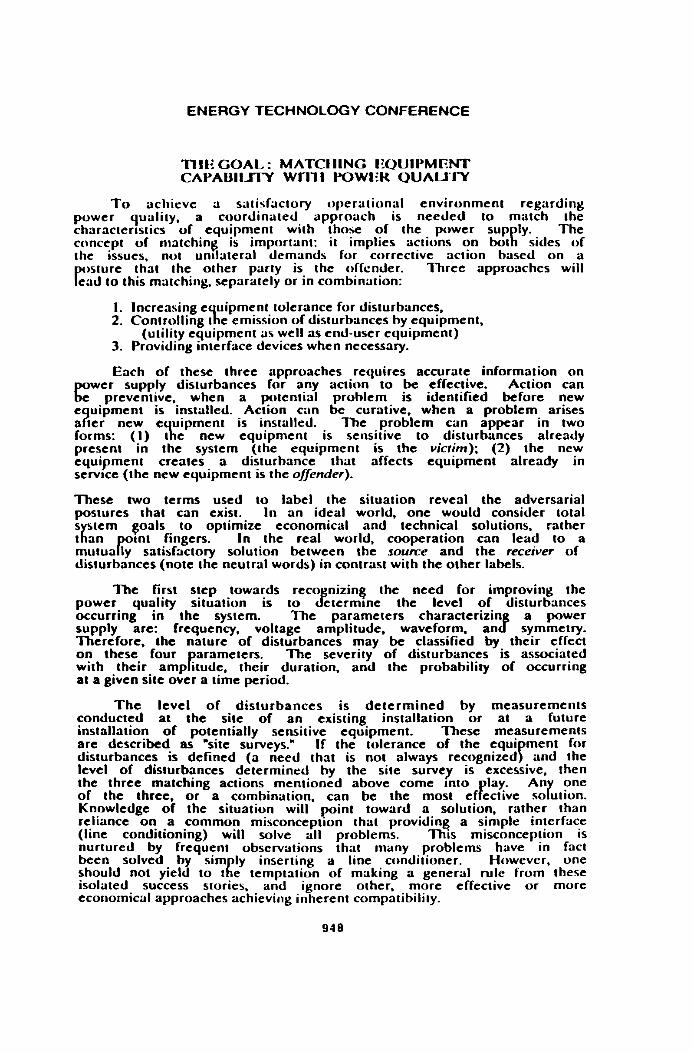
TI 113 C O A L : MATCI IING I !UUIPMENT C A Y A U I I ~ W ~ I m w m UUAU'IY
To achieve a satisfactory operational environment regarding power quality, a coordinated approach is needed to match the character~sticr o f equipment w i ~ h those o f the power sup~ ly . The ccrncept o f matchin8 is important: i t implies actions o n bo t sides o f the issues, not un~lateral demands for corrective action based on a
jsture that the other party is the dfender. Three approaches wi l l e a d to this matching, separately or i n combination:
I. Increasing e uipment tolerance for disturbances, X 2. Controlling t e emission of disturbances hy equipment, (utility equipment as well as end-user equipment)
3. Providing interface devices when necessary.
Each of these three approaches requires accurate information o n wer supply dislurbances fur any action t o be effectwe. Act ion can
preventive. when a polenth1 problem is identified before new e uipment is instaHed. Action can be curative, when a problem arises a ? ter new e uipment is installed. The problem can appear i n two forms: ( 1 1 Qe new equipment is sensitive to disturbances already present i n the system (the equipment is the victim); (2) the new equipment creates a disturbance that affects equipment already i n servlce (the new equipment is the offender).
These two terms used to label the situation reveal the adversarial postures that can exist. In an ideal world, one would consider total s stem goals t o optimize economical and technical solutions. rather t r an P t n t fingers. In the real world, cooperation can lead to a mutua ly satisfactory solution between the soume and the receiver o f disturbances (note the neutral words) in contrast wi th the other labels.
The first step towards reco nizing the need for improving the power quality situation is to 8 etermme the level o f disturbances occurring in the system. The parameters characterizin a power supply are: frequency, voltage amplitude. waveform, a n j symmetry. Therefore, the nature o f disturbances may be classified by their effect o n these four arameten. The severity o f disturbances is associated with their amp P itude, their duration, and the probability of occurring at a given site over P time period.
T h e level o f disturbances is determined by measurements conducted at the site of an existing installation or at a future installation o f potentially sensitive equipment. These measurements are described as 'site surveys.' i f the tolerance o f the equi ment for disturbances is defined a need that is not always recogniredr and the level o f disturbances determined by the site survey is excessive. then the three matching actions mentioned above come Into r l a ~ . A n one r o f the three, or a combination. can be the most e f ectlve so ution. Knowledge of the situation wi l l point toward a solution. rather than reliance o n a common misconception that providing a simple interface (line conditioning) wi l l solve al l problems. This misconception is nurtured by frequent observations that many problems have i n fact been solved hy sim ly inserting a line conditioner. However, one should not yield t o I t! e temptation of making a general rule from these isolated success stories, and ignore other. more effective or more economical approaches achieving inherent compatibili~y.
ENERGY TECHNOLOGY CONFERENCE
Because this additional line conditioning equipment may require significant capital invesrment, the choice of corrective measures is made by economic trade-off. However. if technical inputs t o this trade-off a r e incorrect because erroneous conclusions result from a faulty site survey, the whole rocess is worthless o r misleading. For this reason, a good understan 'I' ins of the merits and limitations of site surve s is essential for reconc~ling expectations with reality before speci&ing expensive line conditioning e ui ment. In their review of power quahty site surveys, Martzloif a n 2 g ruzs i l l discussed how one should deal, not with fiction o r fallacies, but with facts.
In a n attempt t o clarify the issues. this paper first presents a review of the origins ancl definitions of disturbances. Next, the development of monitoring instruments during the last 25 years is described. Finally, a n appeal is made for im roving measurement
recorded in future surveys. P methods t o provide more consistent reporting o power disturbances
CLASSIFICATION AND O R I G I N OF POWER LINE DISTURBANCES
The four wer system parameters identified above -- frc uency, amplitude, wave P" orm, and symmetry -- can serve as frame of re ? erence t o classify the disturbances according t o their impact o n thcsc four parameters.
Frequency disturbances a r e associated with power s stem faults. Interconnection of he utility grid ensures frequency sta g iliry, except when a fault occurs that asolates the local s stern from the grid. leaving local generation more sensitive t o l o a J variations. Transient frequency disturbances. just before a n outage. occur in a system containing large rotating machines: should the system trip out. the machines will maintain some voltage, with decaying amplitude and frequency, while they coast to a final stop.
Amplitude variations can occur in several forms; their description is inextricably associated with their duration. They range from extremely brief dura t ions t o steady-state conditions. making the description and definition difficult, even controversial at times. Their causes a n d effects n e e d c lose examina t ion t o unders tand the mechanisms and to define an appropriate solution.
Waveform variations occur when nonlinear loads draw a current which is not sinusoiclal. O n e could also describe a n amplitude variation a s momentary waveform variation, but the intended meaning of the te rm is a stead variation of t he waveform, o r lasting a t least over several cycles. h i s type of disturbance is also described as harmonic distortion because it is easy t o analyze a s the superposition of harmonics t o the fundamental frequency of the power system.
Dissymmetry, also called unbalance, occurs when unequal single- phase loads a r e connected t o a three-phase system and cause a loss of symmetry. Th i s type of dis turbance primarily concerns rotating machines. a n d as such is not receiving broad attention. It is important however, for machine designers a n d users.
the usual description of this type of disturbance, The percentage by which o n e phase voltage differs from rhc average of al three is
ENERGY TECHNOLOGY CONFERENCE
T h e origin o f disturbances can he described as external to the articular power system. or as internal. In a Iypical situation. the
poundmy of a power system is defined as the watthour meter. and reference is made to the utility side of the meter (external source), o r to the user side of the meter (internal source). A different approach is t o describe the origin in technical terms, such as lightning, load switching, power system fault. and nonlinear loads- Dependrng on local conditions. one can be more important than the others, but all need to be reco nized. The mechanism involved in enerating the disturbance also Jeterrnines whether the occurrence will k random o r permanent. unpredictable o r easy lo define.
tightning surges a re the result of direct strikes to the power system conductors as well as the result of indirect effects. Indirect effects include induction of overvoltages in loops formed by conductors
round potential rises resulting from lightning current in the soil. and A lig % tning strike t o the power sysaem -n activate a surge arrester, producin a severe reduction o r a complete loss of the power system f voltage o r one half-cycle. A flashover of line insulators can cause a breaker to trip. with reclosing delayed by several cycles, causing a momentary power outage. Thus. lightning can be the obvious cause of wervotta es near its point of impact, but also a less obvious cause of voltage foss a t a considerable distance from i s point of impact. Clearly, the occurrence of this type of disturbance is unpredictable a t the microscopic level. At the macroscopic level, it IS related to geography. seasons. and local system configuration.
Load switching is a major cause of disturbances. Switching lar e
R R C loads o n or off can produce long-duration volta e chan es beyond I e immediate transient response of the circuit. W ether I e swrtching is done by the utility o r b y the user is immaterial from the technical point of view, althou h the responsibili may be the subject of a contractual dispute. 7%e occurrence of t 1 ese disturbances is somewhat predictable. but not necessarily under controlled conditions. The mtroduction of power conversion equipment and voltage regulators operating by switching on and off a t high frequency has created a new type of load switching disturbance. These drsturbanccs occur steadily, although their amplrtude and harmonic content will vary for a given regulator as the load conditions vary.
Power system faults occur on both sides of the meter. resulting from equipment failure o r external causes (vehicle collisions, storms, human errors). These disturbances can range from a momentary voltage reduction to a complete loss of power lasting for minutes. hours, o r days. Their accrdental origin makes them unpredictable. although the configuration of a power system and its environment can make 11 more o r less prone to this type of disturbance.
NO- loads draw non-sinusoidal currents from the power s tem. even if the power system voltage is a perfect sine wave. xees currents produce "on-sinuroidal voltage drops in the system source impedance which distort the sine wave produced by the power plant generator. A typical nonlinear load is a dc power supply with ca acitor-input filter, such as used in most computers, drawing current or!& at the peaks o f the voltage sine wave.
ENERGY TECHNOLOGY CONFERENCE
Characterizing these four rypes of disturbances and disturbance mechanisms involves detection (measurement) of their occurrence and description o f the results of these measurements. What might a pear a simple process is in fact made difficult by deficiencies ,n degning disturbances observed when making site survey measurements.
DEFICIENCIES XN DEFLNlTlONS
One difficulty in coordinating effons for improving power quali is that terms used t o describe power disturbances are poorly define2 An effort is bein made by standards writ ing organizations to resolve this problem. as &scribed later in this paper. but consensus has yet to he reached, The following two examples of this lack o f consensus illustrate the point; resolving them is beyond the scope of this paper.
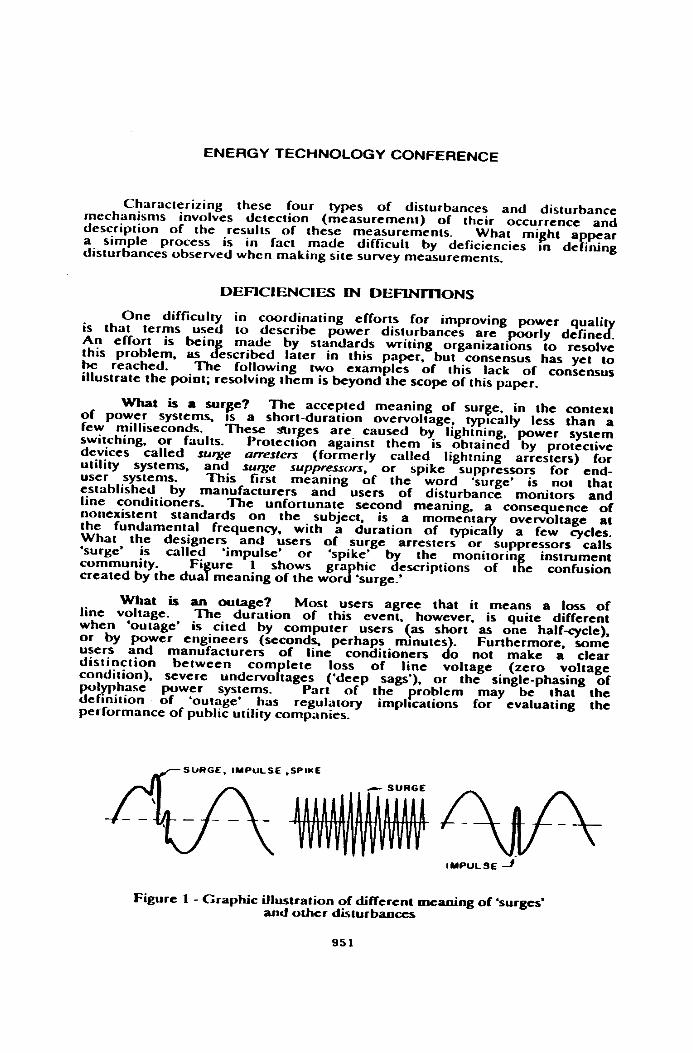
What is 8 surge? The accepted meaning of surge. in the context of power systems, 1s a short-duration overvoltage, typ~cally less than a few milliseconds. These mrges are caused by lightning, power system switching, or fnults. Protection against them is obtained by protective devices called surge arresters (formerly called lightning arresters) for uti l i ty systems, and surge suppressors, or spike suppressors for end- user systems. This first meaning o f the word 'surge' 1s not that established by manufacturers and users of disturbance monitors and line conditioners. The unfortunate second meaning. a consequence o f nonexistent standards on the subject. is a momenta overvoltage at the fundamental frequency. with a duration o f typica?;y a few cycles What the designers and users of surge arresters or suppressors calls 'surge* is called 'impulse' o r 'spike' by the monitorin instrument community. Fi re 1 shows gra hic descriptions o f t e confusion created by the duaf?neaning of the worx*surge.'
f What is an outage? Most users agree that i t means a loss of
line voltage. The duration of this event. however. is quite different when 'outage' is cited by computer users (as short as one hatf-cycle), or by power engineers (seconds, perhaps rmnutes). Funhermore, some users and manufacturers o f line conditioners do not make a clear d is t inct ion between corn lete loss of l ine voltage (zero voltage P condition). severe undervo tages ('deep sags'), or the single-phasing of p l m h a s e power systems. Part of the problem may be chat the definition , o f 'outage' has regulatory irnpl~cations for evaluating the performance o f public utility companies.
c SURGE
Figure 1 - Graphic Ufustradon of ditTereat meaning of'surge~' and other dbturbaoces
ENERGY TECHNOLOGY CONFERENCE
As another examplc of definitions deficiencies. standards dictio- naries d o not define the term 'sag*. Jt is accepted as meaning ;l momentary voltage reduction a t the ac power frequency. However, there is no consensus on the details (threshold, duration, etc.) of what characterizes a sag.
With the present definition deficiencies, manufacturers and u s c n of disturbance monitors are left without guidance and consequently define terms independently from each other. hence the confusion. In fact. the development and widespread use of disturbance monitors should motivate a more coordinated and rational approach toward resolving these deficiencies. Progress in technology of monitoring instruments during the last two decades is remarkable and worthy of a brief review.
DISTURBANCE M O M X l R S DEVEXDPMENT HISIDRY
Historically, the first (unintended) disturbance monitors were the actual load equipment. Only later. when confronted with unexplained failtires o r upsets. did the users start monitorin4 the quality of their power systems. Electric utilities have been momtoring the parameters of their systems. but the precise characterization of m~crosemnd- duration sur es in the early 1960s required special oscilloscopes. For the next 1 J years. oscilloscopes o r simple peak-detectors were the basic instruments for monitorin transient overvoltages. Startin in the 197% cornrnercia~l~-~roduce! digitizers became available. &nee then, technology has made continuing progress as experience has accumulated.
Early site surveys were limited t o voltage measurements. This limited interest reflected concerns for damage to sensitive electronic components connected across the line. Ignormg the im rtance of the source impedance led to some performance standards fi that do not s cify the current-handling requirements for surge protective devices. E t h the introduction and widespread application of new clamping protective devices (silicon avalanche diodes o r metal oxide varistors). the surge current diverted through these devices became a very important factor for proper device selection. Therefore. the need emer ed for character~zing current surges as well as volta e surges, k but ew surveys t o date have addressed this need. This nee% offers a challenge and a n opportunity to designers of monitoring instruments.
This challenge has also produced attempts t o measure 'energy' with a n instrument which is actually only a voltmeter. By assigning parametric values to the source impedance of the sur e and integrating the product (volts . seconds) of the surge, some e nowledge of the energy involved would be obtained. Computing true ener . of course. requares the measurement o f both voltage and current. $;owever. the real question concerns the sharing o f energy between the impedance of the source and the impedance of the load. A discussion of the energy in dre surge versus eneqy delivered to the rotective device is beyond the scope of this paper. The difference fx tween the two must be recognized, however, to prevent further confusion as future monitoring instruments include an 'energy' parameter in their readouts.
ENERGY TECHNOLOGY CONFERENCE
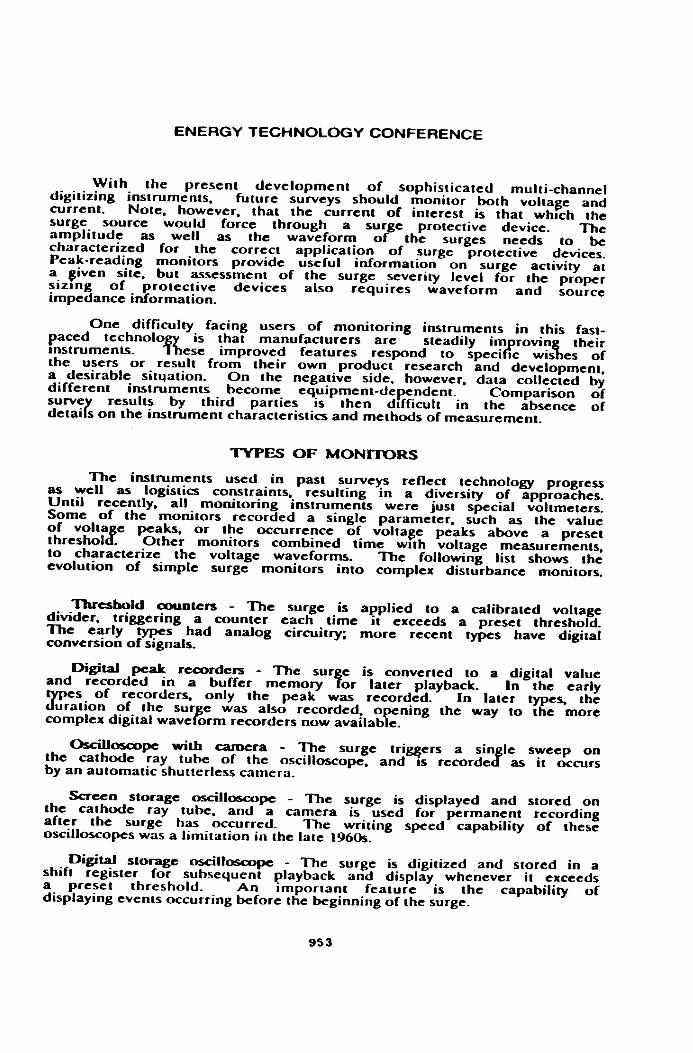
With the present development of sophisticated multi-channel digitizing instruments. future surveys should monitor both voltage and current. Note, however, that the current of interesl is that wh~ch the surge source would force through a surge protective device. The amplitude as well as the waveform of the surges needs to be characterized for the correct application of surge protective devices. Peak-reading monitors provide useful information on surge activity at a given site, but assessment of the surge severity level for the proper sizrng of protective devices also requlres waveform and source impedance information.
O n e difficulty facing users of monitoring instruments in this fast- paced techno10 is that manufacturers are steadily irn rovin their mstmments. R e s e improved features respond to speci ? rc v is 5, er of the users o r result from their own product research and development, a desirable situation. O n the negative side, however, data collected by different instruments become equipment-dependent. Comparison of
results by third parties is then d~fficult in the absence of dctai s on the instrument characteristics and methods of measurement. " -r
TYPES OF MO-RS
The instruments used in past surveys reflect technology progress as well as logistics constraints, resulting in a diversity of approaches. Until recently, all monitoring instruments were just special voltmeters. Some of the monitors recorded a single parameter. such as the value of volta e peaks. o r the occurrence of voltage peaks above a preset thresholf Other monitors combined time wath voltagc measurements, t o characterize the voltagc waveforms. The following list shows the evolution of simple surge monitors into complex disturbance monitors.
Threshold counters. - The surge is applied to a calibrated voltage divider. triggering a counter each lime it exceeds a preset threshold. T h e early types had analog circuitry; more recent types have digital conversion of signals.
Digital peak recorders - The sur e is converted to a digital value and recorded in a buffer memory fo r later playback. In the early
e s of recorders, only the peak was recorded. In later types. the E r a t i o n of the sur e was also recorded. o ning the way to the more complex digital wave p orm recorders now availabr.
OsciLl05cope with camera - The surge t r i a e r s a sin le sweep on
by a n automatic shutterless camera. 'f the cathode ray tuhc of the oscilloscope. and IS rccorde as it occurs
Screen storage oscilloscope - The surge is displayed and storcd on the cathode ray tube, and a camera is used for permanent recording after the surge has occurred. The writing speed capability of these oscilloscopes was a limitation in the late 1960s.
Digital storage oscillascopc - The surge is digitized ,and storcd in a shift register for subsequent playback and display whenever it exceeds a preset threshold. An Important feature is the capability of displaying events occurring before the beginning of the surge.
ENERGY TECHNOLOGY CONFERENCE
Digiral waveform recorder - With the advent o f compact. portable instruments. a revolution hiis taken place in the field o f disturbance recorders. The earlier surge waveform recorders were large and difficult to transport to field sites 131. r). New microprocessor- based instruments have introduced a porta le storage and computing
wer which has made waveform analysis and graphic display possible. thew instruments voltage and current signals are digltired and
stored, allowing reports of many different arameters o f the distur- bance. The range o f parameters which can & monitored is expanded. long trends can be detected, harmonic analysis can be performed. and the types o f possible measurements a r t limited only by the creativity o f the tnstrumtnt designers and the curiosity o f the users.
Although some site surveys might aim at high accuracy, the real world experiences an infinite variety of disturbances. making i t difficult t o fil them into simple, orderly categories. Any attempt to describe these disturbances in fine de~a i l restricts general usefulness o f the data and can lead to illusions on ap licable accura . Some
T P '7 simple (and ine nsive) instruments are use u l indicators o frequent disturbances. 01 er instruments, more complex (and more expensive),
rovide comprehensive data on disturbances. A general observation goan many s u m p conduc~ed different researchers is that results vary widely from site to site. %us. there is a practical l imit to the detail hat a sunrey can yield. and unrealistic expectations o f precise information should be avoided. What is really needed is a more uniform and compatible recording and reporting o f the data.
COMPARISONS AMONG StTE SURVEY REPORTS
Relative occurrence of different trpes d disturbiaas. Two site surveys' have been widely cited. One was performed in the early 1970s by Allen and Se all [5]. the other in the late 19705 by Goldstein and Spersnza 16. Each o f these surveys presented results by describing J various kin s of disturbances (overvoltages, sags, etc.) and cited the percentages o f each t o f disturbance in the total of all the observed disturbances. %e findings did not at fin1 appear t o agree. raising questions on the likelihood of a change in power systems between the first and second survey. However, a detailed comparison o f these two surveys I]. revealed that the disagreement was rooted in a difference of the r C resholds built into the monitors. rather than a change in the behavior o f power systems.
Differe- in surge amplitudes. Amplitudes o f surges reported in several surveys vary over a wide ran e. Comparisons are difficult because the reports do not present t I! e data in a uniform format. Attempting t o get a quantitative corn arison o f the amplitudes reported seems a futile exercise, because of the fol I' owing reasons:
1. Lookine at the 'maximum values' cited in the reports. one finds that in some surveys this maximum is actually a value known only as being above the range o f the instrumenr. while for others it is the measured value.
2. Because the threshold o f the recorder varies among surveys, and the frequency o f occurrences increases dramatically with a lower threshold. the labels o f averal;t, median. most frequent. typical. etc.. are not meaningful for comparlng amplitudes.
ENERGY TECHNOLOGY CONFERENCE
DiFierences in sur e waveforms. What a 't ical* surge might he has been the subject Uk many discussions. Severn 'T surveys confirm the finding of ringing waves, as o posed t o the tradilional unidirectional impulses. Elowever, wide dif f crences still cxist among the reports. The following examples illustrate this point.
Mcrrtzfofl-Ifah 17) were amOnf the first to report ring waves, r ecorded b y 1960 vintage oscil oscopes. The i r findings were incorporated mto the data that resulted In the selection of a 100 kHz
ri, wave for the UL Standard Ground Fmh Circuit Intempters [a]
a n the IEEE Guide om Surge Voltages (91.
CMurbag rurd Smskich 1101 used different instruments recording only two points of the woveform: (1) the peak amplitude and time to peak, and (2) the time t o 50% of the peak amplitude. As such, this descri tion i s nut a corn Jete waveform. Furthermore, they reported g that 0% of their 250, & recordings show the 50% point occurred between 900 and 1100 microseconds. This finding is unique among all the surveys.
Wenutmm et oL (11) report ring waves of 500 kHz. bursts of fast transients lasting a few microseconds. and even some unidirec- tional isolated impulses.
Coedblued I121 is more concerned with interference than damage; his report gives emphasis t o amplitude, rate of rise. and 'energy'. rather than t o waveform.
With the advent of portable monitors capable of presentin the digitized data with graphic details as well as summaries, a n exp f osion in the volume of data can expected. Just the detail and weight of the information being collected might swam the researchers, unless data reduction procedures a r e irn Icmented. P Rowever. whenever data reduc- tions are performed by di ferent persons, thcre is a high probabili~ that criteria for reduction will b e different. making comparisons d i l ficult, even impossible. Thus, this increased sophist~cation of available instrumentation makes coordination even more imperative. The added availability of harmonic analysis by rtnble monitors will also lead to a n expanston of data supporting standar ‘f'=' s o n harmonic control [13).
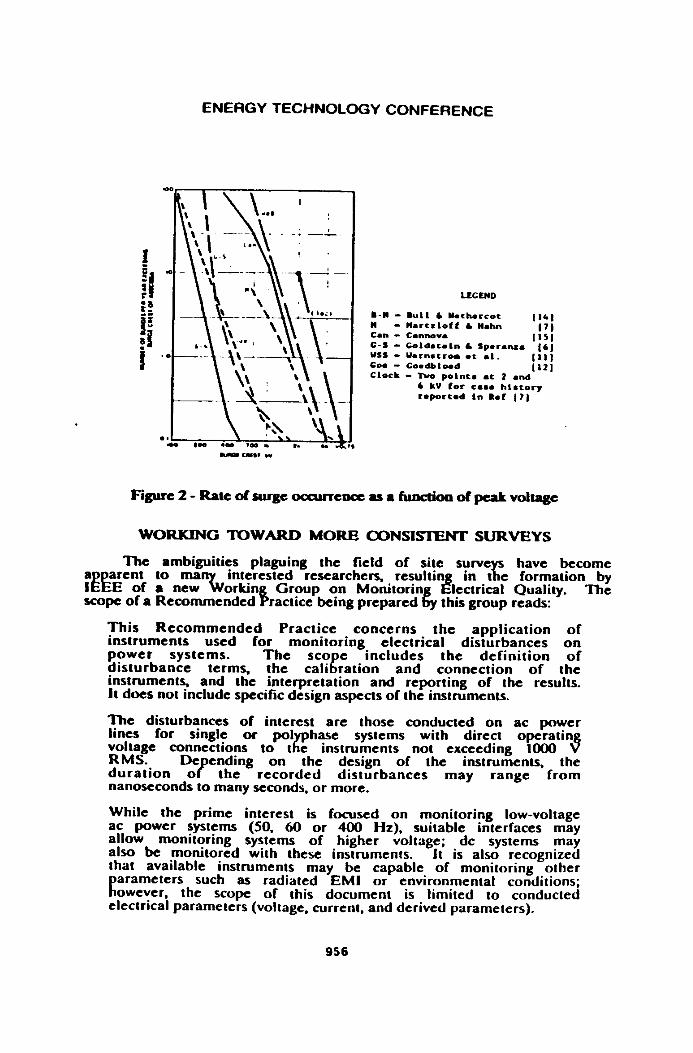
Agreement and disagreement on rate of occurrence versus levels. Several survey authors have attempted t o fit a classic statistical distribution o r a simple relationship between the rate of occurrence of surges and their amplitude. The motivation for such a simplified presentation might be rooted in a belief that nature obeys simpfe mathematical laws. The reality, however, is that so many different mechanisms contribute to the generation of surges that a
f si mR'e relationship is unlikely. Notwithstandin this rationale. a remnrka le finding emerges from plotting the resu ts of all the surveys on the same ~ r a p h . Figure 2 shows the relative distributions of the findings. normahzed for voltage level and frequency of occurrence for each survey re ort. The slope o f the lines is what can be compared. not P the abso ute rale of occurrence. 11 is remarkable that do es are
relvx is site-dependent. f similar among the surveys, although the absolute frequency o occur-
ENERGY TECHNOLOGY CONFERENCE
8 - I - Dub1 L Ymrhmrcot 114) H - Marrrloff & Hahn Can - Cannova 171
1151 C-S - Coldacrln L Sporarr 161 WSS - Uerns~rom OK a l . Coo - Coedblood r111
I121 Clock - point. rc 2 and
6 k V lor casm history rmpartod In ROC 171
Figure 2 - Rate of surge occurrence 8s 8.iuactioa of peak voltage
WORKING TOWARD MORE CONSISTENT SURVEYS
The ambiguities plaguing the field of site surve have become a arcnt lo ma interested researchers, resultin in t f e formation by I E ~ E of a new%orl;in ~ r o u p o n Monitorin h e t r i c a ~ Quality. me scope of r Recommended I rrctice being prepared & this group reads:
This Recommended Practice concerns t he application of instruments used for monitoring electrical disturbances o n power systems. The scope includes the definition of dis turbance terms, the calibration and connection of the instruments, and the interpretation and reporting of the results. It does not include specific design aspects of the instruments.
The disturbances of interest a re those conducted on ac power lines for single o r po lphase systems with direct o ratin voltage connections t o t e instruments not exceeding k '8 RMS. De ending o n the design of the instruments, the dura t ion or the recorded disturbances may range from nanoseconds t o many seconds, o r more.
While the prime interest is focused on monitoring low-voltage ac power systems (SO, 60 or 400 Hz). suitable interfaces may allow monitoring systems of higher voltage; dc systems F a y also be monitored with these instruments. It is also recogn~zed that available instruments may be capable of monitoring other
arametcrs such as radiated EM1 or environmental conditions; !owever, the scope of thir document is limited to conducted electrical parameters (voltage, current, and derived parameters).
ENERGY TECHNOLOGY CONFERENCE
EXPECTATlONS VERSUS R F ' i ON POWER QUALITY
lrnproved credibility of power quality data offers an opportuni to revis~t existing standards or develop new standards dealnng wit power quality. Three areas would benefit from this review:
1 1. More realistic definitions of rhe limits of system voltages. The limits currently defined are relatively small percentages (5 to 15%) of nominal values, Many anecdotal stories have been told on momentary overvolta es exceeding the limits of the only standard addressing these limits. & SI C84.1 (16). Until well documented, these stories can only remain anecdotal. However, ignoring them can lead to misapplication of surge protective devices by attempting to suppress surges at a level tao close to the momentary overvoltages that do occur.
2 Imprwtd comtosus on Lhc cbafacteristio of surges. The IEEE Guide o n Surge Voltages (91, dating back t o 1980, attempted lo simplify the situation by describing the surge environment w t h only two waveforms and an upper practical limit. Unfortunately, this Guide was misconstrued by some users as a mandatory standard. A revision is underway, proposing two additional waveforms and presenting the information in a manner that should discourage the misguided use of the document as a performance standard.
3 Im r w c d Consensus on harmonic oontrol. Harmonic causes and effects R ave been the subject of many studies and technical papers. but no performance standard exists to settle potential dis Utes between rwrce r and receivers of harmonic distortion. The prevaiEng document is a Guide (131; significant improvements are expected from a revision currently being conducted.
Power quality measurements. typically performed by site surve s. K have evolved from the simple mon~toring of surge voltages to t e sophisticated analysis of many criteria of power quality. There is still room for improvement in the procedures -- an tmprovement that can be guided b voluntary standards. Detailed observation of the issues r lead t o the fol owing conclusions:
1. Considerable progress has been made in the recording ca ability of monitoring instruments as the result of progress in the har $ ware and software used in digitizing systems. improvements include multi- channel synchronized recording of different parameters, fast data acquisition, automated data reduction. and improved resolution.
2. lmprwemeots in consistency must be made, commensurate with the steady progress and expanded capability of instruments. This greater consistency is needed in the definitions of the disturbance parameters a n d the methods of application of the monitoring Instruments.
3. Site-to-site variations in the occurrence of disturbances revent
base, P making precise predictions for a specific site from an overa 1 data
4. D i i r e n o t s among results indicated by a cursory comparison can be resolved by a closer examination o f the conditions under which the surveys were conductcd. lhwever, some differences are less likely to be explained if raw data have k e n processed and the initial parameter measurements are no longer available for review.
5. A new WEE Worki ig Croup on Monitoring Electrical Quality has been formed with a broad scope that encompasses this process of improving consistency i n definstions and interpretation of ower E disturbances. In addition, the lEEE Working Croup on Surge C arac- terization is also attemptin to obtain a broader data base for the b revision of the Guide on Surge oltqes.
6. lmprovcd ooopention. promoted by the process o f voluntary standards development and the exchange o f ideas made possible by forums such as the Energy Technology Conference, wil l avo~d some o f the difficulties on sharing the data PI recited in this paper. This paper is presented in sup rt of thls effort and to promote greater participation among intereste S" workers and usen.
REFERENCES
1. Martzloff. F.D.. and Grurs. T.M., "Power Qualit Site Surve s: Faca. Fiction, and Fallacies,' Con/rence R e c d , IEEH Industrial Commercial Power Systems Conference. May 4-7. 1 987.
2. htegbcc S t d a d fw SIIiPbOQllj Systems, DOD-!TID-1399, Sec. 300, 1978.
3. Ailen, G.W., 'Design o f Power-Line Monitorin Equipment,' IEEE Tlllul~cytions M POW Appomn~t Md Sys~ems, "01. PAS-&& N0.4 Nov/LXc 197 1
4. Key, T.S, 'Diagnosing Power Quality-Related Corn ter Problems,"
July/August 1979. P" IEEE Tmnsactions on Industry Applications, Vol. A-15, No. 4,
5. M e n . G.W., and Segall, D., 'Monitorin of Computer Installation for Power Un Disturbances,' IEEE PES hnter Metfin& Conference Paper f f 4 I 99-4, January 1974.
6. Goldstein, M., and S ranza. P.D.. "The Qualit o f U.S. Commercial AC Power.' Pmecdings O ~ ~ N T E L E C Confernncc, 82C d 1818-4.1982. 7. Martzloff, F.D., and Hahn, GJ., 'Surge Voltages in Residential and Industrial Power Circuits," IEEE Transactions on Power Apparatus & Systems. Vol. PAS-89, No. 6, July/ August 1970.
8. UL Standard for Suf* 943, Ground Fault Circuit Intemrprers, Undenvriters Laboratories, 1976.
9. Guide on Su e Voltages in Low-Voltage AC Power Circuits, ANSI/ WEE ~62.41-198.
ENERGY TECHNOLOGY CONFERENCE
10. Odenberg. R.. and Brrrskich, €3.. "Measurements of Voltage and Current Surges o n the AC Powcr Line in Computer and Industrial Environments." IEEE Trattsuctions on Power Appurrrtur mid Systents, Vul. PAS- 104. No. 10, October 1985.
11. ~ e r n s t r o m . )I., Broms, M., and Boberg, S., Transient Overvolra es on AC Power Supply Syrtrmr in Swedish Industry, Repon FOA & 3 W 2 - E 2 , Fuorsvarets Forskningsanstalt. tluvudavdel~ng 3. Sweden, 1984.
12, Goedbloed. J.J.. *Transients in Low-Voltage Supply Networks." IEEE Transactions on EMC. May 1987.
13. lEEE Guide for Hutmonic Control and Reactive Compensation of Static Power Converiers ANSl/IEEE Std 5 19- 198 1.
14. Bull. J.H. a n d Nethercot. M.A.. The Frequency of Occurrence and Ma nitude of Short Duration Transients in Law-Voltage Supply Mains.'
ro Electronic Engineer, September 1964. RJ, IS. Cannova . S.F., "Short - t ime Vo l t age T rans i en t s in Shipboard Electrical S stems,' Conference Record. 1EEE-IAS 1972 Annual Meeting, CH&~~-~- IA
1 6. American National Standard o r Electric Power Systems and Equipment - Voltage Ratings (# Hz), SI C84.1- 1982.