
Power Quality Measurements - A Review of Experiences from Three Diverse Industries… ·...
12
Power Quality Measurements - A Review of Experiences from Three Diverse Industries. By Terry Cousins, TLC Engineering Solutions Abstract Emergency power is required when reticulation supplies fail. Failure of distribution equipment such as transformers and cables can often be traced back to a history of poor power quality. In addition when emergency power is used to power equipment, it is necessary to check that the power quality is not sub-standard. Mission critical systems often operate directly from uninterruptible supplies. To ensure continued trouble free operation, continuous recording of power quality output is recommended. Power quality recorders are used to measure supply parameters. The motivation for these measurements differs between industries. This paper examines recordings and requirements for a steel mill, a cell phone provider and a toll road plaza. The steel plant is a large load adjacent to a residential area. Load fluctuations generate harmonics and flicker which has to be controlled to an acceptable level. Power quality recorders are used to monitor the incoming supply and alarm when the preset levels are exceeded. One of South Africa's three cellular communications providers requires a very high availability from its power system. Power quality recorders are used to monitor the performance of surge suppressors on the incoming supply as well as the condition of UPS equipment, inverters and standby generators. Toll roads plazas automatically provide billing to motorists using the roads. The power to this equipment must conform to certain standards. This is continuously monitored by power quality recorders to ensure that the billing equipment operates correctly and maintenance issues are identified. Industry 1: Steel Plant
Transcript of Power Quality Measurements - A Review of Experiences from Three Diverse Industries… ·...

Power Quality Measurements - A Review of Experiences from Three Diverse Industries.
By Terry Cousins, TLC Engineering Solutions
Abstract
Emergency power is required when reticulation supplies fail. Failure of distribution equipment such as transformers and cables can often be traced back to a history of poor power quality. In addition when emergency power is used to power equipment, it is necessary to check that the power quality is not sub-standard. Mission critical systems often operate directly from uninterruptible supplies. To ensure continued trouble free operation, continuous recording of power quality output is recommended.
Power quality recorders are used to measure supply parameters. The motivation for these measurements differs between industries. This paper examines recordings and requirements for a steel mill, a cell phone provider and a toll road plaza. The steel plant is a large load adjacent to a residential area. Load fluctuations generate harmonics and flicker which has to be controlled to an acceptable level. Power quality recorders are used to monitor the incoming supply and alarm when the preset levels are exceeded. One of South Africa's three cellular communications providers requires a very high availability from its power system. Power quality recorders are used to monitor the performance of surge suppressors on the incoming supply as well as the condition of UPS equipment, inverters and standby generators. Toll roads plazas automatically provide billing to motorists using the roads. The power to this equipment must conform to certain standards. This is continuously monitored by power quality recorders to ensure that the billing equipment operates correctly and maintenance issues are identified.
Industry 1: Steel Plant

INCOMING 132kV UTILITY SUPPLY
33kV PLANT SUPPLY
PLANT LOADS (EAF)
SVC Figure 1: Simplified Single Line Diagram of Steel Plant Incoming Supply
The steel plant is located approximately 160km from Johannesburg. It is a large load in close proximity to a residential area. A common load in a steel plant is an electric arc furnace (EAF). EAF’s are non-linear, time varying loads that often cause large voltage fluctuations and harmonic distortion. Most of the large current fluctuations occur at the beginning of the melting cycle. During this period, pieces of scrap metal bridge the gap between the electrodes resulting in a short circuit. The consequence of these large current fluctuations is to modulate the supply voltage at a frequency in the 0.1 to 10Hz range. This phenomenon is known as voltage flicker.
The change in voltage due to flicker is usually in the normal supply operating range. The changes are sufficiently rapid to provide a noticeable change in light output from certain lamps. This can be highly irritating to other customers. The steel plant has a power quality agreement with the utility to ensure that the level of flicker and harmonics are kept below an acceptable threshold. The steel plant makes use of a static var compensator (SVC) to reduce flicker, filter out harmonics, provide power factor correction and stabilize the plant voltage. The figures below illustrate how the harmonic content increases when the load changes from ideal (sinusoidal) to a typical EAF load (on-off).
Figure 2: Simulated Sinusoidal Load with Fundamental (50Hz)

Figure 3: Simulated EAF Load with Multiple Harmonics
The SVC performs the required power quality corrections automatically according to various power profiles. A power quality recorder is installed at the main incomer to continuously monitor key parameters and ensure the SVC is performing correctly. The SVC can stop operating correctly due to damage caused by lightning and switching transients as well as failure of components. Alarms are set for flicker and harmonic distortion. This ensures that the electrical pollution generated by the steel mill stays within the limits with the utility. In addition the power quality traces can be used to fine tune and optimize the operation of the SVC. The SVC also ensures that the supply to other loads in the plant contain the minimum of harmonics and voltage fluctuations. The plant has a number of electrically sensitive devices connected such as PLC’s, computer systems, communications infrastructure and variable speed drives. Damage or failure of many of these loads is critical to the production process and would result in a loss of revenue.
Some examples of the site measurements follow
Figure 4: Phase to Phase Voltage Dip on Steel Plant Supply
The top traces in figure 2 depict a severe phase to phase voltage dip on the 33kV busbar. This type of dip would be caused from a momentary short circuit between two phases during

the smelting operation of the EAF. This is supported by the sudden increase in current as shown by the current traces on the lower window.
Figure 5: Voltage Dip on Steel Plant Incoming Supply
The voltage dip in figure 3 is present on all 3 phases. There is no significant increase in phase current. This type of disturbance could be caused by a drop in the incoming supply voltage to the plant.
Figure 6: Voltage Flicker on Steel Plant Supply

Voltage flicker measurements over a 24 hour period is shown in figure 4. The red line indicates the short term result or Pst. This is typically measured over a 10 minute average. The green line is the long term value or Plt. The utility requires the Plt value to be less than 1.5.
Industry 2: Cellular Phone Company
UPS A UPS B
LV BUSBAR
CRITICAL LOADS
NON-CRITICALLOADS
UTILITY SUPPLY
STANDBYGENERATORS
AUTOMATIC CHANGEOVER
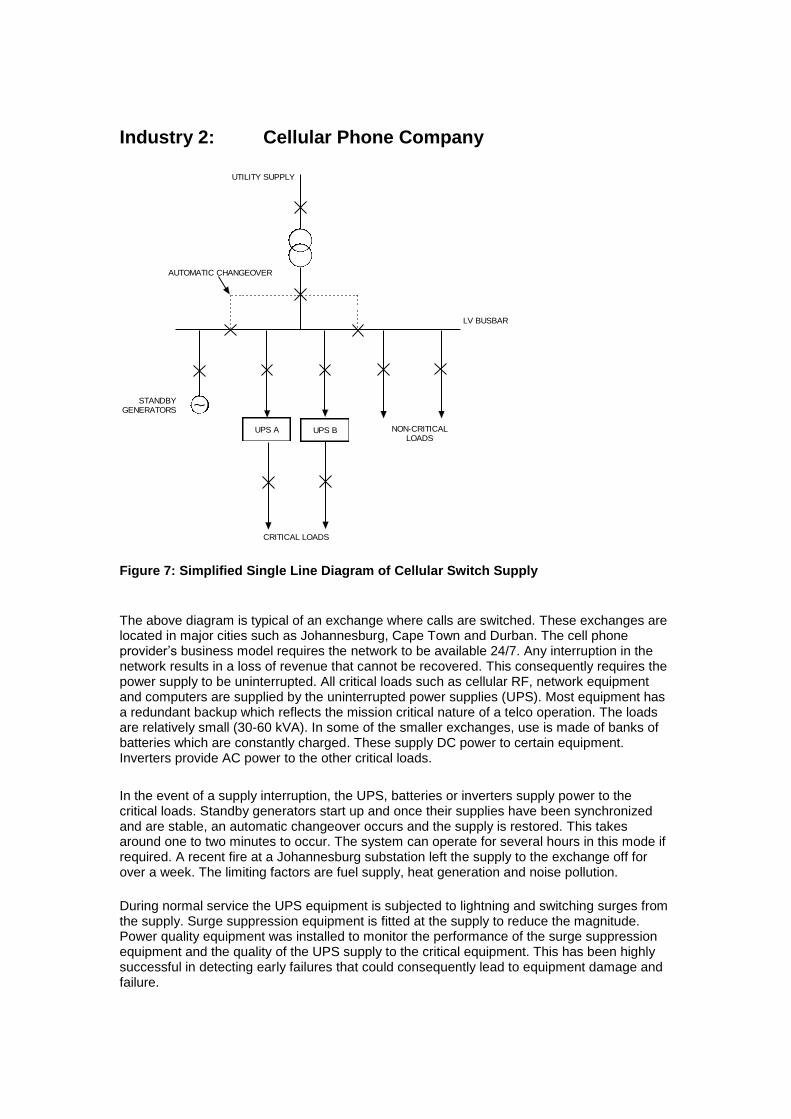
Figure 7: Simplified Single Line Diagram of Cellular Switch Supply
The above diagram is typical of an exchange where calls are switched. These exchanges are located in major cities such as Johannesburg, Cape Town and Durban. The cell phone provider’s business model requires the network to be available 24/7. Any interruption in the network results in a loss of revenue that cannot be recovered. This consequently requires the power supply to be uninterrupted. All critical loads such as cellular RF, network equipment and computers are supplied by the uninterrupted power supplies (UPS). Most equipment has a redundant backup which reflects the mission critical nature of a telco operation. The loads are relatively small (30-60 kVA). In some of the smaller exchanges, use is made of banks of batteries which are constantly charged. These supply DC power to certain equipment. Inverters provide AC power to the other critical loads.
In the event of a supply interruption, the UPS, batteries or inverters supply power to the critical loads. Standby generators start up and once their supplies have been synchronized and are stable, an automatic changeover occurs and the supply is restored. This takes around one to two minutes to occur. The system can operate for several hours in this mode if required. A recent fire at a Johannesburg substation left the supply to the exchange off for over a week. The limiting factors are fuel supply, heat generation and noise pollution. During normal service the UPS equipment is subjected to lightning and switching surges from the supply. Surge suppression equipment is fitted at the supply to reduce the magnitude. Power quality equipment was installed to monitor the performance of the surge suppression equipment and the quality of the UPS supply to the critical equipment. This has been highly successful in detecting early failures that could consequently lead to equipment damage and failure.

Some examples of the site measurements follow
Figure 8: Voltage Profile on Incoming and UPS Supply
As discussed above, it is imperative to ensure no interruption of the power supply to any critical loads occurs. Figures 6 to 8 illustrates the simultaneous measurement of incoming supply voltage and UPS output voltage. A severe voltage dip, total interruption and restoration of the incoming supply does not affect the UPS output voltage.
Figure 9: Incoming Supply Failure with Corresponding UPS Output
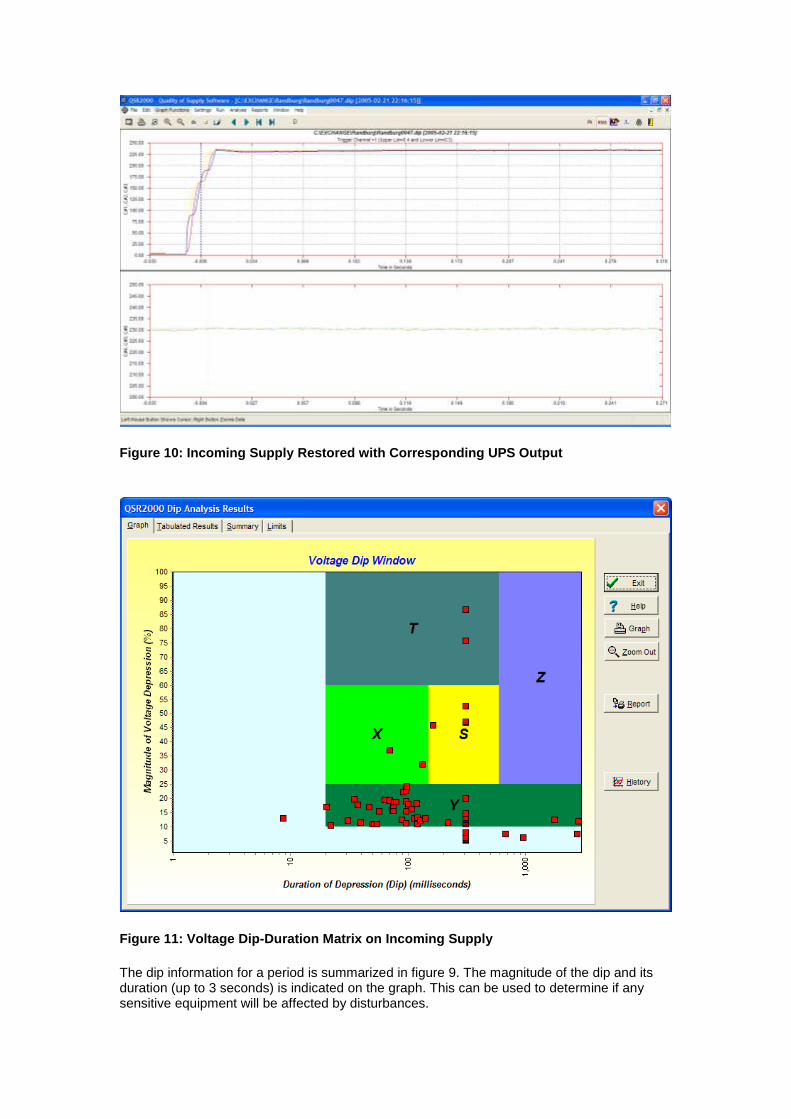
Figure 10: Incoming Supply Restored with Corresponding UPS Output
Figure 11: Voltage Dip-Duration Matrix on Incoming Supply
The dip information for a period is summarized in figure 9. The magnitude of the dip and its duration (up to 3 seconds) is indicated on the graph. This can be used to determine if any sensitive equipment will be affected by disturbances.
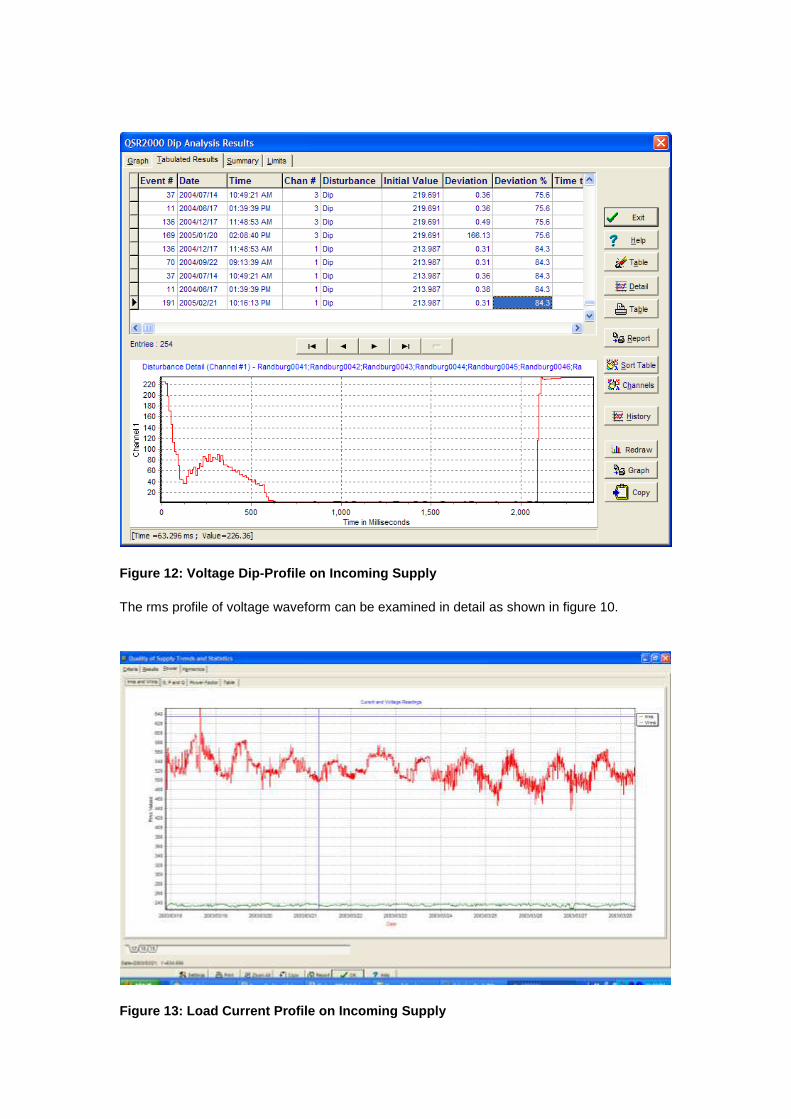
Figure 12: Voltage Dip-Profile on Incoming Supply
The rms profile of voltage waveform can be examined in detail as shown in figure 10.
Figure 13: Load Current Profile on Incoming Supply
The graph in figure 11 illustrates the cyclical nature of the load at the exchange. The red trace at the top is the rms current. The installed equipment generates a significant amount of heat. Air chillers are more active during the middle of the day when the ambient air temperature is higher. This increase in load is reflected on the current traces.
Industry 3: Toll Road Operator
UPS
LV BUSBAR
CRITICAL LOADS
NON-CRITICALLOADS
UTILITY SUPPLY
STANDBYGENERATORS
AUTOMATIC CHANGEOVER
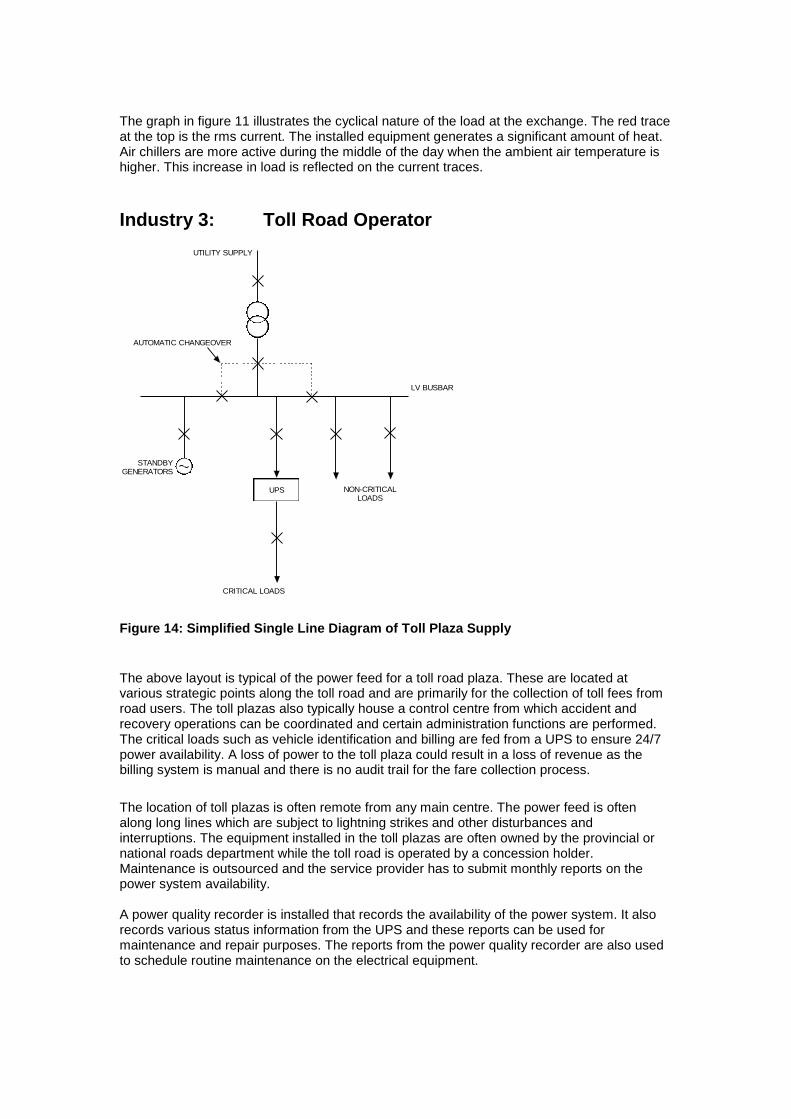
Figure 14: Simplified Single Line Diagram of Toll Plaza Supply
The above layout is typical of the power feed for a toll road plaza. These are located at various strategic points along the toll road and are primarily for the collection of toll fees from road users. The toll plazas also typically house a control centre from which accident and recovery operations can be coordinated and certain administration functions are performed. The critical loads such as vehicle identification and billing are fed from a UPS to ensure 24/7 power availability. A loss of power to the toll plaza could result in a loss of revenue as the billing system is manual and there is no audit trail for the fare collection process.
The location of toll plazas is often remote from any main centre. The power feed is often along long lines which are subject to lightning strikes and other disturbances and interruptions. The equipment installed in the toll plazas are often owned by the provincial or national roads department while the toll road is operated by a concession holder. Maintenance is outsourced and the service provider has to submit monthly reports on the power system availability. A power quality recorder is installed that records the availability of the power system. It also records various status information from the UPS and these reports can be used for maintenance and repair purposes. The reports from the power quality recorder are also used to schedule routine maintenance on the electrical equipment.

Some examples of the site measurements follow
Figure 15: Incoming Supply Voltage Profile with corresponding UPS Output Figure 13 illustrates the loss of incoming supply to the toll plaza while the UPS supply output remains at its nominal value.
Industry Similarities
All sites used in this paper have used recorders to examine and analyse the quality of the power supplies both from the bulk supply utility and from equipment installed on-site. By examining the data from the site it is possible to:
Quantify the quality of the incoming supply
Monitor the quality of outputs from equipment such as UPS’s
Categorize the site load
Identify certain classes of faults
Use the data as a planning tool for future maintenance and upgrades

Industry Differences
The operating objectives are different for each of the industries examined above. The objectives and reports from the power quality system will consequently differ. The steel plant is primarily interested in ensuring its SVC contains the level of pollution of the electrical supply. The cell phone and toll road operators both require continuous 24/7 power systems and monitor the electrical supply to ensure there are no imminent equipment failures.
Conclusion
Power quality recorders can be used to measure power parameters across a wide range of applications and industries. The goals and objectives of the company and industry will determine what parameters are recorded and what analysis is done. Equipment that is reliant on emergency power would benefit from power quality recording to ensure the regular supply and loads do not place undue stress on the electrical supply.
References Electrical Power Systems Quality, Dugan et al, 2nd Ed, McGraw Hill 2002 QSR2000 Power Quality Recorder Users Manual, TLC Software 2003


![FEBRUARY 2017MARCH 2019 Preparing Teachers for Diverse Schools Teachers... · Preparing Teachers for Diverse Schools [ 5 ] perspectives and experiences. Additionally, their curricula](https://static.fdocuments.net/doc/165x107/5f0853fc7e708231d4217719/february-2017march-2019-preparing-teachers-for-diverse-schools-teachers-preparing.jpg)


