Power Pivot and Power BI: The Excel User's Guide to DAX, Power ...
11
Power Pivot and Power BI: The Excel User's Guide to DAX, Power Query, Power BI & Power Pivot in Excel 2010-2016 by Rob Collie & Avi Singh Holy Macro! Books PO Box 541731 Merritt Island, FL 32954
Transcript of Power Pivot and Power BI: The Excel User's Guide to DAX, Power ...
Power Pivot and Power BI: The Excel User's Guide to DAX,
Power Query, Power BI & Power Pivot in Excel 2010-2016
by
Rob Collie&
Avi Singh
Holy Macro! BooksPO Box 541731
Merritt Island, FL 32954

iii
Table of ContentsDedications ........................................................................................................................................ivSupporting Workbooks and Data Sets ................................................................................................ivErrata and Book Support ....................................................................................................................ivA Note on Hyperlinks .........................................................................................................................ivForeword and Forward ........................................................................................................................vIntroduction - Our Two Goals for this Book ..........................................................................................11 - A Revolution Built On YOU .............................................................................................................22 - Power Pivot and the Power BI Family: Making Sense of the Various Versions .................................63 - Learning Power Pivot “The Excel Way” .........................................................................................144 - Loading Data Into Power Pivot......................................................................................................175 - Intro to Calculated Columns .........................................................................................................256 - Introduction to DAX Measures .....................................................................................................307 - The “Golden Rules” of DAX Measures ...........................................................................................488 - CALCULATE() – Your New Favorite Function ..................................................................................589 - ALL() – The “Remove a Filter” Function .........................................................................................6510 - Thinking in Multiple Tables .........................................................................................................7111 - “Intermission” – Taking Stock of Your New Powers .....................................................................8212 - Disconnected Tables ...................................................................................................................8313 - Introducing the FILTER() Function, and Disconnected Tables Continued ......................................9214 - Introduction to Time Intelligence ..............................................................................................10215 - IF(), SWITCH(), BLANK(), and Other Conditional Fun ..................................................................12116 - SUMX() and Other X (“Iterator”) Functions ...............................................................................13017 - Multiple Data Tables .................................................................................................................13918 - Multiple Data Tables – Differing Granularity .............................................................................15219 - Performance: Keep Things Running Fast ...................................................................................16220 - Power Query to the Rescue ......................................................................................................17321 - Power BI Desktop .....................................................................................................................20522 - “Complicated” Relationships ....................................................................................................21723 - Row and Filter Context Demystified ..........................................................................................23024 - CALCULATE and FILTER – More Nuances ....................................................................................24025 - Time Intelligence with Custom Calendars: Greatest Formula in the World ................................24526 - Advanced Calculated Columns ..................................................................................................26227 - New DAX Functions… and Variables! ........................................................................................27328 - “YouTube for Data” – The Importance of a Server .....................................................................288PS: Can We Ask You for a Special Favor? ..........................................................................................296A1 - Power Pivot and SSAS Tabular: Two Tools for the Price of One (again!) .....................................297A2 - Cube Formulas – the End of GetPivotData() ..............................................................................304A3 - Some Common Error Messages ................................................................................................307A4 - People: The Most Powerful Feature of Power Pivot ..................................................................309Index .......................................................................................................................................................311

6 Power Pivot and Power BI: The Excel User's Guide to the Data Revolution
2 - Power Pivot and the Power BI Family: Making Sense of the Various VersionsIt’s a Family of Products Built on Shared Engines
Figure 2 “Power Soup” – There are at Least Six MS Data Products Running Around with the “Power” Prefix. But don’t worry! We are here to clear all that up.
“Should I use Power Query or Power Pivot or Power View or Power BI?”Ah, a fair question, but one with a surprisingly simple answer: you ALWAYS use Power Pivot! There is, indeed, an entire family of closely-related Microsoft products in this data analysis and reporting space, but they all revolve around Power Pivot. Let’s start simple and then add pieces back to the puzzle.Power Pivot is the Center of the Power BI Universe
Figure 3 Power Pivot is the centerpiece, no matter which “family members” you’re using!
Power Pivot is the central engine that powers all of your souped-up workbooks and BI solutions. It is the brain, the heart, and the spinal cord all in one. We like to say that Power Pivot is the piece that turns data into information – feed it “large” quantities of data (where sometimes even 100 rows is “large”) and it will help you crunch it down into meaningful metrics.As Microsoft continues to evolve its strategy and messaging, we’ve started to refer to Power Pivot as “the DAX engine.” That’s because it (Power Pivot) is starting to appear in more products, and in some of those products (such as Power

72 - Power Pivot and the Power BI Family: Making Sense of the Various Versions
BI Desktop), the “Power Pivot” moniker has been retired. Rest assured, however that the DAX Engine / Power Pivot is THE crown jewel (AND brain / heart / spinal cord – yes, we love metaphors around here) of everything in Microsoft’s BI suite. As they used to say on the pasta sauce commercials, “It’s in there!” (Even though the ingredients list of Power BI Desktop omits it).Using Power Pivot / the DAX engine, you build a data model, create relationships, write calculated column and measure formulas, etc. We will primarily focus on this portion in our book, because the Power Pivot data model is what subse-quently drives all of the reporting/visualization/analysis tools.
Power Query is a Close Second in ImportanceBut an engine needs fuel, and in this case, the fuel is data: whether big or small, 100 rows or 100 million rows, coming from the web or a database, a text file or a spreadsheet. You will want to pull all of your business data into Power Pivot (not all in one day of course. Start small, iterate fast: Power BI is agile BI).So this brings us to our second-favorite component of the Power BI family… Power Query!
Figure 4 Two ways to get data into Power Pivot: direct import, or via Power Query
Power Pivot can grab data directly from a wide variety of sources (covered in the chapter on Loading Data). But some-times it needs a little help. Sometimes, before you can bring the data into Power Pivot, you need to do some shaping, some cleanup, and maybe some data transformation. There is a tool built specifically for that – Power Query. And boy, does it shine at that task. Power Query is a great way to bring data into Power Pivot.
For a long time our biggest reservation with Power Query was the lack of ability to easily automate the re-fresh of Excel workbooks that employ Power Query. We are thrilled to offer the Power Update tool (co-cre-ated by PowerPivotPro) which can help you do that and a lot more. Get it at http://ppvt.pro/pwrupdate
So Power Query is an optional piece of the puzzle: you aren’t forced to use it, but it’s there if you need it. In our ex-perience, whether you need it depends primarily on this: do you have good database support? If most (or all) of your data is coming from databases, AND the people who run those databases are responsive to your requests, you are a member of a very fortunate minority! In such an environment, you can get your data cleaned and re-shaped before it ever reaches your desktop, and so Power Query has less utility. But most environments are “noisier” than that, and Power Query really shines in those places – as a complement to Power Pivot. More specifically, we can view it as a “pre-processor” that cleans and shapes “noisy” data, before it’s im-ported, so that Power Pivot can do its best work.
Figure 5 Power Query in Excel 2013: For Shaping and Cleaning Data Before Power Pivot Ever “Sees” It.

8 Power Pivot and Power BI: The Excel User's Guide to the Data Revolution
As of mid-2015, Microsoft is completely retiring the “Power Query” name: In Excel 2016, it no longer has its own ribbon tab for instance, and is instead called “Get & Transform” on the Data ribbon tab. That’s en-tirely sensible in our opinion, and the important thing is that the engine remains the same. Similarly, Power BI Desktop (described below) includes Power Query but no longer calls it that. Instead, you get to it via buttons like “Get Data” and “Queries.” Again, entirely sensible, and again, the engine remains the same.So, much like we now often refer to the Power Pivot engine as the “DAX Engine,” you will also see us refer to Power Query’s engine as the “M Engine.”See the chapter specifically on Power Query for more info.
Visuals: The Crucial “Last Mile”
Figure 6 Power View and Power Map are Visualization Layers… But so is Excel Itself!
Power Pivot itself offers no visualization options – it can calculate meaningful metrics, but cannot display them effec-tively to end consumers and decision makers. Think of Power Pivot as a Calculation Layer that provides robustly-calcu-lated metrics to a variety of Visualization Layers.
• Excel: The most popular visualization layer of all is Excel itself. Most people build Excel pivot tables and charts connected to their Power Pivot data model (not to mention another favorite of ours, cube formulas!) Excel visuals are a great option, and within the Excel-based flavors of Power BI, it’s still the option we recommend most frequently. You also have several other visualization layers to choose from, however, so we’ll mention those here as well.
• Power Map: Introduced in Excel 2013, we’re not entirely sure that Microsoft plans to feature Power Map all that heavily in its future plans. In Excel 2016, it has been renamed to just “3d Maps.” You absolute CAN use it to visualize Power Pivot data, but it’s become enough of a “niche” product that we don’t use it in our business.
• Power View: Power View is another ‘client’ that can render Power Pivot data onto interactive dashboards. There’s a version of Power view included in Excel 2013 (Pro Plus version only), another one in Excel 2016 (although it’s hidden from the Excel ribbon), and even a bit of an outlier: a version that exists solely within SharePoint 2010 and higher. It’s fair to say, however, that Power View does NOT figure heavily in Microsoft’s future plans, and we don’t recommend going “all in” on Power View as your organization’s visualization layer of choice. Increasingly, it’s becoming clear that the two primary visualization “horses” in Microsoft’s stable are going to be Excel itself, and Power BI Dashboards, which we will cover next.
• Power BI Dashboards: Until recently, Excel has been the only “environment” in which the Power BI tools were available. If you wanted to do some Power Pivot / DAX modeling, you launched Excel and went from there. But in 2015, Microsoft released a second environment, called Power BI Desktop. Power BI Desktop includes the two engines (Power Pivot and Power Query), as well as a brand-new visualization layer called Dashboards. Dashboards looks a bit like Power View, but whereas Power View was somewhat of a frustrating half-step, Power BI Dashboards are very robust/complete. They offer MANY visualization types that are not available in native Excel, the list of visualizations grows seemingly with every release, AND they have opened the platform

92 - Power Pivot and the Power BI Family: Making Sense of the Various Versions
up so that third-party programmers can add their own custom visualization types. Power BI Desktop and its companion cloud service are therefore worthy of their own chapter, which you will find later in this book.
• Others: As if this isn’t excitement enough, we also have SQL Server Reporting Services, Datazen and many oth-er Microsoft and non-Microsoft tools – it seems everyone is “lining up” to connect their visualization software to the Power Pivot engine, and for good reason.
To enable some of these other visualization options you will need a true “Server” version of Power Pivot. We’ll cover that in our chapter on “YouTube for Workbooks.”
Once your Power Pivot data model is built, reporting becomes “cheap” – a matter of mouse clicks in a field list (the field list provided by the visualization layer, such as Excel’s PivotTable field list). New reports, and variants on existing reports, are borderline-effortless to assemble since all the business logic has been built at that point. With all the heavy lifting taken care of by your Power Pivot data model, you can easily use not just one but many reporting tools. Power Pivot then becomes your single source of truth, the single engine that powers all your reporting across various reporting platforms and serving various groups of audiences.
You will rarely, if ever, catch a glimpse of Power Pivot (or Power Query for that matter) in any of Microsoft’s public Power BI Demos. In their materials, the limelight is squarely on the sexy visualizations. And we’re okay with that. Microsoft’s competitors have long used that approach to sell their wares, and Microsoft is just borrowing a page from that book. But anyone getting down to implementing Power BI quickly learns that behind the scenes, Power Pivot is the engine driving Power BI.
Microsoft made an announcement in Oct, 2015 rolling out their "Reporting Roadmap". It promises:• Symmetry across On-Premise and Cloud. Currently the cloud options on PowerBI.com have raced
ahead of any On-Premise reporting options.• Making various reporting options - SSRS, Power BI Desktop, Datazen etc. - work together in harmony. • A rejuvenated SQL Server Reporting Services (make it look like a tool from this century, as James
Phillips put it)For more, see http://ppvt.pro/rptroadmap
Power BI Desktop: Two Tools for the (Learning) Price of One!
Figure 7 Excel Power Pivot (left) versus Power BI Desktop: Visually Distinct, but the same “Under the Hood.”
Same Engines, Just Different VisualsWe will cover Power BI Desktop in greater depth in a subsequent chapter, but we think it’s important to lodge this in your brain up-front: when you are learning Power Pivot in Excel, you are also learning Power BI Desktop. The “tough” things to learn, which are also the valuable things to learn, are the same in both Power Pivot (Excel) and Power BI (Desktop). In fact, that’s important enough that it warrants its own callout…

10 Power Pivot and Power BI: The Excel User's Guide to the Data Revolution
The “tough” things to learn, which are also the valuable things to learn, are the same in both Power Pivot (Excel) and Power BI (Desktop).So when you learn one, you are actually learning two amazing tools for the price of one.
So here’s the upside of all this “Power Soup” confusion: as the dust settles in Microsoft’s evolving strategy, we have been given TWO amazing tools: Power Pivot in Excel, and Power BI Desktop, and we don’t have to “invest double” in order to “win double.”
Figure 8 Think of it this way: Excel and PBI Desktop are the “containers.” The engines are the same in both places, only the visual-ization layers differ.
What do we mean by the “tough” or “valuable” stuff?
Figure 9 Power Pivot’s Diagram View sure looks a LOT like Power BI’s Relationship View, because the DAX Engine is the heart of both.
“Hrm,” you say. “The view with the boxes and the lines is the same, but I’m still not convinced. I mean, there can still be a lot of OTHER differences hiding in there, right?”Well sure! You haven’t even seen the formulas yet! Let’s see if you can spot the difference between a “Year to Date Sales” formula in Power Pivot versus Power BI…Power Pivot version:
YTD Sales=
CALCULATE ( [Total Sales], DATESYTD( Calendar[Date] ) )

112 - Power Pivot and the Power BI Family: Making Sense of the Various Versions
And the Power BI Desktop version:YTD Sales=
CALCULATE ( [Total Sales], DATESYTD( Calendar[Date] ) )
Trick question, they are EXACTLY the same! Because, hey, it’s the DAX engine in both places.
In Power BI Desktop, the DAX Engine doesn’t get its own separate special name like “Power Pivot.” Its ca-pabilities are just exposed in the Relationship view, and in the formulas you write. This makes sense to us – less name clutter. DAX Jedi (or Jedi-in-training) like you, dear reader, should not be concerned by this cosmetic “lack of name.”
So, to recap, the engines are the same in both Power Pivot and Power BI. Here’s one final summary diagram:
Figure 10 Excel Power Pivot and PBI Desktop overlap in the stuff that warrant your time reading books like this one. Visuals, by contrast, are easy-to-learn, mouse-clicky stuff. You don’t really need to “read the manual” to figure out how to build a chart in either environment.
In the official Microsoft messaging, “Power Pivot” now refers strictly to the DAX engine in Excel, with its Power Pivot ribbon tab and Power Pivot window, and “Power BI” now refers strictly to Power BI Desktop (and its accompanying PowerBI.com cloud publishing mechanism).Over time we will be slowly adopting this official naming as well, but the community will understandably take some time to adjust.
We will come back to Power BI Desktop in its own dedicated chapter. But in the meantime, just remember that every-thing you’re learning in subsequent chapters is useful in BOTH Power Pivot and Power BI.
Power Pivot (in Excel) VersionsFocusing specifically on Power Pivot (the Excel-based version of these tools) there have now been four different major releases:

12 Power Pivot and Power BI: The Excel User's Guide to the Data Revolution
• Power Pivot 2008 R2 (v1) – We simply call this “Power Pivot v1.” The “2008 R2” relates back to a version of SQL Server itself and has little meaning to us. This runs exclusively in Excel 2010, and since it’s been superseded, there is very little reason to use this version. (If you are running a version of Power Pivot that starts with a 10, like 10.x.xxxx, that version is WAY out of date and should upgrade – we will NOT cover v1 in this book at all).
• Power Pivot 2012 (v2) – unsurprisingly we call this “Power Pivot v2.” Again the 2012 relates to SQL Server, and again, we don’t care that much. But we DO care that THIS is THE version to be running if you are running Excel 2010. Whenever we refer to Power Pivot 2010 in this book, we are referring to THIS version. (Make sure you are running 11.0.5058 or newer).
• Power Pivot 2013 – released with Excel 2013.• Power Pivot 2016 – released with Excel 2016.
You will get the same value out of this book regardless of the Excel version you are using. Under the covers, funda-mentals are the same and little has changed. We will talk about some of the cosmetic changes in the User Interface (UI) changes in this chapter. (The 2016 release has introduced some new DAX functions, which are covered in a separate chapter, but those should be thought of as “extras” rather than overhauls.)Here is a primer on how you can use Power Pivot based on your version of Excel.
Power Pivot for Excel 2010If you have Excel 2010, we exclusively recommend the v2 version, which offers many improvements over v1, which is now dead to us and will get no “air time” in this book. You can download the v2 version at: http://ppvt.pro/ppaddin2010SP2
Power Pivot for Excel 2013 - Only Available in “Pro Plus” ExcelMicrosoft really surprised us at the last minute, just as 2013 was officially released. It was quietly announced that Pow-er Pivot would only be included in the “Pro Plus” version of Office 2013. This is NOT the same thing as “Professional” – Pro Plus was only available through volume licensing or subscription and was not available in any store. And unlike with 2010, there is no version of Power Pivot that you can just download for Excel 2013.This put Power Pivot out of reach for many individuals. After much noise, on our part and others, Microsoft softened their stance and now individuals can get Power Pivot by either buying Excel 2013 Standalone or an Office 365 Pro Plus subscription. For more on this, see http://ppvt.pro/2013ProPlusThis was an improvement, but still a source of great frustration (just read the comments on the link shared above).Office 2016 offers further improvement to this story, by including Power Pivot (and Power Query) in Standalone Excel (just like 2013), and all versions “Pro” and higher (whereas 2013 required Pro Plus). Still though, it is not included in all versions, so be careful to get Pro or Excel Standalone when making your purchase.
Differences in User Interface: 2010, 2013, 2016The User Interface (UI) of Power Pivot differs - in cosmetic ways ONLY - between Excel 2010, 2013, and 2016. Mostly it’s just the names of buttons that have changed, but there are a few others, too. Whenever there’s a notable difference in UI between the versions, we will “pause” here in this book and show what it looks like in each version, at the moment where we first “introduce” that functionality.
Aside from Rob: When I worked at Microsoft, I used to LOVE renaming features. I’d see a button that I thought had been poorly-named in a previous version and say “let’s improve it!” I even tried to rename PivotTables! Now that I’m on the receiving end of that behavior, I see the hubris in my younger self. Poetic justice, that I now suffer the consequences of my former peers’ desire to constantly improve things. (I STILL think pivots should be renamed SummaryTables, though. Kidding. Mostly.)
The “default” version for screenshots in this book will be 2010, because that version usually yields the most helpful screenshots (see “awkward” below). Many of the screenshots and figures will therefore have the 2010 appearance. However, we want to again stress:
1. All concepts covered in this book are 100% applicable to 2010, 2013, AND 2016, because it’s the DAX engine in all three cases, and that has changed hardly at all.
2. The differences between the three versions are purely cosmetic in nature. All of the core functionality – such as formulas and functions - behaves the same. The main difference is in the user interface (UI), e.g. which but-ton you click to edit a formula or insert a pivot table.
132 - Power Pivot and the Power BI Family: Making Sense of the Various Versions
3. Whenever there’s a UI difference that is significant, we will cover that in the book. And we will do that in the context of introducing each new button or other UI element.
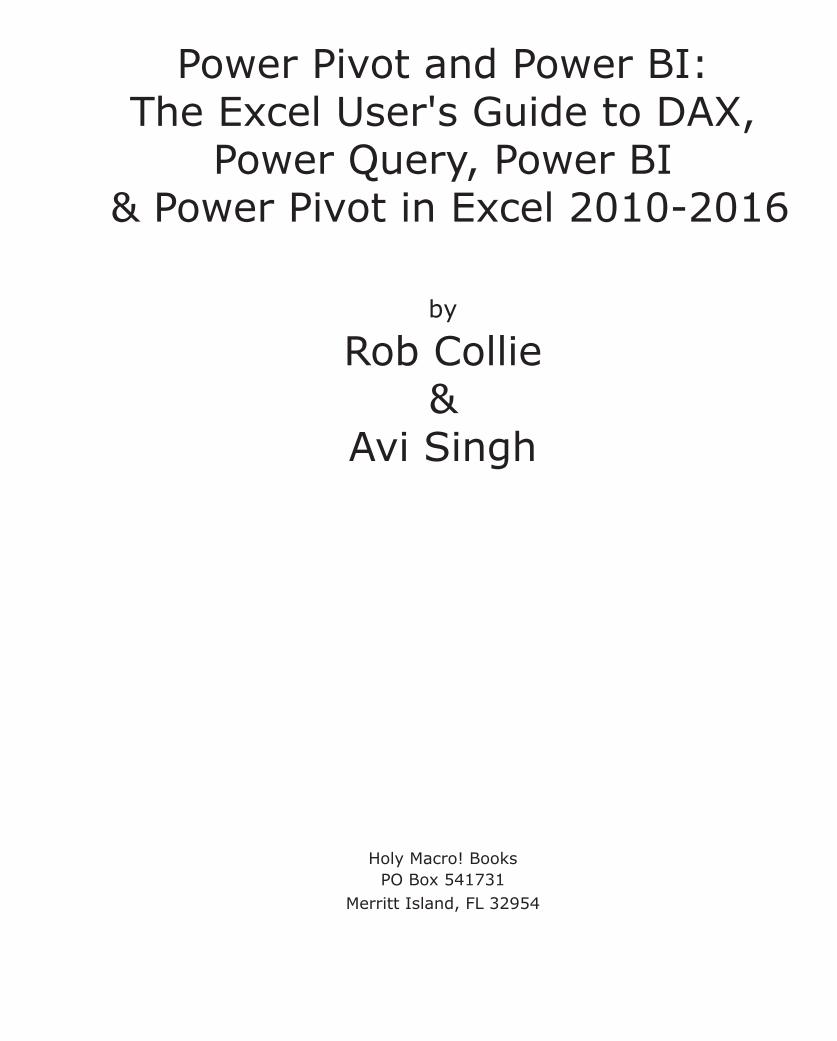
If you ever want to see all the notable 2010/2013/2016 UI differences in one place, this page - http://ppvt.pro/UIchanges - col-lects them all into an online “appendix” of sorts. See example below.
Figure 11 http://ppvt.pro/UIchanges maps all the UI changes from Power Pivot across Excel 2010, 2013, and 2016.
When We Said “Cosmetic” We Meant “Awkward”There is no way to sugar coat it, the user interface took a step back-ward from 2010 to 2013. It became harder to perform some routine data modeling steps - such as to find and edit formulas, or to insert a pivot or slicer. It’s more awkward (more mouse clicks, harder to find) to perform these actions in 2013 than it is in 2010. 2016 has restored most, but not all, of the convenient UI functional-ity. Our consolation again, is that everything under the hood, beyond the minor UI changes, works just the same and just as well.OK, we got that off our chests. Let us continue
32-bit or 64-bit?Each of the three versions of Power Pivot is available in two “flavors” – 32-bit and 64-bit. Which one should you use? On the Microsoft download websites, 32-bit is labeled “x86” and 64-bit is labeled “AMD64.” You know, just to make things interesting.If you have a choice, we highly recommend 64-bit. 64-bit lets you work with larger volumes of data but is also more stable during in-tensive use, even with smaller data volumes. We run 64-bit on all of our computers. For example, I (Rob) have a 300 million row data set that works fine on my laptop with 4 GB of RAM, but with 32-bit Power Pivot, no amount of RAM would make that possible. (In fact, it would not work even if I cut it down to 20 million rows).
So if you have a choice, go with 64-bit – it offers more capacity and more stability. That said, you may not have that luxury. You have to match your choice to your copy of Excel.
You cannot run 64-bit Power Pivot with 32-bit Excel, or vice versa!
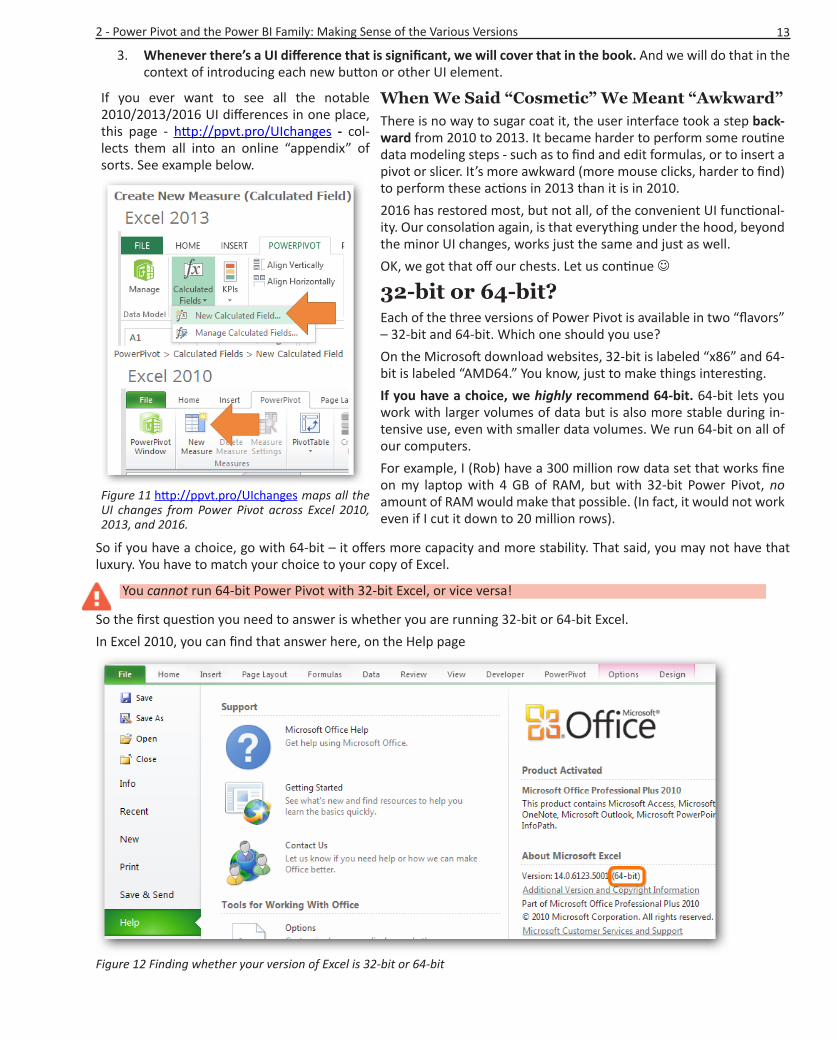
So the first question you need to answer is whether you are running 32-bit or 64-bit Excel.In Excel 2010, you can find that answer here, on the Help page
Figure 12 Finding whether your version of Excel is 32-bit or 64-bit

14 Power Pivot and Power BI: The Excel User's Guide to the Data Revolution
If you are running 32-bit Excel, you are not alone: most people are running 32-bit. We actually can think of no reason to run 64-bit Office except Power Pivot itself, so the 64-bit trend is really just getting started. (Who needs 64-bit Out-look, Word, and PowerPoint? No one does).
Certain Office addins only run in 32-bit, so double check that before you decide to uninstall 32-bit Office and switch to 64-bit.
The 64-bit problem is often solved by having a second computer purely for Power Pivot “authoring” pur-poses, and maintaining your original computer on 32-bit for compatibility with other Office addins. In cas-es where that’s not practical, we’ve also frequently seen IT set up shared computers with 64-bit, and then Power Pivot authors can remotely use those computers via Remote Desktop. Lastly, this is one of the big reasons to consider Power BI Desktop, since you can run it in 64-bit without disrupting your Office install, which can remain 32-bit.
Office 2010 or Newer is RequiredNo, sadly you cannot run Power Pivot with Excel 2007 or earlier versions.There were very good technical reasons for this, and it was not an attempt by Microsoft to force people into Office 2010. Remember, the Power Pivot addin is free, and it would have been better for Microsoft, too, if Power Pivot worked with 2007.If you are curious as to the reasons behind the “2010 or newer” requirement, see this post:http://ppvt.pro/PP2007