
Power March 2014
74
a r c h 2 0 1 4 • V o l 1 5 8 • o . 3 V ol. 158 • No. 3 • March 2014 New Roles for Old Fossil Plants Coping with Coal Combustion Residuals From W aste to Ferti lizer Peru’ s LNG Export Experience Polygeneration’ s Promise
-
Upload
chongchoifatt -
Category
Documents
-
view
217 -
download
0
Transcript of Power March 2014

7/22/2019 Power March 2014
http://slidepdf.com/reader/full/power-march-2014 1/82
Vol. 158 • No. 3 • March 2014
New Roles for Old Fossil Plants
Coping with Coal CombustionResiduals
From Waste to Fertilizer
Peru’s LNG Export Experience
Polygeneration’s Promise

7/22/2019 Power March 2014
http://slidepdf.com/reader/full/power-march-2014 2/82
We see what you can’t.
CIRCLE 1 ON READER SERVICE CARD

7/22/2019 Power March 2014
http://slidepdf.com/reader/full/power-march-2014 3/82March 2014 |POWER www.powermag.com 1
On the coverBefore the 1950s-era Huntington Beach natural gas plant undergoes a complete modern-ization and facelift befitting a Los Angeles facility, it has taken on a completely new andcritical role: grid support. Courtesy: Siemens Energy and Chet Williams Photography
COVER STORY: GRID SUPPORT30 AES Uses Synchronous Condensers for Grid Balancing
Especially as grids accommodate more intermittent renewable power and operate un-der increasingly stringent emissions regimes, some power plants may find that theirhighest and best use is something other than generating real power, or energy.
SPECIAL REPORT: THE FUTURE OF COAL-FIREDGENERATION
36 Is Polygeneration the Future for Clean Coal?Phones are no longer used just for making voice calls. In fact, many of us use mobilephones for a range of functions that have nothing to do with talking. A similar transi-tion to multifunctionality could become part of future coal power plants.
39 The Role of Activated Carbon in a Comprehensive MATS StrategyExtensive mercury monitoring at Southern Co. units suggests that, although unit-specific situations need to be considered, an engineered, or active, mercury controltechnology using advanced powdered activated carbon could help you comply withthe Mercury and Air Toxics Standards.
44 Converting Sulfur from Flue Gas into FertilizerTurning coal combustion byproducts into saleable materials is nothing new, but asthe cost of complying with environmental regulations escalates, the business casefor new and improved reuse options is likely to improve.
47 Be Prepared for Coal Ash RegulationsCould this, finally, be the year the Environmental Protection Agency finalizes rulesfor coal combustion residuals? The compliance schedule will be tight when a deci-sion is made, so evaluate your options now.
Established 1882 • Vol. 158 • No. 3 March 2014
30
39
47
Connect with POWERIf you like POWER magazine, follow us online for timely industry news and comments.
Become our fan at facebook.com/POWERmagazine
Follow us on Twitter @POWERmagazine
Join the LinkedIn POWER magazine Group
This sponsored report by Global Business Reports (after p. 66) predicts “a bright and
blustery future” for Brazil’s vast electricity market, the 10th largest in the world.
Change and Opportunity in Brazil

7/22/2019 Power March 2014
http://slidepdf.com/reader/full/power-march-2014 4/82
Pulling Aheadas ONE
MITSUBISHI HITACHI POWER SYSTEMS
CIRCLE 2 ON READER SERVICE CARD

7/22/2019 Power March 2014
http://slidepdf.com/reader/full/power-march-2014 5/82
The global merger of Mitsubishi Heavy Industries’ and
Hitachi’s thermal power generation businesses integratestwo leaders in world class technology – creating Mitsubishi Hitachi
Power Systems.
This historic combination represents over 240 years of innovative
products, systems and services. Now, Mitsubishi Hitachi Power
Systems delivers the talent and technology of both companies as
a single source solution for existing and evolving energy needs.
Visit us online to learn more about our world class capabilities.
Mitsubishi Hitachi Power Systems Americas, Inc.
www.mhpowersystems.com
Mitsubishi Hitachi Power Systems America – Energy and Environment, Ltd.
www.psa.mhps.com

7/22/2019 Power March 2014
http://slidepdf.com/reader/full/power-march-2014 6/82 www.powermag.com POWER |March 20144
FEATURES
OPERATIONS & MAINTENANCE
51 Adaptive Brush Seals Restore Air Preheater PerformanceAir preheater seal degradation is difficult to identify and often overlooked as respon-sible for loss of fan margin, loss in boiler efficiency, problems with downstream airquality control equipment, and lost revenue. This case study demonstrates how anewer type of seal can solve those problems.
54 Modern Polymeric Materials Offer Options for Equipment RepairHydropower plant maintenance has been challenged in recent years by water avail-ability—just as the availability of hydropower is becoming increasingly important tothe supply mix. The right coatings can maximize runtime and minimize maintenanceheadaches.
SUPPLY CHAINS
58 The Future of Utility Supply Chain ManagementIn the face of heightened concerns about recovery from natural disasters, the cy-bersecurity of equipment coming from vendors around the globe, and cost contain-ment, no generator can afford to forego supply chain improvements.
FUEL SUPPLIES
62 The LNG Export Debate: Lessons from PeruThe U.S. isn’t the first nation to consider the pros and cons of exporting largeamounts of natural gas. Though every scenario is different, there are lessons tobe learned from Peru’s decade of developing its liquefied natural gas (LNG) infra-structure.
INDUSTRY TRENDS
65 Facing Challenges from Natural Disasters to Customers as GeneratorsThe number of disruptive forces faced by the electric power industry seems to begrowing exponentially. Here’s how some of the key speakers at April’s ELECTRICPOWER see the major developing trends.
DEPARTMENTS
SPEAKING OF POWER
8 What Is a Fossil Power Plant?
GLOBAL MONITOR
10 Forced Closure of Nuclear Plant Is Unlawful, German Supreme Court Rules10 The Advent of Flexible Coal12 MHI, Southern Co. Complete Demonstration Phase of CCS Test14 THE BIG PICTURE: Coal’s Export Future17 Statkraft Shelves Osmotic Power Project18 Developing the World’s First Magma-Enhanced Geothermal System19 POWER Digest
FOCUS ON O&M
22 Customized Storage Solution Improves Efficiency24 Practical Considerations for Converting Industrial Coal Boilers to Natural Gas
LEGAL & REGULATORY
28 When States Try to Manipulate Wholesale Power MarketsBy Thomas W. Overton, JD
COMMENTARY
76 America Needs Continued Coal UseBy Mike Duncan, president and CEO, American Coalition for Clean Coal Electricity
54
10
24

7/22/2019 Power March 2014
http://slidepdf.com/reader/full/power-march-2014 7/82
Answers for energy.
Look no further than Siemens – the instrumentation,
controls and electrical provider that actually builds
power plants from the ground up. No matter what
your power plant ratings, from industrial to nuclear,
our SPPA-E3000 Excitation Systems are developed for
your specific requirements. Whether your application
calls for a static, compound or brushless system, we
deliver innovative technologies that can be used with
generators from any manufacturer, with the added
value of Siemens’ unparalleled expertise.
For more information, call 678-256-1500.
Before you replace your excitation system,take a close look at your options.
siemens.com/energy/controls
Siemens excitation systems are solutions customized to your specific needs.
CIRCLE 3 ON READER SERVICE CARD

7/22/2019 Power March 2014
http://slidepdf.com/reader/full/power-march-2014 8/82 www.powermag.com POWER |March 20146
Visit POWER on the web: www.powermag.com
Subscribe online at: www.submag.com/sub/pw
POWER (ISSN 0032-5929) is published monthly by AccessIntelligence, LLC, 4 Choke Cherry Road, Second Floor, Rock-
ville, MD 20850. Periodicals Postage Paid at Rockville, MD
20850-4024 and at additional mailing offices.
POSTMASTER: Send address changes to POWER, P.O. Box
3588, Northbrook, IL 60065-3588 . Email: [email protected].
Canadian Post 40612608. Return Undeliverable Canadian
Addresses to: IMEX Global Solutions, P.O. BOX 25542, Lon-
don, ON N6C 6B2.
Subscriptions: Available at no charge only for qualified exec-
utives and engineering and supervisory personnel in electric
utilities, independent generating companies, consulting en-
gineering firms, process industries, and other manufacturing
industries. All others in the U.S. and U.S. possessions: $107
for one year, $171 for two years. In Canada: US$112 for one
year, US$188 for two years. Outside the U.S. and Canada:US$227 for one year, US$368 for two years. Payment in full
or credit card information is required to process your order.
Subscription request must include subscriber name, title,
and company name. For new or renewal orders, call 847-501-
7541. Single copy price: $25. The publisher reserves the right
to accept or reject any order. Allow four to twelve weeks for
shipment of the first issue on subscriptions. Missing issues
must be claimed within three months for the U.S. or within
six months outside U.S.
For customer service and address changes, call 847-501-
7541 or fax 847-291-4816 or e-mail [email protected] or
write to POWER, P.O. Box 3588, Northbrook, IL 60065-3588.
Please include account number, which appears above name
on magazine mailing label or send entire label.
Photocopy Permission: For licensing and reprints of
POWER magazine content, please contact Wright’s Media at
877-652-5295 or [email protected].
Executive Offices of TradeFair Group Publications: 11000
Richmond Avenue, Suite 690, Houston, TX 77042. Copyright
2014 by TradeFair Group Publications. All rights reserved.
EDITORIAL & PRODUCTION Editor: Dr. Gail Reitenbach
Consulting Editor: Dr. Robert Peltier, PE Associate Editor: Thomas Overton, JD
Associate Editor: Sonal Patel
Associate Editor: Aaron Larson
Contributing Editors: Brandon Bell, PE; Charles Butcher; David Daniels, PE;
Steven F. Greenwald; Jeffrey P. Gray; Jim Hylko; Kennedy Maize;
Dick Storm, PE
Senior Graphic Designer: Michele White
Production Manager: Tony Campana, [email protected]
GENERATING COMPANY ADVISORY TEAM Melanie Green, Director, Strategic Planning & Analysis, CPS Energy
Randal S. Livingston, VP of Power Generation, Pacific Gas & Electric
Sharon Pfeuffer, Director and Chief Engineer, Fossil Generation, DTE Electric
ADVERTISING SALES Associate Publisher: Matthew Grant
Southern & Eastern U.S./Eastern Canada/
Latin America: Matthew Grant, 713-343-1882, [email protected] Central & Western U.S./Western Canada: Dan Gentile, 512-918-8075, [email protected]
Northeast U.S. Ed Mueller, 309-278-8120, [email protected]
UK/Benelux/Scandinavia/Germany/
Switzerland/Austria/Eastern Europe: Petra Trautes, +49 69 5860 4760, [email protected]
Italy/France/Spain/Portugal: Ferruccio Silvera, +39 (0) 2 284 6716, [email protected]
Japan: Katsuhiro Ishii, +81 3 5691 3335, [email protected]
India: Faredoon B. Kuka, 91 22 5570 3081/82, [email protected]
South Korea: Peter Kwon, +82 2 416 2876, +82 2 2202 9351, [email protected]
Classified Advertising
Diane Burleson, 512-337-7890, [email protected]
POWER Buyers’ Guide Sales
Diane Burleson, 512-337-7890, [email protected]
AUDIENCE DEVELOPMENT Audience Development Director: Sarah Garwood
Fulfillment Manager: George Severine
CUSTOMER SERVICE For subscriber service: [email protected], 847-763-9509
Electronic and Paper Reprints: Wright’s Media, [email protected], 877-652-5295
List Sales: Statlistics, Jen Felling, [email protected], 203-778-8700
All Other Customer Service: 713-343-1887
BUSINESS OFFICE TradeFair Group Publications, 11000 Richmond Avenue, Suite 690, Houston, TX 77042
Vice President and Publisher: Michael Grossman, 713-343-1887, [email protected]
Vice President, Energy and Engineering Events: Daniel McKinnon
Energy Events Content Director: David Wagman
ACCESS INTELLIGENCE, LLC 4 Choke Cherry Road, 2nd Floor, Rockville, MD 20850
301-354-2000 • www.accessintel.com
Chief Executive Officer: Donald A. Pazour
Exec. Vice President & Chief Financial Officer: Ed Pinedo
Exec. Vice President, Human Resources & Administration: Macy L. Fecto Divisional President, Business Information Group: Heather Farley
Senior Vice President, Corporate Audience Development: Sylvia Sierra
Senior Vice President & Chief Information Officer: Robert Paciorek
Vice President, Production, Digital Media & Design: Michael Kraus
Vice President, Financial Planning & Internal Audit: Steve Barber
Vice President/Corporate Controller: Gerald Stasko

7/22/2019 Power March 2014
http://slidepdf.com/reader/full/power-march-2014 9/82
Putting Nature to Work
A utility client was looking for ways to reduce selenium
and mercury from the industrial waste stream of a coal-fired
power plant. Their focus was on finding tools to preserve
environmental quality. Chris Snider led the team of client,
academic and Burns & McDonnell professionals in finding
the solution: constructed wetlands. At the end of an intensive,
2-acre pilot project — a $3 million investment — the client
has a blueprint to move on to a larger-scale wetlands that
will be a cost-effective, engineered filter for reducing
elements to below regulatory compliance levels.
WHERE WATER and POWER MEETCUSTOMIZED WATER SOLUTIONS THAT F IT YOUR POWER PLANT
Chris is a recognized technical leader in landfill design and coalbyproduct handling. He has 18 years of experience with solid waste
disposal and landfill-related subsurface investigations. He is one
of our experienced power plant professionals who can help you identify the
water alternative that fits:
Zero liquid discharge
Customized wastewater treatment and water management
Constructed wetlands
Landfill and pond management
Bottom ash handling
9400 Ward Parkway
Kansas City, MO 64114
www.burnsmcd.com/water-team
E n g i n e e r i n g , A r c h i t e c t u r e , C o n s t r u c t i o n , E n v i r o n m e n t a l a n d C o n s u l t i n g S o l u t i o n s
CIRCLE 4 ON READER SERVICE CARD

7/22/2019 Power March 2014
http://slidepdf.com/reader/full/power-march-2014 10/82 www.powermag.com POWER | March 20148
SPEAKING OF POWER
That question isn’t as flippant as itmay sound. If you look at the typeof plant that’s familiar to the gen-
eration of power industry personnel whohave retirement within view and compareit with the sort of facilities the incominggeneration of workers will be operating,you might be surprised.
It’s not just a matter of more digitizedand remotely monitored power plant sys-tems. The new definition of a fossil plant
is likely to include everything from plantswhose main function is something otherthan power generation to those whosefuel source can switch from coal to gas tobiomass to hydrogen.
New Missions
Power plants produce power. That wouldseem self-evident, but it’s no longeruniversally true. As our cover story onthe AES Huntington Beach plant demon-strates, a formerly conventional gas-firedplant can step into an entirely new role
(with relatively little prep time)—oper-ating synchronous condensers to supportless-predictable clean energy sources onthe grid.
Polygeneration—the production of sale-able byproducts in addition to electricity—is another scenario for a vastly differentsort of fossil-fired plant, as explained in “IsPolygeneration the Future for Clean Coal?”Even without polygeneration, generatorsare exploring their options for revenue-generating byproducts (see “ConvertingSulfur from Flue Gas into Fertilizer”).
A major advantage of gas-fired gen-eration is its greater operating flexibility,compared with coal units. But it’s notjust gas plants that are being called onto operate more flexibly these days. (Thiswon’t be news to those of you who havealready been forced to cycle coal plants inresponse to low capacity margins and highwind integration.) Our Global Monitorstory “The Advent of Flexible Coal” looksat how, with minimal equipment modifi-cations but more significant changes inoperational practices, formerly baseload
generating plants can add value in anenergy system that is more dynamic frompoints of generation to points of electric-
ity use. In fact, in Germany, where newcoal-fired plants are being built alongwith renewable generation, baseload de-signs are out; flexibility is in.
Yes, there is a cost to this new way ofoperating, but there’s one sort of cost oranother to every energy mix. For reliabil-ity, fuel-hedging, and other reasons, flex-ible operation may be just the ticket forlife-extension of U.S. coal plants “on thebubble” for retirement.
Then there are plants that can fuel-switch or cofire multiple fuels, as you’veseen in previous issues of POWER . Whywould anyone (at least in the U.S.) con-sider modifications to enable fuel switch-
ing when there’s an abundance of shalegas? Anyone who has watched natural gasprices this winter can answer that.
The Costs of Overreliance on Gas
Remember the fevered excitement over U.S.shale gas reserves and the widespread pre-dictions of low natural gas prices as far asthe eye can see? Well, the markets didn’tget that memo. Natural gas futures priceshit a four-year high in January. Then, onFeb. 6 in the cash market, Henry Hub gasfor next-day delivery traded as high as $9/
MMBtu—higher than any time since Au-gust 2008—and closed at $7.18. Multiplerounds with the Polar Vortex can be blamed,but this isn’t the first cold winter in U.S.history, and it won’t be the last. Compa-nies building new capacity with an eye onlong planning horizons and long asset lifespans, as well as politicians and regulatorsinfluencing the mix of new capacity, shouldbe able to understand that simple fact.
Though analysts worried that a surgeof production would exhaust natural gasstorage capacity in 2013, the U.S. Energy
Information Administration (EIA) reportedthat weather-related record high withdraw-als from storage early in 2014 have led to
record low storage levels. As a result, theEIA said, “working gas levels in the Lower48 states fell below the minimum storagelevel for the same week in the previous5-years for the first time since EIA startedreporting the statistic in 2004.”
The East has felt the cold and the supplypinch the worst. When PJM asked custom-ers in southwestern Pennsylvania to con-serve electricity during the mid-Januarydeep freeze because it was worried about
being able to meet demand, Pittsburghmedia reported that some citizens andlawmakers were wondering if PJM, whichhad promised reliability would not be jeopardized by shuttering two coal-fired
power plants last fall, acted too hastily inthat decision. I’m not about to adjudicatethat decision, but we may be reaching thepoint where public utility commissionsand federal regulators need to switch uptheir games to ensure that fossil plantsare not unduly penalized in the market orby compliance requirements for providingflexible service.
Does Coal Have a Future?
Yes, coal-fired generation has a future,but it won’t look like its past. It will
be different worldwide for a host of rea-sons, from the need to manage waterresources more efficiently, to compli-ance with emissions requirements, to anew generation of workers who expect atechnology assist in virtually every dailyactivity—from tooth brushing to bank-ing to boiler operation.
Adapting to new modes of operationwon’t always be easy, but there are oppor-tunities for new businesses and for smart,flexible companies to reshape the futureof fossil generation. ■
— Gail Reitenbach, PhD is editor ofPOWER. Follow her @GailReit and the
editorial team @POWERmagazine.
What Is a Fossil Power
Plant?
Power plants produce power. That would seem self-evident, but it’s no longeruniversally true.

7/22/2019 Power March 2014
http://slidepdf.com/reader/full/power-march-2014 11/82
Handling a World of Materials
Posimetric® is a licensed trademark of GE Energy (USA) LLC. The brands comprising TerraSource Global (Gundlach Crushers, Jeffrey Rader andPennsylvania Crusher) are wholly-owned subsidiaries of Hillenbrand, Inc. (NYSE: HI)
© 2014 TerraSource Global. All Rights Reserved.
Precise Product Sized for Maximum Yield The Leader in Uptime Since 1905
Impactors
Granulators
Roll Mills
Cage Mills Breakers
Grinders Coalpactors
Hammermills
EliminateFugitive
Dust!
a brand of a brand of
Posimetric ®
Feeders Improve plant safety with these
dust-free feeders. For coal, limestone, biomass, crushed stone, sand, wood chips and more.
Gundlach CrushersPhone: +1 (618) 233-7208
E-mail: [email protected]
Pennsylvania CrusherPhone: +1 (610) 544-7200
E-mail: [email protected]
Models To Suit Any Capacity
Uses Ultra-Low Horsepower
Unmatched Reliability
Only One Moving Part
APRIL 1-3, MORIAL CONVENTION CENTER, NEW ORLEANS
VISIT US IN
BOOTH
725
www.terrasource.com
CIRCLE 5 ON READER SERVICE CARD

7/22/2019 Power March 2014
http://slidepdf.com/reader/full/power-march-2014 12/82 www.powermag.com POWER |March 201410
Forced Closure of NuclearPlant Is Unlawful, GermanSupreme Court RulesIn a ruling that could have reverberatingimplications for nuclear generators, Ger-many’s highest administrative law courtupheld a lower court’s finding that de-clared unlawful the State of Hesse’s de-cision to shut down RWE’s Biblis A andB nuclear plants during the three-monthnuclear moratorium in 2011.
The Federal Administrative Court inLeipzig—one of Germany’s five supremecourts—this January dismissed the Stateof Hesse’s appeals against two rulings bythe Higher Administrative Court of Hesse.That court found that the state ministry
had no legal grounds when it ordered, ondecree from Angela Merkel’s administra-tion, the shutdown of two Biblis reactorson March 18, 2011—just days after theFukushima disaster in Japan.
At that time, operations were also halt-ed at five other reactors across the countrythat were built before 1980—Neckarwes-theim 1, Brunsbüttel, Isar 1, Unterweser,and Philippsburg 1—as well as Vatten-fall and E.ON’s jointly owned 1994-com-missioned Krümmel nuclear power plant,which was offline at the time.
But the Fukushima nuclear disaster alsoprompted the central government to rethinkits December 2010 decision to extend thelifespans of all German nuclear power plants
by an average of 12 years. Later, an amend-ment to the Nuclear Power Act in August2011 mandated that eight of the country’s17 reactors remain shuttered permanentlyand that the remaining nine reactors be de-commissioned by the end of 2022.
In the lower court decision in February2013, the Higher Administrative Court ofHesse ruled that RWE had not been prop-erly heard before the shutdown orderswere issued. But it also said the order wasunlawful because the Environment Minis-try had exceeded its discretionary author-ity. In January, the Federal AdministrativeCourt dismissed the State of Hesse’s appealbecause it had not convinced the court onwhy RWE had not been heard before the
shutdown orders were issued.The decision opens an avenue for nu-clear generators to seek damages beforea civil court against the states of Hesse,Lower Saxony, Bavaria, and Baden-Wuert-temberg, which forced the eight plants toshut down during the moratorium.
Only RWE, the one utility to have le-gally challenged the forced closure of theBiblis units (Figure 1), is preparing totake action against the State of Hesse.RWE estimates that decommissioning theBiblis reactors could cost more than €1.5
billion, though industry analysts estimateRWE may file for an estimated €187 mil-lion in damages as a consequence of theshutdown. The Biblis reactors, each 1.2
GW, had been licensed in December 2010to operate until 2019 and 2021.
Germany’s Federal Constitutional Court,meanwhile, is reviewing constitutional com-plaints by E.ON, RWE, and Vattenfall con-cerning Germany’s plan to exit nuclear powerentirely by 2022. That decision, which couldcome this year, could have larger repercus-sions for the Energiewende, or energy tran-sition, which requires the power-intensivenation to massively increase its reliance onrenewable generation.
The Advent of FlexibleCoalThe increasing penetration of intermit-
tent renewable generation, smart grids,demand response, and other emergingtechnologies has underscored the need forpower plants with greater flexibility andefficiency—and one surprising solutioncould come from new and existing coalplants, suggests a new study from the U.S.National Renewable Energy Laboratory andIntertek for 21st Century Power Partner-ship.
Coal plants, says the report, “FlexibleCoal: Evolution from Baseload to Peak-ing Plant,” though widely perceived to
provide only baseload generation, can bemodified to cycle on and off and run atlower output (below 40% of capacity). Thedocument details a demonstration to in-crease flexibility at a North American coalgenerating station—which is unnamedfor “commercial reasons”—a feat thatrequires “limited hardware modificationsbut extensive modifications to operationalpractice,” it claims.
“Cycling does damage the plant and im-pact its life expectancy compared to base-load operations. Nevertheless, strategic
modifications, proactive inspections, andtraining programs, among other operationalchanges to accommodate cycling, can min-imize the extent of damage and optimizethe cost of maintenance,” it says.
According to the report, the plant wasoriginally intended to run as a baseloadunit at an 80% annual capacity factorwhen it came online in the 1970s, but ithas “at times cycled on and off as manyas four times a day to meet morning andafternoon peak demand.” The authorsadd that “The overarching impact of this
type of cycling is thermal fatigue but alsostresses on components and turbine shellsresulting from changing pressures, wear
1. Unlawfully shut down. The forced closure of two reactors at RWE’s Biblis Nuclear
Power Plant in the State of Hesse during the 2011 nuclear moratorium was unlawful, a German
supreme court ruled in January. This image shows Biblis A on the right and Biblis B on the left in
2010. That year, Biblis A and B, which began commercial operation in 1974 and 1976 respectively,
were licensed to operate until 2019 and 2021. Courtesy: Peter Stehlik

7/22/2019 Power March 2014
http://slidepdf.com/reader/full/power-march-2014 13/82
BUILDING RELATIONSHIPS AND PROVING VALUE
Relationships are the building blocks that lead to success in business. Fluor and Southern Company,
a premier energy company serving 4.4 million in the Southeast, have built a relationship that spansmore than 3 decades, crosses geographies, and links experts to the needs of our clients. Reinforced
by properly aligned capabilities, significant experience and proven client-focused service, Fluor’s
value is further demonstrated through our people. Leaders like Henry Morgan, Fluor director of
operations, make it their priority to return employees home safely, serve as an effective project
interface, and oversee our clients’ most valuable assets. www.fluor.com
Fluor is a sponsor at Electric Power in New Orleans, Louisiana, during the week of April 1 to 3, 2014.
We would like the opportunity to meet with you to discuss your power generation needs.
Email us at [email protected].
© 2
0 1 4 F l u o r C o
r p o r a t i o n .
A l l R i g h t s R e s e r v e d .
A D G V 1 0 1 2 1 4 .
Fluor’s Power Business –
Fossil Generation, Renewables,
Alternate Technologies,
Nuclear, Transmission, andOperations & Maintenance.
CIRCLE 6 ON READER SERVICE CARD

7/22/2019 Power March 2014
http://slidepdf.com/reader/full/power-march-2014 14/82 www.powermag.com POWER |March 201412
and tear on auxiliary equipment used dur-ing cycling, and corrosion caused by oxy-gen entering the system and condensationfrom cooling steam.” Those consequencesof cycling can take several years to showup as damage or forced outages.
Several physical modifications weremade to the boilers, pulverizers, turbines,rotors, and condensers at the plant, butonce the physical changes were in place,“90% of future savings in costs camefrom adjustments to operating proce-dures,” the report reveals. For example,establishing procedures and training tocontrol boiler ramp rates has been espe-cially effective, as have been high-energypiping inspections.
The report echoes several conclusionsreached by a number of prominent ana-lytical entities, and it likewise suggests
that if modified to be more flexible, oldercoal units can still serve a purpose in anincreasingly low-carbon energy system.
Most coal power plants are “capable ofsome dynamic operation and are designedto be able to cycle with moderate ramp ratesand potentially even handle two-shift oper-ation (where the plant is started up and shutdown daily),” observes the International En-ergy Agency’s Coal Industry Advisory Board(CIAB) in a 2013 report titled “21st CenturyCoal: Advanced Technology and Global En-ergy Solution.” However, the increased need
for flexibility “will impact costs, mainte-
nance, and reliability,” the CIAB also con-cludes.
“Most notably, higher cycling will in-crease wear and tear while the number ofoperating hours decreases, resulting in anincrease of specific maintenance costs/ MW-hr over time. Moreover, as coal powerplants add more complex environmentalcontrol systems such as [carbon captureand storage] in the future, their ability tooperate dynamically may be reduced,” theCIAB says.
Yet, as illustrated by some countrieswith a high share of intermittent renew-ables, if a portfolio of strategies involvingboth technical and operational improve-ments is implemented, the flexibilityof current and future coal plants can beachieved, the CIAB suggests.
One prominent example is Germany,
which is moving to produce 80% of itspower with renewables by 2050. A tenfoldincrease in wind and solar photovoltaic ca-pacity in Germany since 2000 has resultedin a second “feed in” load fluctuation inaddition to the traditional consumer de-mand fluctuation.
Meanwhile, in a much-cited paradox forthe country that is promoting a massiveshift to renewables with billions of eu-ros in subsidies, Germany’s production ofcoal-fired power rose in 2013 to its high-est level since 1990 as natural gas prices
soared. Last November, Steag opened its
725-MW Walsum-10 unit near the west-ern city of Dortmund, and Trianel startedcommercial operation of a 750-MW Lünenplant (Figure 2) in North Rhine-Westphaliain December. Meanwhile, eight hard coalpower plants are scheduled to begin op-eration in the next two years, includingVattenfall’s 1.5-GW Moorburg plant nearHamburg and RWE’s Hamm facility in theDortmund area.
According to the CIAB, Germany’s ex-isting power plants are optimized “tocater to flexible operation,” even if theywere built before expansion targets forwind and photovoltaic plants had beenadopted. “In many plants, measures toallow greater flexibility have been im-plemented subsequently, so that powerplants can meet increased requirementsfor market load adjustments. As a result,
there are very few baseload plants thatdo not allow for flexible operation, itnotes. At the same time, new coal-firedpower plants are specifically designedfor flexible operation. “Pure baseloadpower plants are no longer being built.”
The CIAB notes, however, that Germa-ny also suffers higher electricity pricesthan most developed countries. Thatmeans the impact of increased costs dueto the fluctuating operation of conven-tional power plants is “somewhat lesssignificant,” it says.
MHI, Southern Co.Complete Demonstration Phase of CCS TestMitsubishi Heavy Industries Ltd. (MHI) andSouthern Co. have completed the initialdemonstration phase of a carbon captureand storage (CCS) test at the Plant Barrypower station in Mobile, Ala.
The companies built a 25-MW carboncapture demonstration plant, consistingof a flue gas scrubber, flue gas carbon di-
oxide (CO2) capture/regeneration system,CO2 compression machinery, and electricalcomponents, adjacent to the seven-unitJames M. Barry Plant owned by South-ern subsidiary Alabama Power (Figure 3).Notably, the facility employs the KM CDRProcess, which uses a proprietary KS-1high-performance solvent for CO2 absorp-tion and desorption that was jointly devel-oped by MHI and Japanese utility KansaiElectric Power Co. and is said to use lessenergy than comparable systems.
Testing of the facility’s carbon capture
capabilities, which the developers say is a“globally unprecedented” 500 metric tonsper day (mtpd), began in June 2011. Inte-
2. Hard but flexible coal. The 750-MW Lünen hard coal–fired power plant owned by Tri-
anel Kohlkraftwerk Lünen came online in December 2013 in northwest Germany and is predicted
to run 7,000 full-load operating hours in 2014. Siemens Energy and IHI Corp., which built the turn-
key plant, say it has an efficiency of almost 46%. The plant’s Siemens SST5-6000 steam turbine
is designed to enable highly responsive ramping, which is crucial to meeting load adjustments
posed by intermittent renewable generation. Courtesy: Siemens Energy

7/22/2019 Power March 2014
http://slidepdf.com/reader/full/power-march-2014 15/82CIRCLE 7 ON READER SERVICE CARD

7/22/2019 Power March 2014
http://slidepdf.com/reader/full/power-march-2014 16/82 www.powermag.com POWER |March 201414
The combination of substantial growth in total world coal trade, strong pricing for both coking and steam coals abroad, andthe declining demand for coal in the U.S. power sector has sparked a surge in activity and investment to facilitate thegrowth of U.S. coal exports. Source: U.S. Energy Information Administration —Copy and artwork by Sonal Patel, a POWERassociate editor
SHIFTING MARKETS
1-20 21-40 41-60 61-80 81-100 101-120 121-140 141-160 161-180
World Steam Coal Import Demand(million metric tons of coal equivalent) No data >180
1,146 1,171
2007 2008 2009 2010 2011 2012
1,045
-21%
1,040 933 975 932 824
1,074 1,084 1,095 1,016
( i n m i l l i o n s h o r t t o n s )
-11%
832
1,046
889
1,119
940
1,177
2015 2025 2040
13%13%
FALLING U.S. POWER SECTOR COAL CONSUMPTION
In 2012, the U.S. shipped a record-breaking 114 million metric tons (MMT) of coal to international markets—not just to Canada, wherebetween 31% and 48% of U.S. coal had typically gone in the mid-2000s—making the U.S. the world's third-largest coal exporter. U.S.coal exports are fairly evenly divided between coking and steam coal. Note: * denotes steam coal exports.
U.S. coal production declined in 2012 to its lowest level in almost two decades. But U.S. coal consumption also sank in 2012 to its
lowest level since 1988 as consumption from the coal industry’s largest consuming sector—U.S. coal-fired power plants—fell. U.S. coalexports are slated to increase 58% from about 107 million short tons in 2011 to 169 million short tons in 2040, buoyed by the overallincrease in world coal trade. Production and consumption could increase by an average 0.6% per year through 2040 as electricitydemand swells, natural gas prices rise, and the share of exports grows.
Coal consumptionby U.S. electricpower sector
U.S. Coal production
Share of U.S. coalexports
8% 14%12%
5%
2012
ASIA AMERICAS EUROPE/MIDDLE
EAST/AFRICA
59%(20.3 MMT*)19%
(6.5 MMT*)
21%(7.4 MMT*)
2040
ASIA AMERICAS EUROPE/MIDDLE
EAST/AFRICA
62%(57 MMT*)36%
(33.4 MMT*)2%
(2.3 MMT*)
THE BIG PICTURE: Coal’s Export Future

7/22/2019 Power March 2014
http://slidepdf.com/reader/full/power-march-2014 17/82
PENNGUARD® Block Lining System
PROTECTING POWER
PLANT CHIMNEYS
Tel:412 204 0028
Hadek is the expert on power plantchimney and ductwork protection,and a global distributor of thePennguard® Block Lining System.
We deliver:
• Research and feasibility studies
• Detail engineering
• Installation supervision• Lifetime Performance
Monitoring System
• 10 year limited warranty
Tomorrow’s chimneydesign: lighter, cheaper,built to last
The New Chimney Design from Hadek is a revolution in power plant chimney construction.
It’s slim and lightweight, but built to last – even in seismicregions. It’s normally around five months faster and 20%less expensive to build than traditional chimneys.
The design is simple: a smooth reinforced concrete shell, withthe Pennguard® Block Lining System applied directly to itsinside surface. So there’s no need for a separate internal flue.
Why is the New Chimney Design the future?
It’s low maintenance, with minimal risk of component failure.It’s long-lasting – the Pennguard® lining has a projected servicelife of at least 20 years. It has outstanding seismic tolerance. Also it is designed specifically for a wide range of operating conditions including low temperature FGD operation.
Make the New Chimney Design part of your plans.Contact Hadek now: 412 204 0028, [email protected]
Pennguard® is a registered trademark of Henkel KGaA and is used with their permissionThis advertisement is not to be considered a warranty concerning product performance
Concrete shell
Ambient temperature
15ºc (59ºF )
4ºc (111ºF )
23ºc(73ºF )
Pennguard® Block LiningSystem protects against acidcondensate, high temperaturesand thermal shock
Flue gas stream
44ºc
23ºc(
130ºc (266ºF )
50ºc (122ºF )
CIRCLE 8 ON READER SERVICE CARD

7/22/2019 Power March 2014
http://slidepdf.com/reader/full/power-march-2014 18/82
Categories for 2014:
»
Plant of the Year » Marmaduke Award
» Smart Grid Award
» Top Plants: Gas, Coal, Nuclear, Renewables
Get more information, past winners, and entry forms
at www.powermag.com/power-awards
DEADLINE: APRIL 30, 2014
PROUD
OF YOURPROJECT?
Show Your Pride byNominating It for a POWER Award

7/22/2019 Power March 2014
http://slidepdf.com/reader/full/power-march-2014 19/82March 2014 |POWER www.powermag.com 17
grated capture and sequestration demonstration testing began inAugust 2012. The test confirmed “[h]igh-performance continu-ous and stable operation of the large-scale CO2 recovery plant,”MHI said in a statement to POWER .
Southern Co. and MHI are now discussing additional demon-stration phase activities using the plant. MHI also said it would“accelerate its program” that seeks to achieve commercially viabletechnology for recovering CO
2
from the flue gas of coal-fired plants.Richard Esposito of Southern Co.’s Advanced Energy Systems
Research & Technology Management arm told the Wyoming Infra-structure Authority in January that the plant’s demonstration in-volves a 12-mile CO2 pipeline built by Denbury Resources as wellas CO2 injection into a deep saline formation above the CitronelleOil Field. So far, about 200,000 tons of CO2 has been captured(a recovery efficiency of above 90% at a purity of 99.97%) and100,000 tons has been injected.
Southern Co. is meanwhile building a CCS-ready 582-MW in-tegrated gasification combined cycle (IGCC) plant in KemperCounty, Miss., that is expected to capture 65% of its CO2 emis-sions, most of which will be transported by a completed 60-mile
pipeline and used for enhanced oil recovery. That plant is slatedto go into operation later this year.January also marked milestones for a number of federally
backed CCS ventures. The Department of Energy (DOE) formallycommitted $1 billion to its long-stalled FutureGen 2.0 projectproposed for Meredosia, Ill. That project, whose total estimatedcost is $1.68 billion, seeks to upgrade a unit of Ameren Energy’sMeredosia Energy Center. The repowered 168-MWe unit will in-clude oxycombustion and carbon capture technologies designedto capture at least 90% of its CO2 emissions during “steady state”operation.
The performance of CCS technology is also being tracked at the400-MW Texas Clean Energy Project (TCEP) IGCC and 405-MW Hy-
drogen Energy California (HECA) IGCC facilities—but the futureof both those projects is uncertain. TCEP and HECA are two ofonly three active DOE Round 3 Clean Coal Power initiative projects(the third is NRG Energy’s post-combustion demonstration at theW.A. Parish plant in Texas). San Antonio, Texas–based CPS Energy
allowed a key power purchase agreement with Summit’s TCEP toexpire at the end of 2013, citing delays and a changing energylandscape. California regulators are reviewing the HECA project.(For more on the TCEP and HECA projects, see “Is Polygenerationthe Future for Clean Coal?” in this issue.)
Statkraft Shelves Osmotic Power ProjectNorwegian power company Statkraft has shelved its much-watched effort to harness energy from pressure-retarded osmosis(PRO). It said in a rare industry admission that the technologycould not be sufficiently developed within the current marketoutlook to become competitive “within the foreseeable future.”
The company has been working on osmotic power for morethan a decade. After years of collaborative research and devel-opment with the Norwegian University of Science and Technol-ogy, Statkraft in 2009 started up one of the world’s first osmoticpower plants at Tofte on the Oslo Fjord in Norway, a facility thatproduced 2 kW to 4 kW (Figure 4).
The prototype operated on the PRO process, which involves
pumping seawater at 60% to 85% of the osmotic pressure againstone side of semipermeable membranes whose other side is ex-posed to freshwater. When freshwater, compelled by osmosis,flows across the membranes, it dilutes the saltwater and increasesits volume—and consequently, the pressure within the saltwaterchamber. A turbine is spun as the pressure is compensated, driv-ing a connected generator. PRO can be thought of as the reverseosmosis process (used for desalination and water treatment) run-ning backward and producing power from the flow of saltwater.
3. A test plant. Mitsubishi Heavy Industries and Southern Co.
have completed the initial demonstration phase of a carbon capture
and storage test at Plant Barry in Mobile, Ala. Courtesy: Southern Co.
Turn Pipe Dreams
Into Hard Facts.
KALOCER®—
alumina for extreme abrasion.
Highly resistant to sliding
abrasion, ABRESIST®
improves material flow,
and eliminates periodic
pipe rotation.
KALCOR®—
zirconium
corundum for
applications
up to 1830°F.
ABRESIST® wear resistant basaltlinings help reduce costlymaintenance repairs andproduction downtime.Documented cases show Abresist linings perform atoptimum levels more than25-30 years after installation. Abresist Kalenborn offers 75years of experience and:
� other protective linings include alumina and
zirconium corundum
� linings customdesigned for any
industrial application
� field survey service
� installation assistance
5541 North State Road 13, Urbana, IN 46990
Toll Free: 800-348-0717 • Fax: 888-348-0717
www.abresist.com • E-mail: [email protected]
kalen born
The Wear Protection People
Abresist Kalenborn Corporation
CIRCLE 9 ON READER SERVICE CARD

7/22/2019 Power March 2014
http://slidepdf.com/reader/full/power-march-2014 20/82

7/22/2019 Power March 2014
http://slidepdf.com/reader/full/power-march-2014 21/82March 2014 |POWER www.powermag.com 19
According to Elders, the feat of being able to drill down intothe magma despite difficulties—and to control it—is impressive.Perhaps more importantly, the well, which created a world recordfor geothermal heat, produced steam (Figure 6) that could be feddirectly into National Power’s 60-MW Krafla geothermal powerplant near the Krafla Volcano. The team was also able to copewith a “difficult chemical composition of steam” from the wellwith “simple countermeasures.”
The IDDP-1 experiment demonstrated that a high-enthalpygeothermal system can be successfully created this way, he said.“This unique engineered geothermal system is the world’s first tosupply heat directly from a molten magma.”
Around the world, several large-scale field projects that useenhanced geothermal systems (EGS)—an engineered heat ex-changer designed to extract geothermal energy by fracturing hotrock at depths of 4 kilometers or more—have reached varyingdegrees of success. Only one project—the 2007-commissioned3.2-MW Landau project in Germany—has sustained commercialproduction rates. EGS has been stalled by a variety of issues,foremost among them an exponentially higher power cost than
for fossil-fueled generation, owing to expenses associated withdrilling of deep geothermal wells, experts say.The Krafla experiment was not without setbacks that “tried
personnel and equipment throughout,” Elders said. Much remainsto be done. The next steps entail repairing the IDDP-1 well—which is currently “unstable”—or drilling a new similar hole. TheIDDP could drill the next borehole, IDDP-2, in southwest Icelandat Reykjanes between 2014 and 2015.
POWER DigestSouth Korea OKs $7B Plan for New Shin Kori Reactors. Onlytwo weeks after South Korea announced plans to cut the share of
nuclear in its total future power supply to 29% by 2035 insteadof 41% by 2030, the government approved a $7 billion project tocomplete two 1,400-MW reactors by late 2020 at Shin Kori in thesoutheast portion of the country. Construction of the two APR-1400 units at Shin Kori 5 and 6 could begin this September andearly next year, respectively. A documentation scandal has prompt-ed a series of nuclear reactor shutdowns since late 2012, leavinga country that imports 97% of its energy needs critically power-short.
Though it drastically cut targets for new nuclear power, thecountry still intends to build at least 16 new domestic reac-tors, and it is promoting sales overseas. The consortium to buildthe new nuclear units will be led by state-owned South Korean
power company KEPCO and includes Doosan Heavy Industries& Construction Co., Samsung C&T Corp., Hyundai Engineering& Construction Co., and Westinghouse Electric Co., which isowned by Japan’s Toshiba Corp.
Senate Passes Bill to Extend 123 Agreement with SouthKorea. The U.S. Senate on Jan. 27 passed a bill extending acivilian nuclear cooperation agreement with South Korea bytwo years until Mar. 19, 2016. Talks to renew the so-called “123Agreement,” which was set to expire in March 2014, had falteredas Seoul pushed to get Washington’s consent to enrich uraniumand reprocess spent fuel. The agreement is pivotal for South Ko-rea’s plans to export 80 domestically designed nuclear reactors by2030. (For more, see “South Korea Ramps Up Nuclear Exports”:
http://bit.ly/1ev2rCo).U.S. companies can only obtain export licenses for nuclear
equipment or materials from countries with which the U.S. has
SOME THINKLONG-DISTANCETRANSPORT IS
INFRASTRUCTURE-INTENSIVE.WE THINKDIFFERENT.
Transporting materials from remote locations has tradition-
ally required significant infrastructure investments in road
or rail links, vehicles, personnel and fuel. BEUMER oers
an economical, e cient and environmental alternative –
long-distance overland conveying. This gives you a dedicated,
around-the-clock transport link at the fraction of the cost
of infrastructure development. The reduced noise and air
pollution minimises environmental impact and improves
personnel safety. Add to that a high degree of design flexi-
bility and customisation and you can see why overland
conveying makes a big dierence to operational e ciency
and environmental protection.
For more information, visit www.beumergroup.com
Visit us!
CeMAT 2014, Hanover, GermanyMay 19 – 23, 2014
Hall 27, stand H32
Visit us!
POWER-GEN EUROPE, Cologne, Germany
June 3 – 5, 2014
Hall 6, stand N44
CIRCLE 10 ON READER SERVICE CARD

7/22/2019 Power March 2014
http://slidepdf.com/reader/full/power-march-2014 22/82 www.powermag.com POWER |March 201420
concluded a bilateral agreement for civilnuclear trade. The U.S. has Section 123agreements in place with 21 countries,the European Union, and the InternationalAtomic Energy Agency, but seven of thoseagreements, including those with South
Korea, Taiwan, and China, are set to ex-pire by 2015.Alstom to Supply Two Ultrasuper-
critical Units for Polish Plant. Alstom on Jan. 31 signed contracts worth €1.25billion with a consortium comprisingPolimex, Rafako, and Mostostal Warsa-wa, for the supply of two 900-MW ultra-supercritical (USC) coal-fired units for apower plant owned by Polish utility Pol-ska Grupa Energetyczna in Opole, south-western Poland. Alstom’s scope includesthe provision of its proprietary USC tech-
nology, including the supply of USC boilerislands; the steam turbine generator is-lands, including the turbine hall equip-ment; the air quality control systems; aswell as some balance-of-plant systems. Al-stom previously retrofitted Units 2, 3, and4 at Opole. The new units are expected tobecome commercially operational between2018 and 2019.
Japan Approves TEPCO’s RevivalPlan. Japan’s government on Jan. 15 ap-proved a plan to revive and restructure theTokyo Electric Power Co. (TEPCO), owner
of the tsunami-devastated Fukushima Dai-ichi power plant. Under the plan, TEPCO willreceive another ¥4 trillion ($38.8 billion) in
state funding. It also allows for progressiveprivatization of the government’s 50.1%stake in the company starting in the mid-2020s. The Japanese government acquiredthe majority share in the company in 2012to help it avoid bankruptcy.
In January, TEPCO said it hopes to restartall seven reactors at its Kashiwazaki-Kariwaplant by 2017. None of Japan’s 48 reactorsare currently operating since Ohi 3 and 4were taken offline in September 2013 forscheduled maintenance and inspections.The operators of at least 16 reactors haveapplied to Japan’s Nuclear Regulation Au-thority for a safety assessment to verifycompliance with post-Fukushima safetystandards and move toward restart.
Decommissioning of the Fukushimafacility, meanwhile, is expected to cost
around $20 billion and take 40 years tocomplete. TEPCO plans to build a coal-fired power plant in the prefecture aswell as a number of research and devel-opment facilities.
MHI Gets First U.S. Order for J-Se-ries Gas Turbine. Marking its first U.S.order for a J-Series gas turbine,MitsubishiHeavy Industries (MHI) on Jan. 29 wasselected to supply an M501J gas turbinefor the Chouteau power station, whichis owned by Oklahoma state-owned util-ity Grand River Dam Authority (GRDA).
The 495-MW gas turbine combined cycleplant to be built at the facility in Chou-teau east of Tulsa is scheduled to become
operational in March 2017. Along withan M501J gas turbine, plant componentsthat MHI will supply to GRDA include anSRT-50 steam turbine and a generator.The gas turbine will be manufactured atSavannah Machinery Works in Savannah,Ga., which is MHI’s manufacturing basein the U.S.
Including the GRDA order, MHI hassecured orders for 28 J-Series gas tur-bine units. Developed in 2009 by MHI,nine J-Series gas turbines are in opera-tion worldwide.
DONG Energy Divests 25% Stakein London Array. Denmark’s DONG En-ergy on Jan. 31 inked a $1 billion dealto sell half of its 50% share in the 630-MW London Array 1 offshore wind farmin the UK to Canadian institutionalfund manager La Caisse de dépôt et
placement du Québec. La Caisse willnow hold a 25% stake along with DONGEnergy (25%), E.ON (30%), and Mas-dar (20%) in the 175-turbine project,currently the world’s largest offshorewind farm.
India Clears Key Power Projectsfor Timely Approvals. India’s Cabi-net Committee on Investment clearedthree hydropower projects in ArunachalPradesh and Sikkim whose developmenthad been stalled by environmental con-cerns. At the same meeting, the central
government body that was establishedonly a year ago to identify key infra-structure projects and prescribe timelimits for the issuance of approvalsand clearances by government minis-tries cleared Reliance Power ’s 4-GWJharkhand coal-fired Ultra Mega PowerProject. The hydropower projects areTawang (800 MW), Tato (700 MW), andTeesta (520 MW).
Vattenfall Contemplates BuildingNew Nuclear Units in Sweden. Swedishutility Vattenfall in mid-January began a
10-year consultation process for possiblenew nuclear reactors at its four-unit Rin-ghals nuclear station in Sweden. A deci-sion to build the new reactors based onthe consultation with government agen-cies, local residents, and other stakehold-ers is not expected until at least 2020.The company, which owns seven nuclearreactors that started commercial opera-tion between 1975 and 1985, submittedan application to the Swedish RadiationSafety Authority for permission to buildand operate one or two new nuclear reac-
tors in August 2012. ■
— Sonal Patel is a POWER associate edi- tor (@sonalcpatel, @POWERmagazine).
Regulatory Rundown
We cover power industry regulatory developments asthey happen and post them at powermag.com. Didyou miss any of these when they were sent out in our
weekly POWERnews?
Every Megawatt Counts—Nuclear Plant Uprate
ApprovedLegal Deadline Set for EPA’s Coal Ash Rule
EPA to Hand Over GHG Permitting Authority to
TexasWest Coast Floating Offshore Wind Project Gets
DOI Green Light to AdvanceOkla. Asks Supreme Court to Review EPA Regional
Haze SuitEPA Mulls Revising Nuclear Plant Radiation
StandardsObama Nominates Norman Bay to Head FERC

7/22/2019 Power March 2014
http://slidepdf.com/reader/full/power-march-2014 23/82
Pumped Up
Unmatched Quality
Superior Reliability
Global Sales and Support
American Made Since 1920
Whether you’re an OEM pump manufacturer, a pump
assembler or a maintenance and repair professional,
there’s a Baldor Reliance® motor designed and
manufactured for your specific motor-driven pump
system application.
With Baldor Reliance low and medium voltage
horsepower ratings to 15,000 in single or three phase
designs including explosion-proof, close-coupled, vertical P-base, submersible and immersible, no other
motor manufacturer offers more choices, quality or
pumped up reliability than Baldor.
baldor.com 479-646-4711
©2013 Baldor Electric Company
CIRCLE 11 ON READER SERVICE CARD

7/22/2019 Power March 2014
http://slidepdf.com/reader/full/power-march-2014 24/82 www.powermag.com POWER | March 201422
Customized Storage Solu-tion Improves Efficiency
Omaha Public Power District (OPPD) oper-ates four baseload plants in the state ofNebraska. In 1993, when the North OmahaStation added a new warehouse, OPPDsought help from Vidmar to create effec-tive storage solutions for small parts andlarge palletized items, as well as to pro-vide ideas for general organization withinthe workspace.
About three years ago, OPPD beganexploring and utilizing “lean” practic-es—a customer-centric methodologyused to continuously improve any pro-cess—looking for ways to reduce waste
and increase efficiency.One of the first locations to use theprocess was the Elkhorn Service Center.OPPD reviewed inventory handling andstorage procedures in its warehouse andinstituted a number of changes. Resultswere tremendously successful, savingabout $180,000 in the first year.
The outcome led to further reviews atother service centers and power gener-ating plants, including at North OmahaStation. Lean teams looked at a varietyof systems and examined many different
options. After extensive evaluation, thecompany opted to install the STAK systemmanufactured by Vidmar (Figure 1). A de-ciding factor was OPPD’s previous experi-ence with the supplier.
Working with Vidmar Territory SalesManager Chuck Eacock, OPPD upgradedthe shop and benefitted from a 70%space savings. The workbenches im-proved organization and the STAK sys-tem allowed for expansion as businessneeds grew. The cabinets were custom-built to fit the warehouse’s exact needsand specifications. Height, width, num-ber of drawers, and drawer layouts wereall custom-configured to maximize pro-ductivity.
“There are numerous operational ben-efits from the standpoint of having somany parts in a consolidated area,” saidChris L. Rush, who works in the North
Omaha Stores Material Management divi-sion. “We can now organize the cabinetsby application. Within each cabinet thereis the opportunity for such an array ofdifferent configurations of drawers thatwe have not run into an issue that wecan’t handle.”
The STAK adjustable racking system(Figure 2) improved workplace efficiencyby providing ample storage space and theversatility to store a host of items, fromthe smallest computer component to thelargest valve. Utilizing space saved by the
Vidmar STAK system and cabinets, OPPDwas also able to implement the use of pal-let racking.
“Now that we have proper storage,everything is consolidated into a small-
er footprint, so there is less walkingaround, with stored parts always withineasy reach and full view. This means animproved bottom line for Omaha PublicPower and fast, effortless retrieval for thecraft guys,” said Rush.
OPPD has hosted several tours forother facilities’ management personnelseeking insight on how customized stor-age products can improve work areas andmake employees more efficient. Overall,
the lean process—including use of theSTAK system—has helped the companyreduce waste, control costs, and makebetter use of inventory and materials. Itis all part of an overall push to be moreefficient and cost-productive throughoutthe company, which is now more impor-tant than ever.
“Every company wants to do morewith less and make better use of itsresources. We are no exception. Thechanges we have made have helped usdo that,” said Rush.
—Edited by Aaron Larson , a POWERassociate editor (@AaronL_Power, @
POWERmagazine).
1. A view of a storage area utilizing the STAK system. Courtesy: Vidmar
2. A view of the adjustable rack-ing system in use. Courtesy: Vidmar

7/22/2019 Power March 2014
http://slidepdf.com/reader/full/power-march-2014 25/82CIRCLE 12 ON READER SERVICE CARD

7/22/2019 Power March 2014
http://slidepdf.com/reader/full/power-march-2014 26/82 www.powermag.com POWER | March 201424
Practical Considerationsfor Converting IndustrialCoal Boilers to NaturalGasIncreasing Environmental ProtectionAgency (EPA) restrictions pertaining toemissions from coal-fired power plants,the increasing cost of coal operations, andthe decreasing cost of natural gas providestrong arguments for converting coal-firedboilers to natural gas–firing ones. Coal-fired boilers have emissions that are po-tentially noncompliant with the MaximumAchievable Control Technologies (MACT)rule and Mercury and Air Toxics Standards(MATS), which will require modificationsto most coal-firing systems.
Where should coal boiler owners startwhen evaluating the various conversionoptions for their facilities? A compre-
hensive understanding of various designalternatives and their implications is cru-cial to optimizing the initial capital cost,operating cost, safety, and reliability ofthe facility.
Conversion BenefitsThe primary benefits of converting a coalboiler to fire natural gas are a more cost-effective, cleaner, more efficient, and reli-able source of steam. As compared withinstalling a new boiler, converting anoperational coal-fired unit to natural gas
typically requires a lower capital invest-ment, enables the most condensed sched-ule, and makes use of the existing asset.
Although the solution is not new (see“Natural Gas Conversions of ExistingCoal-Fired Boilers” in the August 2011 is-sue of POWER, online at powermag.com)and has been covered recently in twoSpecial Report articles (see “PracticalConsiderations for Converting Boilers toBurn Gas” and “Utility Options for Lever-aging Natural Gas” in the October 2013issue of POWER), the topic continues to
be relevant due to evolving EPA regula-tions and public perceptions of climatechange initiatives.
For most industrial boiler owners, re-utilization of the existing asset is themost desirable course of action. Convert-ing an existing boiler is typically 15% to30% of the cost of installing a new naturalgas boiler. Additionally, converting coalboilers to firing natural gas provides thefollowing major benefits.
Cleaner Operation. Natural gas burnscleaner than coal, because it does not con-
tain significant amounts of sulfur, atomicnitrogen, particulate, or ash. Additionally,natural gas allows for more precombustion
controllability for lower emissions, such asNOX and CO, without the need for exten-sive flue gas treatment equipment.
Operating Cost Savings. For severalyears the cost of natural gas has been de-creasing while the cost of coal has beenincreasing. By using only natural gas in-stead of coal, facilities can eliminate op-erations, maintenance, and environmentalcosts associated with coal/ash storageand handling. With no ash carryover, nat-ural gas avoids ash buildup, which reduc-es heat transfer, meaning the boiler canmaintain its efficiency.
Increased Boiler Flexibility. Convert-ing to natural gas improves boiler flex-ibility and turndown capability. Coal-firedboilers do not react to sudden load swingsas effectively as a converted natural gasboiler. Further, coal-fired boilers have a
limited turndown capability, thus limit-ing their effectiveness during low steamdemand. Bringing a coal-fired boiler backonline after a shutdown requires muchmore time than is required by a naturalgas boiler.
Determining Emissions Limita-
tions Is the Key First StepSo you have a coal boiler that appearsto be a perfect candidate for conversion.Where do you start? CO and NOX emissionslimitations are of primary importance
when converting boilers to natural gas-firing. These emission limitations dictatethe requirements of the burner design,air/fuel mixing technology, and resultingflame temperature. Emission limitationsaffect combustion airflow requirements,refractory requirements, amount of fluegas recirculation, duct sizing, and dampercontrol, all of which have an effect on theforced draft (FD) fan and induced draft(ID) fan requirements.
Getting too far along in the designof the project and then finding that the
emissions limitations have changed couldmean starting from scratch with a newdesign. Working with a qualified envi-ronmental consulting firm is a great wayto make sure that the project is gettingstarted on the right track.
Vertical or Horizontal Firing?There are two typical arrangements formounting the most important part ofthe conversion—the burners: horizontal,wall-mounted burner design and vertical,upward-mounted burner design. For both
arrangements, the following consider-ations are important.
Heat Input Required. How many Btu
of natural gas must be burned to achievethe operational steam output at the re-quired pressure and temperature?
Boiler Furnace Geometry. Furnacedimensions significantly affect the burnerdesign and burner placement. If the boilerhas superheater tubes in the radiant area,the distance from the grate to the lowestpart of the superheater tubes is also criti-cal to the design.
Backend Modifications Needed. Does a baghouse or other flue gas equip-ment need to be bypassed or removed?Does a cyclone separator need to be“gutted” to reduce the flue gas pressuredrop, or is the ID fan so oversized thatadditional flow restrictions are needed toutilize the fan? A cost-benefit analysisof replacing the ID fan versus installingflow restrictions may be advised. Install-
ing a variable frequency drive (VFD) forthe ID fan may also make sense.Impact of the Conversion on the
Boiler. Depending on burner placement,a conversion from coal to gas changesthe energy release slightly. Natural gasflames produce lower radiational energy,thus radiant heat transfer in the lowerfurnace is less, while the convective heattransfer is increased through the back-pass/economizer.
On the steam side, the changes in com-bustion temperature, quantity, and com-
position affect the velocities and heatabsorption within the furnace, economiz-er, and superheater sections and thus hasan effect on steam flow and temperature.A boiler impact study may be needed toevaluate the gas and steam processesthat may be affected by the conversion.This analysis can provide an impact eval-uation of boiler emissions, heat transfer,boiler efficiency, steam production, andsteam temperature.
Natural Gas Flow and PressureAvailability. A new main gas line or a
pressure regulation station with a newtap into an existing main gas line maybe needed.
Electrical Distribution System Capac-ity. Does the current system have the nec-essary capacity available for the project?
Existing Boiler Condition. Is the boil-er clean and in good repair? Is retubing orsimilar work needed?
Code Requirements. Boiler code re-quirements differ in some areas for natu-ral gas versus coal-fired boilers. This mayrequire boiler safety relief valve (SRV)
replacement or recertification, boiler feed-water delivery pressure and flow capacitychanges in relation to boiler maximum

7/22/2019 Power March 2014
http://slidepdf.com/reader/full/power-march-2014 27/82 March 2014 |POWER www.powermag.com 25
pressure and SRV settings, as well as otherrelevant ASME code–dictated work.
Wall-Mount Burner Conversion
ConsiderationsIn a wall-mount arrangement, the burner orburners are mounted within either the frontwall, side wall, or rear wall (Figure 1). Eachpotential burner location must be evaluatedfor a number of concerns:
■ What is the distance to the opposingwall, thus what is the distance theflame can occupy without impingingon the opposite wall? This will help indetermining the number of burners andburner design required to deliver the re-quired heat input while avoiding flameimpingement.
■ Are water wall tubes currently in the
way of where the burners should bemounted? If so, new bent tube panelswould need to be installed to accom-modate the throats of the burners, thusrequiring engineering design of thepanels, shop fabrication, and field laborto cut out the existing straight tubesand weld in the new sections.
■ What is the front header clearance? Ifthe burners are to be mounted in thefront wall, then the front header heightbecomes an important element. Depend-ing upon the header height from thefloor, the burners and windboxes mayhave to be located between this headerand the operating floor. Low clearancemay also dictate multiple smaller burn-ers, extensive relocation costs for theheader, or modifications to the floor.
Most wall-mounted burner flames willinitially fire horizontally, then bend up-ward based upon furnace draft. Onceburner location and the quantity of burn-ers are established, an analysis of theflame geometry is required to ensure thatthe “angled” heat can transfer effectivelywithin the radiant zone without flame
impingement. When utilizing this type ofconversion it is common to have multipleburners that fire in unison to maintain aneven heat transfer.
Typically, a single FD fan is utilized toproduce combustion air regardless of thenumber of burners used. This fan producesthe required static pressure and volume
of air into a common windbox that hasinternal air distribution to regulate suf-ficient and constant air to the burners. Ina multiple burner arrangement, the com-bination of the combustion air, fuel train,controls, and the burners’ air/fuel mixingdesign provides for simultaneous firing.
A successful implementation of the hor-izontal-mounted burner arrangement is op-erating at a manufacturing facility in Flint,Mich. Under a design-build contract, LiptenCo. converted three 45,000 lb/hr field-erected coal-fired boilers to front wall–fired, low–NOX natural gas firing with newFD fans, VFDs, fuel trains, controls, exten-sive tube repairs, and tube modifications.
Because of the lack of a floor levelbelow the boilers, vertical firing was notfeasible. The project was designed so thatonly a single burner was needed per boiler,
reducing controls complexity as comparedwith a multiple burner boiler arrangement.Use of a single burner was possible be-cause of the liberal furnace dimensions.
Vertical Burner Mounting
ConsiderationsA vertical-firing arrangement places a burn-
www.victoryenergy.com | tel: 918.274.0023 | hot l ine: 877.783.2665
F O L L O W A L E A D E R
î Patented HRSG design solutions
for combustion turbine and
process exhaust streams
î Shop-assembled modular solutions
okpkok|g eqpuvtwevkqp1Ýgnf equv
î Industry’s highest steam production
ghÝekgpekgu hqt tgÝpgogpv cpf
processing applications
î Long-term reliability under the most
extreme demands
î Full line of economizers and
industrial-duty air pre-heaters
î Thermal oil heaters and other
secondary heat recovery
equipment
î Modularization minimizes time and
ncdqt equvu kp vjg Ýgnf
î Unparalleled in-house engineering
uvchh dtkpiu crrnkecvkqp urgekÝe
expertise to every project
COMPLETEMODULARIZATION
Specializing in advanced steam generation technologyand heat recovery applications.
INNOVATIVEBOILER DESIGN
C0GENERATIONEXPERTISE
PROVENEFFICIENCIES
CIRCLE 13 ON READER SERVICE CARD

7/22/2019 Power March 2014
http://slidepdf.com/reader/full/power-march-2014 28/82 www.powermag.com POWER | March 201426
er and windbox at the base of the boiler,typically in the area vacated by the grates
and plenum hoppers (Figure 2), thus allow-ing the flame to vertically fire upward intothe furnace area, making maximum use ofthe furnace’s height, width, and depth. Thismethod has been found to better emulatethe replaced coal-firing system’s heat dis-tribution by allowing heat to radiate fromthe bottom toward the top, making use of
the liberal furnace height and minimizingthe chance of flame impingement—similarto a burning bed of coal. Items to reviewfor a vertical-firing arrangement include:
■ A building level below the boiler
(such as a basement or lower level)is critical. Review and measure theheight from the lower level floorto the top of the grates. Sufficientheight will be required to ensure thewindbox and burner will fit below the
1. Newly installed, horizontallymounted burner. Courtesy: Lipten Co.
2. A before and after comparison of a boiler general arrangement draw-ing. The original design included a grate and hopper (left), but the conversion replaced them
with a vertical, upward-mounted burner and new forced draft fan (right). Courtesy: Lipten Co.
Natronx
Technologies, LLC
469 North Harrison St. | Princeton, NJ 08543 | 855.285.7652
Natronx TechnologiesThe experts in air quality control
For removal of HCl, SO2, SO3 and HF emissions,EnProve is the clear choice.
For more information, call us today at 855.285.7652
and visit us at our website at www.natronx.com.
The EnProve™ product line of sodium sorbents isspecifically developed for the optimal removal ofacid gases.
CIRCLE 14 ON READER SERVICE CARD

7/22/2019 Power March 2014
http://slidepdf.com/reader/full/power-march-2014 29/82 March 2014 |POWER www.powermag.com 27
boiler while allowing for maintenanceaccess (Figure 3).
■ Is sufficient combustion air available inthe building to support the conversion?A review of intake louvers and make-upair units may be necessary.
A vertical-firing burner arrangement(Figure 3) is almost always preferred, if
possible. That was the case when Liptenprovided the design-build conversionof two 210,000 lb/hr steam boilers atan automotive manufacturing facility inWentzville, Mo. The converted boilers werecommissioned in late 2013. The project in-
volved installation of a single 250-MMBtu/ hr vertical-mounted burner on each boiler.
A vertical burner design was chosen
instead of wall-mounted burners for thisapplication to provide optimum flamegeometry for the furnace configuration,improved water circulation patterns, im-proved thermal efficiency, better overallboiler performance, avoidance of flameimpingement, and simplified operation.
The existing ID fan curves were ana-lyzed, and it was determined that thesefans could be reused by replacing themotors and installing VFDs. The FD fanswere replaced and also fitted with VFDs.The project included new natural gassupply systems, electrical modifications,custom CombustionPac combustion con-trol systems utilizing programmable logiccontrollers, and additional boiler systemmodifications required to convert the coalboilers to fire natural gas.
To EPC or Not to EPC?
An engineering, procurement, and con-struction (EPC) company with expertise inthe boiler conversion process can be in-valuable in optimizing installation costs,efficiency, safety, and reliability. Makesure that the firm providing EPC servicesis not favoring a particular product or de-sign and is a truly unbiased boiler conver-sion specialist that will select the properequipment and optimum design for yourapplication. An experienced EPC firm canwork from either an end user–provided
scope of work—allowing for a design-build application—or work from more de-tailed specifications, if desired.
A boiler owner could enlist the assis-tance of an engineering firm that special-izes in boiler coal-to-gas conversions towork in unison with the owner to providesite-specific drawings, design direction,component requirements, and site workdetails. The engineering firm’s scope mayinclude a detailed set of plans and speci-fications or a more simplified conceptualdesign package to facilitate design-build
bidding. Detailed engineering packagesmay then be used to solicit bids for in-dividual project aspects, such as skilledtrade work and equipment, or conceptualdesign packages can be released to EPCfirms that may provide all-inclusive proj-ect implementation. ■
— John Ingraham is a proposal develop- ment manager, Jim Marshall is president,and Randy Flanagan, PE is a mechanical
engineer with Lipten Co. ([email protected]), a design-build firm specializing inindustrial central utility plant design and
construction with specialized expertise inconverting industrial coal-fired boilers to
natural gas firing.
3. Completed conversion. A side view of a newly installed forced draft fan with stairs
and access platform (foreground) to the new fuel train and vertical, upward-mounted burner
(background). Courtesy: Lipten Co.
4. Side view of a newly installed fuel train and vertical-mounted burn-er. Courtesy: Lipten Co.

7/22/2019 Power March 2014
http://slidepdf.com/reader/full/power-march-2014 30/82 www.powermag.com POWER | March 201428
When States Try toManipulate Wholesale
Power MarketsThomas W. Overton, JD
This has not been the best of times for state regulators tryingto control the future of their regional power markets.
In September, a federal court in Maryland shot down thatstate’s attempt to force the construction of a combined cycle pow-er plant outside of PJM’s capacity auctions. The Maryland PublicService Commission has spent several years trying to address whatit sees as potential capacity shortfalls, and in April 2012 it finally
ordered several regional utilities to execute power purchase agree-ments (PPAs) with a company that wanted to build such a plantbut was unable to clear PJM auctions. The utilities sued to blockthe order, and on Sept. 30, the court agreed that the state com-mission impermissibly invaded the Federal Energy Regulatory Com-mission’s (FERC’s) authority over wholesale power prices.
Just two weeks later, a federal court in New Jersey threwout that state’s attempt to circumvent PJM in a similar fash-ion. Acting under New Jersey’s Long-Term Capacity Pilot Proj-ect, enacted in 2011, the New Jersey Board of Public Utilitiesconducted its own selection process for new generation andordered the state’s utilities to sign PPAs with the winning com-panies. As in Maryland, the utilities sued, and the court there
also agreed that the state had no authority to interfere in thewholesale power market.In both cases, the decisions turned on a principle of constitu-
tional law known as preemption. Somewhat simplified, this ruleholds that where Congress intends to occupy a regulatory fieldwithin its jurisdiction, states have no authority to impose theirown regulations. Federal courts have long held that the FederalPower Act leaves no room for states to regulate interstate powersales, and that that authority rests solely with FERC. With FERChaving authorized PJM to manage the wholesale power market inNew Jersey and Maryland, those states cannot second-guess PJM’sjudgment when the market doesn’t function to their liking.
Cases in this area have historically turned on efforts to
boost capacity or reduce power prices. There are signs, how-ever, that future litigation may concern methods to supportrenewable generation.
Renewable energy mandates have passed muster underthis rule to the extent they merely require a percentage ofrenewable generation while leaving it to the market to de-termine the prices paid and the generators that supply thepower. Attempts to go beyond that, however, have often runinto trouble.
A Mighty WindThat brings us to the Cape Wind offshore wind project in Mas-sachusetts.
Cape Wind, potentially the nation’s first offshore wind farm,has been in development for more than 10 years and has spawnedfierce opposition from a variety of quarters, among them the
same conservative groups that have fought renewable energymandates elsewhere in the country. Still, it has managed to navi-gate a gauntlet of permit approvals and litigation, in no smallpart because of strong support from the Massachusetts govern-ment, particularly Governor Deval Patrick.
Cape Wind’s most formidable obstacle has been the cost of itspower. Even with subsidies, it has been unable to offer its elec-
tricity into the ISO New England market at competitive prices,even against other renewable generation. Nevertheless, it wasable to secure a no-bid PPA with National Grid in 2010 for 50%of its output. The PPA came about in large part because theMassachusetts Green Communities Act favored in-state renew-able generation at the time. As I wrote in the August 2013issue of POWER, that provision was rescinded in the face of alawsuit from TransCanada.
Without that advantage, Cape Wind was unable to convinceNSTAR, another area utility, to enter a PPA because NSTAR had re-ceived much lower-priced bids from land-based wind generators,some of them out of state. Thus things stood until NSTAR andNortheast Utilities sought approval from commonwealth regula-
tors for a merger.It’s difficult to characterize what happened next as anythingbut an attempt to strong-arm NSTAR into signing a PPA with CapeWind. The Massachusetts Department of Energy Resources movedto block the merger, and it only withdrew its opposition whenNSTAR and Northeast Utilities agreed, after a secret, yearlong ne-gotiation, to sign a PPA under the same well-above-market ratesas the National Grid deal.
How About Another Round?Cape Wind, as I noted above, has faced years of litigation, andits opponents have failed in every attempt to block the project,most recently on Jan. 23, when the Court of Appeals for the
District of Columbia Circuit upheld Federal Aviation Administra-tion approval. But on the same day that decision came down,opponents filed a new suit, arguing that the merger-PPA dealconstituted state inference in wholesale power prices, given thatit required the utilities to accept a specific price rather than onefreely negotiated on the market.
The fact pattern here is not quite the same as in the New Jer-sey and Maryland cases, where state regulators ordered PPAs tobe signed; here, Massachusetts apparently conditioned approvalof the merger on the PPA. Thus, it may argue that NSTAR had achoice to forgo both.
As of this writing, the Commonwealth of Massachusetts hasnot filed an answer to the suit, but this case is clearly one to
watch, both for the future of renewable mandates and wholesalepower markets. ■
— Thomas W. Overton, JD is a POWER associate editor.

7/22/2019 Power March 2014
http://slidepdf.com/reader/full/power-march-2014 31/82
Take a closer look at MAGNETROL-tough liquid level switches, the No. 1 brand
of mechanical buoyancy instrumentation. The fact is, MAGNETROL switches
work hard, and keep on working, for decades of safe, accurate, repeatable,
reliable level detection.
Entrust your operation’s safety and performance
to MAGNETROL – the first name in durable, reliable
mechanical buoyancy liquid level switches.
Design Excellence in the DetailsMakes Magnetrol® the Leaderfor Trouble-Free Performance.
Heavy-duty flangeconfiguration is designedto perform reliably in service pressuresup to 5000 psig (345 bar).
Full-penetration chamber welds meet ASME Section IX andB31 construction and inspection requirements.
The stainless steel enclosing tube completely isolates theswitch magnet from the process environment, preventinginterference with the magnet, while allowing reliablemagnetic coupling with the attraction sleeve.
Attraction sleeve
Stainless steelenclosing tube
(cutaway)
Magnet
CIRCLE 15 ON READER SERVICE CARD

7/22/2019 Power March 2014
http://slidepdf.com/reader/full/power-march-2014 32/82 www.powermag.com POWER |March 201430
GRID SUPPORT
AES Uses SynchronousCondensers for Grid Balancing
The future is looking bright for AES Hun-
tington Beach Power Generating Station.
Renderings of a proposed new look for
the power plant—located steps from the beach
on the Pacific Coast Highway—include mas-
sive surfboards and waves masking six new
120-foot structures slated to replace two 210-
foot stacks (Figure 1). The facelift is part of
a greater modernization initiative to create acleaner, more efficient natural gas power plant.
But the real innovation coloring the future of
the plant and its surrounding electrical grid is
happening below the surface.
A recent conversion from generators to
synchronous condensers has the plant not only
stabilizing the grid and keeping the lights on in
times of high demand, but also keeping the air
just a little bit cleaner in the process.
Keeping the Lights OnThe California Public Utilities Commis-
sion (CPUC) requires its utilities to plan fora 15% Planning Reserve Margin of excess
generation. In peak seasons like Southern
California’s sweltering summers, addi-
tional voltage support is often required to
maintain this balance and stabilize the grid.
Historically, Southern California has had
adequate reserve margins, but in 2012 when
the San Onofre Nuclear Generating Station
(SONGS)—the largest plant in Southern
California—was shut down, this level of
comfort quickly changed.The loss of SONGS during the summer of
2012 left Southern California with a 2,200-
MW hole in its grid. Without SONGS, gen-
eration from other nearby power plants was
insufficient to meet electricity demand, and
importing that much replacement power
into the area would put too much stress on
the region’s grid. To fill this gap, Huntington
Beach’s steam turbine Units 3 and 4 were tem-
porarily brought back from a nearly two-year
retirement. But these units could not stay on
indefinitely because of an emissions transac-
tion with Edison Mission Energy (EME) thathad been completed earlier. The terms of the
agreement required AES to retire the Unit 3
and 4 boilers and related equipment to enable
EME’s new combined cycle project to begin
commercial operations.
When it became clear in late 2012 that
an alternative means of voltage support was
necessary due to the potential retirement of
SONGS, the California Independent System
Operator (CAISO) approached the team at
AES and suggested the switch from genera-tors to synchronous condensers. Before this
point, AES Huntington Beach was primarily
run via generators, and the team had little ex-
perience with synchronous condensers, but
the solution was undoubtedly a viable one, so
the team got to work.
Many stakeholders were involved in the
project, including Southern California Edison,
the California Energy Commission (CEC), the
CPUC, San Diego Gas & Electric, and even
the rate-paying citizens of Orange County.
With such an invested audience of stakehold-
ers, AES began procuring a wide range ofsolution options that could meet the stringent
regulatory, budgetary, and deadline demands.
Faced with a critical shortfall in voltage support after the loss of the San Onofrenuclear plant, the California Independent System Operator called on AES to converttwo retired units at its Huntington Beach station to synchronous condensers. Theexperience offers lessons for other regions looking to deal with impending plant
retirements and changing grids.
Weikko Wirta and Chris Davidson
Courtesy: Siemens Energy and Chet Williams Photography

7/22/2019 Power March 2014
http://slidepdf.com/reader/full/power-march-2014 33/82
GRID SUPPORT
March 2014 |POWER www.powermag.com 31
Assessing the TechnologyThere are a number of different ways to pro-
vide voltage support to a transmission grid.
Though generation provides support, reactive
power is needed to move the power across
the grid to serve load.
Static var compensators (SVCs) are a popu-
lar method for reactive power compensation
to improve and balance a network. An SVC
is made up of capacitive and inductive com-
ponents that inject reactive power and deliver
dynamic performance during periods of high
demand. However, SVCs may have limited ab-
sorption levels and fault current performance.Synchronous condensers, like SVCs, are
another means of power compensation, but
unlike SVCs, synchronous condensers are
single-component rotating machines—also
known as flywheels—which positively or
negatively alter the field of the generator
to distribute or absorb reactive power. The
single component design allows for smooth
waveform and a quicker, more reliable start-
stop in a way that does not negatively affect
the system load. Synchronous condensers
also have a higher capacity to handle fault
currents, making them ideal in applicationssuch as this one.
Facing ChallengesUnfortunately, AES’s generators presented
three challenges for conversion to synchro-
nous condensers:
■ Multiple Original Equipment Manufac-
turers. The plant consists of two different
brands of generators, General Electric and
Westinghouse, in a cross-compound sys-
tem. Finding a conversion solution that
would work equally well for both genera-tors was necessary. This type of situation
would normally require all new equipment
to be installed for the conversion, whichwould have inflated both the timeline and
budget for the project.
■ Size. Though the generators at AES aren’t
abnormally sized compared to plants of
this capacity, they are still physically large.
A conversion solution for equipment this
size generally requires substantial electri-
cal modification to assist in controlling
the unit’s speed and a significant amount
of system analysis and adjustment.
■ Age. As an added complication, the tur-
bines at AES were nearly 50 years old, so
the issue of potential replacement or repairof the existing equipment was a concern.
Most modern generators are converted to
motors to turn themselves on and bring
themselves up to speed, serving dual elec-
trical purpose. The generators at AES were
not designed for that type of functionality.
With each of these challenges came added
stress in identifying a solution that could be com-
pleted on time and within the allotted budget.
The team at AES partnered with Siemens
Energy to review their options. With the tight
timeline being the most critical factor, a mo-ment of clarity brought a solution that took
repair or replacement of the AES turbines
out of the equation. After nearly a month of
comprehensive evaluation, the team was able
to retain most of AES’s existing infrastruc-
ture without requiring new equipment or sig-
nificant upgrades. The only new equipment
investments made were those pieces that
immediately supported the conversion: pony
motors, thrust bearings, variable frequency
drives (VFDs), and new distributed control
system (DCS) panels.
“Timing was a critical issue,” said PhilPettingill, director of regulatory strategy at
CAISO. “There was a constant stream of
questions from regulators and policymakers
regarding cost and schedule. Both AES and
Siemens were very effective at coming back to
us and telling us exactly what we needed and
how they could meet the evolving timeline.”
Maintaining a BalanceThe innovation behind the customized ap-
proach was an easy sell to the stakeholders.
AES, the CEC, the South Coast Air Qual-
ity Management District (SCAQMD), and
CAISO all quickly realized that the proposed
approach was the only one that could fulfill
all of the stringent requirements of the proj-
ect, particularly the looming summer dead-
line. The application was filed with the CEC
on Oct. 5, 2012, and the synchronous con-
densers needed to be fully functional no later
than June 28, 2013.
Work began immediately after project ap-
provals were granted in late 2012. AES em-
ployed Siemens to lead a team of contractorsin the installation. With the tight timeline
constantly in mind, the Siemens team made
the decision to adapt to the situation and ma-
terials at hand, rather than bring in a slew of
new equipment.
The Huntington Beach plant operated as
a cross-compound system. There were four
generators onsite, but only two acceleration
models were needed to bring the system to life.
Essentially, the two small pony motors were
used as prime movers, which replaced the ex-
isting boilers and steam turbines. Original plans
called for one power source to control the mo-tors, but after careful consideration, the team
decided to install a second source to provide a
redundant source of power should any unfore-
seen circumstances affect drive functionality.
The VFDs were installed to drive the strategi-
cally located pony motors (Figure 2) and keep
the motors’ size, horsepower, and costs down
thanks to the way the units were configured
with the two tandem generators. The drives
allow the generators to be brought up slowly
and simultaneously while keeping them in an
electrical lock. Though adding the additional
power source was not part of the original planand required additional time to implement, the
team had been prepared by building a buffer
into the schedule for minor delays.
Along the way, the team faced additional
challenges that could have potentially affected
the timeline. At one point in the installation,
an overhead crane failed. Ultimately, the crane
was repaired and the project stayed on track.
Despite a few minor setbacks, the con-
verted system was successfully started up on
June 28, 2013—the exact date that the proj-
ect was slated for completion—and has been
a reliable resource ever since.The generators can be automatically excit-
ed when needed and as a result do not need
1. Second life. Two retired generators at the AES Huntington Beach plant were recently
converted to synchronous condensers to provide voltage support to the Southern California
grid after the unexpected retirement of the San Onofre Nuclear Generating Station. A planned
redesign will conceal a new plant behind giant surfboards, in keeping with the city’s history as
a surfing destination. Courtesy: Siemens Energy and Chet Williams Photography

7/22/2019 Power March 2014
http://slidepdf.com/reader/full/power-march-2014 34/82www.electricpowerexpo.com
Experience the new
ELECTRIC POWER
ELECTRIC POWER is well known for its cutting-edge coverage of
the most important issues confronting power plant professionals
today, so you can expect to gain insight and answers to your
biggest questions here.
Gain access to answers for issues confronting the power generation industry.
With 250 experts leading sessions in ten focused tracks, you’ll have access
to the latest top-notch industry information for every fuel sector — gas, coal,nuclear, and renewable energy.

7/22/2019 Power March 2014
http://slidepdf.com/reader/full/power-march-2014 35/82Presented by
NEW ideas. NEW connections.NEW opportunities. NEW ORLEANS.
Allow time in your schedule to extend your education to the exhibit floor, where you can collect data,
evaluate solutions for your capital projects, and interact with leading industry suppliers who have the
answers you need.
POWER subscribers receive 10% off with discount code POWER10.
Join us at ELECTRIC POWER 2014 to gain industry
insights, make important industry connections, andexperience new technology solutions.
Grand Sponsor: Host Utility:

7/22/2019 Power March 2014
http://slidepdf.com/reader/full/power-march-2014 36/82

7/22/2019 Power March 2014
http://slidepdf.com/reader/full/power-march-2014 37/82

7/22/2019 Power March 2014
http://slidepdf.com/reader/full/power-march-2014 38/82
GRID SUPPORT
www.powermag.com POWER |March 201434
to work nearly as hard as they had in the past.
As an added bonus, synchronous condensers
require under an hour of start-up time, as op-
posed to nearly the 12 hours required to fire
a boiler, so they can be tapped on demand in
times of need.
“We needed a project that could provide
the reactive support needed to optimize power
transfers across L.A. and into the San Diego
region,” said Pettingill. “After the summer
of 2013, we can definitively say those needs
were met with the synchronous condenser
project at AES Huntington Beach.”
Clearing the AirWhen the synchronous condenser conversion
was presented, the SCAQMD appreciated
the fact that it translated into a nongenerating
resource that provides voltage support with-
out any emissions. Emissions are a growing
concern with industrial and power plants
around the world, particularly in California.State legislation requires any investments in
generation resources (new construction and
renovation) that provide electricity to Cali-
fornia residents to meet a specific emissions
standard of 1,100 lb CO2 /MWh or less. By
providing reactive power to transfer energy
across grids, the synchronous condensers
help eliminate the need for constant genera-
tor operation and reduce those emissions.
Appealing to the MassesSynchronous condensers can provide dy-
namic benefits across multiple platforms andapplications. In AES’s case, they assist in
distributing reactive power to the grid as nec-
essary in times of peak usage, but they can
also absorb reactive power when necessary.
Though AES is looking toward moderniz-
ing the plant, both inside and out, with more
efficient infrastructure and a beach-themed
wave and surfboard exterior, the trend to con-
vert to synchronous condensers has applica-
tions well beyond Southern California:
■ Renewable energy. In California as in many
other regions, higher levels of renewables
are being added to the system. As a re-
sult, introducing additional reactive power
sources such as synchronous condensers
can help deal with challenges of transform-
ing the grid in order to accommodate po-
tential differences in power sources.
■ Voltage sags. Conversely, as more coal-
fired plants are retired, more inertia is lost,
creating voltage sags across the country.
Synchronous condensers have the capa-
bility, with on-demand excitation and ac-
celeration, to provide dynamic voltage
support to make up for that loss.■ Long distance and highly concentrated
grids. For electric suppliers whose grids
span great distances, synchronous condens-
ers come in particularly handy. The synchro-
nous condensers move reactive power and
change the voltage of the grid to balance the
distribution across greater distances or to a
greater number of consumers.
■ Large industrial loads. In high-activity
industrial settings such as paper mills,
steel mills, manufacturing facilities, and
more, system stability is constantly evolv-
ing. Loads need reactive power to assistwith initialization and stabilization. The
synchronous condensers are a low-risk
means of consuming and dissipating reac-
tive power as needed, providing an array of
benefits and avoiding outage situations al-
together. For industrial plants with a variety
of inductive loads such as motors, drives,
and transformers, synchronous condensers
provide reactive power to get things up and
running quickly and smoothly.
Drawing ConclusionsThe summer of 2013 in southern Orange and
San Diego counties went smoothly. Even
without the 2,200 MW of generation from
SONGS, residents of Southern California
stayed cool and calm with their lights and air
conditioners on.
“The effort by the whole team to restart
the units before the summer of 2012 with a
herculean effort and under a short time frame
was nothing short of amazing,” CAISO presi-
dent and CEO Steve Berberich said. “To fol-
low that up with a sprint to convert those same
units to synchronous condensers cemented
the immense respect and confidence we havein the AES Huntington Beach team.”
As for the future of the synchronous
condensers at AES, their story doesn’t end
here. A Reliability Must-Run contract exists
between CAISO and AES. Current contract
provisions call for the retirement of one of
the synchronous condensers at the end of
2016 and the other at the end of 2017 in or-
der for AES to undertake its once-through
cooling compliance repowering plans for
the entire facility. However, CAISO will an-
nually assess whether or not the grid has a
reliability need that can still be met by thisproject. The evaluation of this option will
need to consider how an extension of the
synchronous condenser’s operation beyond
2017 would affect the long-term repowering
plans for the AES Huntington Beach facil-
ity. There has also been discussion of con-
verting one or both of the retired generators
at SONGS to synchronous condensers by
the summer of 2015.
There is plenty of opportunity to replicate
the success realized by the AES conversion
project across the country. The job of a plant
manager in every industry is to evaluate andmanage risk while also maximizing the return
on the asset. Synchronous condenser conver-
sion is a very low-risk approach. Every grid
operator or transmission planning entity has
unique needs. It is important to consider how
certain technologies like synchronous con-
densers can help to optimize power flow,
minimize risk, and maximize benefits to help
meet the needs at hand. ■
— Chris Davidson is the electrical solu- tions business development director atSiemens Energy IC&E. Weikko Wirta is
the Southland operations and mainte- nance manager, site leader, and former
plant manager at AES Huntington Beach.
2. Working in tandem. The pony motor (foreground) is driven by a variable frequency
drive (out of sight underground), allowing the generators (center)—which once supplied power
to the grid—to function as synchronous condensers. Courtesy: Siemens Energy and Chet Wil-
liams Photography

7/22/2019 Power March 2014
http://slidepdf.com/reader/full/power-march-2014 39/82
Boiler Testing &
Monitoring Services
SO3
NH 3
XCAM™ is a trademark of Fuel Tech, Inc. © Fuel Tech, Inc. All Rights Reserved
27601 Bella Vista Pkwy | Warrenville, IL 60555 | www.ftek.com | 800.666.9688
We understand the difficulty that coal-burning utilitiesface and offer testing services and assistance withinterpreting your operational data necessary to beproactive in today’s energy market. With more than20 years of experience, we’re ready to roll up our sleevesand provide the service package that’s best for you.
3
XCAM systems offer an alternative to traditional TDLsystems, without the operational issues. Our continuousextractive probe design allow for SNCR and SCR tuningoptimization and control. With XCAM systems installed,reagent consumption is minimized while NOX reduction
and operational reliability can be improved as unitsoperate over wide load ranges.
XCAM™ Extractive
Continuous AmmoniaMonitoring Systems
Services Include:
XCAM systems offer:
Looking for a Competitive Edge?
CIRCLE 16 ON READER SERVICE CARD
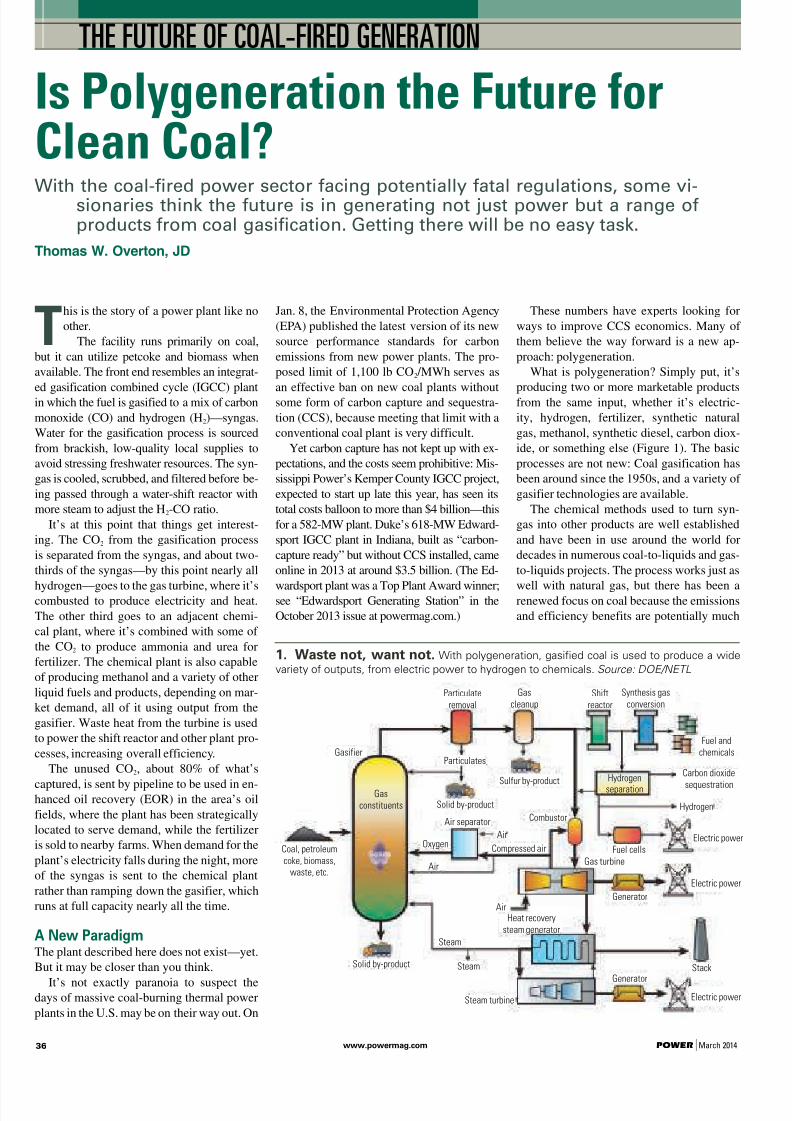
7/22/2019 Power March 2014
http://slidepdf.com/reader/full/power-march-2014 40/82 www.powermag.com POWER |March 201436
THE FUTURE OF COAL-FIRED GENERATION
Is Polygeneration the Future forClean Coal?With the coal-fired power sector facing potentially fatal regulations, some vi-
sionaries think the future is in generating not just power but a range ofproducts from coal gasification. Getting there will be no easy task.
Thomas W. Overton, JD
This is the story of a power plant like no
other.
The facility runs primarily on coal,
but it can utilize petcoke and biomass when
available. The front end resembles an integrat-
ed gasification combined cycle (IGCC) plantin which the fuel is gasified to a mix of carbon
monoxide (CO) and hydrogen (H2)—syngas.
Water for the gasification process is sourced
from brackish, low-quality local supplies to
avoid stressing freshwater resources. The syn-
gas is cooled, scrubbed, and filtered before be-
ing passed through a water-shift reactor with
more steam to adjust the H2-CO ratio.
It’s at this point that things get interest-
ing. The CO2 from the gasification process
is separated from the syngas, and about two-
thirds of the syngas—by this point nearly all
hydrogen—goes to the gas turbine, where it’scombusted to produce electricity and heat.
The other third goes to an adjacent chemi-
cal plant, where it’s combined with some of
the CO2 to produce ammonia and urea for
fertilizer. The chemical plant is also capable
of producing methanol and a variety of other
liquid fuels and products, depending on mar-
ket demand, all of it using output from the
gasifier. Waste heat from the turbine is used
to power the shift reactor and other plant pro-
cesses, increasing overall efficiency.
The unused CO2, about 80% of what’s
captured, is sent by pipeline to be used in en-hanced oil recovery (EOR) in the area’s oil
fields, where the plant has been strategically
located to serve demand, while the fertilizer
is sold to nearby farms. When demand for the
plant’s electricity falls during the night, more
of the syngas is sent to the chemical plant
rather than ramping down the gasifier, which
runs at full capacity nearly all the time.
A New ParadigmThe plant described here does not exist—yet.
But it may be closer than you think.
It’s not exactly paranoia to suspect thedays of massive coal-burning thermal power
plants in the U.S. may be on their way out. On
Jan. 8, the Environmental Protection Agency
(EPA) published the latest version of its new
source performance standards for carbon
emissions from new power plants. The pro-
posed limit of 1,100 lb CO2 /MWh serves as
an effective ban on new coal plants withoutsome form of carbon capture and sequestra-
tion (CCS), because meeting that limit with a
conventional coal plant is very difficult.
Yet carbon capture has not kept up with ex-
pectations, and the costs seem prohibitive: Mis-
sissippi Power’s Kemper County IGCC project,
expected to start up late this year, has seen its
total costs balloon to more than $4 billion—this
for a 582-MW plant. Duke’s 618-MW Edward-
sport IGCC plant in Indiana, built as “carbon-
capture ready” but without CCS installed, came
online in 2013 at around $3.5 billion. (The Ed-
wardsport plant was a Top Plant Award winner;see “Edwardsport Generating Station” in the
October 2013 issue at powermag.com.)
These numbers have experts looking for
ways to improve CCS economics. Many of
them believe the way forward is a new ap-
proach: polygeneration.
What is polygeneration? Simply put, it’s
producing two or more marketable productsfrom the same input, whether it’s electric-
ity, hydrogen, fertilizer, synthetic natural
gas, methanol, synthetic diesel, carbon diox-
ide, or something else (Figure 1). The basic
processes are not new: Coal gasification has
been around since the 1950s, and a variety of
gasifier technologies are available.
The chemical methods used to turn syn-
gas into other products are well established
and have been in use around the world for
decades in numerous coal-to-liquids and gas-
to-liquids projects. The process works just as
well with natural gas, but there has been arenewed focus on coal because the emissions
and efficiency benefits are potentially much
Particulate
removal
Gas
cleanupShift
reactor
Synthesis gas
conversion
Fuel and
chemicals
Carbon dioxide
sequestration
Hydrogen
Electric power
Electric power
Electric power
Generator
Generator
GasifierParticulates
Solid by-product
Air separator
Sulfur by-product
Combustor
Fuel cells
Gas turbine
Stack
Air
Compressed air
Air
Oxygen
Solid by-product
Air
Steam
Steam
Steam turbine
Heat recovery
steam generator
Coal, petroleum
coke, biomass,waste, etc.
Gas
constituents
Hydrogen
separation
1. Waste not, want not. With polygeneration, gasified coal is used to produce a wide
variety of outputs, from electric power to hydrogen to chemicals. Source: DOE/NETL

7/22/2019 Power March 2014
http://slidepdf.com/reader/full/power-march-2014 41/82March 2014 |POWER www.powermag.com 37
THE FUTURE OF COAL-FIRED GENERATION
larger. A polygeneration plant can theoreti-
cally achieve efficiencies as high as 55% to
60%, compared to a maximum of about 40%
to 45% for a state-of-the-art ultrasupercritical
coal-fired thermal plant.
Polygeneration has other benefits. One of
the biggest is the potential for much lower
emissions than from a conventional coal-
fired boiler, because the impurities and pol-
lutants, such as particulates, sulfur, mercury,
and CO2, are removed from the syngas prior
to combustion, where they are more concen-
trated and more easily captured.
Another benefit is that the chemicals and fu-
els produced from syngas are typically cleaner
than those produced from petroleum, resulting in
lower emissions further down the supply chain.
Coal gasifiers also are less sensitive to feed-
stock, and can generally use a wide variety of
coals and biomass with less optimization than
a conventional plant, allowing the owners toleverage fluctuations in fuel prices. Likewise,
the chemical products such a plant can manu-
facture are flexible, allowing it to produce prod-
ucts with the highest current market value.
The overall synergy between the gasifier,
power plant, and chemical plant means great-
er overall efficiency and lower emissions and
production costs than for standalone facilities.
Challenges GaloreThere are significant challenges to making
all this work, however. High capital costs for
coal gasifier technology have thus far beenthe largest deterrent. By comparison, AEP’s
600-MW ultrasupercritical John W. Turk, Jr.
plant in Arkansas (POWER’s 2013 Plant of
the Year, see the August issue), which came
online a few months before Edwardsport,
cost about half as much, at $1.8 billion.
Though IGCC technology has been around
for several decades, it is still not in common us-
age, especially with coal. Only two other full-
size IGCC plants are currently operating in the
U.S., Tampa Electric’s 250-MW Polk Power
Station and the 262-MW Wabash River plant
in Indiana (operated by Duke but owned bythe Wabash Valley Power Association), both of
which suffered substantial operational issues in
their first years of operation; neither incorpo-
rates CCS. Meanwhile, only a few other utility-
scale IGCC plants are in operation worldwide.
Several are planning to test or incorporate CCS,
but none involves polygeneration.
Another challenge is the multi-faceted
nature of the plant, which significantly in-
creases its operational complexity. Few if
any utilities or merchant plant owners have
the experience or expertise to operate an as-
sociated chemical plant. Early entrants aremore likely to come from the petrochemical
industry, which has the experience in that
field—though with petrochemical residu-
als rather than coal—as well as in operating
refinery-based power plants. Still, it is likely
that successful coal-based polygeneration
projects will require partnerships between
power and chemical companies.
Current ProjectsChallenges or not, the plant described in the
opening to this article is by no means a fanta-
sy. In fact, it’s the plan for two approximately
400-MW projects currently in development:
The Texas Clean Energy Project (TCEP),near Odessa, and Hydrogen Energy Califor-
nia (HECA), planned for a site near Bakers-
field. Both locations are in the heart of their
state’s oil industry and close to substantial
commercial agriculture.
TCEP, being developed by Summit Power
Group, plans to employ two Siemens SFG-
500 gasifiers and a Siemens SGT6-PAC
5000F gas turbine. Fluor will provide the en-
gineering and construction, and Linde Group
subsidiary Selas Fluid Processing will supply
the syngas, CCS, and chemical processing
equipment. TCEP will be sized to produce atleast 400 MW gross, though normal baseload
operation will be 377 MW. Of that, about half
will be used on site: 105.7 MW to run plant
equipment, 15.7 MW for CCS, and 42.2 MW
for producing fertilizer. The remaining 214
MW will be sold to the grid.
The TCEP plant will use low-sulfur Pow-
der River Basin coal. It will capture around
90% of its CO2 emissions and produce al-
most 3 million tons of CO2 for EOR. The
Permian Basin area where TCEP will operate
has been employing EOR for more than 40
years and has a robust pipeline infrastruc-ture for transporting CO2, but demand for
it currently exceeds supply by about 300%.
According to project documents, the largest
chunk of the project’s revenue will actually
come from fertilizer sales—about 700,000
tons per year—rather than power sales.
HECA will be located in one of California’s
oldest oil basins, the Elk Hills play (Figure 2)
in the Central Valley. Most of the oil from that
field has been extracted, however, and increas-
ingly energy-intensive methods are necessary
to get out what’s left—thus the potential for
CO2 EOR. Unlike TCEP, HECA will use a
mixture of coal and petcoke from Southern
California refineries. HECA will also be builtby Fluor, using Mitsubishi Heavy Industry
gasifier technology and gas turbines.
HECA is being developed by Massachu-
setts-based SCS Energy, which acquired it from
original developers BP and Rio Tinto. HECA
will be able to generate around 280 MW of
electricity for the grid, with the balance being
used on-site. The facility is projected to capture
about 3 million tons of CO2 and produce about
1 million tons of fertilizer each year.
Despite the attractive synergy of these
projects, both are relying heavily on public
support. TCEP has received $450 millionfrom the Department of Energy’s Clean Coal
Power Initiative, while HECA has received
$408 million. TCEP will also receive sub-
stantial tax exemptions for its CCS and EOR
sales from the State of Texas. In both cases,
the DOE grants are only a fraction of the
approximately $2.5 billion to $3 billion the
plants will cost.
HECA is about two-thirds of the way
through the permitting process and is still ne-
gotiating purchase agreements for its electric-
ity, fertilizer, and other products. Jim Croyle,
CEO of SCS Energy, told POWER he expectsconstruction to begin some time in the fourth
quarter of 2014.
2. Multitalented. The Hydrogen Energy California project will supply about 280 MW to the
California grid as well as fertilizer for Central Valley farms and CO2 for enhanced oil recovery in
the Elk Hills oil field. Courtesy: Hydrogen Energy California

7/22/2019 Power March 2014
http://slidepdf.com/reader/full/power-march-2014 42/82 www.powermag.com POWER |March 201438
THE FUTURE OF COAL-FIRED GENERATION
Laura Miller, Summit Power’s director of
projects, told POWER that TCEP had hoped
to close financing in December, but its en-
gineering, procurement, and construction
contractors (Siemens, Linde, and Sinopec En-
gineering Group) are having difficulty staffing
the project because of the oil and gas boom in
Texas, which has made skilled labor extremely
expensive and hard to find. Its plan is to break
ground as soon as possible in 2014.
TCEP suffered a setback on Jan. 6, when
CPS Energy, which supplies power to the San
Antonio area, allowed its power purchase
agreement (PPA) with Summit to expire. It
blamed repeated delays in getting TCEP built
and the changing power market as a result of
falling natural gas prices. Still, CPS said it
would “consider the possibility of an updated
PPA with the Texas Clean Energy Project in
the future” and that it “remain[s] hopeful this
project can proceed.”Only one other polygeneration project is
under development, but it’s one with some
structural advantages not enjoyed by TCEP
or HECA. India-based Reliance Industries
is planning to add what may be the world’s
largest gasification complex to what is al-
ready the largest oil refinery in the world,
Jamnagar in Gujarat. Reliance has thus far
run Jamnagar’s 1.5-GW cogeneration power
plant on imported liquefied natural gas, but
transitioning to syngas from the refinery’s
excess petcoke (as well as coal) will allow it
to reduce its fuel costs. With the refinery al-
ready in place, the polygeneration plant will
have a captive customer for it output. The
project, to be built by Fluor using CB&I’s
E-Gas technology and Linde air separation
units, is planned in two phases of eight gasifi-
ers each with initial start-up in mid-2015.
The Way ForwardThe companies working on polygeneration
are frank about the need for better policy
support if the sector is to take off. Speaking
to a 2012 meeting of the Interstate Oil and
Gas Compact Commission, Summit Power
Vice President Jeff Brown openly conceded
that the market does not currently support the
extra costs of carbon capture, even with ad-ditional revenues from selling CO2, fertilizer,
and other products. But the current system for
carbon sequestration tax credits under Section
45Q actually makes the situation worse.
“As the tax credit is currently structured,
no individual facility can predict the number
of years it will be able to receive sequestra-
tion tax credits,” Miller said. “As there is no
assurance that a facility will be able to receive
sequestration tax credits for a set number of
years, lenders are unwilling to assume the
risk that the tax credits will be available.”
Summit and other groups working in CCS
have been pushing for an amendment that
would allow a CCS project to reserve credits
once construction begins. Right now, the credit
is capped at 75 million tons on a first-come ba-
sis, and those credits are being used up by oil
and gas companies conducting conventional
EOR rather than true CCS. “We can’t put the
$10/ton we ought to be getting for doing EOR
with 2.5 million tons per year of captured CO2
because there is no protocol for reserving
credits for individual projects, we don’t know
how much has been claimed already—and,
worse, the IRS won’t tell anybody how much
has been claimed or who is actually eligible to
make claims,” Miller said.
Jeff Phillips, manager of advanced fossilgeneration and CCS R&D for the Electric
Power Research Institute, said the advan-
tage in polygeneration is likely to go to early
entrants with existing infrastructure and ex-
pertise in chemical processing, such as Reli-
ance. One challenge is financing projects that
are unfamiliar to the investment community
because they operate in both the power and
chemical markets. “It’s difficult to find inves-
tors who want to be involved in all of that,”
he said, given how it can take many of them
out of their comfort zone.
Another challenge that will need to be ad-dressed is selling polygeneration to public util-
ity commissions in regulated markets, because
it’s difficult to separate out the power costs
from the chemical costs in calculating the rate-
base. Here, the integrated nature of the plant is
actually a problem because of the amount of
equipment used for both power and chemical
production and how operators will shift back
and forth depending on market fluctuations.
“You can get complicated in a hurry,” he said.
“There’s a bigger regulatory hurdle” in build-
ing polygeneration plants in those markets.
Croyle agreed, noting that polygenerationis a learning process for regulators as well as
developers. “This is something that a myriad
of local, state, and federal agencies are deal-
ing with for the first time, and it’s easy to un-
derstand their challenge,” he told POWER.
Phillips expects it to be the mid-2020s at
the earliest before polygeneration in the U.S.
progresses beyond the TCEP and HECA
projects. But as with everything in the pow-
er sector, things could easily change if the
economics shift. “If gas prices surprise the
prognosticators and go up, that might spark
earlier interest,” he said. ■— Thomas W. Overton, JD is a POWER
associate editor.T R A I N I N G • F I E L D S U P P O R T • T E C H N I C A L E X P E R T I S E
[email protected] www.appliedbolting.com1 800 552 1999
introducing the new...
the best way to bolt...just got better!
DuraSquirt DTIDuraSquirterDuraSquirter
®
Because the weather doesn’tcar e about schedules,inspector s or budgets.
See the longer lasting squir t for
inspection on your schedule.
Booth 3249
CIRCLE 17 ON READER SERVICE CARD

7/22/2019 Power March 2014
http://slidepdf.com/reader/full/power-march-2014 43/82March 2014 |POWER www.powermag.com 39
THE FUTURE OF COAL-FIRED GENERATION
The Role of Activated Carbon in aComprehensive MATS StrategyConventional wisdom suggests that coal-fired power plants employing selective
catalytic reduction and a wet scrubber can comply with Mercury and Air Tox-ics Standards (MATS). Long-term testing at Southern Co. demonstrates acti-vated carbon can be a key component of a reliable whole-plant solution.
Brandon Looney, Nick Irvin, Chethan Acharya, Joe Wong, and Sheila Glesmann
The U.S. Environmental Protection Agen-
cy’s Mercury and Air Toxics Standards
(MATS) set limits on the emissions of
mercury (Hg) and other pollutants for coal-
fired power plants. Many plant operators have
begun developing compliance strategies inanticipation of the effective date of April 16,
2015 (or April 16, 2016, for facilities that
have received an extension). Conventional
wisdom suggests that mercury (Hg) compli-
ance can be achieved using existing pollution
control equipment, particularly a combination
of selective catalytic reduction (SCR), which
addresses oxides of nitrogen (NOx), and wet
scrubbers, which deal with sulfur and other
acid gases. This configuration is common in
power plants burning higher-sulfur coals.
Extensive mercury monitoring conducted
by Southern Co. challenges this myth. South-ern Co. also evaluated various active mercury
control technologies including: activated car-
bon injection (ACI) prior to the electrostatic
precipitator (ESP), ACI with a baghouse ret-
rofit, and powdered activated carbon (PAC)
as an additive to the wet scrubber.
This article presents results and lessons
learned from such testing, plus recommended
guiding principles for developing an effective
MATS compliance strategy:
■ Mercury emissions are highly variable.
■ Complementary technologies are useful indealing with variability.
■ Each plant should have an engineered, or
active, mercury control technology.
■ Plant-specific testing may be necessary to
demonstrate mercury controls.
A History of Activated CarbonActivated carbon injection for coal-fired
power plants was first tested and introduced
through programs conducted collaboratively
by the U.S. Department of Energy, National
Energy Technology Laboratory, Electric Pow-
er Research Institute, and utilities in the early1990s. Since the mid-2000s, ACI has been de-
termined to be both the best available control
technology (BACT) and maximum achiev-
able control technology (MACT) for mercury
control on a case-by-case basis for certain
coal-fired power plants, and today there are
hundreds of commercial systems operating or
contracted, designed to control mercury emis-sions to meet state mercury limits, permit lim-
its, or MATS mercury standards.
Those early Generation 1 PACs worked
under certain conditions, but they were not
optimized for mercury capture. Rather, they
were transferred from other applications
such as water cleanup (a liquid-phase rather
than gaseous-phase use) and municipal solid
waste flue gas, which have order-of-magni-
tude higher mercury concentrations than the
dilute coal-fired flue gas stream.
Since 2011, innovative products have been in-
troduced, engineered, and designed specificallyfor mercury capture for coal-fired power plants.
ADA Carbon Solutions introduced its new
trademarked next-generation FastPAC series in
2011 and has turned its focus to development
of sulfur trioxide (SO3)-tolerant PACs and other
specialty applications. Application of a more
detailed, fundamental scientific understanding
of Hg capture mechanisms, as well as more pre-
cise tuning of the PACs’ surface, pore structure,
and particle morphology, have led to significant
advancements in dealing with the complex air
pollution control system chemistries and diffu-
sional and reaction kinetics, leading to the intro-duction of new advanced PACs with enhanced
Hg capture efficacy and efficiency.
Since then, and in conjunction with the more
accelerated recent pace of laboratory prototyp-
ing and field demonstrations, the rate of innova-
tion has picked up. One of the rapid prototyping
tools that ADA Carbon Solutions (Figure 1)
uses to quickly test and prove out new products
is its Dynamic Mercury Capture test, introduced
this February at the Energy, Utility and Environ-
ment Conference. This test is the first commer-
cially employed bench-scale test that achieves
in-flight, dynamic capture of mercury ratherthan utilizing a fixed bed, which allows for rapid
product development.
As a result of these advancements, there are
several next-generation PACs today that are
designed to work more efficiently in myriad
applications, and the results are creating better
understanding and changing some assumptions
and paradigms established in the earlier work.
The Science Behind an EffectiveMATS Compliance StrategyThere are three essential steps to mercury
control: The elemental mercury (Hg0) must be
converted to oxidized mercury (Hg2+); it must
contact a medium that will remove it from theflue gas stream; and it must be captured and
sequestered effectively and securely by that
medium for removal from the power plant.
All three of these mechanisms are necessary
for mercury control, and the total mercury
control cannot exceed the product of these
mechanisms as per the following:
(Conversion efficiency) x (Contact effi-
ciency) x (Capture efficiency) = Overall mer-
cury control %
For example, consider a plant with an SCRsystem and wet scrubber. If native oxidation,
SCR, halogenated sorbents, and/or additives
1. Silos at ADA Carbon SolutionsRed River Plant, Coushatta, La.Courtesy: ADA Carbon Solutions

7/22/2019 Power March 2014
http://slidepdf.com/reader/full/power-march-2014 44/82 www.powermag.com POWER |March 201440
THE FUTURE OF COAL-FIRED GENERATION
can provide 95% oxidation of the flue gas
mercury (see “Optimized SCR Catalysts Max-
imize Mercury Removal Co-Benefits,” in the
December 2013 issue of POWER, available at
powermag.com), then that 95% is available to
be contacted by a removal media. In this case,
if 95% of the mercury is oxidized at the point
of entry to the wet scrubber, then the mass
transfer limitations of the wet scrubber will
dictate the limit of contact in this device.
Scrubber contact with oxidized mercury
has been observed in Southern Co.’s units to
be very efficient. So in the case of a mod-
ern wet scrubber with no bypass, if the wet
scrubber’s theoretical mass transfer limit is
98% contact, and if this directly translates
into an operational limitation for mercury,
the amount of the fuel mercury that poten-
tially is available for capture in the wet scrub-
ber is (95%) x (98%) = 93%.
Contact efficiency, of course, will be lower
in wet scrubbers with a bypass. For example,15% bypass would limit the mercury avail-
able for scrubber contact to 85% of the fuel
mercury, or (85%) x (95% oxidized) = 81%
that can be controlled by the scrubber.
At this point, the fuel mercury in the wet scrub-
ber will be divided into many forms. It can be in
the solution as one of several oxidized mercury
species, or it can be in particulate form on sol-
ids in the scrubber. Elemental mercury will pass
through unaffected. The oxidized and particulate
mercury residing in the scrubber then need to be
captured and removed from the system.
The form and removal of this mercurydepend on scrubber chemistry and partition-
ing within the solution and solids, and can
vary significantly from plant to plant, as well
as over time. Southern Co. has observed a
wide range (from less than 10% to greater
than 90%) of the mercury to be in the aque-
ous phase. In any case, the mercury needs
to be separated from gypsum, which can be
achieved by processing through a hydrocy-
clone. Stable capture can be obtained with
activated carbon and is described below.
But when evaluating a MATS strategy, oper-
ators of each unit have to ask “Is this enough?”In certain cases 81% to 93% average capture
may not be sufficient, or a power plant opera-
tor may want options for compliance across a
range of operating scenarios. Because MATS
compliance is continuous and averaged over a
defined period, a given unit may require addi-
tional capture only at certain times. And this is
the best-case scenario of a unit with both SCR
and a wet scrubber installed. For any unit with
different technologies, the analysis needs to be
adjusted accordingly.
Another significant consideration is that
the effective contact, conversion, and capturemust occur with minimal impact on the bal-
ance-of-plant operations. For example, PAC
may be treated with additional constituents
to promote conversion of elemental mercury
into its oxidized form for ease of capture.
However, depending on the constituent added,
downstream effects such as equipment corro-
sion could increase. Another benefit of an ac-
tive mercury control is to allow the original air
pollution control equipment to be operated tomaximize the original control purpose.
An overall strategy for MATS compliance
includes considering real-world data and inte-
grating this with the science underlying con-
trol technologies. For example, in the case of
a wet scrubber, the fate of the mercury in the
liquid or solid phase is a key to determining
whether the strategy is sustainable and ef-
fective over the long term. Each unit’s actual
data and emissions variability, the alternatives
available at relatively low additional capital
and operating costs, and the long-term reli-
ability of constantly meeting the MATS limitare the focus of the compliance planning.
Southern Co. BaselinesMonitoring and test-program data have
shown mercury emissions vary signifi-
cantly with unit operational variability and
co-control of existing air pollution control
equipment, which are very unit-specific (see
“Determining AQCS Mercury Removal Co-
Benefits,” in the July 2010 issue). Variables
include the coal itself, as well as many op-
erational variables such as load range, SCR
bypass, particulate matter device cycles, andscrubber operation. Preserving the primary
purpose of co-control equipment is key given
the size and complexity of these systems.
Continuous emissions monitoring (CEMS)
data from tested units have shown that the
combination of SCR and a wet scrubber on
bituminous coal may benefit from including
an active mercury control technology to com-
ply with MATS (Table 1).
The data shows that without a mercury-spe-
cific control method, each unit could be out of
MATS compliance between 5% and 33% of the
time, based on a 30-day rolling average. And itrelegates both oxidation and capture of mercury
to passive processes—the SCR and wet scrub-
ber. Because oxidation (from Hg0 to Hg+2), con-
tact with a collection media, and capture in an
engineered sorbent material or control device
for removal from the system are all required to
achieve effective mercury control, leaving these
critical steps to passive systems may not be suf-
ficient to ensure constant MATS compliance.
The table also shows the value of long-termdata. Short-term measurement periods do give
valuable insights into Hg capture performance,
but they do not necessarily reflect what will
happen over a longer time period when compli-
ance periods are mimicked, as shown in Table
1. In fact, short-term test results can appear to
comply with the standard even though longer-
term measurements reveal exceedances.
To solve the MATS compliance puzzle
for each facility, the emission control train
configuration must be taken into account, as
well as fuel type, load profile, and any future
retrofits that may be planned.Take as an example Unit A, which, based
on historical data, could have exceeded the
30-day MATS average of 1.2 pounds per
trillion British thermal units (lb/TBtu) 25%
of the time over about a two-year period.
Achieving 1.2 lb/TBtu over the period mea-
sured on Unit A would have required approx-
imately an additional 56% mercury capture
at peak emission conditions (depending on
fuel assumptions), and to provide compli-
ance margin at 1.0 lb/TBtu would require ap-
proximately an additional 87% capture, more
than that provided by the existing SCR andscrubber combination alone.
Plants benefit from active engineering
controls. To obtain reliable and controllable
mercury capture, ACI has been tested at sev-
eral Southern Co. plants. The approach in-
cluded conducting test programs on several
representative units and applying the data
as applicable to analyze similar units. Key
learnings from each test program helped de-
fine the overall MATS strategy.
Unit F Case Study
Unit F is an 865-MW unit built in 1976 thatwould not have met the future MATS 30-day
rolling average mercury emissions in about 5%
UnitNumber of rolling
30-day periods (N)
Percentage of time N where
30-day average Hg exceeded
MATS limit of 1.2 lb/TBtu
Overall mean
Hg (lb/TBtu)
99th percentile
Hg (lb/TBtu)
A 402 25% 0.82 1.87
B 773 24% 0.83 1.59
C 926 26% 0.92 1.90
D 917 33% 0.97 1.62
E 1,003 18% 0.89 1.87
F 778 5% 0.71 1.30
G 695 14% 0.97 1.35
Table 1. Mercury CEMS data from seven Southern Co. units. Source:
Southern Co.

7/22/2019 Power March 2014
http://slidepdf.com/reader/full/power-march-2014 45/82March 2014 |POWER www.powermag.com 41
THE FUTURE OF COAL-FIRED GENERATION
of the cases when evaluating historical mercury
CEMS data over a period of about two years.Typical fuel for Unit F is a bituminous coal,
nominally 2.5% sulfur by weight. The future
configuration of Unit F is depicted in Figure 2.
With Unit F, two separate, temporary ACI
systems provided by ADA-ES Inc. and Nol-Tec
Systems Inc. were installed to accommodate
the full test range of PAC injection rates. Up-
stream of PAC injection, an alkali sorbent injec-
tion system provided by Nol-Tec was available
to inject hydrated lime. PAC and lime were then
removed along with the fly ash in the ESP.
Reliable, active MATS compliance on this
critical unit is a key component of SouthernCo.’s strategy. Compared to the baseline data,
Unit F would require a minimum of 11% ad-
ditional control to meet the MATS mercury
limit of 1.2lb/TBtu, and additional control to
maintain a margin on the compliance level.
In addition, Unit F’s configuration is similar
to other Southern Co. units that could benefit
from the test data. The Southern Co. units
analyzed would benefit from varying levels
of control to guarantee MATS compliance,
up to 60% additional mercury control over
co-control (also known as native capture).
Upon reviewing the available CEMS data forUnit F, Southern Co. developed a test program
to determine whether MATS compliance could
be reliably addressed using PAC either through
in-duct injection (ACI) or as a scrubber additive
(in conjunction with STEAG Energy Service’s
technology and injection system).
At the time it was well understood that
Generation 1 and Generation 2 PACs had ex-
perienced interference with mercury capture in
flue gas upstream of Unit F’s scrubber in the
presence of SO3 levels up to 15 to 20 parts per
million (ppm). Empirical evidence has clearly
shown that the presence of SO3 greater than 5ppm can inhibit mercury capture in conven-
tional Generation 1 PAC. Alkali sorbent injec-
tion such as hydrated lime, sodium bicarbonate,
trona, and the like can be used to mitigate theSO3 prior to PAC injection, and combining this
with a higher-SO3-tolerant PAC is one solution
that Southern Co. was interested in evaluating.
Minimizing the alkali sorbent injection is ad-
vantageous from both an economical perspective
and because it minimizes the potential impact on
ESP particulate matter capture performance.
SO3-tolerant PAC such as ADA Carbon Solu-
tions’ registered FastPAC Premium-80 can help
achieve this goal, obtaining good mercury cap-
ture while minimizing both dry sorbent injection
(lime in this case) and PAC quantities.
Test results from Units F and E show thereare alternative options for mercury control
on these units, and also inform strategies for
other untested units. Depending on the de-
gree of control needed or desired upstream
of the scrubber, flue gas injection of FastPAC
Premium can be used in conjunction with
hydrated lime for control levels more than
70% (demonstrated at Unit F), or FastPAC
Premium-80 can be used without hydrated
lime injection for more than 50% capture of
mercury (demonstrated at Unit E).
Figure 3 shows the results achieved at these
two units. These control levels more than ad-
dress the incremental levels needed at Units A
through G for MATS compliance. An advan-
tage of controlling mercury at the ESP is that no
PAC is introduced to the scrubber, so gypsum
quality is unaffected. Also, the balance of the
complex, multi-phase chemistry in the scrub-
ber—critical to successful acid gas control—is
unaffected by additives and mercury loading.
Figure 4 shows the benefit of adding ACI
with either an ESP or baghouse at Unit B, as
an example. For this unit, which experiencedbaseline 30-day rolling averages greater than
the MATS limit 24% of the time, it is clear
that ACI upstream of the ESP provides com-
pliance with a significant operating margin,
and that a baghouse retrofit is not necessary
for mercury capture in all circumstances.
In separate testing, Southern Co. evalu-
ated an ADA Carbon Solutions PowerPAC
in collaboration with STEAG for mercury re-
emission control into the flue gas desulfuriza-
tion (FGD) absorber tower. This testing was
performed without the injection of PAC and
alkali sorbent upstream of the scrubber. Thisalternative solution was of interest to Southern
Co. for potentially providing more options for
solving the MATS compliance puzzle.
The carbon slurry was injected directly
into the forced oxidation wet limestone ab-
sorber (FGD) with an oxidation reduction
potential (ORP) of 600–700 millivolt. The
baseline testing of the flue gas at full load
revealed an FGD inlet elemental Hg of less
than 0.5 lb/TBtu with the baseline stack Hg
emission of 1.7 lb/TBtu. The baseline testing
revealed that periods of Hg re-emission (con-
version of oxidized Hg back to elemental Hg)were taking place in the FGD.
With the addition of PowerPAC in the FGD
with a concentration range of 200–300 ppm
(average carbon injection rate: 100 pounds per
hour), the total Hg stack emission was reduced
to 0.7 lb/TBtu while the FGD inlet elemental
Hg entering the FGD remained at less than 0.5
lb/TBtu. The dissolved phase Hg in the FGD
slurry decreased from 95% during baseline
to 4% during the carbon addition test, while
the solid phase Hg increased from 5% during
baseline to 96% during the carbon addition
test. Mercury partitioning from the liquid tothe solid phase of the FGD slurry correspond-
ing to PAC addition was the primary reason
R e m o v a l o f v a p o r - p h a s e H g ( % )
PAC injection ratio (lb/MMacf)
◆ FastPAC Premium FastPAC Premium + hydrated
lime ▲ FastPAC Premium-80 FastPAC Premium-
80 + hydrated lime
3. In compliance. Here are results of
using FastPAC Premium and FastPAC Premi-
um-80 injection in the ESP with and without
hydrated lime at Units E and F at about 15 to
20 ppm SO3. Source: Southern Co.
Economizer
Selective catalytic
reduction
Dry sorbent
injectionActivated
carboninjection
Air
preheater
Electrostatic precipitator
Wet scrubber
Stack gas
2. Unit F after MATS controls are installed. Source: ADA Carbon Solutions
80
70
60
50
40
30
20
10
0
0 2 4 6 8 10

7/22/2019 Power March 2014
http://slidepdf.com/reader/full/power-march-2014 46/82 www.powermag.com POWER |March 201442
THE FUTURE OF COAL-FIRED GENERATION
for the reduction of Hg re-emission.
Testing occurred on a unit that does not
have any hydrocyclones installed after the
FGD. To determine the fate of the Hg, a pilot
hydrocyclone was used to validate the separa-
tion of the Hg in carbon from gypsum. The
Hg-laden carbon was found to be in the over-
flow of the hydrocyclone and was effectively
removed from the gypsum underflow. The
addition of the ADA carbon in the FGD was
effective in reducing Hg re-emission to South-
ern Co. compliance levels and is a good, cost-
effective option for MATS compliance.
PAC Usage ConsiderationsExtensive testing conducted by Southern Co. un-
derscores the high variability of mercury emis-
sions over time and the importance of active,
engineered control such as ACI, even in systems
with SCRs and wet scrubbers. Looking at vari-
ous alternatives provides trade-offs that can be
assessed to determine the overall lowest impact
to plant performance while reliably maintaining
compliance and cost-effectiveness.
Although PAC injection with ESP recov-
ery of the PAC enables the scrubber and the
gypsum to be unaffected, there are potential
ash consequences to take into consideration.
These can be mitigated with some of the new-
er PACs that require lower quantities and havesteeper capture responsiveness in the range
of interest and by optimizing the system over
time. Injecting PAC into the scrubber avoids
potential ash effects, but then it could result
in the scrubber chemistry being affected and
may risk gypsum quality. In tests at Southern
Co., the gypsum and chemistry quality were
maintained with scrubber PAC addition.
PAC can significantly contribute to MATS
compliance on scrubbed units with SCRs in
several ways. Depending on the configura-
tions, fuel, plant goals, and results of field
demonstrations, it may be more beneficial
to utilize the active control of PAC upstream
of the ESP, where it does provide enhanced
balance-of-plant considerations, does not in-
terfere with scrubber operations, and keeps
mercury out of the scrubber, thus avoiding
any issues with re-emissions.
On the other hand, advanced PACs can
be effective as scrubber additives, enabling
good scrubber operation and sustainable
control levels. Impacts to gypsum need to be
assessed at individual scrubbers.
In either case, when control using advanced
next-generation PACs is applied to the original
baseline CEMS data from the scrubbed units,
the results show that compliance with margin
is achieved continuously and reliably. ■
— Brandon Looney, retail generationdevelopment project manager; Nick Irvin,advanced energy systems R&D manager;and Chethan Acharya, research engineer,
are with Southern Co. Joe Wong, chieftechnology officer, and Sheila Glesmann
([email protected]), seniorvice president of environmental, are with
ADA Carbon Solutions.
CIRCLE 18 ON READER SERVICE CARD
H g e m i s s i o n s , 3 0 - d a y a v e r a g e ( l b / T B t u )
July 2009 Jan 2010 July 2010 Jan 2011 July 2011
■ No change (24%) ■ ACI-ESP (0%) ■ ACI-BH (0%)
4. Doing nothing is not an option. Unit B Baseline CEMS data over time, showing
calculated effect of an ESP or baghouse (BH)
retrofit. Baseline (red) data reflect actual mea-
surements. The ACI-ESP (blue) and ACI-BH data
(green) reflect projected (calculated) levels of
control based on test results. The green line at
1.2 lb/TBtu represents the future MATS mercury
standard for these units. Source: Southern Co.
2
1.8
1.6
1.4
1.2
1
0.8
0.6
0.4
0.2
0

7/22/2019 Power March 2014
http://slidepdf.com/reader/full/power-march-2014 47/82
©2014 Diamond Power International, Inc. All rights reserved.
www.a-s-h.com 1.888.ASH.PARTS
Introducing Allen-Sherman-Hoff’s
Call us to learn more about material handling solutions!
RSC2™remote submerged chain conveyor system
….game changing technology for bottom ash handling
For wet to dry bottom ash conversions
X Eliminates bottom ash storage pondsX Low particulate carryover in return water X Collection and settling of bottom ash in one tank X Simple design for ease of maintenanceX Flexible design allows multiple ash disposal options
X Low operating costsX No outage required for installation
CIRCLE 19 ON READER SERVICE CARD
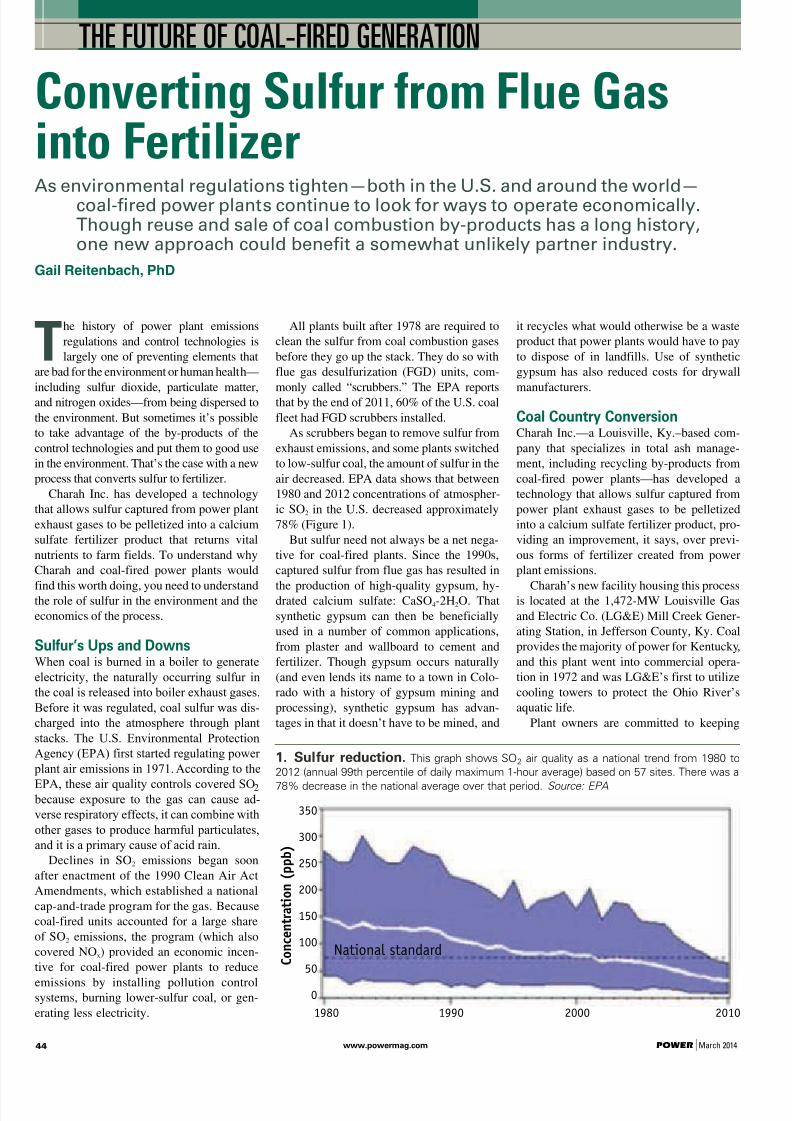
7/22/2019 Power March 2014
http://slidepdf.com/reader/full/power-march-2014 48/82 www.powermag.com POWER |March 201444
THE FUTURE OF COAL-FIRED GENERATION
Converting Sulfur from Flue Gasinto FertilizerAs environmental regulations tighten—both in the U.S. and around the world—
coal-fired power plants continue to look for ways to operate economically.Though reuse and sale of coal combustion by-products has a long history,one new approach could benefit a somewhat unlikely partner industry.
Gail Reitenbach, PhD
The history of power plant emissions
regulations and control technologies is
largely one of preventing elements that
are bad for the environment or human health—
including sulfur dioxide, particulate matter,and nitrogen oxides—from being dispersed to
the environment. But sometimes it’s possible
to take advantage of the by-products of the
control technologies and put them to good use
in the environment. That’s the case with a new
process that converts sulfur to fertilizer.
Charah Inc. has developed a technology
that allows sulfur captured from power plant
exhaust gases to be pelletized into a calcium
sulfate fertilizer product that returns vital
nutrients to farm fields. To understand why
Charah and coal-fired power plants would
find this worth doing, you need to understandthe role of sulfur in the environment and the
economics of the process.
Sulfur’s Ups and DownsWhen coal is burned in a boiler to generate
electricity, the naturally occurring sulfur in
the coal is released into boiler exhaust gases.
Before it was regulated, coal sulfur was dis-
charged into the atmosphere through plant
stacks. The U.S. Environmental Protection
Agency (EPA) first started regulating power
plant air emissions in 1971. According to the
EPA, these air quality controls covered SO2 because exposure to the gas can cause ad-
verse respiratory effects, it can combine with
other gases to produce harmful particulates,
and it is a primary cause of acid rain.
Declines in SO2 emissions began soon
after enactment of the 1990 Clean Air Act
Amendments, which established a national
cap-and-trade program for the gas. Because
coal-fired units accounted for a large share
of SO2 emissions, the program (which also
covered NOx) provided an economic incen-
tive for coal-fired power plants to reduce
emissions by installing pollution controlsystems, burning lower-sulfur coal, or gen-
erating less electricity.
All plants built after 1978 are required to
clean the sulfur from coal combustion gases
before they go up the stack. They do so with
flue gas desulfurization (FGD) units, com-
monly called “scrubbers.” The EPA reportsthat by the end of 2011, 60% of the U.S. coal
fleet had FGD scrubbers installed.
As scrubbers began to remove sulfur from
exhaust emissions, and some plants switched
to low-sulfur coal, the amount of sulfur in the
air decreased. EPA data shows that between
1980 and 2012 concentrations of atmospher-
ic SO2 in the U.S. decreased approximately
78% (Figure 1).
But sulfur need not always be a net nega-
tive for coal-fired plants. Since the 1990s,
captured sulfur from flue gas has resulted in
the production of high-quality gypsum, hy-drated calcium sulfate: CaSO4-2H2O. That
synthetic gypsum can then be beneficially
used in a number of common applications,
from plaster and wallboard to cement and
fertilizer. Though gypsum occurs naturally
(and even lends its name to a town in Colo-
rado with a history of gypsum mining and
processing), synthetic gypsum has advan-
tages in that it doesn’t have to be mined, and
it recycles what would otherwise be a waste
product that power plants would have to pay
to dispose of in landfills. Use of synthetic
gypsum has also reduced costs for drywall
manufacturers.
Coal Country ConversionCharah Inc.—a Louisville, Ky.–based com-
pany that specializes in total ash manage-
ment, including recycling by-products from
coal-fired power plants—has developed a
technology that allows sulfur captured from
power plant exhaust gases to be pelletized
into a calcium sulfate fertilizer product, pro-
viding an improvement, it says, over previ-
ous forms of fertilizer created from power
plant emissions.
Charah’s new facility housing this processis located at the 1,472-MW Louisville Gas
and Electric Co. (LG&E) Mill Creek Gener-
ating Station, in Jefferson County, Ky. Coal
provides the majority of power for Kentucky,
and this plant went into commercial opera-
tion in 1972 and was LG&E’s first to utilize
cooling towers to protect the Ohio River’s
aquatic life.
Plant owners are committed to keeping
1. Sulfur reduction. This graph shows SO2 air quality as a national trend from 1980 to
2012 (annual 99th percentile of daily maximum 1-hour average) based on 57 sites. There was a
78% decrease in the national average over that period. Source: EPA
C o n c e n t r a t i o n
( p p b )
350
300
250
200
150
100
50
0
1980 1990 2000 2010
National standard

7/22/2019 Power March 2014
http://slidepdf.com/reader/full/power-march-2014 49/82March 2014 |POWER www.powermag.com 45
THE FUTURE OF COAL-FIRED GENERATION
this plant online. Starting in spring 2012,
LG&E planned to spend approximately $1.3
billion to modernize the FGD systems and
install fabric filter baghouses for increased
particulate and mercury control on all units at
the plant. This construction project is under
way and will continue through 2015. And in
November 2012, LG&E officials announced
that, as part of the $1.3 billion, they would
be spending approximately $940 million on
clean coal technology at the station. Mike
Kirkland, general manager of Mill Creek
Station, told POWER that would include
replacing existing scrubbers with new ones,
installing new baghouses, and replacing ex-
haust stacks.
Mill Creek burns approximately 4 million
tons of high-sulfur coal annually, primarily
sourced from the Illinois Basin. Kenny Tapp,
senior by-products coordinator for LG&E
and KU Services Co., noted that over 60%
of the plant’s fly ash is used in the manufac-turing of cement and concrete; the economic
value of the fly ash utilization in concrete is
estimated to be in excess of $5,000,000 to
the regional manufacturers of concrete- and
cement-based products. In addition, the plant
realizes significant savings on landfill capac-
ity and associated costs, though neither the
plant nor Charah would release detailed data
on these savings.
The plant has had wet scrubbers and a FGD
slurry processing plant on its property since
1978, and its processing plant can dewater up
to 1,800 tons of gypsum per day for use in themanufacturing of cement, drywall, or other
uses. Now that gypsum has expanded utiliza-
tion opportunities as fertilizer. This additional
use can consume 200,000 plus tons per year of
the total gypsum annual production.
From Flue Gas to GypsumThe sulfur-scrubbing process at a coal-fired
power plant typically involves grinding high-
calcium limestone to powder and then mixing
it with water to form a lime slurry. The lime
slurry is then sprayed into a contact chamber,
where it combines with boiler exhaust gases
and the sulfur reacts with the lime to become
chemically bound.
Scrubbers come in two types: wet and dry.In wet scrubbers, the ratio of lime slurry is
greater and a slurry by-product is produced.
In dry scrubbers, the ratio of slurry to hot
exhaust gases is controlled, to dry the lime
slurry and result in a dry product. Charah
has developed a process to beneficially use
the wet scrubber slurry dewatered gypsum to
manufacture a sulfur and calcium fertilizer.
Wet scrubbers capture sulfur from all
four units at Mill Creek. The lime and sul-
fur slurry is aerated to create calcium sulfate,
dewatered to produce high-quality gypsum,
and then processed to make fertilizer at theadjacent Charah facility (Figure 2).
Mill Creek produces approximately
600,000 to 800,000 tons per year of calcium
sulfate gypsum. The gypsum products are
stockpiled onsite, and Charah manages the
gypsum on behalf of Mill Creek.
From Gypsum to FertilizerThe Mill Creek gypsum typically has higher
purity than natural gypsum because it has
less inert impurities. Mill Creek gypsum is
90+% pure calcium sulfate. Charah utilizes
this calcium sulfate gypsum to manufacturea patent-pending fertilizer named “SUL4R-
PLUS product” that can be used to replenish
the sulfur and calcium in farm soils, turf, and
specialty crops (see sidebar). As Danny Gray,
executive vice president of Charah, explained,
this process essentially closes the cycle loopfor the sulfur that once was returned to farm
fields with rainfall, but now is removed by
the power plant emissions control equipment
before discharging the cleaned exhaust gases
into the atmosphere.
The Charah plant accepts the gypsum
when it discharges from the existing Mill
Creek dewatering facility onto a new con-
veyor that moves it directly into the Charah
plant. That gypsum serves as the feed stock
for the processing steps that include pellet-
izing to create the granular SUL4R-PLUS
product. Although synthetic gypsum haspreviously been used as a soil amendment,
Charah says it is the first to pelletize the by-
product, which makes application easier for
the farmer.
That granular product is stored inside the
Charah warehouse until it is transported to
customers. Custom truck loading is done in-
side the warehouse facility. Charah also has
barge-loading capability, as well as onsite
railcar-loading capacity to meet customers’
logistics needs. Because the Kentucky plant
is located near the Ohio River, Charah can
reach distant markets by barge at economi-cal rates.
The sulfur level of SUL4R-PLUS prod-
2. Conversion site. The Charah product
manufacturing facility sits on the Louisville
Gas and Electric Co.’s Mill Creek Generat-
ing Station property in southwest Jefferson
County, Ky. Courtesy: Charah Inc.
Sulfur’s Role in Agriculture
A key component of agriculture produc-
tion in the U.S. has been the proper de-
ployment of various types of fertilizers.
Historically, the primary fertilizers have
been nitrogen (N), phosphorus (P), and
potassium (K). High-efficiency farm-ing requires that particular attention be
focused on secondary nutrients, which
include calcium (Ca), magnesium (Mg),
and sulfur (S). Sulfur has become more
important to high production and is of-
ten referred to as the “fourth major nu-
trient.” Each of the secondary nutrients
is essential for high-intensity farming
activities. Though required in smaller
quantities than NPK, they are essential
for plant growth.
As a nutrient, sulfur is needed in signif-
icant quantities by many crops that utilize
approximately the same amount of sulfur
as they do phosphorus. A typical crop,such as corn or soybeans, can extract and
remove from the soil 12 to 20 pounds
of sulfur per acre (Table 1). The sulfate
ion (SO4) is the form of sulfur absorbed
by most plants. Replenishment of sulfur
is crucial to maintain high production on
each acre. Typical sources of sulfur include
organic matter, ammonium sulfate, gyp-
sum, zinc sulfate, and elemental sulfur.
Typical nutrient uptake
Crop Yield Nitrogen (lb/ac) Phosphate (lb/ac) Sulfur (lb/ac)
Corn 200 bu/ac 150 85 15
Soybeans 60 bu/ac 240 48 12
Wheat 80 bu/ac 92 44 7
Alfalfa 6 ton/ac 225 60 30
Notes: ac = acre, bu = bushels.
Table 1. Typical nutrient uptake. Source: Charah Inc.

7/22/2019 Power March 2014
http://slidepdf.com/reader/full/power-march-2014 50/82 www.powermag.com POWER |March 201446
THE FUTURE OF COAL-FIRED GENERATION
uct is greater than 16%, its calcium level is
greater than 20%, and the product looks like
and handles like any other granular fertilizer(Figure 3). Farmers can replenish the sulfur
depleted by crops from farm soils by applying
SUL4R-PLUS product along with their other
fertilizers. The product has a unit weight of
approximately 50 pounds per cubic foot and
spreads in common distribution equipment in
a single pass across the field.
Win-Win Economics
In nations where power plant emissions are
tightly regulated, adding beneficial reuse ofby-products is likely to become an increasingly
valued option for the future business case. At
full capacity, more than 50% of Mill Creek’s
gypsum will be beneficially used. By avoiding
disposal of the recycled by-products, LG&E re-
alizes lower operating costs, which help lower
electricity costs for the utility’s customers.
Additionally, Gray says Charah’s granular
fertilizer provides good economic value to the
American farmer, as typical prices of SUL4R-
PLUS product are 20% to 30% lower than al-
ternative sources of sulfur equivalents.
Charah’s investment of $12 million to $14
million in 2013 has provided a first-of-its-
kind manufacturing plant to convert high-
grade calcium sulfate into a new agriculture
product. The plant is designed to reclaim up
to 300,000 tons per year of gypsum and pro-
duce up to 250,000 tons of SUL4R-PLUS
product fertilizer. It also created up to 25 new
jobs in the recycling industry.
At power plants that generate a high-
quality gypsum product, Charah says a
manufacturing plant can be custom de-
signed and installed within 12 months.
Charah provides the capital for SUL4R-
PLUS plants and maintains owner and op-
erator status. Agreements between Charah
and the host power plant typically extendover five to 15 years. Charah plans to de-
velop and install SUL4R-PLUS manu-
facturing plants throughout the U.S. at
strategic locations to meet the growing de-
mand for agricultural sulfur products. ■
— Gail Reitenbach, PhD is POWER’s editor(@GailReit, @POWERmagazine).
3. From power plant to pelletized fertilizer. Courtesy: Charah Inc.
Nol-Tec Systems, Inc.
425 Apollo Drive Lino Lakes, MN 55014
MATS and MACT compliant mitigation of
Hg SO2
SO3
HCI HF
Nol-Tec’s proven DSI technology —
Call 651-780-8600 today to begin an analysis
of your pollution mitigation needs.
Nol-Tec’s Sorb-N-Ject ® dry sorbent injection systems are
custom-designed to suit your specific air pollution migitation
needs. Our experts look at every variable to guarantee
compliant levels for your emissions.
We develop systems to be scalable and flexible, so you’ll
never get a cookie-cutter solution from Nol-Tec.
Sorb-N-Ject®
for systems large or small
Dependable, continuous sorbent flow, with
redundant design as needed
Reliable automated operation and control, for
optimal performance and consistent costs
On-site, self-contained testing systems, to ensure
the precise results you need
[email protected] www.nol-tec.com
CIRCLE 20 ON READER SERVICE CARD

7/22/2019 Power March 2014
http://slidepdf.com/reader/full/power-march-2014 51/82March 2014 |POWER www.powermag.com 47
THE FUTURE OF COAL-FIRED GENERATION
Be Prepared for Coal AshRegulationsThe ways of Washington are murky and slow, but once the Environmental Pro-
tection Agency finally finalizes its rules on coal combustion residuals, you’llhave to move fast to comply, so carefully consider your options today.
Brandon Bell, PE
Alittle over five years ago, on the night
of Dec. 22, 2008, the residents of
Kingston, Tenn., were devastated
when a dike holding back an 84-acre ash
pond broke loose. The ash pond servicing
Tennessee Valley Authority’s (TVA) Kings-ton facility was holding 5.4 million cubic
yards of coal ash sludge that spread over 400
acres and damaged 42 houses. The release of
coal ash into the environment was so signifi-
cant that the consequences of the devastation
took approximately four years to clean up
(Figure 1). Even with significant cleanup ef-
forts, some reports estimate that as much as
500,000 cubic yards of coal ash remain in the
nearby Emory River.
Since that event, the promulgation of En-
vironmental Protection Agency (EPA) regu-
lations for coal combustion residuals (CCRs)has been a concern of coal-fired power gen-
erators nationwide.
Double-Edged SwordAsh ponds were originally constructed as an
economical option to provide temporary stor-
age for CCRs generated from the combustion
of coal. Approximately 15% to 40% of ash
generated by coal combustion is in the form
of heavy ash agglomerations, commonly re-
ferred to as bottom ash. This ash is too heavy
to be carried by the combustion flue gases
and thus falls to the bottom of the boiler. Thisash is particularly hot (upwards of 2,400F)
and needs to be quenched and processed prior
to handling. For this reason, most pulverized
coal boilers are designed with hydraulic bot-
tom ash systems to cool, crush, and convey
these heavy ash agglomerations.
At the Kingston facility, the hydrau-
lic bottom ash system made use of an ash
sluicing (or slurry) system to convey the
cooled bottom ash to an ash pond. Once
the ash has settled in the pond, it can be
dredged and dried, then used for secondary
purposes or landfilled.From an operational point of view, the
ponds were designed to accommodate a
significant volume of ash to maintain safe
and uninterrupted power plant operations.
However, the ash in the pond contains haz-
ardous substances (such as heavy metals)
that can be detrimental to the environment
in a catastrophe such as the Kingston FossilPlant release.
Regulatory and Legal RoundaboutThe EPA previously proposed regulating
CCRs in June 2010 under the authority of
the Solid Waste Disposal Act of 1970, the
Resource Conservation and Recovery Act of
1976 (RCRA), and the Hazardous and Solid
Waste Amendments of 1984 (the combined
regulations are often commonly referred to
as RCRA). Although proposed over three
and a half years ago, the regulation was never
finalized and remains in limbo.
CCRs are defined as fly ash (combustion
by-product consisting of fine particles that
rise with flue gases), bottom ash (agglom-
erated coal ash particles too heavy to rise
in flue gas), boiler slag (molten bottom ash
consisting of silica and aluminosilicates),and flue gas desulfurization (FGD) materials
(predominantly CaSOx materials).
Fly ash consists of fine particles that are
carried through the boiler by combustion flue
gases. Because of the fine nature of fly ash,
systems designed to transport it are typically
pneumatic (vacuum or positive pressurize)
conveying systems. FGD systems are typical-
ly designed with gypsum dewatering systems
and wastewater treatment and are not a sig-
nificant concern for CCR regulation. Bottom
ash and boiler slag that are typically handled
via hydraulic bottom ash systems and makeuse of ash ponds are of significant concern
for the regulation of CCRs.
Since the introduction of the proposed
CCR regulations in 2010, the power industry
has been anticipating the release of a finalized
rule. Year after year the industry has expected
the promulgation of these regulations, but no
direction has been afforded by the EPA. Thatis due to change in 2014.
On Oct. 29, 2013, in the case of Appala-
chian Voices v. McCarthy, a federal judge
ruled that the EPA is required to submit a
plan and schedule for finalizing CCR regula-
tions within 60 days. Although this is a solid
push for the EPA to finalize CCR regulations,
it does not guarantee an expedited release of
final rules. As further incentive to finalize
CCR regulations, the ruling also requires the
EPA to review RCRA coal ash rules every
three years. The requirement for a regulatory
review of RCRA, as it relates to CCRs, couldopen the door for environmental groups to
file suit against the EPA.
As this article was being written, a consent
decree was reached between the agency and
environmental groups on Jan. 29 that requires
the EPA to issue a proposed revision of its
RCRA rules no later than Dec. 18, 2014.
It is because of recent actions by the
courts that utilities still operating ash re-
moval systems that make use of ash ponds
need to consider alternative options for fu-
ture operations.
Subtitle C vs. Subtitle DAs part of the proposed regulation, the EPA
is considering two paths for the regulation of
CCRs (see table). The first path is using Sub-
title C of RCRA to create federally enforce-
able requirements for waste management and
disposal of CCRs. The second path utilizes
Subtitle D of RCRA, which sets performance
standards for waste management facilities
that will be enforced by states that adopt their
own coal ash management programs.
Under the Subtitle C proposal, wet han-
dling of CCRs, including the use of coal ashponds, would be phased out. The Subtitle D
path would require existing coal ash ponds
1. TVA Kingston coal ash release. This photograph was taken Dec. 23, 2008, a
day after the earthen containment walls hold-
ing more than five million cubic yards of fly
ash and bottom ash sludge failed. Source: Ten-
nessee Valley Authority

7/22/2019 Power March 2014
http://slidepdf.com/reader/full/power-march-2014 52/82 www.powermag.com POWER |March 201448
THE FUTURE OF COAL-FIRED GENERATION
to be retrofitted with a composite liner to
prevent ash contaminants from leaching into
the groundwater. Although the addition of a
composite liner to an ash pond may appear
to be a simple remedy, the EPA is anticipat-
ing the cost of this path will create a strong
incentive to decommission these ponds and
transition to a landfill operation.
Compliance Strategies
Without a clear understanding of which paththe EPA intends to take for regulating CCRs,
it is difficult to home in on a single technol-
ogy, wet or dry, to meet forthcoming regula-
tions. What is clear is that the EPA is intent
on shuttering coal ash pond operations, and
the February spill at Duke Energy’s Dan
River Steam Station’s ash pond is likely to
reinforce that position.
Several options exist to divert existing ash
slurry systems away from ash ponds. Utilities
may have the option of keeping an existing
ash slurry system and installing new ash-dry-
ing equipment, or they can convert their ashslurry handling systems to a totally dry sys-
tem. Both options have their pros and cons
but are viable solutions to meet expected
CCR regulations.
Ash Slurry Options. The first option to
maintain an ash slurry system is to imple-
ment dewatering bins in lieu of an ash pond
(see “Reducing Bottom Ash Dewatering
System Maintenance” in the November 2013
issue at powermag.com). With this option,
dewatering bins are used both as a receiver
and separator for the ash slurry mixture.
Typically, a pair of dewatering bins is em-ployed to maintain uninterrupted boiler op-
erations. The first bin will continue to receive
ash slurry until the collected solids (bottom
ash) have reached a predetermined capacity.
At that point, ash slurry flow is directed to
the second bin. With the second bin serving
as the active receiver for the ash slurry, the
first bin can begin to “dewater” its content
of bottom ash. Overflow and drainage water
from the bins are further processed (typical-
ly, with settling and surge tanks) for reuse in
closed-loop slurry systems. Trucks are then
used to remove the damp ash from the dewa-tering bins for off-site disposal.
Dewatering bin technology is a very ma-
ture option, with several manufacturers offer-
ing equipment packages.
The primary advantages to this system are
the reuse of the existing slurry system, short
outage time, and the maturity of the dewater-
ing bin system. This type of system can be
erected independent of power plant opera-
tions and (because existing ash slurry sys-
tems are used) the only interfaces are with
existing slurry piping and recirculated water.
There are some disadvantages with dewa-
tering bins. These systems are not dry, and in
order to dewater the ash slurry, a significant
amount of auxiliary power is required. As is
typical with many wet systems, the dewater-
ing bins are prone to leaks, and screens used
for dewatering are subject to plugging. Be-
cause of the water quality used in this system,
excessive fouling and plugging of piping and
equipment is common. In some cases, plant
operations have required shutdowns due toexcessive buildup of contaminants in the sys-
tem. Boiler efficiency is unaffected, as the
original ash hoppers are retained.
A second ash slurry option diverts the slur-
ry from the ash pond to a remote submerged
scraper conveyor system. Clyde Bergemann
Power Group offers this ash slurry packaged
system known as ASHCON. In this system,
large overflow troughs are used in a similar
manner to dewatering bins, and a submerged
scraper continuously withdraws ash from the
water and conveys it to an ash pile for sec-
ondary use or landfilling.Advantages of the ASHCON system are
similar to those of dewatering bins, but there
are some key benefits. The primary differen-
tiator between the ASHCON system and de-
watering bin option is the elevation at which
the technology operates.
Because the ASHCON system is much
lower to the ground, the existing water sup-
ply pumps and jet pumps under the boiler
should not need to be modified. Dewatering
bins operate at a much higher elevation, thus
requiring additional lift in the form of high-
er-horsepower pumps. As noted, dewateringbins operate in a batch process (usually with
redundant bins), whereas the ASHCON sys-
tem is a continuous process that eliminates
the maintenance and operator involvement
associated with batch processing.
Little to no outage is required, as the
system can be erected without interrupting
power plant operations. The system reuses
existing ash hoppers and has a small footprint
relative to an ash pond.
For facilities that operate multiple boilers,
a single ASHCON system can be designed to
handle the flow from each slurry system, thusreducing the need for redundant systems.
One disadvantage with this system is that
Subtitle C Subtitle D
Effective date Timing will vary from state to state,
as each state must adopt the rule
individually, which can take one to
two years or more.
Six months after final rule is
promulgated for most provisions;
certain provisions have a longer
effective date.
Enforcement State and federal enforcement Enforcement through citizen suits;
states can act as citizens.
Corrective action Monitored by authorized states
and EPA.
Self-implementing.
Financial assurance Yes. Considering subsequent rule using
CERCLA 108 (b) authority.
Permit issuance Federal requirement for permit
issuance by states.
No.
Requirements for storage, in-
cluding containers, tanks, and
containment buildings
Yes. No.
Surface impoundments built
before rule is finalized
Remove solids and meet land
disposal restrictions; retrofit with a
liner within five years of effectivedate. Would effectively phase out
use of existing surface impound-
ments.
Must remove solids and retrofit
with a composite liner or cease
receiving CCRs within five years ofeffective date and close the unit.
Surface impoundments built
after rule is finalized
Must meet land disposal restric-
tions and liner requirements. Would
effectively phase out use of new
surface impoundments.
Must install composite liners. No
land disposal restrictions.
Landfills built before rule is
finalized
No liner requirements, but ground-
water monitoring required.
No liner requirements, but ground-
water monitoring required.
Landfills built after rule is
finalized
Liner requirements and groundwa-
ter monitoring.
Liner requirements and groundwa-
ter monitoring.
Requirements for closure and
post-closure care
Yes; monitored by states and EPA. Yes; self-implementing.
Table 1. Comparison of Subtitle C vs. Subtitle D. Source: EPA

7/22/2019 Power March 2014
http://slidepdf.com/reader/full/power-march-2014 53/82March 2014 |POWER www.powermag.com 49
THE FUTURE OF COAL-FIRED GENERATION
it still operates as a wet system; overflow wa-
ter from the troughs must be treated as pro-
cess wastewater. High power consumption
and no change in boiler efficiency are otherdisadvantages.
Submerged Scraper Conveyor Option.
Similar to the remote submerged scraper con-
veyor system, the submerged scraper system
can be directly integrated into the ash hopper.
The existing ash slurry system is removed and awater trough with a chain conveyor is installed
in its place. The water quenches the hot ash, and
the ash is dewatered as it is slowly dragged up
an incline. Ash is then fed to removable contain-
ers or a transfer conveyor for storage.
The submerged scraper system has advan-
tages similar to those of the remote submerged
scraper system. In addition to these advantag-
es, a submerged scraper system eliminates the
need for clinker grinders, hopper jets and slur-
ry pumps, and hopper gatehouse assemblies.
Auxiliary power is reduced, as the power
needed to drive high-, medium-, and low-pres-
sure pumps associated with slurry systems is
more than that required by the new conveyor
system. This technology is also mature, as the
first submerged scraper systems were installed
nearly 100 years ago.
For plants without extra real estate to im-
plement a remote submerged scraper system,
this system has an even smaller footprint.
Submerged scraper conveyor systems have
also been designed to combine economizerash and pyrite removal into the same system,
thus reducing overall maintenance costs.
The submerged scraper conveyor option also
minimizes water usage and is less complex
than dewatering bins.
Unfortunately, because of the significant
modifications needed to the ash hopper, a
major outage is required for installation. The
system is still not a dry system and requires
wastewater treatment for any water that
overflows the trough. The same combustion
characteristics exist, thus no change in boiler
efficiency will be observed.Dry Conversions. The newest technol-
ogy for replacing an ash slurry system is a
complete dry ash conversion. An example of
a dry system designed to replace ash slurry
systems is Clyde Bergemann Power Group’s
DRYCON (Figure 2).
The DRYCON system replaces the exist-
ing ash slurry system with a dry conveyor
system at the bottom of the boiler. This poses
challenges, as the removal of a water-quench-
ing system requires a new method to cool hot
ash. To combat this cooling problem, these
systems introduce cool ambient air across theconveyor system and into the furnace. This
air cools the conveyor components while
burning the remaining carbon in the ash. The
cooling air increases in temperature before
entering the boiler through the throat.
The addition of warmed ambient air for
cooling ash may appear to be problematic,
as this air volume could affect the combus-
tion characteristics of the boiler. In order
to ensure that no adverse effects on boiler
combustion occur, the amount of ambient air
used for ash cooling is limited to 0.75% of
the combustion air. This method of cooling isquite effective, as it has been shown to reduce
the ash temperature from 750F at the outlet
2. DRYCON cooling conveyor installation in Florida. Courtesy: Clyde Berge-
mann Power Group
3. DRYCON cooling and transfer conveyor to ash storage. Courtesy: Clyde
Bergemann Power Group

7/22/2019 Power March 2014
http://slidepdf.com/reader/full/power-march-2014 54/82 www.powermag.com POWER |March 201450
THE FUTURE OF COAL-FIRED GENERATION
of the boiler to 178F at the end of the DRY-
CON cooling conveyor (Figure 3). The con-
veyor itself does not need to be insulated, as
the outside skin temperature has been shown
to average 87F.
Removal of the water-flooded ash hop-
per will reduce thermal losses from evapo-
ration of water (evaporative cooling), and
the unburned carbon content of the ash isreduced, thus increasing boiler efficiency.
As a result of the reduction in unburned
carbon content of the ash, boiler efficiency
can be increased by 0.02% to 0.07%. Like-
wise, the reduction in unburned carbon in
the ash itself increases its possible sale as a
beneficial by-product.
As it relates to upcoming CCR regula-
tions, the DRYCON system requires no wa-
ter, thus it will comply with either a Subtitle
C or Subtitle D final regulation. However,
installation of this type of system will require
a longer outage (the system can be installed
in a 22-day outage), as significant demolition
and construction activities to the ash hoppers
are required.
Path Forward
Although it may appear to be a case of “the
boy who cried wolf,” the EPA is being pres-
sured more than ever and can be expected to
promulgate CCR regulations by year’s end.
Current timetables for compliance are tight
regardless of which path for CCR regulation
the EPA takes.
In the case of a Subtitle C regulation,
each state will be required to adopt the rule
individually, thus effective dates will vary;
however, in some states effective dates wil l
be as soon as six months after promulga-
tion. In the case of a Subtitle D regula-
tion, most provisions will be effective six
months after promulgation.
With the tight compliance deadlines and
uncertain regulatory provisions, utilities
should be prepared with multiple compli-
ance scenarios. Many of the commercially
available technologies are mature and can
be competitively bid among suppliers. Some
technologies are “cutting edge” and may
offer additional benefits, such as reduced
auxiliary power load and increased boiler ef-
ficiency. However, each facility will need to
evaluate these technologies based upon site-specific equipment configurations, expected
outage times, and capital/operating costs of
the systems. ■
— Brandon Bell, PE ([email protected]) is a project manager with Valdes
Engineering Co. and a POWER contribut- ing editor.
UDI WHO’S WHO AT ELECTRIC POWER PLANTS
Enhanced PDF version now available
The 2014 UDI Who’s Who Directory covers more than 4,500
U.S. and Canadian generating plants. The directory provides:
• Nearly 8,100 plant management and support
contact names, titles, and primary job functions.
• Basic plant operating statistics for more than 1,500
power stations, including:
Generation (MWh)
Availability (%)
Heat rate
Capacity Factor (%)
• Power plant design characteristics
Choose which purchase option that best suits your needs:
• Hardcopy Book
• Enhanced Directory PDF (CD-ROM)
• Mailing List (CD-ROM), Enhanced Directory PDF & Hardcopy Book
For more detailed information and a list of all available data, visit us online at UDIDATA.COM or contact the UDI Editorial team at [email protected].
2014
With the tight compliance deadlines anduncertain regulatory provisions, utilitiesshould be prepared with multiple compli-ance scenarios.

7/22/2019 Power March 2014
http://slidepdf.com/reader/full/power-march-2014 55/82March 2014 |POWER www.powermag.com 51
OPERATIONS & MAINTENANCE
Adaptive Brush Seals Restore AirPreheater PerformanceAir preheater (APH) leakage has several negative consequences, including lost rev-
enue. A better design for APH seals has been shown to have several benefitsover traditional metal strip seals, including a quick payback.
Pavan Ravulaparthy and Ravi Krishnan
The gas sealing systems used on rotary,
regenerative air preheaters (APHs)
have evolved little from the metal strip
configuration used on the first Ljungström
preheaters nearly a century ago. Metallic
strip seals are typically used for radial, axial,
and circumferential seals that are exposedto corrosive gases at relatively high tem-
peratures. Steel seal degradation begins soon
after installation, and the inevitable result is
increased air-to-gas leakage over time, which
translates into increased fuel consumption
and fan power usage. If you’ve ever expe-
rienced “running out of fan,” it’s likely that
APH leakage is part of the problem.
Repeated thermal expansions and contrac-
tions in the large (often 20-meter in diameter
or more) rotors in continuous motion usually
cause large and irregular seal gaps. At operat-
ing temperatures, outer edges of large APHsmay droop or turn down by 3 inches or more
from the cold condition. Steel strips wear
(or warp or break) based on the smallest gap
size, thus leaving larger gaps elsewhere. Leak
rates with properly designed and installed
seals should be less than 10%, although leak-
age rates of 15% to 20% are typical, and rates
greater than 30% are not uncommon when
conventional seals fail. APH leakages typi-
cally occur in air-to-gas and gas-to-air paths
through the APH seals (Figure 1).
Rotary APHs are particularly critical to the
efficient operation of coal-fired power plants,
delivering up to 12% of the heat transfer used
in the steam generation process. A useful
rule of thumb is that for every 20 degree C
decrease in the APH gas outlet temperature,
boiler efficiency increases about 1%, whichtranslates into about $1.5 million in fuel sav-
ings every year for a typical 500-MW plant.
An optimally operating APH also reduces
fan power consumption and thereby net plant
generation capability.
APH leakage also has a detrimental effect
on downstream air pollution control equip-
ment due to increased gas velocity, tempera-
ture, and APH air- and gas-side pressure drop.
For example, the typical flue gas velocity
through a selective catalytic reduction (SCR)
module is around 5 to 6 meters per second.
Increased gas velocity caused by air-to-gas
leakage will decrease the residence time of the
gas and thereby reduce the effectiveness of the
SCR, as well as potentially cause an increase
in ammonia injection rates and slip.Additionally, lower gas residence time in
the flue gas desulfurization system can ad-
versely affect lime or limestone injection rates
and SO2 removal efficiency. For particulate
matter control systems, higher air-to-cloth
face velocities in fabric filters can lead to de-
creased bag life. Pulverizer capacity also can
be negatively affected with lower air volumes
and temperatures due to air-to-gas leakage.
Brush-up Your APH SealsBrush seals are a particularly good choice
for replacing steel strips commonly used forcircumferential, radial, and axial seals on
1. Many leakage paths. The air-to-gas
and gas-to-air leakage paths typically found
in a rotary, regenerative air preheater are
through the circumferential, axial, radial, and
rotor post seals, as shown by the yellow ar-
rows. Courtesy: Sealeze
2. Brush seals installed. Circumferen-
tial (left), radial (bottom), and axial brush seals
(right) can significantly reduce air preheater
leakage rates. Source: Sealeze
3. Comparison test. A worn strip seal
(on the left) compared to a new brush seal
(right). Flexibility of the brush seal allows it to
deflect at the smaller gaps and then rebound
to ensure sealing at wider gaps. The amount
of wear on the steel strip seal is evident.
Source: Sealeze

7/22/2019 Power March 2014
http://slidepdf.com/reader/full/power-march-2014 56/82 www.powermag.com POWER | March 201452
OPERATIONS & MAINTENANCE
Ljungström rotary regenerative APHs (Figure
2). Each brush seal consists of thousands of
filaments that form a high-integrity seal and
provide a high degree of abrasion resistance,
flex life, and bend recovery not possible with
rigid strip seals (Figure 3). Each bristle is in-
dependent and flexible, allowing deflection to
conform to any irregularities and gap varia-
tions and recover to its original position.
The inherent elasticity of the brush design dis-
sipates stress under deformation, reducing drag
and wear. In addition, within the dense barrier
of thousands of filaments is an independent and
flexible membrane designed for deflection that
conforms to any irregularities and gap variations
and recovers to its original position to ensure that
a tight seal is maintained (Figure 4).
Quantifiable Benefits
Air preheater leakage can account for significant
increases in parasitic power draw from the boiler
fans, and this translates into lost net revenue.
Consider a typical 500-MW coal-fired
unit configured with two APHs originally
designed for 10% APH leakage. The unit
has combined 8,595 kW installed fan power
consisting of two primary, two secondary,
and two induced draft fans (excluding the air
quality control system). Referring to the fan
curves, we find that when the APH leakage
increases 10%, the fan power requirements
increase 13% (1.12 MW). Table 1 suggests
the simple payback for installing brush seals
that return the APH leakage to design values
can be a matter of days.
There are other significant benefits to us-
ing brush seals that aren’t included in Table
1. For example, reducing air leakage on a sus-
tained basis results in lower flue gas velocities
and, therefore, reduces the pressure losses in
downstream air quality control systems, and
results in a corresponding reduction in fan
load. For plants with electrostatic precipita-
tors, increased velocities attributable to APH
leakage may result in higher dust emissions
at the stack. For plants with fabric filters, thehigher air-to-cloth ratios due to APH leakage
can affect the frequency of bag cleaning and
possibly shorten bag life.
Field Performance Results
In June 2007, the Hardin Generating Station,
owned by Bicent Power (Hardin, Mont.), con-
tracted with Sealeze, a unit of Jason Inc., to
supply its axial and radial stainless steel brush
seals for both the hot and cold ends of the 119-
MW Unit 1 Ljungström APH. The plant has
an average availability of nearly 97%.
Inspection of the brush seals in 2008showed them to be in very good condition.
Some splaying of the brush was evident on
the cold end due to sootblower blasts of 205C
steam. To prevent direct sootblower impinge-
ment, the brush seals mounted in the path of
sootblower blasts have been redesigned to
incorporate an angled orientation and an in-
1955 Chevy 150/210
Creating Value.Carver Pump Company2415 Park AvenueMuscatine, IA 52761563.263.3410Fax: 563.262.0510www.carverpump.com
Low NPSHa on your vacuum receiver got
you down? Fail to resume pumping as
suction levels resume? You need Carver
Pump 855 Series muscle!
Carver 855 Series are designed for use onvacuum receivers operating with up to 26” Hgvacuum. Flange mounted directly to the vacuumreceiver tank eliminates suction piping/NPSHproblems. Whether operating at a trickle or full flow,specially designed impellers allow pumping to resume evenafter periods of interrupted flow.
Capacities range to 600 GPM depending on discharge headand speed of operation. Available in 6 sizes ranging from1”- 4”, standard materials of construction include All Iron,
CD4MCu and Rubber Lined. The 855Series features an overhead v-belt drivearrangement as standard, with options foreither close coupled or frame mounteddrives. Packing is standard in the stuffing
box with mechanical seals as an option,and don’t forget to ask about ourSwing-Out design. Let us buildthe muscle you need!
OVERHEAD
DRIVE
MOUNTS
DIRECTLY
TO TANK
FLANGE
Carver Series 855
855 Series
TYPICAL
RECEIVER
TANK
V-BELT
DRIVEASSEMBLY
CIRCLE 21 ON READER SERVICE CARD
4. Membrane seal. The adaptive brush
design is built around a malleable alloy foil
membrane nestled within brush filaments
to provide a 70% to 80% reduction in leak-
age without sacrificing overall seal flexibility.
Source: Sealeze

7/22/2019 Power March 2014
http://slidepdf.com/reader/full/power-march-2014 57/82 March 2014 |POWER www.powermag.com 53
OPERATIONS & MAINTENANCE
tegral protective shield.
Since that design update, the brush seals
continue to outperform the original steel stripseals more than five years after installation
and are expected to continue to perform to
specification through at least four outage
cycles. During the past five years, the plant
has been able to postpone two planned APH
outages—another significant cost savings.
Two other brush seal installations have ex-
perienced similar results. Radial and circum-
ferential brush seals were installed in 2010
on two 8-m-diameter horizontal APHs at a
300-MW coal-fired unit located in the U.S.
(the plant wishes to remain anonymous). The
plant reports leakage rates remain well un-
der 10%. In fact, air leakage tests confirmed
leakage rates of 5% and 7% on APH-A and
APH-B, respectively.
In 2010, radial and axial brush seals were
installed on a 10-m-diameter vertical Ljung-
ström APH at a 750-MW coal-fired plant
located in the U.S. (this plant also wishes to
remain anonymous). Both the radial and axial
brush seals remain in excellent condition af-
ter more than 2.3 million impacts to the sec-
tor plates during 11,760 hours of service over
490 days (Figure 5). The brush profiles remain
essentially in the as-installed condition. Seal
integrity remains intact as the seal conforms to
gap size variations and surface irregularities.
APH seal degradation is difficult to iden-tify and is often overlooked as responsible for
loss of fan margin, loss in boiler efficiency,
and consequential problems with downstream
air quality control equipment, particularly
the SCR. Chances are your plant is currently
troubled by poor APH performance caused by
increased seal clearances in the hot condition,
seal erosion, inappropriate seal materials, or
improper seal settings. Installing stainless steel
brush seals is one of the few low-risk, high-
reward upgrades that can be easily completed
during a typical planned maintenance outage.
Better yet, the cost of the stainless steel brush
seal retrofit will likely be repaid by improvedboiler efficiency quicker than the duration of
the outage. ■
— Pavan Ravulaparthy ([email protected]) is business development man-
ager for Sealeze. Ravi Krishnan (ravi@ krishnaninc.com) is managing director of
Krishnan & Associates.
Economic factors Savings/cost
Fuel savings $1.5 million/year
Auxiliary power savings $0.52 mill ion/year
Total savings $2 million/year
Installed cost of brush APH
seals
$100,000
Payback ~18 days
Table 1. Payback analysis for atypical 500-MW coal-fired unit. The
savings calculations are based on an 85% ca-
pacity factor, 10,550 kJ/kWh heat rate, and
average coal heat content of 5,500 kcal/kg at
$80/ton. The incremental electricity sale price
is assumed as $30/MWh off peak (75% of the
operating hours) and $150/MWh on peak (25%
of the operating hours). Source: Sealeze
© 2 0 1 4 B r a n d S e r v i c e s ,
L L C
A l l R i g h t s R e s e r v e d .
Providing you access to
the safest, smartest and
most efficient specialty
services.
For more information contact us at:
281.404.9397 or [email protected]
www.beis.com
SCAFFOLDING | COATINGS | INSULATION | REFRACTORY | FIREPROOFING | CUI MANAGEMENT
HOT TAPPING | CATHODIC PROTEC TION | FORMING AND SHORING | FIELD MACHINING
Creating Client VALUEis our Business
Brand Energy & Infrastructure Services is a leading provider of specialtyservices to the power industry. Our unique multi-service approachdelivers significant savings to our clients on their maintenance, outagesand capital projects by reducing manpower requirements, improvingcommunication through a single point of contact, and ultimately,delivering enhanced productivity.
CIRCLE 22 ON READER SERVICE CARD
5. Seal inspections. The radial (top)
and axial (bottom) brush seals remain in as-
installed condition after 11,760 hours of opera-
tion. Source: Sealeze

7/22/2019 Power March 2014
http://slidepdf.com/reader/full/power-march-2014 58/82 www.powermag.com POWER | March 201454
OPERATIONS & MAINTENANCE
Modern Polymeric Materials OfferOptions for Equipment RepairContinual development of polymer technology has enabled the creation of specialized
coatings, which can offer excellent resistance to erosion, corrosion, and cavita-tion in hydroelectric equipment and pumps at any generating plant. Polymericmaterials can also increase efficiency and extend runtimes.
Kyle Flanagan
Currently accounting for over 16% of
global energy production, and with an
expected growth rate of 3% per year for
the next quarter century, hydroelectric power
generation continues to grow as the front run-
ner in renewable energy, even though growthin the U.S. is expected to be minimal.
In recent years, maintenance of existing
hydroelectric assets has become increasingly
important to ensure a consistent supply of
power. Low water levels, due to factors such
as drought and higher local demand for water
(see “Water Issues Challenge Power Genera-
tors” in the July 2013 issue of POWER, online
at powermag.com), have resulted in decreased
production in high-profile hydroelectric sta-
tions, such as the Hoover Dam. There the
problem has become so severe that the result-
ing drop in pressure difference has caused in-creased cavitation damage to turbine runners
and a 20% decrease in production levels.
Ensuring turbine efficiency and up-time
are at their maximum is key to achieving
optimum production. However, as with any
fluid flow equipment, the effects of erosion
and corrosion will detract from this. If left
unchecked, erosion—and specifically, cavi-
tation damage—rates increase exponentially
to cause severe metal loss. Unbalancing and
vibration of turbine runners can result, re-
quiring lengthy shutdowns for repair work to
shafts and bearings. Loss of surface smooth-ness also results in increased turbulent flow
and lower production rates.
Traditional Repair TechniquesThe recommended procedure for determin-
ing inspection and repair frequency for hy-
droelectric runners and turbines, including
stay vanes and wicket gates, is to inspect the
equipment at set intervals following installa-
tion to ascertain the rate of damage, including
erosion, corrosion, and cavitation. Once the
rate of damage is known, procedures are put
in place to repair the damage once the depthof metal loss reaches predetermined levels.
Once a maintenance routine is put in place,
repairs are carried out in accordance with the
recommended procedure. The procedure is of-
ten to replace the lost metal using conventional
metal replacement techniques. Large areas of
pitting are repaired by welding plates or sheets
of new metal in place as an erosion wear layer,whereas areas of lighter damage are repaired
by weld overlay, which is then ground back
to the correct tolerance. The procedure is re-
peated at the next service interval, as dictated
by the rate of in-service deterioration.
Limitations of Traditional RepairsThe traditional repair procedure is not with-
out problems though. The most basic flaw is
the replacement of the material that is being
lost with more of the same material—a like-
for-like repair. Reintroducing the same base
material simply allows the problems to reoc-cur and does not identify the root cause of
the issue and work to limit its effects. Con-
tinued metal loss will result in continued
shutdowns. As previously discussed, metal
loss will in some cases result in vibration due
to imbalance, and this can cause damage to
bearings and shafts.
One of the major drawbacks of using hotwork to replace lost metal is the procedure in-
volved in implementing the repair. According
to the Facilities Instructions, Standards, &
Techniques Turbine Repair manual, “Exten-
sive weld repairs can result in runner blade
distortion, acceleration of further cavitation
damage, and possible reduction of turbine
efficiency. Also, extensive repair can cause
residual stressing in the runner resulting in
structural cracking at areas of high stress.”
Coupled with this is the complexity of
carrying out hot work repairs. Extensive rig-
ging and supports are recommended in or-der to avoid distortion of finely honed parts.
Hot work is recommended to be carried out
1. Completed replacement of leading edges damaged by cavitation. Courtesy: Belzona Polymerics Ltd.

7/22/2019 Power March 2014
http://slidepdf.com/reader/full/power-march-2014 59/82March 2014 |POWER www.powermag.com 55
OPERATIONS & MAINTENANCE
gradually, heating up the entire part first pri-
or to application of the repair technique, and
lengthy cooldown times are required after
application of the repair to avoid excessive
heat distortion. Care is also required when
selecting the repair metal (plates or welding
rods), as different materials can introduce lo-cal galvanic corrosion, initiating even more
repair requirements.
A Better Alternative: CoatingsModern polymeric repair systems offer an
excellent alternative to traditional repair
materials. These materials are supplied in
either paste grade filler type repair compos-
ites used to infill damaged areas and restore
profiles (Figure 1) or as coating grade prod-
ucts used to provide long-term protection
to equipment against specific damage. Ad-
vanced polymeric coatings completely halt
corrosion by isolating the metals and clos-
ing the corrosion cell.
Polymeric coatings have been used for
more than 60 years in many different appli-
cations, such as on hydroelectric generation
equipment, offshore and onshore oil and gassystems, pumps, and sewage treatment equip-
ment, and they have a reliable track record in
these environments. By utilizing solvent-free
epoxy technology, these products are safe to
use, even in enclosed spaces.Specialized filler materials, such as ceram-
ics and aluminium oxide, allow epoxy coat-
ings to achieve good wear resistance. Epoxy
coatings combine with the metallic substrate
to provide a composite component, which of-
fers ongoing maintenance advantages.
Application AdvantagesPrior to application, thorough surface prepa-
ration is required in the area to be repaired.
This is commonly achieved using localized
grit blasting to clean and roughen the metal,
which allows the polymer to form an intimatebond with the base metal.
Polymeric repair and coating composites,
such as Belzona, are supplied as two-part
products. The components are mixed prior
to application using spatulas and bowls
or with paddle mixers for larger projects.
This mixing initiates the chemical reaction,
which enables the product to solidify to its
final form.
Application is commonly carried out using
trowels for paste grade rebuilding composites
and by brush for coating grade epoxies (Fig-
ures 2 and 3). Many products can also be ap-plied by airless spray, allowing for rapid repair
times over large areas. The product is then al-
lowed to cure for a period of time before the
equipment can be returned to service.
Because modern epoxy polymer materi-
als are cold-curing, they eliminate the re-
quirement for hot work that is needed for
traditional repair techniques. This avoids
problems, such as:
■ Risk of equipment distortion.
■ Requirement for specialist rigging and jigs.
■ Lengthy repair times required to allow forcooling of welds.
■ Grinding and finishing of weld overlay.
2. Apply. Applying Belzona 1341 (Supermetalglide) to a runner reduces surface friction, result-
ing in higher operating efficiency in fluid flow equipment, such as turbines and pumps. On the
bottom of this turbine, the paste grade material used to infill areas of erosion damage is visible
before application of the coating. Courtesy: Belzona Polymerics Ltd.
3. Ready to run. After coating application,
this runner is installed and ready to return to
service. Courtesy: Belzona Polymerics Ltd.
4. No comparison. A Leeds University
surface inspection study found that polished
stainless steel was far less smooth than Bel-
zona 1341 (Supermetalglide). Courtesy: Bel-
zona Polymerics Ltd.
Polished stainless steel (Ra 1.19 um)
Belzona polymeric efficiency coating (Ra 0.078 um)
E f f i c i e n c y ( % )
H
e a d ( m )
Flow (m3 /hr)
Coated Uncoated
5. Increased efficiency. These perfor-
mance curve results were recorded by the UK
National Engineering Laboratory. Courtesy:
Belzona Polymerics Ltd.
30
25
90
80
70
60
0 500 1000

7/22/2019 Power March 2014
http://slidepdf.com/reader/full/power-march-2014 60/82 www.powermag.com POWER | March 201456
OPERATIONS & MAINTENANCE
■ Health and safety hazards associated with
hot work.
■ Need for specialist welding rods and ex-
pensive replacement metal.
■ Introduction of heat-affected zones due to
welding.
■ Lengthy shutdown times.
Use of epoxy composites as a protective
coating for the base metal also allows for much
easier wear identification in the future, as differ-
ent-colored layers of polymeric coatings allow
wear areas to be quickly identified. Repairing
existing coatings is a straightforward process;
an area can be prepared using powered hand
tools before a patch repair is applied.
Advanced application methods, such as
airless spray equipment, have allowed even
faster repair times. Turbine casings, draft
tubes, and outlets are all subject to the same
damage as the turbine runner and can be re-
paired using the same epoxy polymer prod-ucts. The newest generation of epoxy coatings
incorporate advanced polymer fillers, which
provide improved erosion resistance while
allowing application by airless spray, which
is ideal for larger areas.
Several polymer coatings have been spe-
cially developed by Belzona for applications
in pumping and hydroelectric generation,
which specifically aim to improve efficiency
and reduce cavitation.
Efficiency Enhancement
Increasing the efficiency of existing equip-ment allows asset owners to get the most
from their equipment. One of the most effec-
tive methods of improving asset performance
is by applying coatings that will reduce re-
sistance to flow caused by friction with the
substrate. Belzona 1341 (Supermetalglide)
is an epoxy coating with a low electronic af-
finity with water molecules (making it a hy-
drophobic material). Once applied, it forms
an extremely smooth surface, which reduces
the boundary layer of the pumped fluid and
reduces internal turbulence in the flow, thus
increasing hydraulic efficiency.A Leeds University surface inspection
study found that Belzona 1341 (Supermetal-
glide) was 15 times smoother than polished
stainless steel (Figure 4). Incorporation of
ceramic fillers also allows the coating to
resist erosion and protect the equipment for
long service periods.
Testing conducted in the United King-
dom by the National Engineering Laboratory
showed that applying Belzona 1341 (Super-
metalglide) to a new pump increased peak
efficiency by up to 6% (Figure 5). At this
peak efficiency point, the reduction in power
consumption has been measured at 5.1 kW at
duty point. Assuming a 5,000-hour operating
cycle per year, power savings would amount
to 25,500 kWh per year.
Similar efficiency gains can be expected in
hydroelectric equipment. On existing, in-ser-
vice equipment, the increase will commonly
be even higher. Equipment that has suffered
from heavy deterioration and loss of effi-
ciency can be returned to better than originalperformance. On heavily deteriorated pumps
repaired by the City of Fayetteville, Ark., an
improvement of 17% was recorded compared
to the deteriorated condition performance.
Resisting CavitationOccurring in areas of pressure change across
fluid flow equipment, cavitation is one of the
most damaging and difficult forms of ero-
sion encountered in hydroelectric equipment.
Rapid implosion of vapor bubbles close to the
metallic substrate results in powerful micro-
jets that impact and “chip” the base material,resulting in pocketed erosion (Figure 6).
Use of hard materials and specialty alloys
is common practice in areas of cavitation, but
these measures are often very expensive and
can also fail under constant attack. In order to
resist the effects of cavitation, Belzona spe-
cially developed Belzona 2141 ACR Elasto-
mer. This is a two-part elastomeric polymer
applied using a brush as a coating specifi-
cally to areas subject to cavitation damage.
Belzona 2141 ACR Elastomer followed
a lengthy development and research pro-
cess to determine the key conditions pres-ent in cavitation areas on fluid-handling
equipment. Exceptional bond strength, re-
sistance to temperature, and the ability to
absorb the extreme impact pressures from
micro-jetting were all requirements ful-
filled by Belzona’s elastomeric polymer
material (Figures 7, 8, and 9).
Extensive independent testing, in accor-
dance with American Society for Testing
and Materials (ASTM) standards, yielded
exceptional results. A Voith–Siemens report
showed the material resisted damage after
500 hours of intensive cavitation testing.Penn State University evaluated the product
at 130 knots of intensive cavitation testing
and reported resistance without damage after
20 hours. Samsung reported that ASTM G32
results for Belzona 2141 were significantly
higher than for 316L stainless steel.
Field applications—to turbines, wicket
gates, stay vanes, and turbine shafts—that are
still providing excellent performance after a
decade of service are testament to the mate-
rial’s longevity. ■
— Kyle Flanagan ([email protected]) is a technical services engineer for
Belzona Polymerics Ltd.
7. Original condition. This photo
shows the initial condition of a Francis turbine
runner following grit blasting. The pitting dam-
age is due to cavitation. Courtesy: Belzona
Polymerics Ltd.
8. Repaired. This turbine runner is ready for
return to service with Belzona 2141 ACR Elas-
tomer applied. Previous alternatives, such as
replacement metal and hard coatings, had failed
on this part. Courtesy: Belzona Polymerics Ltd.
9. Still holding strong. After 36months of uninterrupted service, no damage
was found on the applied Belzona 2141 ACR
Elastomer, and the turbine was returned to
service. Courtesy: Belzona Polymerics Ltd.
6. Heavy loss. Cavitation damage has re-
sulted in severe metal loss on these impeller
vanes. Courtesy: Belzona Polymerics Ltd.

7/22/2019 Power March 2014
http://slidepdf.com/reader/full/power-march-2014 61/82
CELEBRATING OUR FIRST FIFTY
YEARS OF IDEAS, GROWTH AND
SUCCESS AS WE LOOK TOWARD THE
NEXT FIFTY YEARS OF INNOVATION
AND ENERGY SOLUTIONS.
The Transmission & Distribution
Conference & Exposition brings energy
companies and professionals from around
the globe together to share the newest
and most innovative products, ideas and
technologies.
DESCRIBED BY THE NEW YORK TIMES ASONE OF THE TOP THREE BUSINESS GURUS
One of the world’s leading futurists on global
trends and innovation, Daniel Burrus, will
discuss what technologies will shape the future
of the electric utility industry.
OPENING SESSION: FUTURIST DANIEL BURRUS
REGISTER TODAY
AT IEEET-D.ORG
REGISTER BEFORE 3/14/14
TO TAKE ADVANTAGE OF
THE EARLY BIRD DISCOUNT
FOLLOW US
TO LEARN MORE
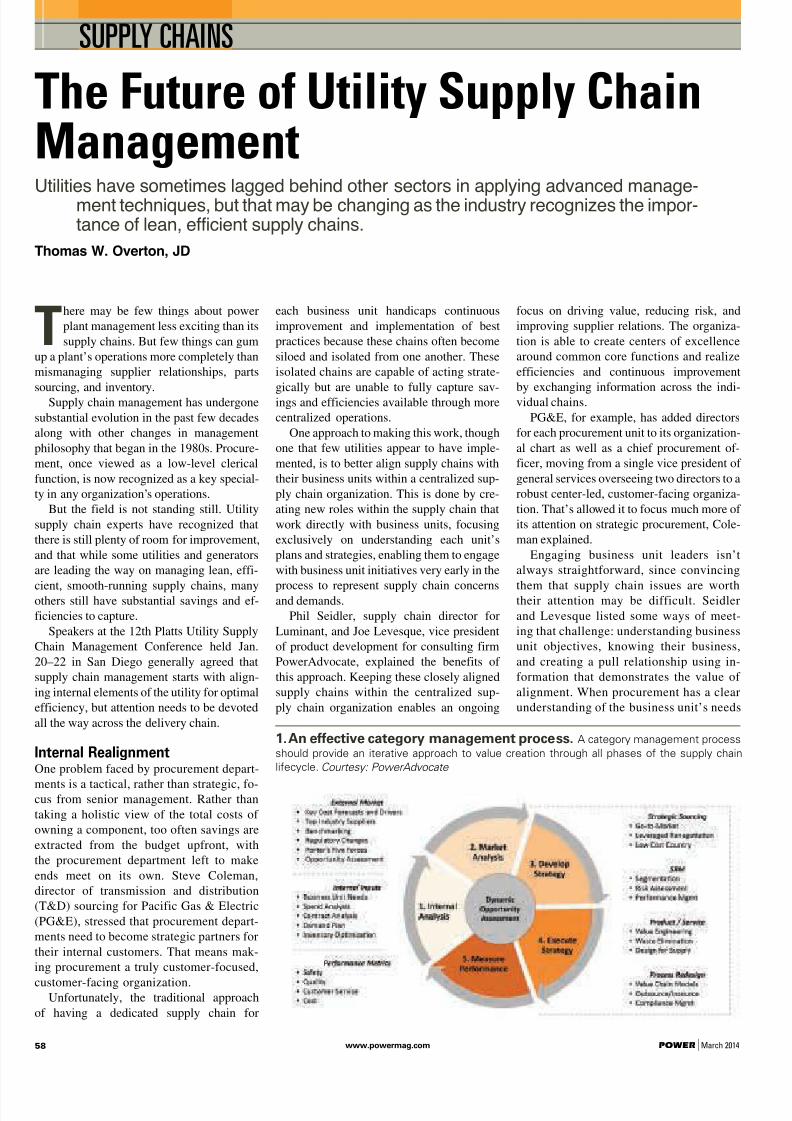
7/22/2019 Power March 2014
http://slidepdf.com/reader/full/power-march-2014 62/82 www.powermag.com POWER | March 201458
SUPPLY CHAINS
The Future of Utility Supply ChainManagementUtilities have sometimes lagged behind other sectors in applying advanced manage-
ment techniques, but that may be changing as the industry recognizes the impor-tance of lean, efficient supply chains.
Thomas W. Overton, JD
There may be few things about power
plant management less exciting than its
supply chains. But few things can gum
up a plant’s operations more completely than
mismanaging supplier relationships, parts
sourcing, and inventory.Supply chain management has undergone
substantial evolution in the past few decades
along with other changes in management
philosophy that began in the 1980s. Procure-
ment, once viewed as a low-level clerical
function, is now recognized as a key special-
ty in any organization’s operations.
But the field is not standing still. Utility
supply chain experts have recognized that
there is still plenty of room for improvement,
and that while some utilities and generators
are leading the way on managing lean, effi-
cient, smooth-running supply chains, manyothers still have substantial savings and ef-
ficiencies to capture.
Speakers at the 12th Platts Utility Supply
Chain Management Conference held Jan.
20–22 in San Diego generally agreed that
supply chain management starts with align-
ing internal elements of the utility for optimal
efficiency, but attention needs to be devoted
all the way across the delivery chain.
Internal RealignmentOne problem faced by procurement depart-
ments is a tactical, rather than strategic, fo-cus from senior management. Rather than
taking a holistic view of the total costs of
owning a component, too often savings are
extracted from the budget upfront, with
the procurement department left to make
ends meet on its own. Steve Coleman,
director of transmission and distribution
(T&D) sourcing for Pacific Gas & Electric
(PG&E), stressed that procurement depart-
ments need to become strategic partners for
their internal customers. That means mak-
ing procurement a truly customer-focused,
customer-facing organization.Unfortunately, the traditional approach
of having a dedicated supply chain for
each business unit handicaps continuous
improvement and implementation of best
practices because these chains often become
siloed and isolated from one another. These
isolated chains are capable of acting strate-
gically but are unable to fully capture sav-ings and efficiencies available through more
centralized operations.
One approach to making this work, though
one that few utilities appear to have imple-
mented, is to better align supply chains with
their business units within a centralized sup-
ply chain organization. This is done by cre-
ating new roles within the supply chain that
work directly with business units, focusing
exclusively on understanding each unit’s
plans and strategies, enabling them to engage
with business unit initiatives very early in the
process to represent supply chain concernsand demands.
Phil Seidler, supply chain director for
Luminant, and Joe Levesque, vice president
of product development for consulting firm
PowerAdvocate, explained the benefits of
this approach. Keeping these closely aligned
supply chains within the centralized sup-
ply chain organization enables an ongoing
focus on driving value, reducing risk, and
improving supplier relations. The organiza-
tion is able to create centers of excellence
around common core functions and realize
efficiencies and continuous improvement
by exchanging information across the indi-vidual chains.
PG&E, for example, has added directors
for each procurement unit to its organization-
al chart as well as a chief procurement of-
ficer, moving from a single vice president of
general services overseeing two directors to a
robust center-led, customer-facing organiza-
tion. That’s allowed it to focus much more of
its attention on strategic procurement, Cole-
man explained.
Engaging business unit leaders isn’t
always straightforward, since convincing
them that supply chain issues are worththeir attention may be difficult. Seidler
and Levesque listed some ways of meet-
ing that challenge: understanding business
unit objectives, knowing their business,
and creating a pull relationship using in-
formation that demonstrates the value of
alignment. When procurement has a clear
understanding of the business unit’s needs
1. An effective category management process. A category management process
should provide an iterative approach to value creation through all phases of the supply chain
lifecycle. Courtesy: PowerAdvocate

7/22/2019 Power March 2014
http://slidepdf.com/reader/full/power-march-2014 63/82March 2014 |POWER www.powermag.com 59
SUPPLY CHAINS
and operations, it can better establish its
credibility and demonstrate ways to im-
prove performance.
Category ManagementThe concept of category management, in
which procurement for classes of products is
managed as an ongoing business in collabo-
ration with suppliers, has been around in re-
tail since the 1980s but is still making its way
into utility procurement.
As Seidler and Levesque explained, cat-
egory management is an evolution of stra-
tegic sourcing but is cyclical rather than
linear (Figure 1). It is an ongoing process
of continually tracking, managing, and
improving the sourcing of material rather
than an episodic, contract-focused process.
It requires both alignment with business
units and close collaboration with suppli-
ers. This allows procurement to better en-
gage business unit leaders to build lastingexpertise in the supply chain, as well as
respond proactively and swiftly to changes
in the market.
Obviously, moving toward category man-
agement is not an overnight process. Lumi-
nant, Seidler explained, began the shift with
its privatization in 2004 but only began get-
ting a robust category management system
into place in the 2010s. Getting the supply
chains aligned with business units took sev-
eral years, during which better strategies,
skills, and metrics had to be developed.
Seidler and Levesque offered some other
tips for making category management work
most effectively:
■ Start with categories that will quickly
demonstrate high impact to business units
to gain support early on.
■ Set regular cross-functional business re-
views with leadership to review process,
spend, and other performance metrics.
■ Structure roles such that responsibilities
for strategic planning and day-to-day ex-
ecution fall to different people.
■ Embed category management inside tech-
nology tools to ensure that data, and the
process, is sustained in the event of per-
sonnel turnover.
Supplier IntegrationOf course, making all this work isn’t sim-
ply an internal process—suppliers have to
be deeply involved as well. That’s why in-
tegrating suppliers into supply chain man-
agement is an increasing trend. While it’s
not yet common, with the utilities furthest
along in this process the supplier, procure-
ment, and business unit function as a seam-
less supply chain, simultaneously sharing
information up and down the chain. This
level of cooperation and communication al-
lows capturing efficiencies and cost savings
that are not visible otherwise.
Stocking and inventory decisions are
made collectively, depending on what op-
tions are most efficient and advantageous.
Materials may be stocked with the suppli-
er or the utility warehouse; management
of many materials—particularly high-turn
items needed regularly and/or rapidly—
may be entirely in the hands of the suppli-
er, who may assume direct responsibility
for fulfillment goals with the business
unit. In such a system, the supplier’s in-
ventory essentially becomes the utility’s
“virtual inventory.” If implemented effec-
tively, the result can be lower labor costs,better resource availability, more efficient
logistics, lower transactional costs, and
better risk management.
Rodney Long and Ron Jangaon of Duke
Energy explained how the utility giant has
moved toward integrated supply with WES-
CO Distribution, which helps manage the
SYSTEMS ENGINEERING
Reference Project: RIGA TPP-2, 2nd Unit, Latvia
Water & Steam Sampling & Analysis Systems
All our systems are designed, manufactured and tested in Switzerland
www.swansystems.ch · SWAN SYSTEME AG · CH-8340 Hinwil · [email protected] · Phone + 41 44 943 62 00
CIRCLE 23 ON READER SERVICE CARD

7/22/2019 Power March 2014
http://slidepdf.com/reader/full/power-march-2014 64/82 www.powermag.com POWER | March 201460
SUPPLY CHAINS
program. Integrated supply programs gener-
ally comprise a number of components:
■ Procurement and fulfillment are linked.
■ Supplier has a fully transparent compensa-
tion model.
■ Supplier provides on-site labor to augment
purchasing and storeroom functions.
■ Some on-site inventory is supplier owned.
■ Service level metrics, including risk and
reward components.
■ Supplier also handles some third-party
transactions.
One benefit of such deep integration,
they explained, is better visibility of the to-
tal costs of material. The focus moves away
from the contract price and takes in all the
costs involved in sourcing, stocking, and us-
ing material.
Of course, not every supplier is capable or
willing to take on these added responsibili-ties—it needs to be willing to partner with
the utility for the long term. That means, said
Gary D. Benz, supply chain vice president
for FirstEnergy, keeping lines of communica-
tion open and making clear to suppliers that
procurement is not a “one-off” process—the
utility needs to make suppliers understand
they’re building a relationship. But that flows
both ways, he said. If a supplier is investing
a lot of resources in that relationship, “They
deserve to understand what our business
plans are,” he said.
This approach takes on added complexitywhen dealing with overseas suppliers. Fre-
quent communication is key, and organiza-
tions must be proactive in anticipating and
dealing with potential language and cultural
barriers. Having a dedicated procurement
team that regularly travels abroad to meet
with suppliers and review their operations
can be highly beneficial, especially early in
the relationship.
Michael Devoney, president and gen-
eral manager of electrical and industrial
distributor Turtle & Hughes Integrated
Supply, related an example of a client whoran into difficulty managing supplier qual-
ity in China, where an increasing percent-
age of original equipment manufacturers
(OEMs) build their turbines and boilers.
Unfortunately, he told POWER, “there are
limited options to manage an approved
vendor list (or to conduct supplier qual-
ity audits) in China.” This creates a mar-
ket imbalance for the large OEMs, but if
this need could be addressed, “more gen-
erators could buy ‘direct’ from the actual
manufacturers,” he said.
Risk ManagementSuch a close partnership naturally brings
with it some significant risks. How to
manage supplier risk, whether in tradi-
tional concerns such as safety, quality, and
performance, or more recent issues such
as cybersecurity, becomes an increasing
concern.
Speakers at the Platts conference all men-
tioned data security as a concern. When sup-
pliers are deeply integrated into a supply
chain, simply having a good internal cyberse-
curity policy in place isn’t enough. Supplier
polices also need to be vetted and upgraded
as necessary.
Scott Landrieu of PSEG discussed how
natural disasters such as Superstorm Sandy
and the Tohoku Earthquake (which led to the
disaster at the Fukushima Daiichi nuclear
plant) have highlighted the need for having
robust recovery plans in place in the event of
severe disruptions of a supply chain. Utili-
ties need to know what to do in the event that
one or more major suppliers are knocked outof business or significant inventory stock is
destroyed. Critical components should be
sourced from multiple suppliers, and over-
seas supply chains should source from mul-
tiple countries to reduce the risk of potential
disruptions. Here again, effective supplier
integration can prove its worth, as entities
across the chain can work together to miti-
gate risk.
Both speakers and attendees mentioned
quality control as a key supply chain risk.
Developing parallel supply chains for criti-
cal components, while potentially increasingcosts, can greatly reduce the risk of nonper-
formance. This is especially true when sourc-
ing from overseas.
Another source of risk is fuel price fluc-
tuations. The fall in natural gas prices has
increased pressure on other fuels. “Making
peak operating periods has become more
critical to overall profitability,” Chris Price
of Turtle & Hughes told POWER. Likewise,
pressure from renewable energy mandates
complicates risk management. “It’s difficult
to keep up on the technology and find the
right sourcing partners,” he said. “Also, thefocus on these initiatives changes with the
regulatory landscape.”
Close alignment between all elements in
a supply chain is important in reducing risk.
This enables better visibility and identifica-
tion of potential “choke points,” as well as
communication of impending problems.
Inventory OptimizationThough “just-in-time” sourcing has be-
come the standard in many industries, the
power sector has lagged well behind this
trend, in part because—especially in regu-lated markets—a utility’s focus is keeping
the lights on and being able to respond
rapidly to emergencies. While a bloated
inventory full of stranded assets (spare
components that the utility no longer has
a need for) may not look good on the bal-
ance sheet, it rarely interferes with those
priorities. Even in deregulated markets,
poorly managed inventories don’t neces-
sarily prevent a plant from competing ef-
fectively. But over the long term, inventory
problems can represent significant drains
on revenue.
Utilities and generators also have chal-
lenges not faced by other sectors. Criti-
cal replacement parts, some of which can
be extremely expensive, must be kept on
hand in case of emergencies even though
they may never be needed. Utilities that
operate in more than one state may be re-
quired to maintain duplicate inventories
in order to meet requirements of separate
state oversight. The problem can be com-
pounded if the utility has merged withor been acquired by another company.
Worse, the utility often may not have a
clear picture of how much duplication
exists or how much money is tied up in
stranded assets.
Implementing advanced supply chain
management processes can help address
these problems. Just as category manage-
ment, improved data, and better communi-
cation can streamline procurement, better
information, segmentation, and tracking of
inventory can assist a utility in identifying
and clearing unneeded stores. Some utilitieshave made inventory management a sepa-
rate director-level responsibility apart from
other supply chain issues. Such a role is
responsible for maintaining visibility and
transparency into companywide inventory
to be sure the utility has a clear view at all
times into the location, quantity, and appli-
cation of all stores.
Pat Pope, president and CEO of the
Nebraska Public Power District (NPPD),
reviewed his company’s experiences in chal-
lenging these problems. NPPD was experi-
encing annual inventory growth greater than10%, about $13 million every year—despite
previous efforts at bringing stocks under
control. New inventory was coming in faster
than procurement staff could clear out un-
needed components. Yet, the situation was
not viewed as a problem by many managers.
The solution was not another ad-hoc reduc-
tion effort but engaging senior management
in changing the way procurement operated
so that supply chain personnel had the tools
and authority to better match inventory to
business unit needs—among these, inven-
tory optimization software from Oniqua.The result was to completely reverse the un-
necessary growth in NPPD’s inventory and

7/22/2019 Power March 2014
http://slidepdf.com/reader/full/power-march-2014 65/82March 2014 |POWER www.powermag.com 61
SUPPLY CHAINS
actually reduce inventory by $8.2 million with no effect on reli-
ability.
Steve Sotwick, Oniqua’s vice president of business development
for North America, explained some ways in which inventory opti-
mization can aid in supply chain management. Having a clear view
of each business unit’s needs allows procurement staff to better
identify critical inventory, forecast the needs for it, and spotlight
inventory that is no longer needed. Creating separate inventory
segments as part of category management allows category-specific
inventory to be matched to that business unit’s strategies instead of
applying across-the-board policies that are likely not appropriate
for all stock.
Utilities or generators with multiple like-kind units will often
centralize storage of critical spares that may be shared among
their own units. This works well because the carry costs of the
inventory can be spread among multiple plants. Sometimes this
“part sharing” arrangement will occur between companies, with
the arrangement often brokered through the manufacturer, though
this is fairly rare. While this can reduce costs, a challenge arises
if two plants require the same part. Careful planning and com-
munication is also necessary to make clear who takes ownership
of used parts. Because most major equipment can endure only somany refurbish cycles, plans must be in place for how that cost
is shared.
Improved MetricsFinally, all this fine-grained management is difficult to impossible to
achieve effectively without accurate metrics to track how new strate-
gies are working and without robust processes for using metric per-
formance to drive improvements.
Most utilities have well-defined fulfillment metrics for their supply
chains in place. Less common, however, is measuring flexibility and
responsiveness, even though these metrics are critical for capturing effi-
ciencies. It is also common for unplanned or rush orders to be excluded
from metrics, even though these are the events most likely to result insupply chain disruption and extra costs.
Several speakers noted that advanced organizations are most likely
to measure key metrics across the entire supply chain. More impor-
tantly, metrics need to be in place to measure business unit expecta-
tions, not just traditional procurement performance. Optimally, this
takes the form of a service-level agreement (SLA) between procure-
ment and the business unit. The SLA flows in both directions, spelling
out not just expectations for order fulfillment but also business unit
performance in accurate forecasts and communication of needs. The
SLA also has to be a dynamic—rather than static—tool that is con-
stantly being evaluated and updated to support continuous improve-
ment of the supply chain.
Defining metrics is not always straightforward. Some, like orderfulfillment, lend themselves easily to measurement; others, like em-
ployee skills or effective communication across the supply chain, are
harder to measure accurately. Useful metrics need to flow from strate-
gic goals while being tied into overall corporate objectives.
The Big PictureIt’s important to remember that not all supply chain management innova-
tions necessarily support one another. Increased redundancy to reduce the
risk of disruption, for example, can increase complexity of communica-
tion and performance metrics. An integrated supplier network has more
parts to monitor, increasing the risk of losing focus on the whole. Success-
ful companies will maintain a holistic approach in managing their supply
chains, making visibility, flexibility, and collaboration key priorities. ■— Thomas W. Overton, JD is a POWER associate editor.
PIPING SYSTEMSFOR POWER PLANTS––––––
Engineering, pre-fabrication, constructionand commissioning of piping systems areeectively and e ciently performed allover the world. Within two own works inGermany including clean hall and induc-tion bending machines, piping systems areconstructed and prefabricated to highest
quality standards and e cient weldingprocesses such as TIG, narrow-gap, SAW.
Bilnger Piping Technologies is interna-tionally active and present in Europe withits subsidiary and sister companies, butalso within the CIS, GCC, RSA and Asia.
––––––
BILFINGER PIPING TECHNOLOGIES GMBH
xxx/qjqjoh/cjmohfs/dpn
Q i p u p ; L o v u M b v c o f s - C p o o
CIRCLE 24 ON READER SERVICE CARD

7/22/2019 Power March 2014
http://slidepdf.com/reader/full/power-march-2014 66/82 www.powermag.com POWER | March 201462
FUEL SUPPLIES
The LNG Export Debate: Lessonsfrom PeruWhat could a relatively small country in South America have to teach the U.S. about
LNG exports? Maybe a lot, as 2014 marks the 10th anniversary of its naturalgas market.
Javier Matos Flores-Guerra
Recent shale gas development, resulting
in cheap natural gas in the U.S., has
opened the debate about whether or
not to export some of that energy—mainly as
liquefied natural gas (LNG). As the U.S. con-
siders the merits of LNG exports, it may be
useful to look at how that debate played outin other countries faced with a similar situ-
ation. Understanding how previous debates
evolved, and the consequences of the deci-
sions, may prove to have lessons that the U.S.
can learn from.
There are just two LNG export terminals
in the Americas outside the U.S., in Trinidad
& Tobago and Peru. The Peruvian project, the
first of its kind in South America, was the one
that faced major controversy over whether or
not the nation should export natural gas.
The Peruvian Natural Gas
Revolution
Peru is the third-largest country in South
America, with a population of 30 million anda GDP per capita of US$6,800. It is an emerg-
ing market that grew 7% a year on average in
the past eight years. Unlike the U.S., before
2004, Peru had never been a significant con-
sumer of natural gas (see sidebar “Natural
Gas and Electricity in Peru”).
The natural gas revolution in Peru had a
name, and its name was Camisea.
Camisea hydrocarbon deposits are lo-
cated 500 kilometers east of Lima, Peru’s
capital city, in the Ucayali Basin, in the Pe-
ruvian region of Cusco, in the southcentral
jungle of the country. As early as 1981 the
Peruvian government signed an operation
agreement with a subsidiary of Royal Dutch
Shell (Shell) in order to explore the deposit.From 1983 to 1987, Shell discovered and
confirmed the Camisea deposit was rich in
natural gas and associated liquids reserves,
with over 8 trillion cubic feet (Tcf) of re-
serves. For many reasons—including po-
litical incompetency, the emergence of the
leftist guerrillas known as the Shining Path,
and lack of capital and human resources—
Camisea had to wait until the new millen-
nium to see the light.
In August 2004, Camisea started its com-
mercial operation as an integrated project.
The project’s entire value chain included pro-duction, transportation—a 729-km pipeline
from Malvinas to Lima and a 557-km natural
gas liquids (NGL) pipeline from Malvinas
to Pisco—and distribution, including to the
City of Lima.
The Camisea project had two main phases,
with the first involving resource exploration
and development and the second involving
the LNG export components. When Camisea I
was under procurement and construction, be-
tween 2001 and 2003, Peruvian policymakers
faced the dilemma that American policymak-
ers are facing now: There was too much gasfor the country’s domestic consumption—or
at least that seemed to be the case.
From a global perspective, 8 to 10 Tcf is
not much natural gas at all, but in the early
stage of the Peruvian natural gas industry,
when nobody used natural gas because they
did not even know about it, it was reason-
able, even indispensable, to evaluate all the
alternatives available to obtain the highest
economic benefit from the natural gas.
Because gas reserves appeared to vastly
exceed domestic needs, exportation initia-
tives started to make sense. At the sametime, questions started to arise. In an im-
mature energy market like the Peruvian
Natural Gas and Electricity in Peru
According to The World Factbook (pub-lished online by the U.S. Central Intel-
ligence Agency), in 2010, Peru had an
estimated 8.613 GW of installed electric
power capacity. Fossil fuels accounted
for roughly 60% of all generation, with
the balance coming from hydropower.
Also for 2010, the International Energy
Agency says that 12,226 GWh were gen-
erated by natural gas, accounting for
34% of total generation.
The U.S. Energy Information Adminis-tration reports that domestic consumption
of natural gas in Peru increased from 16
Bcf in 2002 to 202 Bcf in 2011, “driven by
government incentives, economic growth,
and the growing number of gas-fired elec-
tricity plants.” Overall, the role of natural
gas in Peru’s energy sector and economy
has increased dramatically in recent years
(Table 1).
—Gail Reitenbach, PhD, Editor
Table 1. Natural gas ramp-up. Source: U.S. Energy Information Administration
History Peru
Central &
South America World Rank
Production 255.33 5, 517 111,954 400.83
Consumption 193.88 5,106 113,321 201.65
Net export 61.45 415 — 199.18
Proved reserves (trillion
cubic feet)
12.46 270 6,845 12.70

7/22/2019 Power March 2014
http://slidepdf.com/reader/full/power-march-2014 67/82March 2014 |POWER www.powermag.com 63
FUEL SUPPLIES
one, how much natural gas was enough?
How would internal consumption evolve?
Would exports increase the price for lo-
cal consumers? Would exports deplete the
resources too fast? Would it be against
Peruvian energy independence? Not sur-
prisingly, we hear this group of questions
nowadays a little farther north.
Jaime Quijandría, who died in Decem-
ber 2013, was Peru’s minister of energy
and mines and minister of economics and
finance between 2001 and 2004 and is rec-
ognized as a leader and a pioneer in the Pe-
ruvian energy sector. Quijandría, a former
president of Peru’s NOC Petroperu, was
the main force behind the Peruvian energy
policymakers who were looking to make
the most of Peruvian natural gas resources
for the nation. With that objective in mind,
Quijandría and his team in the Ministry of
Energy found that the best way to accom-
plish that goal was to open and find new
markets for Peruvian natural gas through
exportation. Quijandría was very aware of
CIRCLE 25 ON READER SERVICE CARD
Environmental Concerns
As in the U.S., any time a major new
pipeline or resource development proj-
ect is discussed in South America, envi-
ronmental questions are raised. For the
Camisea project, which lies partly in the
Amazon rainforest, concerns included thedisplacement of indigenous people, clear-
cutting of forests, and pipeline spills.
Typically, neither side in energy versus
environment debates wins everything it
wants. One example from one phase of the
Camisea project: In response to concerns
about adverse effects on the environment
and indigenous people, the multinational
development consortium led by Argentina’s
Pluspetrol agreed to not build roads but
instead adopted a model used in offshore
exploration and production that uses boatsand helicopters to move equipment, sup-
plies, and workers to and from the site.
The potential for pipeline ruptures has
been cited by North American opponents
to new pipelines and LNG export projects,
and the Peruvian project has experienced
more than one episode of pipeline breaks.
In the first year and a half after the Cami-
sea project went online in 2004, it experi-
enced a series of pipeline breaks that a San
Diego, Calf.–based environmental consult-
ing firm, E-Tech International, determinedwere the result of shoddy work done by
unqualified welders who used leftover cor-
roded pipes (though Peruvian regulatory
audits could not confirm the use of left-
over pipe). Presumably, with better over-
sight and qualified workers, rupture risks
could be minimized.
Though opposition to natural gas devel-
opment on environmental grounds has not
completely subsided, some groups have
recently pointed to successful efforts to
mitigate negative environmental and cul-
tural consequences. In a March 2013 report
titled “Peru LNG: A Focus on Continuous
Improvement,” the International Finance
Corp. (which, along with other interna-
tional lending agencies, provided $2.05
billion to the project) concluded that
through “strong commitment to managing
environmental and social risks throughout
all phases of the project, PLNG successfully
managed and mitigated operational and
reputational risks related to their environ-
mental and social performance.”
—Gail Reitenbach, PhD, Editor

7/22/2019 Power March 2014
http://slidepdf.com/reader/full/power-march-2014 68/82 www.powermag.com POWER | March 201464
FUEL SUPPLIES
the dynamics of the oil and gas business and the virtuous circle
of open markets, exploration, and production and development of
new reserves.
When Peru took the decision to allow exports of natural gas, it also
looked to invigorate the exploration and production business and to
make it possible, through the right economic signals, that possible
and probable reserves become proven ones, making them commer-
cially viable.
Peru is a country that has had many traumatic experiences of
corruption in its highest levels of government throughout its his-tory. The worst thing about corruption is not just the economic
losses that inevitably result, but rather that it seeds mistrust among
people. Peruvians mistrust their judiciary system, their parliament,
and their politicians. In that context, it’s easy for political, even
technocratic, opponents to point to different policy decisions as
motivated by corruption.
Carlos Herrera, a well-known expert in energy matters, who had
been Peru’s minister of energy and mines twice (2000–2001 and
in 2011) denounced export plans publicly and said that Peru did
not have enough natural gas reserves to justify developing an LNG
export project. He suggested that it was corruption in the adminis-
tration that modified the Peruvian oil and gas regulations in order to
make the LNG project viable. However, parliamentary investigativecommissions came and went and couldn’t find any evidence of cor-
ruption or mismanagement.
Environmental concerns have also been an ongoing matter ofdebate, especially as a portion of the natural gas reserves lie in the
Amazon rainforest (see sidebar “Environmental Concerns”). Overall,
however, the resource development and export project has made re-
markably fast progress.
Export InfrastructureOn June 22, 2010, Peru LNG—a multinational consortium created
in 2003—dispatched its first shipment of LNG from its state-of-the
art liquefaction terminal located 170 km south of Lima at Pampa
Melchorita (Figure 1). The plant is a single-train facility with a ca-
pacity of 4.4 million metric tons per year.
The project’s total cost (for the LNG plant, marine terminal, pipe-
line, plus development and financing costs) was $3.8 billion, makingit, at the time, the largest foreign investment in Peru’s history.
The nearly four-year development project also included a 408-
km pipeline that crossed the Andes. The engineering, procure-
ment, and construction (EPC) contract for the liquefaction plant
facilities (Figure 2) was awarded to Chicago Bridge & Iron Co.
(CB&I). The marine terminal EPC was awarded to a consortium
led by Brazilian contractor Odebrecht, and the pipeline contractor
was Argentina’s Techint.
Early ResultsIt’s too early to conclude whether or not the exportation decision was
the best decision for Peru. However, according to the “BP Statisti-
cal World Review of 2013,” at the end of 2012, Peru’s natural gasproved reserves were up to 12.7 Tcf (up from 8.7 Tcf in 2006), and
its reserves-to-production ratio (R/P)—the length of time that the re-
maining reserves would last if production were to continue at the cur-
rent rate—was 27.9 years, the largest in the Americas (the U.S. R/P
ratio is 12.5 years).
Since it began exports, Peru has shipped its LNG primarily to
Spain, South Korea, Japan, and Mexico. Additionally, Peru is cur-
rently considering new export projects (through LNG shipments or
pipeline) to Chile, a neighboring country with higher energy costs.
Industry sources estimate that Peru LNG will generate approxi-
mately $310 million annually of export revenues.
Not bad at all for a small South American country. ■
— Javier Matos Flores-Guerra is an associate with the Peruvianlaw firm Hernández & Cia. and is a specialist in the legal, regula-
tory, and project development aspects of the energy sector.
1. Stored and ready to ship. South America’s first and only natu-
ral gas liquefaction terminal is located 170 kilometers south of Lima on
the Pacific Ocean. Courtesy: Peru LNG
2. Under construction. The EPC contract for the liquefaction fa-
cility was awarded to Chicago Bridge & Iron Co. (CB&I). The LNG export
project was launched in January 2007, inaugurated on June 10, 2010, and
dispatched its first tanker on June 22, 2010. Courtesy: Peru LNG

7/22/2019 Power March 2014
http://slidepdf.com/reader/full/power-march-2014 69/82March 2014 |POWER www.powermag.com 65
INDUSTRY TRENDS
Facing Challenges from NaturalDisasters to Customers as GeneratorsIn the process of developing both familiar and new conference tracks and sessions for
ELECTRIC POWER 2014, Event Content Director David Wagman has identifieda number of current and emerging trends. Here he offers his take on the issuesthat will be hot topics this April in New Orleans and long after.
David Wagman
The 16th annual ELECTRIC POWER
Conference & Exhibition takes place in
New Orleans this year, and it’s a fitting
place to be discussing the many persistent
and new challenges facing the power genera-
tion industry. Entergy Corp. is the host util-ity, and its experience is indicative of several
trends across the power sector.
As with other new U.S. baseload capacity,
gas is playing the lead role for Entergy, whose
commitment to natural gas (with fuel oil as a
backup) is evident at its 550-MW Ninemile
Point Unit 6 plant. (The plant will be open
for a tour by ELECTRIC POWER attendees
on Mar. 31.) The combined cycle gas turbine
unit is under construction a short distance
from downtown New Orleans and will add
economical and efficient gas-fired capacity
to the generating mix serving southeast Loui-siana. The region spans an area from east of
metropolitan Baton Rouge to the Mississippi
state line and south to the Gulf of Mexico,
including New Orleans. By 2015, the region
will have more than 6,000 MW of demand.
Ninemile Unit 6 is on track to enter commer-
cial service by mid-2015 with enough capacity
to replace the loss of Ninemile Units 1 and 2.
Those units entered service in the early 1950s
and have been deactivated. Ninemile Unit
6 (Figure 1) is designed to allow it to adjust
output as a load-following plant or operate as
a baseload plant if required. The unit will use
natural gas as its main fuel, but it also will be
able to burn ultra-low-sulfur fuel oil for short
periods. Through its pollution-control systems,
the unit will be among the nation’s cleanest
gas-fired generating plants, and its emissionswill be significantly lower than the deactivated
Ninemile Point units. Additionally, locating a
large generator like Ninemile 6 close to load
enhances flexibility during system restoration
following a storm such as a hurricane.
Disaster Planning and MitigationSystem restoration following a storm is a
major consideration for Entergy, whose Gulf
Coast operating units were hit hard by hurri-
canes Katrina and Rita. Rod West, Entergy’s
chief administrative officer, will reflect on
how utility investment decisions should be in-fluenced by disruptive events such as the 2003
Northeast blackout, Hurricane Katrina, and
Superstorm Sandy in keynote remarks he will
deliver at ELECTRIC POWER on Apr. 1.
West played a unique role in the rebuilding
of Entergy New Orleans. First, in 2005, when
Hurricane Katrina struck and flooded 80% of
the city, West served as manager of the metro
New Orleans region with responsibility for
the city’s electric infrastructure. West and his
team oversaw a $250 million reconstruction
of the nearly destroyed New Orleans electrical
infrastructure (see “Preparation keyed Enter-
gy’s responses to Katrina, Rita” in POWER’s
May 2006 issue at powermag.com).
Second, in 2007, as president and CEO of
Entergy New Orleans, West led that business
unit out of Chapter 11 bankruptcy reorga-nization and back to profitability. Addition-
ally, he oversaw one of the industry’s largest
natural gas rebuild efforts, which included
replacing around 860 miles of underground
pipe damaged after Hurricane Katrina.
The nuts and bolts of Entergy’s emergen-
cy preparedness efforts will be explored in
greater detail at ELECTRIC POWER by Greg
Grillo, storm incident commander, who will
discuss his company’s emergency prepared-
ness planning process. The Edison Electric
Institute (EEI) honored Entergy in 2013 with
its Emergency Recovery Award and Emer-gency Assistance Award. EEI cited the utility
for its work restoring power to customers fol-
lowing Hurricane Isaac and to customers of
other utilities after Hurricane Sandy and other
severe weather events. The recognition was
nothing new for the utility: 2013 marked the
15th consecutive year that Entergy received an
EEI national storm restoration award.
In presenting the award, EEI President
Tom Kuhn said, “Entergy was faced with a
major restoration effort following Hurricane
Isaac. Getting the lights back on quickly and
safely is never easy following these naturaldisasters. It takes strong commitment, ad-
vanced planning and great execution. Entergy
responded with all three, and their assistance
shows their compassion in helping others in
their time of need. They’re a great example
for the nation’s electric power industry.”
Microsoft and the Energy SupplyChainAnother trend that is picking up steam is the
growing role of diverse customers in the elec-
tricity supply chain. For examaple, in an inter-
view earlier this year, Brian Janous, director ofenergy strategy for Microsoft, told me that Mi-
crosoft looks at data as a “refined form of ener-
1. Ninemile Unit 6. Entergy Corp.’s 550-MW combined cycle generating unit is slated to
enter service in 2015. Courtesy: Entergy Corp.

7/22/2019 Power March 2014
http://slidepdf.com/reader/full/power-march-2014 70/82 www.powermag.com POWER | March 201466
INDUSTRY TRENDS
gy.” He said the company thinks about energy
not only from the perspective of a consumer,
but also from the vantage point of “where we
sit in the overall energy supply chain and about
how to create more efficient energy systems,”
from the power plant to the data chip. “As a
result, our path for delivering power to sup-
ply Microsoft’s cloud infrastructure is focused
both on how we optimize for efficiency inside
our footprint, and also how we integrate and
invest in driving greater efficiencies across the
broader energy supply chain.”
Janous said Microsoft has three objec-
tives that drive this effort, which he will
elaborate on during his keynote remarks:
First, to distribute efficient power genera-
tion to the company’s datacenters that inte-
grates with the capacity and energy needs of
the local grid; second, to deliver to the grid
low-cost and efficient energy by participat-
ing in utility-scale generation projects; and,
third, to foster the development of the nextgeneration of energy technologies that will
make future distributed and grid-connected
projects “radically” more efficient.
“We don’t expect to achieve any of this on
our own,” Janous told me. “Instead we look
to the energy industry to partner with us on
achieving these objectives.”
Cogeneration and CHPReliability and efficiency are as important
to a regional hospital or research university
as they are to a datacenter operation such as
Microsoft’s. Every dollar spent by an institu-
tion’s utilities department to produce steam,
heat, or electricity is a dollar that cannot be
invested in the core mission, be it laboratory
research or patient care.
“Our objective is to reduce cost but retain
resiliency,” said Juan Ontiveros, executive di-
rector of utilities at the University of Texas at
Austin. Add to that the task of self-producing
100% of the power consumed by the 17 mil-
lion square feet across 150 buildings on the
Austin campus, while planning for an ad-
ditional 2 million square feet (including a 1
million–square foot hospital) by 2016.
Ontiveros will discuss the challenges of op-
erating one of the largest combined heat and
power (CHP) systems in the U.S. as part of
ELECTRIC POWER’s newest track that fo-cuses on cogeneration and CHP applications.
The university’s generating capacity includes
two combustion turbines, each equipped with
heat recovery steam generators. One 45-MW
unit runs during the summer when air condi-
tioning load is greatest. A 32-MW unit runs
in the fall, winter, and spring seasons. Excess
heat thrown off by the turbines is used for
heating and steam throughout the campus.
Ontiveros said that recent market condi-
tions are “perfect” for institutions and their
need to avoid risk. He cited shrinking reserve
margins in some parts of the country, coal
plant retirements, and the lack of invest-
ment in new generating resources as key rea-
sons for institutions to seek greater security
through cogeneration and CHP. “We see risk
any time we are on the grid,” Ontiveros said,
adding that the Austin campus has experi-
enced three outages in 40 years. The campus
can be more resilient, more cost effective,
and greener than the grid. He added that the
emissions produced to supply 17 million
square feet are the same as in 1976, when the
campus included 10 million square feet.
Resiliency, cost effectiveness, and envi-
ronmental stewardship are three recurring
themes at ELECTRIC POWER. Networking
is a fourth, and there are plenty of opportu-nities to meet with peers as well as solution
providers on and off the exhibit floor. ■
—David Wagman is content director forELECTRIC POWER (www.electricpower-
expo.com), which takes place April 1-3 atthe Ernest N. Morial Convention Center in
New Orleans.
June 3-5, 2014 Atlantic City, NJ • Sheraton Hotel
www.energyocean.com @EnergyOcean /EnergyOcean
23117
Use VIP Code: EOMAR
Dedicated to the Advancement of the
Offshore Renewable Energy Industry
WIND WAVE TIDAL

7/22/2019 Power March 2014
http://slidepdf.com/reader/full/power-march-2014 71/82

7/22/2019 Power March 2014
http://slidepdf.com/reader/full/power-march-2014 72/82

7/22/2019 Power March 2014
http://slidepdf.com/reader/full/power-march-2014 73/823Global Business Reports // POWER BRAZIL March 2014 3
www.gbreports.com
Global Business Reports
from 2% to 8%, small hydro will remain
at 4%, biomass will reduce from 8% to
7%, nuclear will increase marginally but
stay at 2% and thermal will reduce from
15% to 13%. This may change a little bit
to increase thermal but these are our gen-
eral long-term projections. We anticipate anoverall increase in capacity by 60,000 MW,”
said Mauricio Tomalsquim, president of the
government-funded EPE (Energy Research
Company).
The Environmental Debacle:
Dirty Hydro for Dirtier Thermal
While Brazil’s hydropower endowment
is its greatest asset, since the 1990’s the
construction of large dam reservoirs has
become subject to increasing environmen-
tal criticism due to the damage they cause
to the environment by flooding vast areas
of land.
New plants are being constructed in the
Amazon but they are fraught with contro-
versy. Belo Monte (11,233 MW), due to be-
come the third largest hydroelectric plant
in the world, is planned for completion in
2019, but has been subject to vehement
environmental opposition and numerous
suspensions since conception of plans in
1975. New hydro projects favor minimal
reservoir size or run-of-river water mills in
order to secure the elusive environmental
permits they require.
Wind
Wind complements hydropower perfectly
in Brazil: when there is heavy rainfall there
is less wind, when there is light rainfall
there is more wind. The growth of Brazil-
ian wind generation over the past decade,
and particularly the last five years, has been
phenomenal.
The introduction of wind into Brazil’s con-
cession auctions in 2009 was when the
industry took off. The auction system func-
tions in a way that the generator who bids
with the cheapest, guaranteed price per
MWh receives a Power Purchase Agree-
ment (PPA) of 20 years indexed by inflation
and becomes eligible for 80% financing
from BNDES (The Brazilian Development
Bank). Wind became competitive when
generators were offered a fixed revenueso long as they did not produce less than
90% of the power they promised over a
four year period. Combined with a financial
crisis in Europe and the USA, many foreign
companies were drawn to the Brazilian
wind market, making it one of the fastest
growing in the world.
2012 was a blip for wind and the electricity
sector as distribution companies delayedthe purchase of energy due to uncertainty
in the market caused by regulatory chang-
es and low GDP growth.
2013, however, has been a bumper year as
the market has acclimatized to the regula-
tory changes and demand for electricity
has increased. Wind contracted 1 GW in
the A-5 auction in August, dominated the
A-3 auction on 18th November with 39 pro-
jects totaling 867 MW, and won 97 of the
115 successful energy projects in the A-5
auction on 13th December.
Brazil’s wind sector continues to attract
foreign manufacturers looking for strong
growth opportunities. Vulkan do Brasil, a
German coupling and brake components
company, has been in Brazil for 35 years and
is now starting to see considerable growth
in the energy sector, particularly wind. “We
started with hydro and are currently focus-
ing more on research and development in
the wind market for wind turbine breaks.
There are other major break manufacturers
in the local wind market and we are get-
ting closer to them. Our advantage is that
we are the only local manufacturer in Bra-
zil of these components and our products
are GL certified and BNDES-FINAME reg-
istered,” said the company’s sales director,
Tiago Bedani.
While the auction results indicate a bright
future ahead, BNDES’s stringent local con-
tent requirements are causing a bottleneck
in the supply chain. In July 2012, BNDES
changed its Finame financing requirements
for local content to 60%, resulting in six
foreign wind turbine suppliers being dis-
qualified from the loan program. In 2015,
100% of nacelles and towers will have to
be manufactured in the country, which al-
though important for developing Brazilian
industry, will be a tough challenge to for
manufacturers to meet.
Improvements to the system can also
be made as low prices currently come at
the cost of efficiency: “We have the ca-
pability to extract more energy from windthrough reactive power, but if we do so
the cost will be higher, which is not what
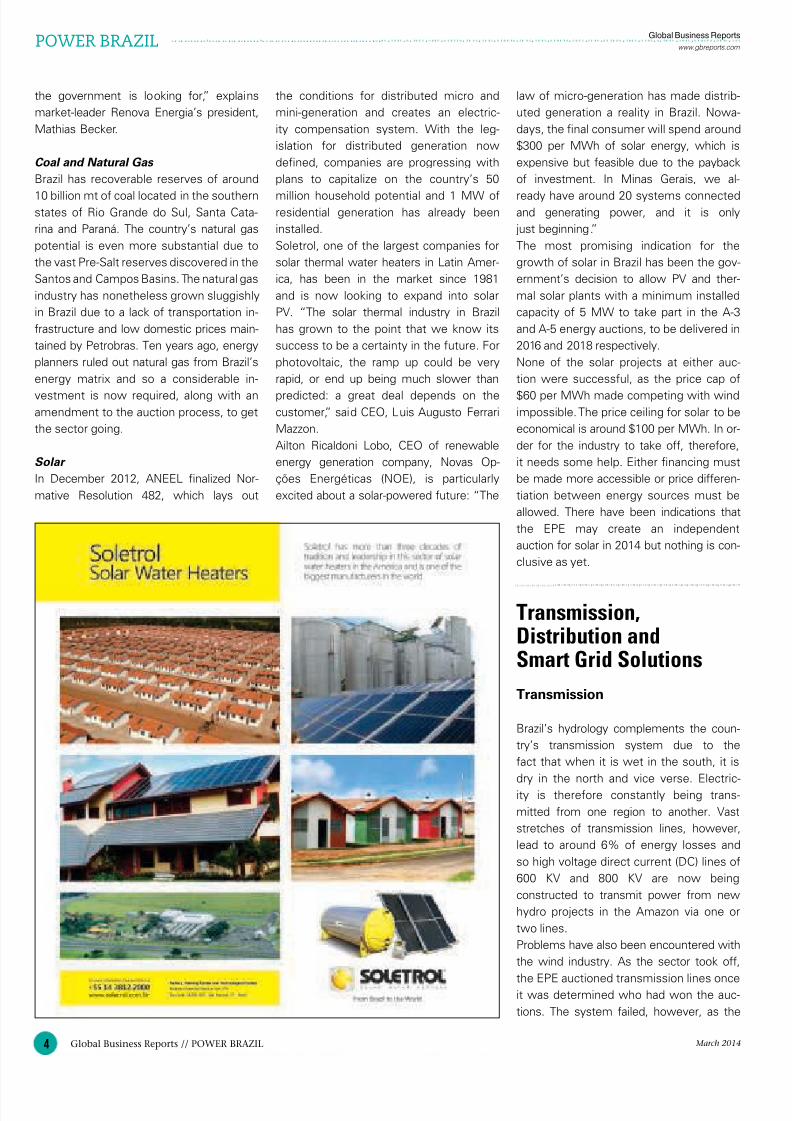
7/22/2019 Power March 2014
http://slidepdf.com/reader/full/power-march-2014 74/82
www.gbreports.com
Global Business ReportsPOWER BRAZIL
4 Global Business Reports // POWER BRAZIL March 2014
the government is looking for,” explains
market-leader Renova Energia’s president,
Mathias Becker.
Coal and Natural Gas
Brazil has recoverable reserves of around
10 billion mt of coal located in the southernstates of Rio Grande do Sul, Santa Cata-
rina and Paraná. The country’s natural gas
potential is even more substantial due to
the vast Pre-Salt reserves discovered in the
Santos and Campos Basins. The natural gas
industry has nonetheless grown sluggishly
in Brazil due to a lack of transportation in-
frastructure and low domestic prices main-
tained by Petrobras. Ten years ago, energy
planners ruled out natural gas from Brazil’s
energy matrix and so a considerable in-
vestment is now required, along with an
amendment to the auction process, to get
the sector going.
Solar
In December 2012, ANEEL finalized Nor-
mative Resolution 482, which lays out
the conditions for distributed micro and
mini-generation and creates an electric-
ity compensation system. With the leg-
islation for distributed generation now
defined, companies are progressing with
plans to capitalize on the country’s 50
million household potential and 1 MW ofresidential generation has already been
installed.
Soletrol, one of the largest companies for
solar thermal water heaters in Latin Amer-
ica, has been in the market since 1981
and is now looking to expand into solar
PV. “The solar thermal industry in Brazil
has grown to the point that we know its
success to be a certainty in the future. For
photovoltaic, the ramp up could be very
rapid, or end up being much slower than
predicted: a great deal depends on the
customer,” said CEO, Luis Augusto Ferrari
Mazzon.
Ailton Ricaldoni Lobo, CEO of renewable
energy generation company, Novas Op-
ções Energéticas (NOE), is particularly
excited about a solar-powered future: “The
law of micro-generation has made distrib-
uted generation a reality in Brazil. Nowa-
days, the final consumer will spend around
$300 per MWh of solar energy, which is
expensive but feasible due to the payback
of investment. In Minas Gerais, we al-
ready have around 20 systems connectedand generating power, and it is only
just beginning.”
The most promising indication for the
growth of solar in Brazil has been the gov-
ernment’s decision to allow PV and ther-
mal solar plants with a minimum installed
capacity of 5 MW to take part in the A-3
and A-5 energy auctions, to be delivered in
2016 and 2018 respectively.
None of the solar projects at either auc-
tion were successful, as the price cap of
$60 per MWh made competing with wind
impossible. The price ceiling for solar to be
economical is around $100 per MWh. In or-
der for the industry to take off, therefore,
it needs some help. Either financing must
be made more accessible or price differen-
tiation between energy sources must be
allowed. There have been indications that
the EPE may create an independent
auction for solar in 2014 but nothing is con-
clusive as yet.
Transmission,
Distribution and
Smart Grid Solutions
Transmission
Brazil’s hydrology complements the coun-
try’s transmission system due to the
fact that when it is wet in the south, it is
dry in the north and vice verse. Electric-
ity is therefore constantly being trans-
mitted from one region to another. Vast
stretches of transmission lines, however,
lead to around 6% of energy losses and
so high voltage direct current (DC) lines of
600 KV and 800 KV are now being
constructed to transmit power from new
hydro projects in the Amazon via one or
two lines.
Problems have also been encountered with
the wind industry. As the sector took off,
the EPE auctioned transmission lines onceit was determined who had won the auc-
tions. The system failed, however, as the

7/22/2019 Power March 2014
http://slidepdf.com/reader/full/power-march-2014 75/82
companies who won the transmission auctions were not able to
construct the lines by the time the parks were ready. Some wind
farms are therefore ready to generate electricity but cannot con-
nect to the grid. The system has since been changed so that trans-
mission lines are auctioned in advance and wind farm investors
now have to connect to the lines themselves.
Distribution
The biggest challenge Brazil faces with regards to distribution is
non-technical losses, caused by people who do not pay their bill.
These types of losses make up an average of 16% of total losses
in the country. The problem is the most serious in the state of
Rio de Janeiro, where non-technical losses average 25% and can
reach up to 70% in some areas.
Smart Grid Solutions
Smart solutions for integrated automation, distributed automa-
tion, smart metering and telecommunications will reach the
market in 2014. However, their implementation depends on the
government’s approach as distribution companies are primarily
interested in reducing non-technical losses. “Most companies
investing in smart grid solutions are electrical companies fac-
ing issues with regards to non-technical losses. In these cases,
they are just applying technology to reduce their non-technical
losses, which is a different concept than having an architec-
tural approach; it is not about making the system more efficient,
it is about making it more secure… to develop a general smart
grid topology in the next five years, we need to define a roadmap
to implement a plan,” said Ricardo Van Erven, CEO, Latin America,
GE Digital Energy.
Conclusion: The Country of theFuture?Brazil’s booming economy, which barely flinched at the global fi-
nancial crisis of 2008 and grew by 7.5% in 2010, has come back
down to earth with a thud since the euphoria of winning both the
2014 World Cup and 2016 Olympic Games. GDP growth has plum-
meted in the last two years and signs of unrest are starting to
manifest themselves through large pubic demonstrations across
the country protesting against high prices, lack of investment and
political corruption. Stefan Zweig’s hackneyed phrase that “Brazil is
the country of the future – and always will be,” seems once again
as ironic as ever.
Whilst government intervention in electricity will deter foreign
investment in the short term, changes, in many respects,
were necessary. As the market stabilizes, however, it must be
left to grow organically. Presidential elections are due to take
place on 5th October 2014 so relative tranquility can be expected
until then. In the meantime, the Brazilian power sector is open
to investment: anyone can compete for the country’s genera-tion and transmission needs and risk is low with long PPAs and
guaranteed financing. •
www.gbreports.com
Global Business Reports
5Global Business Reports // POWER BRAZIL March 2014 5

7/22/2019 Power March 2014
http://slidepdf.com/reader/full/power-march-2014 76/82
Opportunities in Operations and Maintenance,
Project Engineering and Project Management,
Business and Project Development,First-line Supervision to Executive Level Positions.
Employer pays fee. Send resumes to:
POWER PROFESSIONALS
P.O. Box 87875Vancouver, WA 98687-7875
email: [email protected]
(360) 260-0979 l (360) 253-5292www.powerindustrycareers.com
CAREERS IN POWER
NAES Corporation is a leading provider of
3rd party O&M services to the Independent
Power Industry. As we continue to grow, we
have constant needs for power professionals
across the nation.
For more info, log onto:www.naes.com/careers
www.powermag.com POWER |March 201472
Todd [email protected]
www.cdims.com
Layup Desiccant
Dehumidification
& Filtration Units
for long term layupof power generation
equipment. For over
35 years of drying
solutions contact:
READER SERVICE NUMBER 204READER SERVICE NUMBER 202
George H. BodmanPres. / Technical Advisor
Office 1-800-286-6069
Office (281) 359-4006
PO Box 5758 E-mail: [email protected]
Kingwood, TX 77325-5758 Fax (281) 359-4225
GEORGE H. BODMAN, INC. Chemical cleaning advisory services for
boilers and balance of plant systems
BoilerCleaningDoctor.com
24 / 7 EMERGENCY SERVICE
BOILERS20,000 - 400,000 #/Hr.
DIESEL & TURBINE GENERATORS50 - 25,000 KW
GEARS & TURBINES25 - 4000 HP
WE STOCK LARGE INVENTORIES OF:Air Pre-Heaters • Economizers • Deaerators
Pumps • Motors • Fuel Oil Heating & Pump SetsValves • Tubes • Controls • CompressorsPulverizers • Rental Boilers & Generators
847-541-5600 FAX: 847-541-1279
WEB SITE: www.wabashpower.com
FOR SALE/RENT
444 Carpenter Avenue, Wheeling, IL 60090
POWER
EQUIPMENT CO.wabash
READER SERVICE NUMBER 201
READER SERVICE NUMBER 205
READER SERVICE NUMBER 203
Silo and Bin CleaningServices and Equipment
Call 800-322-6653 or visit
www.molemaster.com
READER SERVICE NUMBER 200

7/22/2019 Power March 2014
http://slidepdf.com/reader/full/power-march-2014 77/82
POWER PLANT
BUYERS’ MART
GAS TURBINES FOR SALE
• LM6000
• FRAME 9E
• FRAME 5
50/60Hz, nat gas or liq fuel,
installation and service available
Available for Immediate Shipment
Tel: +1 281.227.5687
Fax: +1 281.227.5698
READER SERVICE NUMBER 208
March 2014 |POWER www.powermag.com 73
PRODUCT Showcase
READER SERVICE NUMBER 206
READER SERVICE NUMBER 207
READER SERVICE NUMBER 211
READER SERVICE NUMBER 209
Baghouse Consultants
Specializing in Testing,Training, Troubleshooting
and Testimony
New and Used Filter
Bag Analysis
Bag Set QA/QC
Pilot Plant Studies
Contact
Je Smith 5402650004 ext. 294
www.etsiinc.com
READER SERVICE NUMBER 210

7/22/2019 Power March 2014
http://slidepdf.com/reader/full/power-march-2014 78/82 www.powermag.com POWER |March 201474
Combustion Turbines
& Combined CyclesGuidebook
Order your copy online at http://store.powermag.com/ or call 888-707-5808.
This guidebook exclusively features
combustion turbines and combined cycle
articles, including full charts, photographs,
graphs and step-by-step instructions,
previously featured in POWER magazine.A va i la b le in a P
D F forma t.
9 8 page s.
23434
CONDENSER & HEAT EXCHANGER TOOLSCLEANERS, PLUGS, BRUSHES
John R Robinson Inc.PH # 800-726-1026
e-mail: [email protected]
READER SERVICE NUMBER 212READER SERVICE NUMBER 214
CONDENSER OR GENERATOR AIR COOLER TUBE PLUGSTHE CONKLIN SHERMAN COMPANY, INC.
Easy to install, saves time and money.
ADJUSTABLE PLUGS-all rubber with brass insert. Expand it,install it, reverse action for tight fit.
PUSH PULL PLUGS- are all rubber, simply push it in.Sizes 0.530 O.D. to 2.035 O.D.
Tel: (203) 881-0190 • Fax:(203)881-0178E-mail: [email protected] • www.conklin-sherman.com
OVER ONE MILLION PLUGS SOLD
Turbine Controls
Woodward, GE, MHCParts and Service
TurboGen • (610) 631-3480
READER SERVICE NUMBER 213 READER SERVICE NUMBER 215
NEED CABLE? FROM STOCK
Copper Power to 69KV; Bare ACSR & AAC Conductor
Underground UD-P & URD, Substation Control – Shieldedand Non-shielded, Interlock Armor to 35KV, Thermocouple
BASIC WIRE & CABLEFax (773) 539-3500 Ph. (800) 227-4292
E-Mail: [email protected] SITE: www.basicwire.com
To Advertise in
POWER
Classifieds
CONTACT:
Diane Burleson
PHONE:
512-337-7890
FAX: 512-213-4855

7/22/2019 Power March 2014
http://slidepdf.com/reader/full/power-march-2014 79/82March 2014 |POWER www.powermag.com 75
ADVERTISERS’ INDEXEnter reader service numbers on the FREE Product Information Source card in this issue.
POWER
Subscribe today: [email protected]
Page
ReaderServiceNumberPage
ReaderServiceNumber
Abresist Kalenborn. . . . . . . . . . . . . . . . . . . . . . . . . . . . . . . . . . . . . . . . . . .17. . . . . . . . 9 www.abresist.com
Apollo Valves . . . . . . . . . . . . . . . . . . . . . . . . . . . . . . . . . . . . . . . . . . . . . . . 13. . . . . . . . 7 www.apollovalves.com
Applied Bolting Technology ……. . . . . . . . . . . . . . . . . . . . . . . . . . . . .38 . . . . . . . .17 www.appliedbolting.com
ASI Group . . . . . . . . . . . . . . . . . . . . . . . . . . . . . . . . . . . . . . . . . . . . . . . Cover 2 . . . . . 1 www.asi-group.com
Baldor Electric.. . . . . . . . . . . . . . . . . . . . . . . . . . . . . . . . . . . . . . . . . . . . . .21. . . . . . . .11 www.baldor.com
Beumer . . . . . . . . . . . . . . . . . . . . . . . . . . . . . . . . . . . . . . . . . . . . . . . . . . . . . 19. . . . . . . .10 www.beumer.com
Bilfinger Piping Technologies . . . . . . . . . . . . . . . . . . . . . . . . . . . . . . . . . 61. . . . . . . . 24 www.piping.bilfinger.com
Brand Energy. . . . . . . . . . . . . . . . . . . . . . . . . . . . . . . . . . . . . . . . . . . . . . . .53. . . . . . . .22 www.beis.com
Burns & McDonnell . . . . . . . . . . . . . . . . . . . . . . . . . . . . . . . . . . . . . . . . . . 7 . . . . . . . . 4 www.burnsmcd.com
Calgon Carbon. . . . . . . . . . . . . . . . . . . . . . . . . . . . . . . . . . . . . . . . . . . . . . .42. . . . . . . .18 www.calgoncarbon.com
Carver Pump . . . . . . . . . . . . . . . . . . . . . . . . . . . . . . . . . . . . . . . . . . . . . . . . 52. . . . . . . . 21 www.carverpump.com
Diamond Power . . . . . . . . . . . . . . . . . . . . . . . . . . . . . . . . . . . . . . . . . . . . . 43. . . . . . . . 19 www.diamondpower.com
Fluor . . . . . . . . . . . . . . . . . . . . . . . . . . . . . . . . . . . . . . . . . . . . . . . . . . . . .11 . . . . . . . . 6 www.fluor.com
Fuel Tech . . . . . . . . . . . . . . . . . . . . . . . . . . . . . . . . . . . . . . . . . . . . . . . . . . . 35. . . . . . . . 16 www.ftek.com
Hadek . . . . . . . . . . . . . . . . . . . . . . . . . . . . . . . . . . . . . . . . . . . . . . . . . . . . . .15. . . . . . . . 8 www.hadek.com
Magnetrol. . . . . . . . . . . . . . . . . . . . . . . . . . . . . . . . . . . . . . . . . . . . . . . . . . .29. . . . . . . .15 www.magnetrol.com
MD&A . . . . . . . . . . . . . . . . . . . . . . . . . . . . . . . . . . . . . . . . . . . . . . . . . Cover 4 . . . . .26 www.mdaturbines.com
Mitsubishi Power Systems. . . . . . . . . . . . . . . . . . . . . . . . . . . . . . . . . . . 2-3 . . . . . . . 2 www.mpshq.com
NatronX. . . . . . . . . . . . . . . . . . . . . . . . . . . . . . . . . . . . . . . . . . . . . . . . . . . . .26. . . . . . . .14 www.natronx.com
Nol-Tec Systems. . . . . . . . . . . . . . . . . . . . . . . . . . . . . . . . . . . . . . . . . . . . .46. . . . . . . .20 www.nol-tec.com
Paharpur. . . . . . . . . . . . . . . . . . . . . . . . . . . . . . . . . . . . . . . . . . . . . . . . . . . .23. . . . . . . .12 www.paharpur.com
Siemens . . . . . . . . . . . . . . . . . . . . . . . . . . . . . . . . . . . . . . . . . . . . . . . . . . . . 5 . . . . . . . . 3 www.siemens.com/energy/controls
Swan Analytical Instruments. . . . . . . . . . . . . . . . . . . . . . . . . . . . . . . . . .59. . . . . . . .23 www.swan.ch
TerraSource Global . . . . . . . . . . . . . . . . . . . . . . . . . . . . . . . . . . . . . . . . . . 9 . . . . . . . . 5 www.terrasource.com
Victory Energy. . . . . . . . . . . . . . . . . . . . . . . . . . . . . . . . . . . . . . . . . . . . . . .25. . . . . . . .13 www.victoryenergy.com
Winsted . . . . . . . . . . . . . . . . . . . . . . . . . . . . . . . . . . . . . . . . . . . . . . . . . . . . 63. . . . . . . . 25 www.winsted.com

7/22/2019 Power March 2014
http://slidepdf.com/reader/full/power-march-2014 80/82 www.powermag.com POWER |March 201476
COMMENTARY
Coal is currently the feedstock for nearly 40% of America’sbaseload electricity supply, and in communities and stateswhere coal has the highest utilization, utility bills are the
lowest. With more than two centuries of coal available in theUnited States, the government and power sector need to findways to maximize the use of this abundant natural resource inthe cleanest, most economical way possible—ensuring that all
families, businesses, and communities can benefit from reliable,affordable energy.Coal—and other fossil fuels—share a proud history, having
powered three industrial revolutions (including today’s technol-ogy revolution), increased life expectancy, improved the qualityof life, and brought hope to every civilization that has usedthese fuel sources. According to the U.S. government’s EnergyInformation Administration (EIA), coal will continue to be a sig-nificant feedstock for U.S. electricity and for power around theglobe for decades to come.
Policy ImplicationsAlthough the EIA’s prediction is based on past trends and future
anticipated use, poorly written and executed federal and statepublic policy could lead to constraints on domestic coal usewhich, in turn, would undoubtedly cause systemwide brownouts,blackouts, and price spikes.
Unfortunately, for American families and businesses, PresidentObama has increasingly abdicated his energy policy to leaders atthe Environmental Protection Agency (EPA), who are engaging inan assault on the U.S. coal industry. The recently released draftNew Source Performance Standards (NSPS) will—as written—im-pose a de facto ban on the construction of new technologicallyadvanced coal-fueled power plants. To meet the EPA’s stipulatedstandards, plants will be forced to use technologies that are notyet commercially or economically viable. Considering this trou-
bling precedent, we are even more concerned that a forthcomingrule on existing coal-fueled power plants could lead to the shut-tering of active units across the country.
It’s disconcerting that leaders at the EPA are ignoring thecoal-based industry, its hundreds of thousands of workers, andbusinesses and families across the country who rely on afford-able coal-powered energy for their livelihoods. Instead, they areworking behind the scenes, through secret emails and commu-nication, with environmental organizations like the Sierra Club,whose stated goal is to end coal-fueled energy in the U.S., towrite regulatory energy policy.
I simply cannot believe the president has considered thedeleterious consequences to our national security, our nation’s
economy, or families’ budgets should coal power plants go of-fline; if he has, he is consciously putting us on a dangerouspath. The nation’s power sector is already grappling with the
very ominous possibility that nearly 15% of the nation’s coal-generated electric capacity will be shut down over the nextdecade as 330 coal units are shuttered because of EPA’s exist-ing regulations. And, as we have seen over recent weeks, otherfuel sources cannot meet demand as reliably and as affordablyas coal. In short, we are on a collision course brought aboutby misguided policies that will cause an overreliance on less-
predictable energy sources.
Coal Technology ProgressRegrettably, much of the administration’s angst with coalis misplaced. Over the past 40 years, the coal industry hasinvested more than $130 billion in new technologies thathave reduced emissions by 90%. And we’re committed todoing more.
I’m excited to see the slate of more than 15 new clean coaltechnologies come online in promising projects like the PrairieState Energy Campus in Illinois and John W. Turk, Jr. Plant inArkansas. I believe these next-generation applications will begame-changers for the coal power industry—as long as the gov-
ernment allows us to succeed.We stand ready to work with government officials andregulatory agencies to ensure a smart path forward thatsupports the clean use of coal in the years ahead. If thepresident and others in the administration refuse to workwith us, however, and instead put Americans’ economic andenergy security at risk, the coal-based electric industry isready to use every resource available to fight onerous andoverzealous regulations that would harm our industry, oureconomy, and our nation.
It’s not just one American industry that is at risk; it’s Ameri-ca’s way of life. ■
— Mike Duncan is president and CEO of the American Coalition
for Clean Coal Electricity (ACCCE).
America Needs Continued
Coal Use
Mike Duncan
Interested in Coal Power?
If the business of coal-fired generationis your business, you can find all coal-related stories at powermag.com byclicking the Coal button. While you’rethere, you can sign up for the monthlyCOAL POWER Direct eletter using theSubscribe button at the top right of
the homepage.

7/22/2019 Power March 2014
http://slidepdf.com/reader/full/power-march-2014 81/82
Coming to in April…
The premium showcase for
the latest products and
technologies in the power
generation industry.
To subscribe to the e-letter, please Contact
Cristane Martin

7/22/2019 Power March 2014
http://slidepdf.com/reader/full/power-march-2014 82/82
Advanced
MD&A brings advanced turbine weld repair technologies to the steam and gas turbine-
generator marketplace by utilizing submerged arc welding (SAW) and gas tungsten arc
welding (GTAW) processes. MD&A is capable of providing full turnkey weld repair and
Performing
Turbine weld repair


