Poverty in Perspective Statistics South Africa
34
Poverty in Perspective Statistics South Africa Contextualizing Poverty and Inequality in the WC, with further emphasis on the generational and endemic nature of poverty as it affects women and the girl child in the WC
Transcript of Poverty in Perspective Statistics South Africa

Poverty in
Perspective
Statistics South
Africa
Contextualizing Poverty and Inequality in the WC, with further
emphasis on thegenerational and endemic nature
of poverty as it affects women and the girl child in the WC

South Africa’s population, mid-2020 is
59,62 million
2

15,49 M
11,53 M
7,01 M 6,73 M5,85 M
4,68 M4,11 M
2,93 M
1,29 M
25,8%
GP
KZN
WC EC LP
MP
More than half of the population live in 3 provinces (GP,KZN and WC)
WC has close to 7 million inhabitants
26,0% 19,3% 11,8% 11,3% 9,8% 7,8% 6,9% 4,9% 2,2%
NW FS
NC
57,1%
Mid-year population estimates for South
Africa by province, 2020
3

The districts shown represented around 11% of the population of
WC
Mid Year Population Estimates for 2021 District Projections based on 2020 Series
4

49,3% 50,7%
Approximately 50,7% of the population in the WC is
female.
WC population, mid-2020
by sex
Source: Mid-year population estimates for South Africa by province, 2020
5

49,4%
47,2%
49,5%
50,5%
49,5%
47,8%
50,6%
52,8%
50,5%
49,5%
50,5%
52,2%
WC - Cape Winelands District Municipality (DC2)
WC - Central Karoo District Municipality (DC5)
WC - City of Cape Town Metropolitan Municipality
WC - Overberg District Municipality (DC3)
WC - West Coast District Municipality (DC1)
WC- Garden Route (DC4)
Overberg DM has a slightly lower proportion of Females
than males
Mid Year Population Estimates District Projections based on 2020Series
6

24,5%
27,7%
28,6%
31,1%
31,5%
32,4%
35,2%
36,1%
36,6%
39,2%
8,5%
10,3%
9,1%
9,9%
9,0%
10,2%
8,1%
7,9%
11,4%
8,9%
GP
WC
SA
FS
NW
NC
KZN
MP
EC
LP
Children under 15 within
each province
Elderly (60+) within
each province
67,0%
62,0%
62,3%
59,0%
59,5%
57,4%
56,6%
56,0%
52,0%
51,8%
Youth and Adult
WC has around 62% Youth and Adults (15-59) within the
Province
Population by age category and province, 2020
7

Source: Stats SA: Mid-year population estimates 2018
41,0%
49,1%
45,0%
44,2%
42,5%
42,0%
46,5%
40,0%
32,2%
36,3%
20,7%
19,8%
29,1%
29,6%
31,3%
32,7%
25,6%
38,3%
52,9%
48,5%
3,7%
5,7%
2,4%
4,0%
2,9%
4,0%
5,4%
2,4%
3,2%
3,6%
34,6%
25,5%
23,5%
22,2%
23,4%
21,3%
22,4%
19,2%
11,8%
11,5%
EC
KZN
LP
FS
NW
RSA
MP
NC
GP
WC
Nationally, 42 per cent lived with mothers only. WC had the lowest proportion of
children living with neither parent Children in affluent provinces were most likely to live with both
parents. Children's living arrangements was likely to affect their performance at school.
Lived with neither Lived with mother Lived with both Lived with father
Percentage of children living
arrangements, 2019
8

15,5%
17,6%
22,0%
22,7%
23,4%
26,9%
27,0%
28,5%
29,7%
34,4%
31,7%
20,6%
40,6%
41,9%
40,6%
38,4%
48,4%
49,6%
53,6%
54,4%
GP
WC
RSA
MP
KZN
NC
NW
FS
LP
EC
Female Male
20,6% of Female headed households in WC do not have an
employed household member
Households without and employed household member by sex of household head, 20109
Source: Marginal Groups Indicator Report 2019
9

Of those employed in the WC Females accounted for
41,3% of those in Managerial occupations
Source: QLFS Q4:2020
10
100,0
41,2
16,1
8,3
11,3
50,1
76,7
57,8
45,6
41,3
45,9
58,8
83,9
91,7
88,7
49,9
23,3
42,2
54,4
58,7
54,1
0,0 10,0 20,0 30,0 40,0 50,0 60,0 70,0 80,0 90,0 100,0
Domestic worker
Elementary
Plant and machine operator
Craft and related trade
Skilled agriculture
Sales and services
Clerk
Technician
Professional
Manager
Total
Women Men

Around 21% of
WC Population is
considered poor
based on the Lower
Bound Poverty Line.
(Money metric Poverty)
Source: Poverty Trend Report
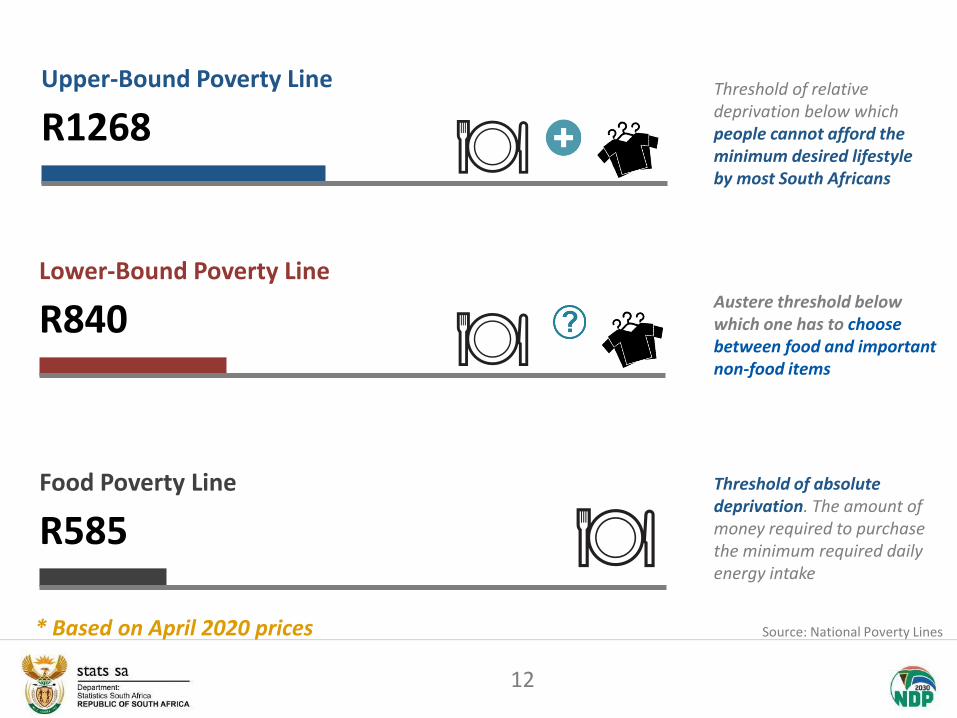
Threshold of absolute deprivation. The amount of money required to purchase the minimum required daily energy intake
Food Poverty Line
R585
Austere threshold below which one has to choose between food and important non-food items
Lower-Bound Poverty Line
R840
Upper-Bound Poverty Line
R1268Threshold of relative deprivation below which people cannot afford the minimum desired lifestyle by most South Africans
* Based on April 2020 prices Source: National Poverty Lines
12

Upper-Bound Poverty Line Lower-Bound Poverty Line
Food Poverty Line
Source: Living Conditions Survey
Is the Rand value below which individuals are unable to purchase or consume enough food to supply them with minimum per-capita-per-day energy requirement for good health
Provides an austere threshold below which one has to choose between food and important non-food items
Provides an unambiguous threshold of relative deprivation below which people cannot afford the minimum lifestyle desired by most South Africans
National Figure
WC Money-metric Poverty headcounts in 2015
Non Poor -62,9%
Poor -37,1%
Non Poor- 78,7%
Poor -21,3%
Non Poor -90,0%
Poor -10,0%
13

The South African
Multidimensional Poverty
indicators provide a more
holistic view of poverty
14
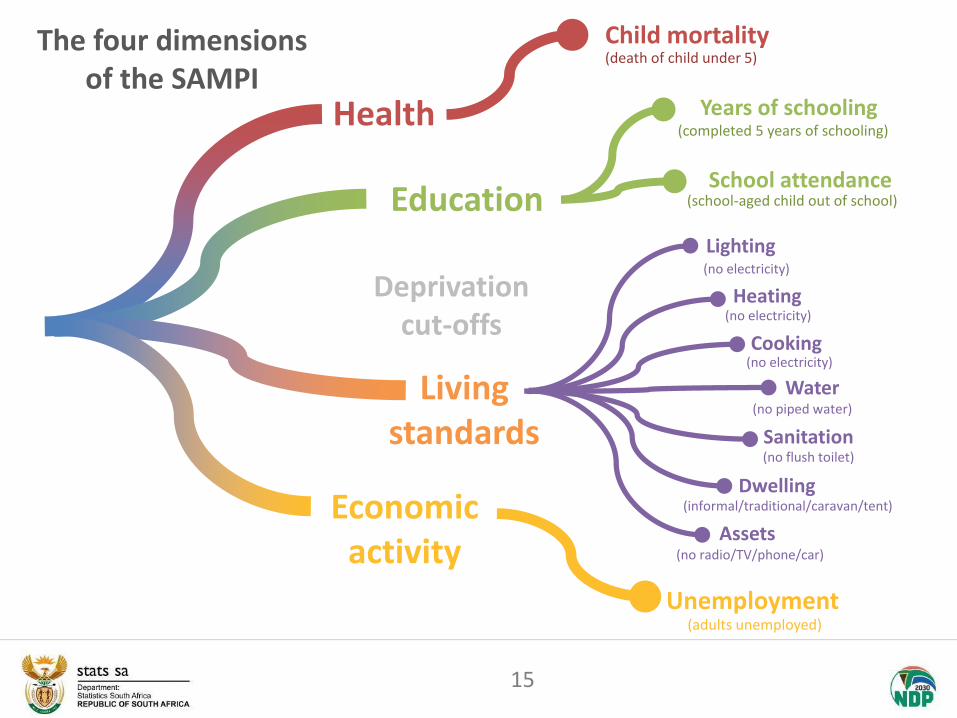
Health
Education
Child mortality
Years of schooling
School attendance
The four dimensions of the SAMPI
Living standards
Lighting
Heating
Cooking
Water
Sanitation
Economic activity
Unemployment
Dwelling
Assets
(death of child under 5)
(completed 5 years of schooling)
(school-aged child out of school)
(no electricity)
(no electricity)
(no electricity)
(no piped water)
(informal/traditional/caravan/tent)
(no flush toilet)
(no radio/TV/phone/car)
(adults unemployed)
Deprivation cut-offs
15

17
,9%
8,0
%
7,0
%
6,7
%
3,6
%
2,7
%
2001 2002 2003 2004 2005 2006 2007 2008 2009 2010 2011 2012 2013 2014 2015 2016
RSA
Western Cape
RSA
Multidimensional Poverty by Geographic Various levels 2001-2016
SAMPI
SourceThe South African MPI
WC had significantly lower levels of multidimensional poverty than
the SA average over the three periods
16

2,64%
2,90%
Overberg
West Coast
In 2016 West Coast DM had the highest rate of multidimensional
poverty of the two districts shown.
DIS
TRIC
T
Multidimensional Poverty by District in WC 2016
17

CS 2016
4052
33
10 Years
5 Years
Multidimensional Poverty Drivers
SourceThe South African MPI
18

39%
55%
70%
13%
11%
3%
38%
20%
10%
6%
11%
11%
4,4
3
5,7
0 10 20 30 40 50 60 70 80 90 100
EC
LP
FS
NW
MP
KZN
NC
RSA
GP
WC
Salaries Remittances Other SourcesGrantsPensions
Percentage distribution of sources of household income by province, 2019
Grants remain A significant source of income for SA households, particularly
in rural areas, 70% of household income is sourced from salaries in WC
Source: GHS 2019
19

Service Delivery
20

In 2019 WC was above the national average in households connected to
mains electricity with 88,4%
21

WC had the highest levels of households with improved access to sanitation
22

96,5% of households in the West Coast main source of water for drinking was delivered via a piped connection
Water Electricity Sanitation
West Coast 96,5% 94,1% 92,5%
Overberg 97,9% 94,6% 95,7%
main source of water for drinking delivered via a
piped connection
access to a flush or chemical toilet
connected to the mains electricity supply
Source: Community Survey 2016.
23

Vulnerable Groups are defined as
a part of the South
African population that
experience a higher risk
of poverty and
social exclusion than the
general population.
Women are amongst
these groups
24

3,6%
4,9%
13,4%
13,8%
13,8%
16,6%
18,2%
18,6%
24,1%
27,9%
Western Cape
Gauteng
North West
Northern Cape
South Africa
Free State
Mpumalanga
KwaZulu-Natal
Limpopo
Eastern Cape
WC has the lowest proportion of agricultural households at 3,6%
within the province
Provincial profile: Community Survey 2016], Report number 03-01-15
25

3,9
%
6,8
%
9,4
%
9,7
%
10
,0%
12
,4%
12
,6% 1
4,6
% 16
,2% 1
8,2
%
4,7
%
9,5
%
6,3
%
11
,1%
13
,8%
11
,1%
15
,5%
16
,4%
15
,4%
19
,0%
0%
2%
4%
6%
8%
10%
12%
14%
16%
18%
20%
LP GP EC RSA KZN WC MP FS NW NC
Male Female
In 2019 WC had 11.1% of female headed households that reported
suffering from hunger
Source: Marginal Groups Indicator Report 2019
Households that reported hunger
26

Percentage of households that ran out of money to buy food in
the past 12 months by sex of household head, CS 2016
MP
MH
H
MP
FH
H
12,1%
11,5%
15,0%
12,6%
14,6%
11,7%
15,5%
15,0%
14,4%
17,2%
16,6%
18,2%
14,1%
18,5%
Western Cape
CPT: City of CapeTown
DC1: West Coast
DC2: CapeWinelands
DC3: Overberg
DC4: GardenRoute
DC5: CentralKaroo
Female-headedhouseholdMale-headedhousehold
18,2% of Female-headed households in Overberg DM are likely to
run out of money to buy food.
Source: CS 2016
27

Gender pay gap examined, findings from the
Quarterly Labour Force Survey
28

In 2018 women’s median monthly earnings were 76%
of men's median monthly earnings
29

66,2%
71,4%
71,4%
74,3%
75,0%
75,0%
81,6%
85,7%
86,9%
Limpopo
Northern Cape
KwaZulu-Natal
Free State
North West
Mpumalanga
Gauteng
Eastern Cape
Western Cape
Earnings at Parity
Female Median Earnings more
Female Median Earnings Less
In the WC Females earned 86,9% of men’s median
monthly earnings in 2018
Median Female Earnings as a % of
Median Male Earnings 2018, QLFS
Source: QLFS 2018
Male
Female
30

Source: Stats SA: Mid-year population estimates 2018
Experience of violence
31

Source: Stats SA: Mid-year population estimates 2018
Source: SADHS 2016
21%
17%
6%
8%
9%
2%
Physical violence
Emotional Violence
Sexual violence
Ever Experienced
In the past 12 months
One in five (21%) partnered women has experienced physical
violence by a partner (Ever Experienced)
Experience of violence by any partner, women 18+ years
32

Source: Stats SA: Mid-year population estimates 2018
Ever- experience of partner violence is at 21% in WC for physical
violence.
Experience of physical violence by any partner, women 18+ years by province
33
14%
14%
18%
19%
21%
21%
26%
30%
31%
KwaZulu-Natal
Limpopo
Gauteng
Northern Cape
Western Cape
Free State
Mpumalanga
North West
Eastern Cape
13%
13%
13%
16%
20%
21%
21%
28%
24%
3%
5%
8%
5%
4%
8%
7%
12%
7%
Ever experienced sexual violence
Ever experienced physical violence
Ever experienced emotional violence

Thank You