
POVERTY AND LABOUR MARKET RESPONSE TO REFORMS IN …
103
POVERTY AND LABOUR MARKET RESPONSE TO REFORMS IN UGANDA BY FRANCIS NATHAN OKURUT SARAH N. SSEWANYANA ASAF ADEBUA A final report submitted to the African Economic Research Consortium (AERC), September 2006
Transcript of POVERTY AND LABOUR MARKET RESPONSE TO REFORMS IN …
POVERTY AND LABOUR MARKET RESPONSE TO REFORMS IN UGANDA
BY
FRANCIS NATHAN OKURUT SARAH N. SSEWANYANA
ASAF ADEBUA
A final report submitted to the African Economic Research Consortium (AERC), September 2006

i
Abbreviations and Acronyms
BoU Bank of Uganda
CPI Consumer Price Index
EPR Employment-to-population rate
ERP Economic Recovery Programme
FIS Financial Institutions Statute
GDP Gross Domestic Product
HIPC Highly Indebted Poor Countries
IMF International Monetary Fund
LPR Labour Participation Rate
MFI Microfinance Institutions
MoFPED Ministry of Finance, Planning and Economic Development
MTCS Medium Term Competitiveness Strategy
PEAP Poverty Eradication Action Plan
PHC Primary Health Care
PMA Plan for Modernisation of Agriculture
TB Treasury Bill
UBoS Uganda Bureau of Statistics
UCB Uganda Commercial Bank
UPE Universal Primary Education
URA Uganda Revenue Authority
UShs Uganda Shillings
ii
Table of Contents
Abbreviations and Acronyms ...............................................................................................i Table of Contents.................................................................................................................ii List of Tables ......................................................................................................................iv List of Figures ......................................................................................................................v List of Figures ......................................................................................................................v Abstract ...............................................................................................................................vi 1. Introduction..................................................................................................................1 2. Uganda’s Economic Performance................................................................................3
2.1 Macroeconomic performance ..............................................................................3 2.2 Poverty and income inequality trends..................................................................5 2.2 Economic reforms and the labour market ............................................................8 2.3 Economic reforms and poverty reduction..........................................................13
3. Review of literature....................................................................................................15 3.1 Theoretical considerations .................................................................................15
3.1.1 Importance of labour markets ...................................................................15 3.1.2 Impact of reforms on the labour market ....................................................16
3. 2 Empirical evidence.............................................................................................17 3.2.1 Labour market participation.......................................................................17 3.2.2 Employment creation .................................................................................18 3.2.3 Wages.........................................................................................................19 3.2.4 Structural labour shifts...............................................................................20 3.2.5 Poverty outcomes.......................................................................................22
4. Data ............................................................................................................................24 5. Labour market, employment and poverty: A characterization ..................................26
5.1 Structure of the labour market and trends..........................................................26 5.2 Employment structure and trends ......................................................................34
5.2.1 Structure of employment by social grouping.............................................34 5.2.2 Occupational structure ...............................Error! Bookmark not defined. 5.2.3 Wage employment .....................................Error! Bookmark not defined. 5.2.4 Wages in paid employment........................................................................55 5.2.5 Unemployment...........................................................................................52
5.3 Linking labour market, employment, growth and povertyError! Bookmark not defined.
6. Employment choice ...................................................................................................66 6.1 Model specification............................................................................................66 6.2 Estimation issues................................................................................................67 6.3 Results................................................................................................................68
7. Wage determination ...................................................................................................74 7.1 Model specification............................................................................................74 7.2 Estimation issues................................................................................................75 7.3 Results................................................................................................................75
8. Wage decomposition..................................................................................................80 8.1 Methods..............................................................................................................80 8.2 Results................................................................................................................81
9. Summary and conclusion...........................................................................................84 9.1 Employment.............................................................................................................84 9.2 Wages.......................................................................................................................86

iii
References..........................................................................................................................89
iv
List of Tables
Table 1: Uganda: Policy variables .......................................................................................4 Table 2: Uganda: Annual average growth rates of GDP .....................................................4 Table 3: Uganda: Poverty headcount trends .......................................................................6 Table 4: Uganda: Gini coefficient, 1992/93 – 2002/3 .........................................................7 Table 5: Mean real monthly expenditure per adult equivalent and inequality ....................8 Table 6: Labour force of persons aged 15-64 years...........................................................27 Table 7: Labour participation rates of the population 15-64 years (%).............................30 Table 8: Employment-to-population and growth rates ......................................................32 Table 9: Sectoral composition of the workforce aged 15-64 years ...................................36 Table 10: Share of employment status within each sector by social grouping..................40 Table 11: Wage employment by geographical location ....................................................43 Table 12: Growth rates (%) p.a in wage employment by sector........................................44 Table 13: Share of private sector in wage employment (%)..............................................45 Table 14: Share of workforce by occupation and gender ..................................................46 Table 15: Employment – to – population rates by income quintiles and age cohort.........48 Table 16: Incidence of poverty in the workforce 15-64 years ...........................................50 Table 17: Household poverty status and labour market activity status .............................52 Table 18: Unemployment of persons 15-64 years by gender, 2002 ..................................54 Table 19: Unemployment among persons aged 15-64 years by poverty status, 2002.......55 Table 20: Trends in real wages (1997=100) in wage employment in Uganda ..................57 Table 21: Annualized growth rates in real wages for wage employees.............................60 Table 22: Real wage inequality, 1992-2002 ......................................................................62 Table 23: Relative mean wage and Gini coefficient, 1992-2002.......................................63 Table 24: Between and within Theil decomposition of real wages ...................................64 Table 25: Multinominal logit marginal effect estimates for employment choice, 1992....70 Table 26: Multinomial logit marginal effect estimates for employment choice, 1999......71 Table 27: Multinomial logit marginal effect estimates for employment choice, 2002......72 Table 28: Sample-corrected log. real monthly wages estimates by sector, 1992 ..............76 Table 29: Sample-corrected log. real monthly wages estimates by sector, 1999 ..............77 Table 30: Sample-corrected log. real monthly wages estimates by sector, 2002 ..............78 Table 31: Wage decomposition with selection ..................................................................81 Table 32: Relative contribution of characteristics to the wage differential .......................83

v
List of Figures
Fig. 1: Educational attainment of the labour force 15-64 years by gender (%).................28 Fig. 2: Educational attainment of the labour force aged 25-29 years (%) .........................28 Fig. 3: Employment-to-population rates by age (%) .........................................................33 Fig. 4: Employment-to-population rates by age and gender (%).......................................33 Fig. 5: Growth rates in employment status (%) .................................................................37 Fig. 6: Employment status by gender (%) .........................................................................38 Fig. 7: Share of workforce in wage employment by expenditure quintile.........................51 Fig. 8: Mean years of schooling for the workforce by quintile .........................................51
vi
Abstract
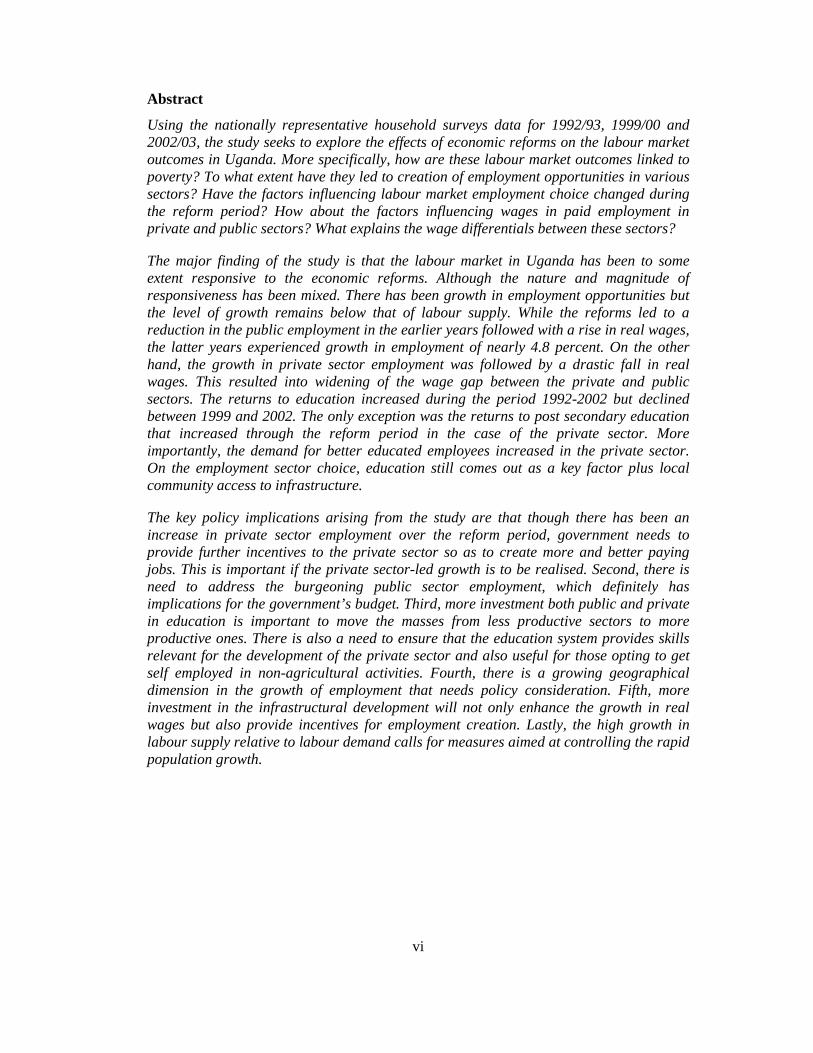
Using the nationally representative household surveys data for 1992/93, 1999/00 and 2002/03, the study seeks to explore the effects of economic reforms on the labour market outcomes in Uganda. More specifically, how are these labour market outcomes linked to poverty? To what extent have they led to creation of employment opportunities in various sectors? Have the factors influencing labour market employment choice changed during the reform period? How about the factors influencing wages in paid employment in private and public sectors? What explains the wage differentials between these sectors?
The major finding of the study is that the labour market in Uganda has been to some extent responsive to the economic reforms. Although the nature and magnitude of responsiveness has been mixed. There has been growth in employment opportunities but the level of growth remains below that of labour supply. While the reforms led to a reduction in the public employment in the earlier years followed with a rise in real wages, the latter years experienced growth in employment of nearly 4.8 percent. On the other hand, the growth in private sector employment was followed by a drastic fall in real wages. This resulted into widening of the wage gap between the private and public sectors. The returns to education increased during the period 1992-2002 but declined between 1999 and 2002. The only exception was the returns to post secondary education that increased through the reform period in the case of the private sector. More importantly, the demand for better educated employees increased in the private sector. On the employment sector choice, education still comes out as a key factor plus local community access to infrastructure.
The key policy implications arising from the study are that though there has been an increase in private sector employment over the reform period, government needs to provide further incentives to the private sector so as to create more and better paying jobs. This is important if the private sector-led growth is to be realised. Second, there is need to address the burgeoning public sector employment, which definitely has implications for the government’s budget. Third, more investment both public and private in education is important to move the masses from less productive sectors to more productive ones. There is also a need to ensure that the education system provides skills relevant for the development of the private sector and also useful for those opting to get self employed in non-agricultural activities. Fourth, there is a growing geographical dimension in the growth of employment that needs policy consideration. Fifth, more investment in the infrastructural development will not only enhance the growth in real wages but also provide incentives for employment creation. Lastly, the high growth in labour supply relative to labour demand calls for measures aimed at controlling the rapid population growth.
1
1. Introduction
Since the mid-1980s Uganda has been implementing International Monetary Fund (IMF)/World Bank sponsored reforms including liberalization of agricultural output marketing, financial sector liberalization, privatization of state enterprises, decentralization, and civil service reforms (see Appendix 1). The reforms were adopted so as to eliminate the distortions in the factor and product markets so as to enhance the market mechanisms in the mobilization and allocation of resources to promote sustainable economic growth. One of the expected outcomes of economic growth was a reduction in poverty.
Recent studies in Uganda have investigated the relationship between economic growth, poverty and income inequality over the structural adjustment period. Deininger & Okidi (2003) noted that income growth and poverty reduction were significantly influenced by agricultural output (coffee) prices, access to basic education, and health care. The implication was that there was a benefit from liberalization of agricultural prices.
A decomposition of poverty into growth and inequality components (over the period 1992/93 and 2002/03) suggested that annual per capita consumption which increased by about 5 percent was accompanied by an annual reduction in the headcount poverty index of approximately 6.6 percent (Okidi et al. 2005). On the other hand, income inequality, as measured by the Gini coefficient, has been increasing over time from 0.36 in 1992/93 to 0.43 in 2002/03. Income inequality was observed to be significantly influenced by community level characteristics and educational attainment, implying that service delivery and quality are critical to attain growth re-distribution (Ssewanyana et al., 2005).
According to Lawson et al. (2003), the probability of being non-poor is positively and significantly influenced by education level and being employed in a non-agricultural sector. However, the probability of being non-poor is negatively and significantly influenced by household size and regional location. Okidi & Mckay (2003) argued that chronic poverty is not only location specific, but also depends on initial household characteristics (such as, human capital and asset endowments). The conclusion from this study suggested that the market oriented development policies that explain the success of Uganda’s macroeconomic performance seem not to have been translated into significant benefits for the chronically poor.
Empirical evidence from other developing countries on the effect of economic reforms on employment and wages seem to vary by country. For instance, reforms led to increased unemployment (Marquette, 1997 on Zimbabwe); created more informal private sector employment opportunities (Wells & Wall, 2003 on Kenya & Tanzania; Daniels, 1999 on Kenya); structural shift in labour away from agriculture; a rise in private sector real wage (Dercon et al., 2005 on Ethiopia); a fall in real private sector wages (Teal, 2000a on Ghana; Appleton et al., 1999 on Kenya; Riveros & Sanchez, 1990 on Argentina); increase in female participation (Lanot & Muller, 1997 on Cameroon; Appleton et al, 1999 on Kenya).
The limited empirical research on the link between economic reforms, labour markets, and poverty reduction in Uganda provided the motivation for this study. While Bigsten & Kayizzi-Mugerwa (1999) investigated the effect of reforms on labour market outcomes in Uganda (in terms of labour market participation and wages), the analysis was based on a
2
small random sample of households limited to the districts of Masaka and Kampala. With the benefit of the 1992/93, 1999/00 and 2002/03 nationally representative household surveys, we are able to extend Bigsten & Kayizzi-Mugerwa (1999) study on Uganda. Thus, adding value in terms of empirical evidence both in the national context and changes over time. Specifically, this study sought to answer the following questions. How have economic reforms influenced the labour market outcomes in Uganda? More specifically, how are these labour market outcomes linked to poverty? To what extent have these reforms generated employment opportunities in the various sectors? Have the factors influencing employment choice changed through the economic reform period? How about the factors influencing wages in paid employment in private and public sectors? What explains the wage differentials between these sectors? The findings do provide insights into how the economic reforms have been transmitted to household welfare through the labour markets.
The remainder of the report is structured as follows. In the next section we present an overview of Uganda’s economic performance and the reforms implemented with a specific focus on their potential implications on the labour market and poverty. Section 3 examines the theoretical framework of the relationship between economic reforms, labour markets and poverty outcomes. Basically this section highlights the channels through which the reforms are transmitted to household welfare through the market mechanism. This section also presents the empirical evidence from other sub-Saharan African countries on the impact of economic reforms on the labour market and poverty. Section 4 presents data sources and their limitations. Characterization of the labour market, employment and poverty is the subject of section 5. The employment choice results are presented and discussed in section 6 prior to wage determination in section 7. Using the results of the wage determination in section 7 we proceed to present and discuss the wage decomposition results in section 8. Section 9 is conclusions and implications for policy.
3
2. Economic performance, poverty and reforms
2.1 Macroeconomic performance
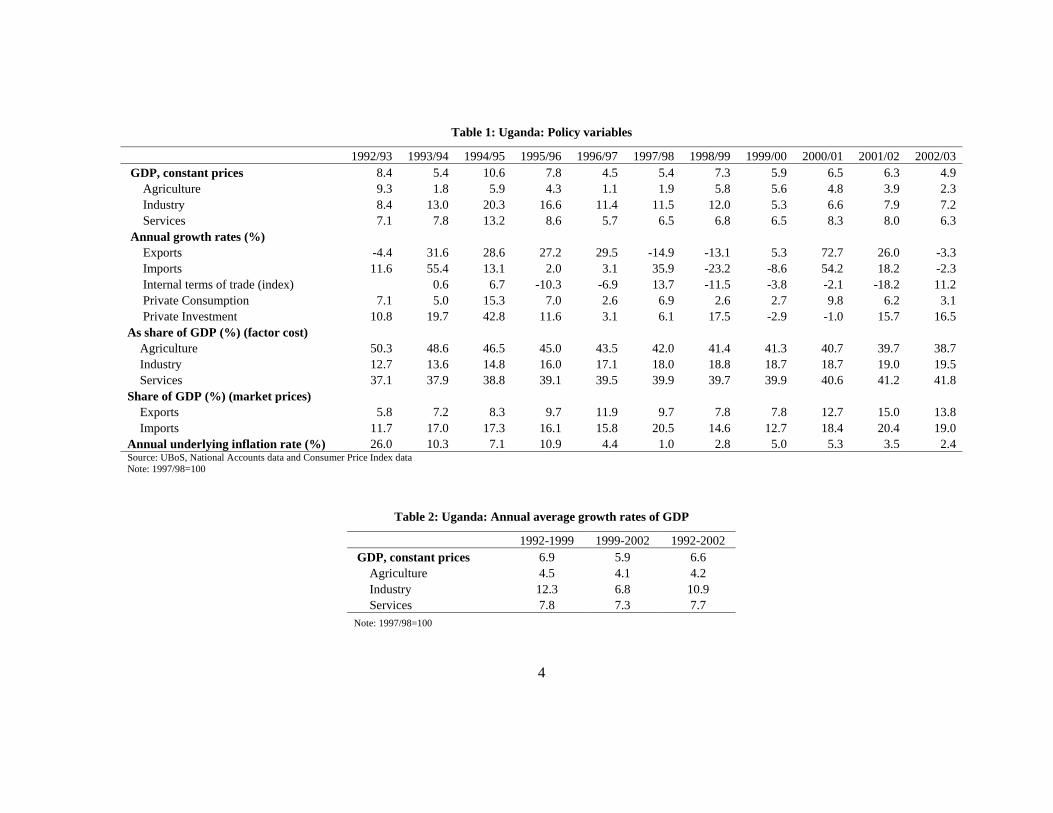
The 1990s were characterized by strong economic growth, party driven by external and internal shocks. These shocks had both positive and negative effect on the performance of the economy. Table 1 presents some policy variables for the period 1992-2002. On average, the real Gross Domestic Product (GDP) grew by 6.6 (Table 2 refers) but as shown in Table 1 there are yearly fluctuations in GDP. All sectors, on average experienced positive growth. Over a 11 year-period, growth in agriculture averaged 4.2 percent; services 7.7 percent and industry 10.9 percent. But these aggregate figures conceal a lot of policy relevant information. During the 1990s the industry sector recorded growth rates that were above 10 percent but later declined to a single digit. Unlike the other sector, agriculture registered growth rates well below the national average GDP. The poor performance of the agricultural sector largely explains the slow down in the economy since 1999/2000. We observe higher than average growth rates in the services sector, a non-tradable sector associated with internal demand.
The average annual underlying inflation was maintained at a one digit level (Table 1 refers). It has been kept in check, even declined during the period when poverty was on the rise. The government’s inflation target of 5 percent seems to have been achieved by 2002/03. Other notable features were the deteriorating internal terms of trade, associated in part with a fall in crop prices relative to prices of the goods and services; and positive growth, although at a decreasing rate, in private consumption.
The stock of Uganda’s debt stood at about US$4.3 billion as at June 2004, which was an increase as compared to US$3.6 billion in 1999/00. The ratio of debt service to exports of goods and non-factor services, which in effect measures the amount of foreign exchange earnings foregone in servicing the debt, fell from 22 percent in 1999/00 to 19 percent in 2003/04. The ratio of debt service to domestic revenue, which measures the fiscal burden of servicing the external debt, remained constant at 20 percent both in 1999/00 and 2003/04 (MoFPED, 2004).
The large foreign exchange in-flows in the form of external official grants and private transfers into the Uganda economy continues to stabilize the foreign exchange rate and increase the import cover of foreign reserves over the structural adjustment period. The HIPC relief funds have continued to be a major source of external aid which rose from US$57 million in 1999/00 to US$83 million in 2003/04 (MoFPED, 2004). It should be noted that Uganda was vetted as a “success story” by IMF/World Bank for implementation of economic reforms and this explains why Uganda qualified for the HIPC Debt Relief Initiative. However, it is only fair to say that the “success story” concept was based primarily on macro-economic and poverty indicators but not on reduction of income inequality.
4
Table 1: Uganda: Policy variables
1992/93 1993/94 1994/95 1995/96 1996/97 1997/98 1998/99 1999/00 2000/01 2001/02 2002/03 GDP, constant prices 8.4 5.4 10.6 7.8 4.5 5.4 7.3 5.9 6.5 6.3 4.9
Agriculture 9.3 1.8 5.9 4.3 1.1 1.9 5.8 5.6 4.8 3.9 2.3 Industry 8.4 13.0 20.3 16.6 11.4 11.5 12.0 5.3 6.6 7.9 7.2 Services 7.1 7.8 13.2 8.6 5.7 6.5 6.8 6.5 8.3 8.0 6.3
Annual growth rates (%) Exports -4.4 31.6 28.6 27.2 29.5 -14.9 -13.1 5.3 72.7 26.0 -3.3 Imports 11.6 55.4 13.1 2.0 3.1 35.9 -23.2 -8.6 54.2 18.2 -2.3 Internal terms of trade (index) 0.6 6.7 -10.3 -6.9 13.7 -11.5 -3.8 -2.1 -18.2 11.2 Private Consumption 7.1 5.0 15.3 7.0 2.6 6.9 2.6 2.7 9.8 6.2 3.1 Private Investment 10.8 19.7 42.8 11.6 3.1 6.1 17.5 -2.9 -1.0 15.7 16.5
As share of GDP (%) (factor cost) Agriculture 50.3 48.6 46.5 45.0 43.5 42.0 41.4 41.3 40.7 39.7 38.7 Industry 12.7 13.6 14.8 16.0 17.1 18.0 18.8 18.7 18.7 19.0 19.5 Services 37.1 37.9 38.8 39.1 39.5 39.9 39.7 39.9 40.6 41.2 41.8
Share of GDP (%) (market prices) Exports 5.8 7.2 8.3 9.7 11.9 9.7 7.8 7.8 12.7 15.0 13.8 Imports 11.7 17.0 17.3 16.1 15.8 20.5 14.6 12.7 18.4 20.4 19.0
Annual underlying inflation rate (%) 26.0 10.3 7.1 10.9 4.4 1.0 2.8 5.0 5.3 3.5 2.4 Source: UBoS, National Accounts data and Consumer Price Index data Note: 1997/98=100
Table 2: Uganda: Annual average growth rates of GDP
1992-1999 1999-2002 1992-2002 GDP, constant prices 6.9 5.9 6.6
Agriculture 4.5 4.1 4.2 Industry 12.3 6.8 10.9 Services 7.8 7.3 7.7
Note: 1997/98=100
5
In terms of production structure, the pattern of economic growth was characterized by a gradual decline in the share of production accounted for by the agricultural sector (Table 1 refers). Nonetheless, the Ugandan economy continues to be heavily dependent on agriculture. While the share of agriculture in total GDP declined from 50.3 percent in 1992/93 to 38.7 percent in 2002/03, it still constitutes a major source of livelihood for the majority of the population. This underscores the potential role of economic reforms in improving the welfare of small-holder farmers in the export crop production sector through increased producer prices. The analysis so far reveals that there has been a structural transformation in the economy away from agriculture with relative increases in the shares of the other sectors in GDP.
2.2 Poverty and income inequality trends
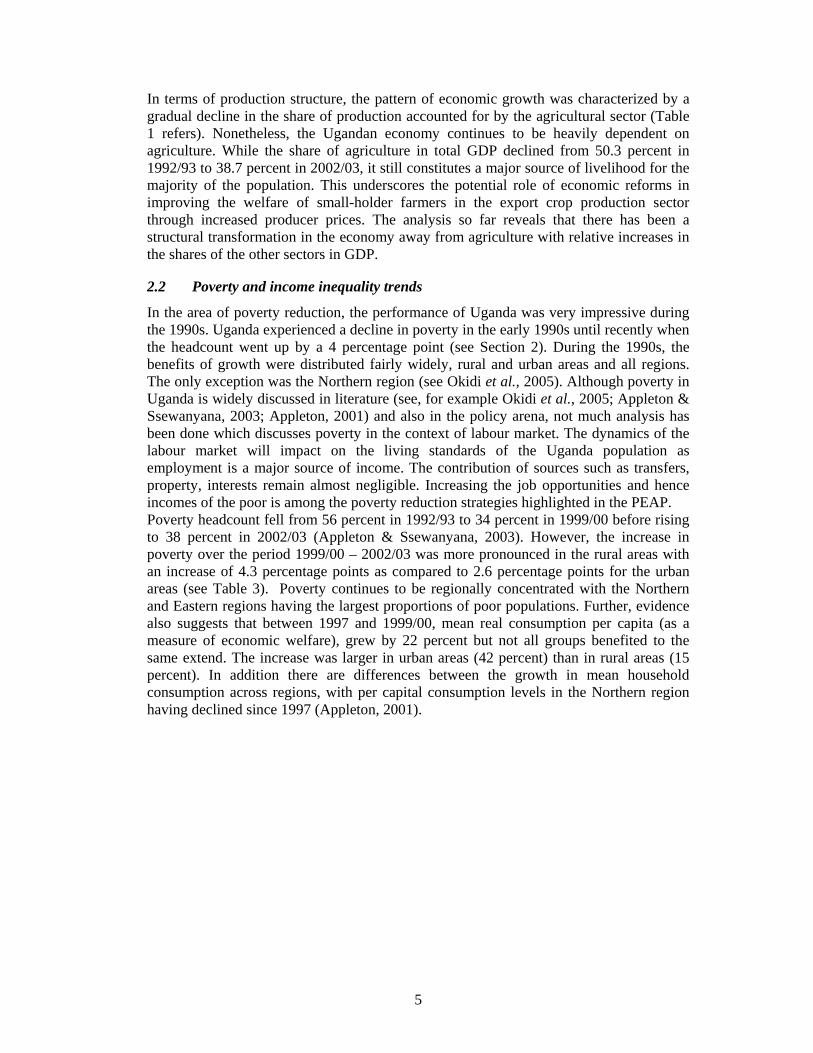
In the area of poverty reduction, the performance of Uganda was very impressive during the 1990s. Uganda experienced a decline in poverty in the early 1990s until recently when the headcount went up by a 4 percentage point (see Section 2). During the 1990s, the benefits of growth were distributed fairly widely, rural and urban areas and all regions. The only exception was the Northern region (see Okidi et al., 2005). Although poverty in Uganda is widely discussed in literature (see, for example Okidi et al., 2005; Appleton & Ssewanyana, 2003; Appleton, 2001) and also in the policy arena, not much analysis has been done which discusses poverty in the context of labour market. The dynamics of the labour market will impact on the living standards of the Uganda population as employment is a major source of income. The contribution of sources such as transfers, property, interests remain almost negligible. Increasing the job opportunities and hence incomes of the poor is among the poverty reduction strategies highlighted in the PEAP. Poverty headcount fell from 56 percent in 1992/93 to 34 percent in 1999/00 before rising to 38 percent in 2002/03 (Appleton & Ssewanyana, 2003). However, the increase in poverty over the period 1999/00 – 2002/03 was more pronounced in the rural areas with an increase of 4.3 percentage points as compared to 2.6 percentage points for the urban areas (see Table 3). Poverty continues to be regionally concentrated with the Northern and Eastern regions having the largest proportions of poor populations. Further, evidence also suggests that between 1997 and 1999/00, mean real consumption per capita (as a measure of economic welfare), grew by 22 percent but not all groups benefited to the same extend. The increase was larger in urban areas (42 percent) than in rural areas (15 percent). In addition there are differences between the growth in mean household consumption across regions, with per capital consumption levels in the Northern region having declined since 1997 (Appleton, 2001).
6
Table 3: Uganda: Poverty headcount trends
1992/93 1997 1999/00 2002/03
Uganda 55.7 45.0 33.8 37.7
Place of residence:
Rural 59.7 49.2 37.4 41.7
Urban 27.8 16.7 9.6 12.2
Region:
Central 45.6 27.9 19.7 22.3
Eastern 58.8 54.3 35.0 46.0
Northern 72.2 60.9 63.6 63.3
Western 53.1 42.8 26.2 31.4
Sector of employment:
Crop agriculture 63.6 53.0 39.1 50.4
Non-crop agriculture 52.4 37.0 41.9 33.6
Mining & construction 36.5 25.3 25.7 23.0
Manufacturing 44.4 36.4 23.3 28.4
Trade 26.5 20.5 12.7 17.4
Transport & communication 34.5 28.0 13.8 18.3
Public services 36.8 22.0 15.4 12.6
Other services 29.5 30.8 16.4 24.1
Not working 65.6 51.6 42.4 38.9
Source: Appleton & Ssewanyana (2003)
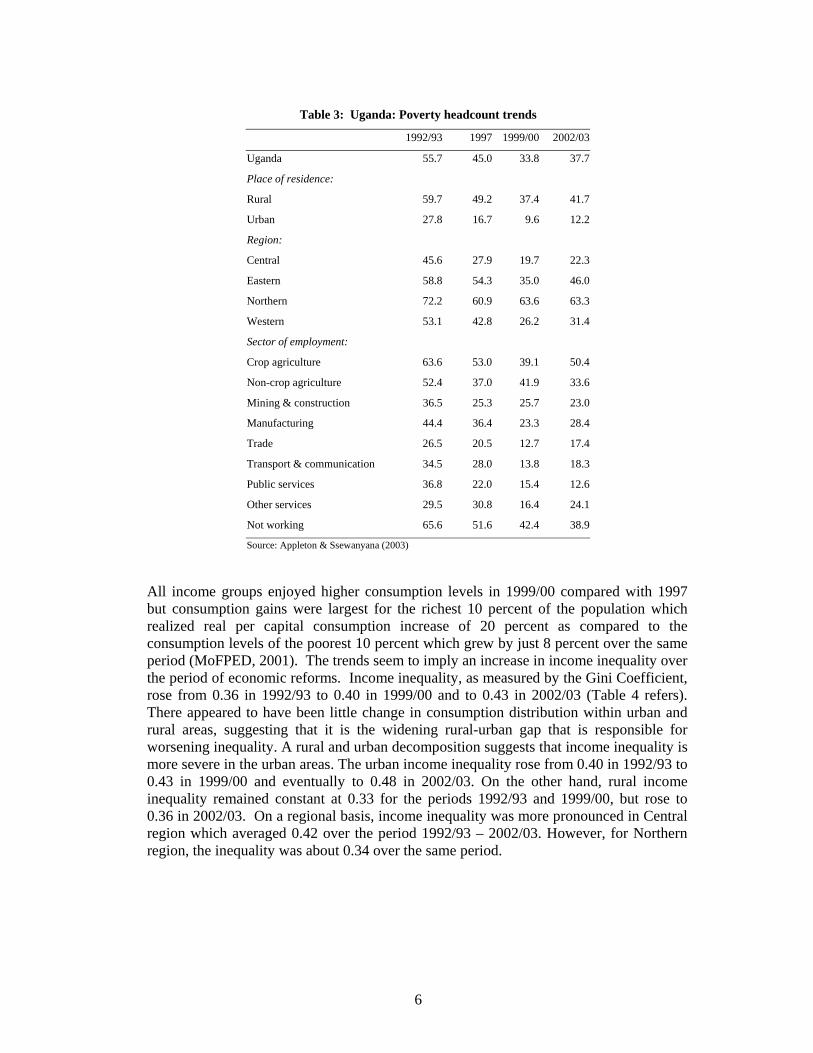
All income groups enjoyed higher consumption levels in 1999/00 compared with 1997 but consumption gains were largest for the richest 10 percent of the population which realized real per capital consumption increase of 20 percent as compared to the consumption levels of the poorest 10 percent which grew by just 8 percent over the same period (MoFPED, 2001). The trends seem to imply an increase in income inequality over the period of economic reforms. Income inequality, as measured by the Gini Coefficient, rose from 0.36 in 1992/93 to 0.40 in 1999/00 and to 0.43 in 2002/03 (Table 4 refers). There appeared to have been little change in consumption distribution within urban and rural areas, suggesting that it is the widening rural-urban gap that is responsible for worsening inequality. A rural and urban decomposition suggests that income inequality is more severe in the urban areas. The urban income inequality rose from 0.40 in 1992/93 to 0.43 in 1999/00 and eventually to 0.48 in 2002/03. On the other hand, rural income inequality remained constant at 0.33 for the periods 1992/93 and 1999/00, but rose to 0.36 in 2002/03. On a regional basis, income inequality was more pronounced in Central region which averaged 0.42 over the period 1992/93 – 2002/03. However, for Northern region, the inequality was about 0.34 over the same period.

7
Table 4: Uganda: Gini coefficient, 1992/93 – 2002/3
1992/93 1997 1999/00 2002/03
Uganda 0.36 0.35 0.40 0.43
Rural 0.33 0.31 0.33 0.36
Urban 0.40 0.35 0.43 0.48
Central 0.40 0.36 0.42 0.46
Eastern 0.33 0.33 0.35 0.36
Western 0.32 0.28 0.32 0.36
Northern 0.34 0.31 0.34 0.34
Central rural 0.33 0.32 0.33 0.37
Central urban 0.39 0.33 0.41 0.48
Eastern rural 0.32 0.31 0.32 0.34
Eastern urban 0.32 0.34 0.43 0.40
Western rural 0.31 0.27 0.29 0.33
Western urban 0.35 0.36 0.39 0.44
Northern rural 0.33 0.30 0.32 0.32
Northern urban 0.39 0.33 0.39 0.41
Source: Okidi et al. (2005)
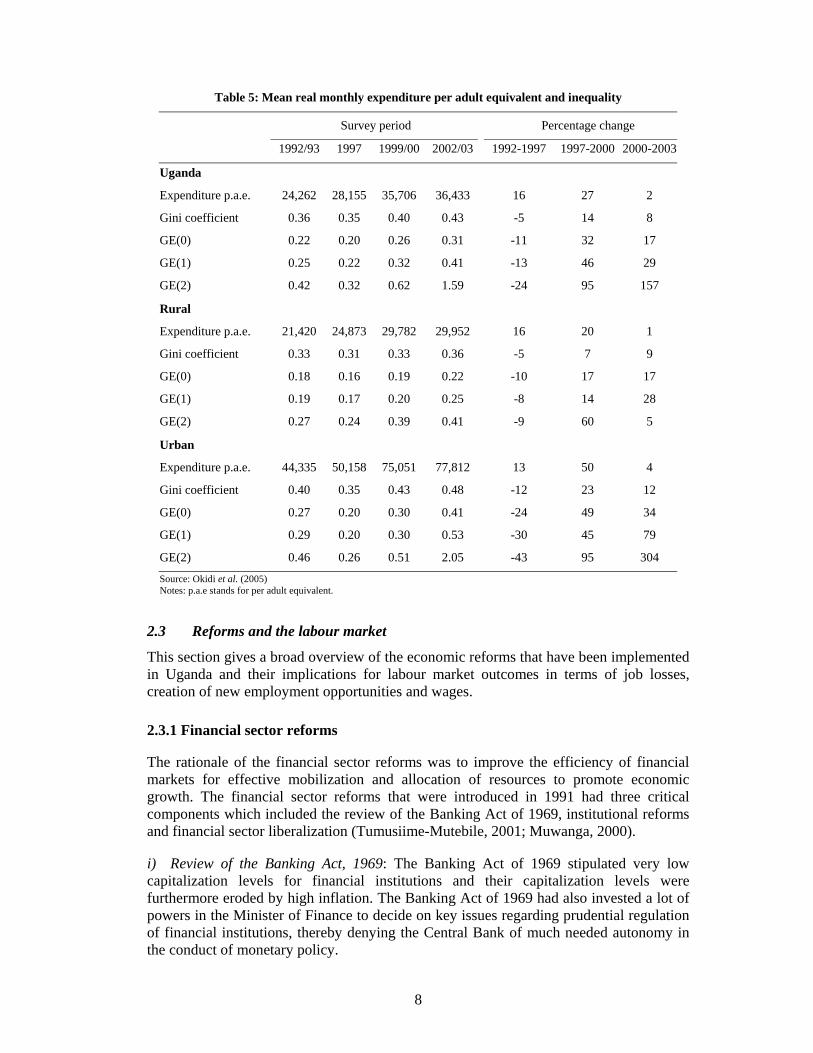
At the national level, the annual growth in mean household expenditure per adult equivalent was 16 percent for the period 1992 – 1997, 27 percent for 1997 – 2000 and 2 percent for 2000 – 2003. The rural-urban analysis suggests that the growth for the period 1997 – 2003 mainly benefited the urban sector. While the urban sector real expenditure growth rate was approximately 50 percent for the period 1997 – 2000, the rural sector witnessed a growth rate of only 20 percent over the same period (see Table 5).
8
Table 5: Mean real monthly expenditure per adult equivalent and inequality
Survey period Percentage change
1992/93 1997 1999/00 2002/03 1992-1997 1997-2000 2000-2003
Uganda
Expenditure p.a.e. 24,262 28,155 35,706 36,433 16 27 2
Gini coefficient 0.36 0.35 0.40 0.43 -5 14 8
GE(0) 0.22 0.20 0.26 0.31 -11 32 17
GE(1) 0.25 0.22 0.32 0.41 -13 46 29
GE(2) 0.42 0.32 0.62 1.59 -24 95 157
Rural
Expenditure p.a.e. 21,420 24,873 29,782 29,952 16 20 1
Gini coefficient 0.33 0.31 0.33 0.36 -5 7 9
GE(0) 0.18 0.16 0.19 0.22 -10 17 17
GE(1) 0.19 0.17 0.20 0.25 -8 14 28
GE(2) 0.27 0.24 0.39 0.41 -9 60 5
Urban
Expenditure p.a.e. 44,335 50,158 75,051 77,812 13 50 4
Gini coefficient 0.40 0.35 0.43 0.48 -12 23 12
GE(0) 0.27 0.20 0.30 0.41 -24 49 34
GE(1) 0.29 0.20 0.30 0.53 -30 45 79
GE(2) 0.46 0.26 0.51 2.05 -43 95 304
Source: Okidi et al. (2005) Notes: p.a.e stands for per adult equivalent.
2.3 Reforms and the labour market
This section gives a broad overview of the economic reforms that have been implemented in Uganda and their implications for labour market outcomes in terms of job losses, creation of new employment opportunities and wages.
2.3.1 Financial sector reforms
The rationale of the financial sector reforms was to improve the efficiency of financial markets for effective mobilization and allocation of resources to promote economic growth. The financial sector reforms that were introduced in 1991 had three critical components which included the review of the Banking Act of 1969, institutional reforms and financial sector liberalization (Tumusiime-Mutebile, 2001; Muwanga, 2000).
i) Review of the Banking Act, 1969: The Banking Act of 1969 stipulated very low capitalization levels for financial institutions and their capitalization levels were furthermore eroded by high inflation. The Banking Act of 1969 had also invested a lot of powers in the Minister of Finance to decide on key issues regarding prudential regulation of financial institutions, thereby denying the Central Bank of much needed autonomy in the conduct of monetary policy.
9
As a result of the review of the Banking Act of 1969, two new statutes were passed in 1993: the Financial Institutions Statute (FIS) and the Bank of Uganda (BOU) Act, both of 1993 (Muwanga, 2000). The Bank of Uganda Act (1993) gave the Central Bank the powers to discipline financial institutions that flout the law or its prudential regulations and/or become insolvent. The Financial Institutions Statute (FIS 1993) also gave BoU more independence in the licensing and regulation of financial institutions, and in issuing prudential regulations related to capital adequacy, liquidity and reporting requirements (Nannyonjo, 2002).
The minimum capital requirements stipulated by FIS (1993) for banks were Ushs 1 billion for foreign commercial banks and Ushs 0.5 billion for local commercial banks. In January 2000 Bank of Uganda, through the Statutory Capital adequacy instrument, raised the minimum capital requirements to Ushs 2 billion for all commercial banks and Ushs4 billion by 2003. The rationale for the enhanced capital adequacy requirement was to give appropriate incentives to the owners of financial institutions to undertake prudent management so as to minimize costly bank failures. In addition higher minimum capital requirements would also discourage entrance into the financial sector by entities with a weak financial base (Tumusiime-Mutebile, 2001).
ii) Institutional reforms: The institutional reforms focused on two components, namely restructuring the Bank of Uganda to strengthen the supervision function and divestiture of the Public Sector Commercial banks (Tumusiime–Mutebile, 2002). The strengthening of the supervisory function of the Central Bank was intended to ensure commercial banks’ compliance with the law and to minimize bank failures that emanate from internal mismanagement of financial institutions.
The divestiture of government interests in public sector commercial banks was intended to reduce government interference in the management of financial institutions. Government involvement in management of loss making public sector banks with huge non-performing assets was disastrous to the development of an efficient financial sector. The residual role of government was to provide a conducive environment for the efficient functioning of the financial sector through an appropriate regulatory framework (Tumusiime–Mutebile, 2002).
iii) Financial sector liberalization: The financial liberalization component included the decontrol of interest and foreign exchange rates and abolition of the credit allocation system. The Treasury Bill (TB) was the main instrument that the Bank of Uganda relied on in the conduct of monetary policy which partly explains the high interest rates after liberalization and the crowding out of the private sector in credit markets.
The financial sector reforms had important implications on the labour market. First, as a result of the Bank of Uganda Act (1993), the Central Bank used its powers in the resolution of failed banks (such as International Credit Bank, Greenland Bank and Co-operative Bank) which led to job losses. Second, the divestiture of Uganda Commercial Bank (UCB) to a strategic investor, Standard Bank Investments Corporation (Stanbic) of South Africa, in February 2002 resulted in job losses through the closure of unviable branches especially in the rural areas and retrenchment of workers. Third, there was marked emergence and rapid expansion of microfinance institutions (MFIs) to fill the financial services delivery vacuum created by the closure of non-performing banks, thereby leading to creation of new employment opportunities. By the late 1990s there were about 500 MFIs that were operational in Uganda (Ledgerwood et al., 2002). To
10
maintain the stability of the financial sector and ensure safety of public funds, the Microfinance Deposit-taking Institutions Act (2003) had to be enacted (Katimbo-Mugwanya, 1999). Estimates by MoFPED (2004) suggested that MFIs served approximately 0.9 percent of the total Uganda population with total loan portfolio of Ushs. 86 billion (approximately 0.5 percent of GDP), and savings of Ushs. 129 billion (approximately 15 percent of domestic savings) and targeting especially women (75 percent of clients were female) in the non-agricultural sector (87 percent of outstanding loans were for commerce, services, manufacturing and agro-processing). The rise in MFIs also enhanced the participation of women in the labour markets through improved access to credit.
Fourth, the heavy reliance on the TB as an instrument of monetary policy resulted in high intermediation margins1 (Nnanyonjo, 2002) and the crowding out of private sector credit (Muwanga, 2000). The crowding out of private sector credit arose because the commercial banks that participated in the TB market found it more lucrative to invest in TBs rather than lend to the private sector due to low default risks and transaction costs. Tumusiime- Mutebile (2002) however argued that the high intermediation margins are structural in nature, especially as a result of the accumulation of large non-performing assets by banks in the 1980’s, where the high lending rates were geared to cover those losses. The implication of the high commercial bank lending interest rate to the labour market is it raises the cost of borrowing for the private sector which constraints their expansion and in turn diminishes the rate of creation of new private sector employment opportunities.
2.3.2 Decentralization
The Local Government Statutes (1993) provided the framework for decentralization to district level. The 1995 Constitution and the Local Government Act (1995) clearly articulated the functions, powers, responsibilities and services to be decentralize to the several levels of local government to ensure people’s participation and democratic control in decision making (Corkery, 2000). The prime objective of devolving power to the grassroots levels (districts and the sub-county levels) would have the advantage of reducing bureaucracy and enhancing access to service centres by the local population. The benefits of decentralization were postulated to include improved efficiency of public service provision, more appropriate services, better governance, and the empowerment of local citizens (Makokha, 2001). One of the major outcomes of the decentralization process was the emergence of new districts (such as Pader, Busia, Pallisa) which were curved out of the existing districts. The total number of districts rose from about 45 in the mid 1990s to approximately 56 by 2005, hence having a multiplier effect on creation of public sector jobs at the district level.
2.3.3 Trade Policy Reforms
Trade liberalization was central to Uganda's reform programme (Government of Uganda, 1995). It involved the elimination of both tariff and non-tariff barriers, thereby opening the economy to global competition. Liberalization reforms also involved the deregulation of agricultural product marketing through the dissolution of marketing boards (such as
1 Intermediation Margin is the difference between the lending interest rates (charged by banks on loans) and deposit interest rates (paid to depositors)
11
coffee and lint marketing boards), which was expected to lead to higher producer prices thereby enable agricultural households to move out of poverty (Deininger & Okidi, 2003). The prompt cash payment to farmers for agricultural output was also noted as one of the tangible benefits of the liberalized marketing system (Bigsten & Kayizzi-Mugerwa, 1999). Under the previous centralized marketing system, the farmers took too long to be paid for their deliveries due to inefficiencies of the marketing boards and credit constraints. Delayed payments may be argued to be poverty increasing as the real value of earnings would be low by the time it is eventually received (due to inflationary factors) and lost investment opportunities. This may explain the response of coffee producers at the height of economic mismanagement in Uganda by either cutting down coffee trees, resorting to coffee smuggling or a switch to subsistence farming.
2.3.4 Privatization
The rationale of the privatization policy was to have private sector-led economic growth. This necessitated the enactment of appropriate legal provisions to guarantee security of private (for example the revised Uganda Constitution of 1995). The government initiated the privatization of state owned enterprises from 1990 with a view of enhancing private sector participation in business. According to the administratively collected data, 128 public enterprises had been fully privatized, and 24 were at various stages of privatization by April 2006. The private sector2 which was considered to be an engine of growth, which was expected to create new jobs and pay better wages, thereby lead to welfare improvements (Ruhweza, 2003). Privatization of state enterprises therefore led to job losses for those workers who were laid off. It is worth noting that the rate of private sector investment has been low3 despite the implementation of the investment code4 of 1991 which reflects Uganda’s unfavourable investment climate. The continued weak investment climate may be explained in terms of the low level of market integration, insecurity problems, poor public infrastructure (electricity, roads, communications), insufficient institutional reforms, and fears of future policy reversals, which may explain why the rate of new job creation by the private sector has been slow (Keefer, 2000). Makokha (2001) further observed that the greatest jobs created under the privatization policy occurred mainly at lower levels with hardly new opportunities at top management levels for the nationals.
2.3.5 Civil Service Reforms
The civil service reforms were geared towards creating a well motivated workforce and control of public expenditure (Bigsten & Kayizzi-Mugerwa, 1999). The earlier employment policy pursued by Government prior to the reforms had two main negative outcomes of excessive public sector employees (which had implications on the wage bill) and low real public sector wages (on account of high inflation). To compensate the low real wages, public sector employees responded in different ways which included involvement in informal sector activities and corruption. The ultimate outcome was a massive, inefficient and corrupt ridden public service which contributed more to the government budget deficit. The civil service reforms therefore resulted in the reduction of public sector employees from about 320,000 in 1990 to 150,000 in 1995 (Bigsten &
2 The return of previously nationalized properties to their Asian owners was one of the key components of the privatization reforms 3 Annual gross private domestic investment to GDP ratio averaged 10.4% between 1990 and 2001 as compared to 17% for Sub-Saharan Africa 4 The Investment Code had generous incentives such a six year tax holiday for an investment of US$50,000
12
Kayizzi-Mugerwa, 1999). From the available administrative data sources the government seem not to have lived to its commitment of limiting the size of the public service. Although the government initially merged several ministries and reduced their number from 38 in 1992 to 22 in 1995, there has been a dramatic expansion in the recent years. As of 2006, there were 69 Cabinet Ministers, 114 Presidential Advisors, 95 Commissions, Autonomous and Semi-Autonomous Bodies which were used as channels for public sector employment creation. The Pay Reform, as an integral part of the civil service reform, resulted in an increase in public wages. For instance, the monthly salary of a Permanent Secretary increased from about US$36 in 1993 to approximately US$1,550 in 1997.
The implications of the civil service reform on labour market outcomes are therefore mixed. The retrenchment of public servants and the imposed ban on recruitment led to job losses in the initial years. However the rapid creation of new autonomous government agencies in the latter years led to creation of public sector jobs. The pay reform led to an increase in public sector wages relative to the private sector wages.
2.3.6 Tax reforms
The goal of the adjustment programmes as regards fiscal operations and public sector expenditure management in Uganda was to reduce government expenditures as a major instrument along side increasing tax revenue to reduce the budget deficits. The government initiated a number of tax reforms to raise revenue such as rationalization of the tax structure and rates (for example Value Added Tax was introduced in 1996 to replace Commercial Transaction Levy), widening the tax base, reducing exemptions (for example the enactment of a new Income Tax Act in 1997 which eliminated most discretionary tax exemptions and tax incentives), simplifying the tax procedures and institutional changes. These measures resulted in an increase in government tax revenue from 7.82 per cent of GDP in 1990/91 to 12.6 percent in 2003/04. However the major institutional tax reform with linkages to the labour market was the creation of Uganda Revenue Authority (URA) in 1991 which created high paying public sector jobs intended to minimize corruption in tax collection agency.
2.3.7 Education Sector Reforms
The major reforms in the education sector included the Universal Primary Education (UPE), private sponsorship programmes in public universities, private sector participation in the education sector (Bategeka et al., 2004). The UPE programme was introduced in January 1997 targeting the enrolment of all children of primary-school age, addressing concerns about inequity in education and improving quality outcomes. The outcome of UPE was that total pupil enrolment in government-aided schools rose from 2.2 million in 1990 to 5.9million in 2001, with the teacher workforce also rising from 81,590 in 1990 to 101, 818 in 2001 (Bategeka et al., 2004). Clearly the UPE program led to the creation of public sector employment opportunities for the teachers so as to control the pupil-teacher ratio which steadily rose from 28 in 2001 to 65 in 2000 and thereby falling to 58 in 2001.
The reforms at the higher levels of learning included the creation of new state universities (such as Mbarara, Kyambogo and Gulu), introduction of private sponsorship programmes in state universities (for example in Makerere University alone the total student population rose from about 7,000 in the mid 1980’s to approximately 30,000 by 2005 all
13
driven by the private sponsorship), licensing of private universities (such as Mukono Christian University, Kampala University, Uganda Martyrs’ University). The outcome of these reforms to the labour market is increased supply of university graduates amid limited demand which has implications for high unemployment levels and/or low wages.
2.3.7 Health sector reforms
The health sector reforms package included broadening health financing (for example through charging user fees providing health insurance and establishing community pr-payment schemes), decentralization of health services; privatization and broadening the provider mix with emphasis on effective use of non-governmental resources and targeting improvements in human resource management (Atkin et al., 1987). The rationale for the user fees was that preventive services (such as immunization) were perceived to be public goods which benefit society as a whole and so should be financed by the state, while curative services (such as drugs) were perceived to be private goods which benefit the individual who should pay for them. The implementation of the Public Health Care (PHC) in Uganda over the reform period followed the project approach (such as Control of Diarrhoeal Diseases Programme, Expanded Programme on Immunization, AIDS Control Programme) funded mainly donors and by 2000 there were approximately 57 programmes in the health sector (Tashobya and Ogwal, 2004), which created public sector employment opportunities. The decentralization of the health care delivery system created more employment opportunities for health workers at the district and lower levels of local government. The decentralization created a multi-layered health care system from Health Centre 1 – IV as lower level units, with a district hospital for each district. Above this were the regional and national referral hospitals.
2.3.9 Minimum wage legislation reforms
In the pre-reform period, Parliament enacted the minimum wages (adjusted to match the cost of living) to be paid to the lowest categories of employees. The labour market reform package included the relaxation of minimum wage legislation so as to eliminate distortions and enhance the mobility of labour in accordance to changes in relative factor prices across sectors/regions. The market determined wages were expected to provide private sector investment incentives, thereby create more employment opportunities.
2.4 Economic reforms and poverty reduction
The focus of the economic reforms was the rehabilitation of the key social and economic infrastructure before emphasising the establishment and maintenance of a stable macroeconomic environment (Okidi & McKay, 2003). Real improvements in standard of living of the people were to be realized through structural strategies such as the Poverty Eradication Action Plan (PEAP) which is the policy vehicle for translating the country’s long term development aspirations into specific and achievable goals. The main features of the PEAP are the five fundamental pillars of creating a framework for economic growth and transformation, ensuring good governance and security, directly increasing the ability of the poor to raise their incomes and directly increasing the quality of life of the poor (MoFPED, 2005). The realization of the goals of PEAP is detailed in the individual sector strategic plans namely; the Plan for Modernisation of Agriculture (PMA), the Medium Term Competitiveness Strategy (MTCS), the education sector investment plan, the health sector strategic plan and the road sector development plan. For instance the mission of PMA of eradicating poverty by transforming subsistence
14
agriculture to commercial agriculture, is a clear indication of the logic of PEAP as an agriculture based poverty reduction strategy which is relevant to the rural economy (Bahiigwa et al., 2005).
Evidence by Deininger & Okidi (2003) suggested a high elasticity of both income growth and poverty reduction with respect to agricultural output (coffee) prices. The conclusion from the study is that the liberalization of output markets is a benefit because it leads to an increase in producer prices earned by poor who are mainly engaged in the agricultural sector. In addition, the importance of product diversification to protect the poor against shocks was underscored. Kappel et al. (2005) also argued that economic reforms induced supply side incentives, and Uganda attracted an increasing number of foreign investors from 1996. The abolition of the Marketing Board’s monopoly on coffee tea and cotton caused arise in producer prices and a surge in production. Ssewanyana et al. (2004) further argued that the implementation of economic reforms enabled Uganda to experience high economic growth rates, a fall income poverty and relative political stability.
Deininger (2003) argued that education sector reforms (for example the Universal primary education (UPE) programme) contribute to poverty reduction through two main channels: savings on cost of education and raising productive capacity. By undertaking to pay fees for primary education of school going-age children, the government enables the households to save this money and use it for either investment or consumption smoothing, thereby raising their level of income. On the other hand, education enables the development of human capital which raises opportunities for employment and earning a wage income. Through both channels, education has the potential to enable households to move out of poverty.
Deininger (2003) further shows that UPE has greatly reduced the wealth bias that had characterized access to primary education in 1992, helped to establish gender equality by increasing girls’ access to primary education, and reduced the incidence of cost-related drop-outs from primary school. Watkins (2000) also noted that media campaign for girls’ education and against early marriages helped to increase girl child attendance and minimized the girl drop-out rates. This has the potential implication of improving the welfare of this vulnerable group by enhancing their labour market participation.
In summary, we learn four important lessons from the discussion of economic reforms that were implemented in Uganda. First, the reforms were good intentioned as a long-term development strategy to achieve sustainable economic growth. Second, the market price incentive structure was to be a driving force in the mobilization and allocation of resources. Third, the implementation of economic reforms had varied effects on the labour market: loss of jobs (as in the case of public service retrenchment, privatization of state enterprises, closure of non-performing banks); creation of new job opportunities (through private sector investment, emergence of MFIs, job creation at district levels); flexibility of wages. Fourth, the effect of labour market changes (arising from economic reforms) on poverty outcomes is an empirical matter. It may either be poverty reducing or poverty enhancing depending on the rate of labour market participation, creation of employment opportunities, and level of real wages. This is the centrepiece of this study.
15
3. Review of literature
In this section, we present a review of literature linking economic reforms to labour outcomes and poverty. We present a theoretical discussion prior to the empirical evidence one.
3.1 Theoretical considerations
3.1.1 Importance of labour markets
The economies of most developing countries were characterized by economic regulation in the 1960’s and 1970’s, which measures included strict protection and regulation of domestic markets through policy instruments such as import and export controls, control of domestic prices (including interest and foreign exchange rates), wages and employment (Alwang et al., 1996). The labour markets were highly regulated through job security regulations, wage indexation, aggressive minimum wage practices and other institutional sources of rigidities (Fallon & Rivers, 1989; Marquette, 1997). The labour markets in these countries were also argued to be characterized by dualism, where formal and informal labour markets were segmented (Lanot & Muller, 1997). The formal labour markets were distinguished by high wages, high returns to education, concentrated weekly work schedule and barriers to entry. The features of informal labour markets included low wages, low returns to education, and a non-linear relationship between hours worked and earnings. This scenario explained the wage differential between the formal-informal labour markets and the attendant rural-urban migration.
The poor macroeconomic performance that was experienced by most developing countries (such as internal and external imbalances, high inflationary pressures) in the 1980’s motivated them to adopt the economic reforms which were sponsored by the IMF/World Bank, geared towards enhancing the efficiency of markets in the mobilization and allocation of resources for sustainable economic growth (Sharer et al., 1995). The macroeconomic structural adjustment therefore conferred a central role to labour market response because the achievement of a real devaluation demands both real wage flexibility and intersectoral labour mobility (Fallon & Rivers, 1989). The economic reforms mitigated the deregulation of the labour market through removal of legal controls on minimum wages, and letting wages to be determined by market forces of demand and supply.
The flexibility of the labour market also defines how well an economy can respond to negative external shocks. In a comparative study of the economic recovery of Korea and Malaysia following the external shocks5, Mazumdar (1993) concluded that the flexibility of the labour market explained why Korea performed better than Malaysia. In the Korean case, the wage determination system was based on a profit sharing model. The total earnings of the workers had two components, the fixed component (which was the basic wage determined by education level and gender) and variable component (which was the overtime pay and annual bonuses which were related to the business conditions and profitability). This ensured that the share of wages in total productivity within the manufacturing sector fell sharply following the external shocks and helped to maintain the competitiveness of Korean manufactured exports. However, for Malaysia, the wage
5 External shocks experienced in the 1970s and the 1980s included the deterioration of terms of trade (following a fall in prices of primary commodities and a sharp increase in oil price), sharp increases in interest rates in the early 1980s, and disruption in financial markets which made access to foreign borrowing difficult for many countries.
16
determination system was characterized by long contractual agreements (2–4 years) and automatic seniority increments irrespective of the prevailing economic conditions, which brought in rigidities to the labour market. The resultant effect was that the labour market was not responsive to macroeconomic changes (as there was a significant time lag before wages started to adjust) and this tended to worsen the crisis.
From the above discussion, it can be concluded that flexible labour markets are important to enhance resource allocation between sectors and also the economy’s response to adverse trade shocks. However, in the context of linking economic reforms to poverty outcomes, one needs a clear understanding of the channels through which economic reforms influence the labour markets and eventually poverty. This is discussed in the next section.
3.1.2 Impact of reforms on the labour market
The basic theoretical formulations used in many studies for analyzing the impact of economic policy reforms on the labour market has largely been based on the assumption that exportable and importable goods that can be treated as Hicksian composite goods. The analysis then concentrates on the effect of economic reforms on the relative prices of tradable to non-tradable goods (Riveros, 1994; Hollister & Goldstein, 1994; Lopez & Riveros, 1988, 1989 ; Toye, 1995; Okerele, 1999). Bevan et al. (1990) argue that the treatment cannot effectively consider trade policy and that structural adjustment policies in most developing countries involve major change in trade policy. Bigsten & Kayizzi-Mugerwa (1999) also argued that in a state where trade policy has been varying, then the tradables no longer form a Hicksian composite, hence the need to consider the prices of exportables, importables and non-tradables separately.
Dercon et al. (2005) highlighted that the transmission mechanisms through which the reforms in the labour market affect poverty. These include the real wage and unemployment. By relaxing the minimum wage legislation, the implication is that wages will be determined by forces of demand and supply, which brings to the forefront the flexibility of the real wage. An increase in the demand for labour, other factors constant, will result in an increase in the real wage. The reverse is true for an increase in the supply of labour. In the context of economic reforms which are characterized by retrenchment and bans on public service recruitment in a bid to control budget deficits, an increase in labour supply is the most likely outcome. The increase in labour aggravated by the rising numbers of graduates from institutions of higher learning might have a downward pressure on private sector wages. On the other hand, the removal of external trade controls opens the domestic economy to competition in the global market. Depending on the competitiveness of domestic products, trade liberalization may either lead to an expansion or contraction of domestic production, which have implications for domestic employment. Trade liberalization which is supported by a flexible exchange rate has the potential effect of stimulating domestic agricultural production through increased producer prices, hence leading to more employment generation and poverty reduction.
Similarly Teal (2000a) argued that the flexibility of real wages provides incentives to private investors thereby raising the likelihood of creating employment opportunities for both skilled and unskilled workers. This may result in individuals switching between sectors, and incomes may rise as employment expands within higher income sectors.
17
The important conclusion from the above theoretical model is that economic reforms influence labour market outcomes through their effects on relative factor prices. The labour market in turn influences poverty outcomes through its effects on wages, sectoral/regional mobility of labour, and job creation.
3. 2 Empirical evidence
The review of the empirical literature on the impact of economic reforms on labour market and poverty outcomes is done in the context of labour market participation, employment, wages, intersectoral labour mobility and poverty outcomes.
3.2.1 Labour market participation
One of the main channels by which economic reforms influence poverty outcomes at the household level is through changes in labour market participation. While labour market participation may be influenced by other factors such as gender, education, age, location and cultural practices, its changes will determine the extent of welfare change.
Labour force participation for both males and females in most countries is influenced by their educational attainment. In Tunisia, Israel, and Korea female participation rate was observed to grow with increase in secondary education (Fallon & Riveros, 1989). This is in line with the argument by Matshe & Young (2004) that education and gender are very important individual characteristics to be considered in determining labour allocations. Kabubo-Mariara (2003), in her Kenyan gender wage gap study, observed that while different demographic characteristics influenced the choice of sectoral participation for both males and females, education was a more important factor for females than their male counterparts.
Education level in turn influences both the choice of activity combination (farming, wage work or own family business) and earnings. Wambugu (2003) observed that in Kenya as education level increases from primary to secondary, the probability of generating income from a combination of economic activities also increases. However, higher levels of education (tertiary or university) increase the probability of generating income from only wage employment. The results suggested that more educated households have higher total earnings both in the rural and urban areas, which underscores the correlation between labour market participation and education.
The findings by Lanot & Muller (1997) suggested that in Cameroon, the probability of female participation in formal labour markets is positively and significantly influenced by age, education level, being married, and having substitutes6 for domestic work. However, the probability of female participation in formal labour markets is negatively and significantly influenced by the husband’s age, and number of small children. The positive and significant coefficient of education level was interpreted in terms of higher returns to education in the formal labour market. The negative and significant coefficient of husband’s age was related to the traditional mentality of the household head where women were expected to stay at home and not participate in the labour market. The presence of children had a negative and significant effect on the probability of female participation in the formal labour market, which was explained in terms of caring for
6 The substitutes for domestic work was captured by the number of females in the household aged between 13 to 18 years
18
children at home by mothers. Female participation in the informal labour market was only positively and significantly influenced by age.
Bigsten & Kayizzi-Mugerwa (1999) estimated separate models for urban and rural labour market participation rates in Uganda. Male participation in the formal urban labour markets was positively and significantly influenced by secondary education, and being household head, while negatively influenced by income of other household members. In comparison, female participation in the formal urban labour markets was positively and significantly influenced by post secondary education and being household head. However, education level was found to be insignificant in explaining labour market participation in the urban informal sector. While being household head and being a public service employee positively influenced participation in the urban informal sector, it was negatively influenced by age. The positive coefficient for being household head was explained by the fact that the heads were under pressure to earn more income for the household. The significant coefficient for being a public service employee was accounted for by the fact that public servants who were under pressure to supplement their meagre incomes, were using their official positions to provide business opportunities. The negative coefficient for age was due to the fact that much of the informal sector business was the hawking type which needed more physical stamina. Participation in formal employment in the rural sector was also observed to be positively and significantly influenced by secondary and post-secondary education.
3.2.2 Employment creation
Economic reforms were expected to improve incentives and promote the efficiency of factor markets in mobilization and allocation of resources thereby increase the rate of job creation by the private sector (Sharer et al., 1995). The reforms would thus bring about higher employment and lower levels of informality in the long run, based on the premise that the private sector can readily harness the potentials of more open and competitive environment (Pierre & Scarpetta, 2004). Velenchik (1997) further emphasized that, the effectiveness of structural adjustment programmes in yielding improvements in the people’s standard of living rests to a great extent on the ability of the labour market to translate growth into expanded employment.
Empirical evidence of the effect of economic reforms on job creation has however, been mixed (Pierre & Scarpetta, 2004). Barret et al. (2001) noted that in Cote d’Ivoire currency devaluation as a specific economic reform policy instrument induced higher prices for agricultural farm outputs resulting into increased employment in the tradable sector. Kikeri (1998) argued that though economic reform policy of privatization is associated with job losses due to cuts in the size of the labour force in the state enterprises, it also leads to new employment generation at both enterprise and sectoral levels.
However, economic reforms were argued to have failed to generate employment opportunities in some countries. For example in Zimbabwe, unemployment was observed to have doubled from approximately 10 percent in the pre-economic reform period to about 20 percent in the post reform period, with severity being higher in urban areas (Marquette, 1997). Although other factors (such as drought) could have contributed to the unemployment, economic reforms were argued to be the main cause. Increased foreign competition and imports due to relaxation of import regulations, reduction of centralized maize-milling operations, and staff freezes in the public sector contributed to less creation
19
of formal sector jobs in domestic industry and thus leading to rising unemployment. However, employment in the informal sector increased in the economic reform period. These were basically lower paying jobs with less job security. The view of limited formal employment generation resulting from economic reforms in Zimbabwe was shared by Velenchik (1997) who observed that employment in the food, garment and metal sectors fell significantly, with a marginal rise in employment in the wood furniture, textiles and leather sectors.
Canagarajah & Thomas (1997) observed that in Ghana female unemployment increased relative to that of the males while the informal sector employment increased relative to that of the formal sector over the economic reform period (1987 – 92). Mazumdar (1989) attributed the fall in public sector employment in developing countries to the retrenchment policy, and in an attempt to avoid massive retrenchment the governments allowed real public sector wages to erode.
3.2.3 Wages
Economic reforms were expected to lead to increased flexibility of wages and a rise in real wages, although empirical evidence varies across countries. However, wage levels are also influenced by other factors. Velenchik (1997) observed that although trade liberalization led to shifts in employment from import to export sectors in Zimbabwe, the job changes were associated with insignificant increases in wages. Men’s wages grew a little faster than that of women on account of higher human capital accumulation.
In the Mexican case, Pagán et al. (2002) noted that economic reforms which involved trade reforms, divesture of public enterprises and elimination of regulations resulted into increased relative public sector wages from 1987 to 1997 as opposed to those in the private sector. As the number of public sector employees reduced following the privatization of the public owned firms, the private sector total earnings and employment fell, the ratio of the public/private sector mean earnings increased significantly. This was a reflection of higher prices of skills in the public sector which attracted higher wages than those in the private sector.
Dercon et al. (2005) noted that in Ethiopia public sector real wages fell over the economic reform period largely due to the inflationary shock of 1991/92, but the private sector real wages rose over the period thus resulting in the narrowing of the wage gap between the two sectors. The returns to education both in the public and private sectors were also observed not to have changed much over the period, thus leading to the conclusion that the Ethiopian labour market was unresponsive to the reforms.
A similar view of the fall of real public sector wages was provided by Horton et al. (1994) who noted that real wages in Ghana drastically fell between 1980 and 1984, but partially recovered in 1996. In Kenya, there was also evidence of the fall in real wages both in the public and private sector. Further evidence by Horton et al. (1994) suggested that the fall in real wages over the structural adjustment period were also accompanied by structural changes in the allocation of labour and participation rates.
Lindauer et al. (1988), in a study of four African countries (Ghana, Tanzania, Sudan and Malawi), however, noted that under the structural adjustment period governments tended to protect the wages of lower skilled public sector workers, thus explaining the decline in the wage gap within the public sector. The gap between the public and private sector
20
wages was also observed to have declined. Marquette (1997) also observed that real wages dropped in Zimbabwe by about a quarter due to relaxation of government regulation of the labour market.
The level of wages may be influenced by socio-economic variables such as education, gender, experience and location. Empirical estimates by Teal (2000b) suggested that real wages for the private and manufacturing sector employees in Ghana were positively and significantly related to age, number of years worked and education. Although real wages were observed to have fallen generally over the reform period, the fall was more significant among the unskilled workers. The real wages for the unskilled workers, which constitute a specific economically vulnerable group, rose by 11 percent between 1988 and 1992 (which period is also associated with the fall in the level of poverty) and then fell by about 23 – 26 percent between 1992 and 1998. The fall in real wages was explained by the poor macroeconomic performance7 as indicated by the high inflation rate, the low economic growth rate (of about 1.4 percent between 1986 –1996) and poor investment rates (of less than 10 percent over the period). The conclusion from the study was that while the reform process in Ghana has delivered rises in per capita aggregate incomes, it has resulted in a fall in real wages especially for the unskilled workers which might worsen their poverty outcomes.
Appleton et al. (1999) noted that there was a general fall of nearly 35 percent in the urban real wages in Kenya between 1978 and 1995. The fall in urban real wages was explained by the high population growth and rural-urban migration (which increased labour supply), and poor economic growth (which depressed the demand for labour), hence the wages had to respond to changes in the labour market. Education was found to be significant both in determining the choice of employment and wage earnings. However, the returns to education were observed to have fallen over the period, with significant decline in returns to secondary education which fell from 20 percent in 1978 to 6 percent in 1995.
Lanot & Muller (1997), in a study of sector choice and female labour supply in Cameroon, observed that wages in the urban formal labour market are positively and significantly influenced by years of education (implying higher returns to education) and years of experience. However, in the urban informal labour market, both the education and experience variables were insignificant. Bigsten & Kayizzi-Mugerwa (1999) observed that in Uganda male earnings in the urban sector were positively and significantly influenced by secondary education and age, while in the female earnings model it was only age that was significant.
3.2.4 Structural labour shifts
One of the expected outcomes of economic reforms was the mobility of labour across sectors and rural/urban. For example, a trade liberalization followed by devaluation was expected to improve the domestic terms of trade thereby lead to a shift of resources from the non-tradable to tradable sector, and a shift of labour from public to private sector. Since the export sector in developing countries is dominated by agriculture especially in the rural areas, the reforms were expected to reverse the rural-urban migration trend.
7 From the econometric model of real earnings of unskilled male workers, the coefficient for lagged inflation was negative and significant, while coefficients for rate of growth of GDP and investment rate were both positive (though it was only the one for investment rate that was significant). The implication is that the low levels of economic growth and investment rates adversely affected the demand for unskilled labour and, indirectly the real wage.
21
According to Pierre & Scarpetta (2004), economic reforms in most low- and middle-income countries led to significant shifts in employment away from low productive agricultural activities to the manufacturing and service sectors. This is more evident in the formally centrally-planned economies as well as in the Middle East, North Africa and Latin America
In Cote d’Ivoire Barret et al. (2001) observed that due to increases in real returns to production, processing and marketing of tradables, arising from the implementation of economic reforms including devaluation, there was a significant shift by households from non-farm activities to agricultural production thereby inducing household income sources diversification.
In Ethiopia, there was a large reallocation of labour from the public sector between 1990 and 1994, coupled with an increase in unemployment. However, after 1994, there was a slight decline in unemployment which was associated with an increase in private sector employment and self-employment (Dercon et al., 2005). In Mexico the labour reallocation took the form of promoting the employment of mainly the professionals. Although the percentage of top managers decreased, in the public sector compared to the private sector, the percentage of professionals increased from 18.0 to 27.1 percent of the total public sector employment. By extension, Horton et al. (1994) observed that in most developing countries where economic reforms were implemented; there was a shift of labour from formal to the informal sector, increase in self-employment, and increase in women participation rates in the labour markets.
Wells & Wall (2003) argued that in Kenya and Tanzania economic reforms led to a structural shift from formal to informal construction systems and generated employment opportunities8 due to the labour intensive technology. The formal construction systems were characterized by building plans being drawn by architects, approval of plans by the urban planning authority, tendering of construction works, use of capital intensive technology both in the production of building materials (such as concrete blocks, quarrying, steel doors/windows, timber) and on-site construction (by big construction firms using machines to mix concrete, lift materials). Under the informal construction system, the building owners procure building plans from architects at a small fee, buy the materials, engage directly the services of artisans in the informal sector (who use the labour-intensive technology), and supervise the construction works themselves. By making use of the locally manufactured building materials9, the shift to informal construction systems further generated employment opportunities for artisans in the informal sector who also use labour-intensive technology. The rationale for the shift to the informal construction systems was both due to cost-effectiveness and the flexibility to build in stages. The privatization of state enterprises (that had previously monopolized the construction sector), the depreciation of local currencies, and deregulation of wages under the economic reforms can be argued to have altered the relative price of capital and labour, resulting in the adoption of labour-intensive technologies. The shift towards artisanal production may be viewed as an alternative model for industrial development which is a form of import substitution and offers wider participation with important implications for income distribution, poverty alleviation and human capital development.
8 Informal construction employment in Kenya rose from 17,800 in 1992 to 31,600 in 1995, representing an increase of about 75%. In Tanzania, there were 163,438 operators and employees working in the informal construction sector as compared to 22,000 employees in the formal construction enterprises (Wells and Wall, 2003:329) 9 The locally produced building materials include fabricated steel doors/widows, brick-making machines, pit sawed timber, hand crushed stones
22
However, the negative implications of the shift to informal construction systems may arise due to lack of regulation of the informal sector which may include an increase in the risk of unsafe or unsanitary structures being constructed, welfare10 concerns of building workers not being addressed, high probability of environmental degradation, and loss of tax revenues.
3.2.5 Poverty outcomes
One of the long term objectives of economic reforms was an improvement in household welfare as a trickle down effect from rapid private sector led economic growth. However, the impact of economic reforms on poverty may be influenced by a number of factors which include program design, existing economic and social structures, and characteristics of the poor (see for example, Hussain & Faruqee, 1994).
Kabananukye et al. (2004) and Appleton (2001) noted that in Uganda the reduction in the proportion of the population living in poverty during the 1990s can be explained by the adoption of policies and programmes which induced economic growth that enhanced poverty reduction. They further argue that the economy’s reform process coupled with changes in the international market gave way for the economy to grow, in a manner that relatively benefited poorer farmers through increased producer prices.
Glewwe & de Tray (1990) argued that in Cote d’Ivoire where the poor are mainly rural based and producing tradable agricultural products, economic reforms through the liberalization of marketing led to an increase in producer prices to the small-holder farmers, thus improving their welfare. This view was shared by Bigsten & Kayizzi-Mugerwa (1999) who observed that economic reforms in Uganda led to an increase in coffee prices which benefited small-holder peasant farmers. Deininger & Okidi (2003) found that coffee prices were significant in explaining poverty reduction in Uganda between 1992 and 1999. A simulation of an increase in coffee prices by about 10 percent was observed to lead to a reduction in poverty headcount index by approximately 6 percent points, hence implying the high elasticity of poverty with respect to agricultural export prices.
Some studies however, have indicated that economic reforms led to an increase in poverty. Marquette (1997) argued that in Zimbabwe economic reforms led to a worsening of the poverty situation which resulted from the combined effects of declining wages, rising unemployment, and inflation that led to a fall in the real income among the poor. This was evidenced by the high proportion of sampled poor households which reported that unemployment (33 percent) and low wages (47 percent) were the main causes of poverty.
Despite the rapid employment growth of the informal sector over the reform period, poverty reduction was in some cases observed to be minimal among such participants. Notwithstanding, the high employment generation within the micro and small enterprises (MSEs) sector in Kenya (employed nearly a third of the working population), the returns were low as compared to the poverty line, the formal sector minimum wages and private sector earnings (Daniels, 1999). Based on the urban and rural absolute poverty lines of Kshs 6,415 and Kshs 4,531 respectively, the results suggested that approximately 72 percent of the urban MSEs generated earnings below the poverty line as compared to 100 10 The welfare concerns include health and safety regulations, plus compensation arrangements in case of accidents
23
percent of the rural MSEs. Approximately 74 percent of the MSEs have average earnings which are below the formal sector minimum wage11, as compared to 91 percent of MSEs with average earnings below the private sector wage. Despite employment growth, the real earnings (wage) from these informal sector activities tended to have no significant effect on poverty reduction.
Household income may be influenced by other factors apart from economic reforms which in turn influence poverty outcomes at the household level. An econometric estimation by Alwang et al. (1996) in the Zambian case suggested that household size and dependency ratio have negative and significant effects on per capita household expenditures, which was interpreted as contributing to an increase in poverty. The education level of the household head and land ownership was observed to have positive and significant effects on household per capita expenditure, thus contributing to poverty reduction. Increased distances from key facilities (markets, transportation facilities, primary schools) had a negative and significant effect on per capita income, which was associated with increased poverty. Based on the smallholder model, Alwang et al. (1996) made the following propositions in enhancing poverty alleviation: improvement in access to markets (product, credit and labour), investments that free up women’s time (e.g. water, clinics, better roads), and improved technology dissemination (e.g. ox-plough technology).
11 The reference category was the lowest monthly minimum wage in Kenya for general labourers which was Kshs1,904 for Nairobi and Mombasa, Kshs1,755 for other municipalities, and Kshs1,070 for the rest of the country.
24
4. Data
The data are from a series of nationally representative cross-section household surveys conducted by UBoS. Although the Bureau has conducted eight rounds of such surveys, we focus on the 1992/93, 1999/00 and 2002/03 survey rounds (hereafter 1992, 1999 and 2002, respectively). The 1992 round was conducted from March 1992 to February 1993, covering 9,923 household with 46,107 individuals. The 1999 round was conducted from August 1999 – July 2000 covering 10,696 households with 55,617 individuals. However, some four districts including Kitgum, Gulu, Kasese and Bundibugyo were excluded from the survey because of insurgences at the time of the survey. The latest survey at the time of writing this study is the 2002 round that was conducted from May 2002 to April 2003 excluding the month of September12, covering 9,711 households with 48,560 individuals. However, Pader district (which was part of Kitgum district) was not covered.
These surveys were conducted using a consistent methodology by UBoS but based on different sampling frames. The sampling frame for 1992 and 1999 survey rounds was based on the 1991 Population and Housing Census; whereas the latest survey was based on the cartographic work for the 2002 Population and Housing Census. However, according to Bureau “using different frames does not affect the validity of estimates nor their comparability so long as in both frames the Enumeration Areas (EAs) are mutually exclusive and exhaustively cover the areas surveyed without any duplication and the data used for pps sampling are not far from the true values”. Nevertheless, the results have to be interpreted against this background. The sample design was similar across the surveys. A multi-stage stratified sampling approach was followed, in which each district13 was treated as a separate stratum. The samples were designed to ensure representation at national, regional and rural/urban. As previously discussed, the statistical analysis incorporates the appropriate weights and formulas to account for the sampling procedure. For detailed information see the respective socio-economic survey reports by UBoS.
These surveys were designed and implemented with multipurpose topics and objectives. However, the socio-economic and community modules were common to all surveys. The socio-economic module collected information of individual member socio-demographic characteristics including education, activity status, age and sex to name a few. The community module was designed to collect data on characteristics of Local Councils (LC 1), including the economic and social infrastructure such as roads, banks, health facilities, schools, markets and demographic information relating to communities residing in the sampled EA. In addition to these common modules, the 2002 survey round included the first ever comprehensive labour module in Uganda. This module was designed with some modification to suit the International Labour Organisation (ILO) standards.
As noted above, geographical coverage varied across the surveys under considerations. Due to insurgency in some districts at the time of the 1999 survey round we cannot claim to have a complete coverage of Uganda. Consequently, to make our results comparable over time, we omit all the five districts (Pader, Gulu, Kitgum, Kasese and Bundibugyo) from our analysis.
Labour information: In the earlier survey rounds, individuals in paid employment were requested to report both monetary and in-kind earnings collected from their main and
12 . This was the period when the 2002 Population and Housing Census was conducted. 13 . Uganda has several administrative units in the following hierarchy; region, districts, Local councils (LC) 5, 4, 3, 2 and 1. In other words, Local Council 1 is the lowest administrative unit.

25
secondary activities. However, the survey of 2002/03 gathered information only on monetary earnings from the main activity. Therefore, for comparability over time all our analyses on wages/salaries use only the data for the main activity. We do not include non-monetary earnings. By extension, wage information was collected for the last 12 months (long reference period) in the earlier surveys whereas for the recent survey it was gathered during the last 7 days (short reference period) prior to the interview. We converted the wage information to a monthly basis. The wages information was collected as net of taxes (see details in the survey manual of instructions). Individuals also reported details on the employment status, industry and occupation status. But the study focuses on information reported for the long reference period for the main activity.
For consistent comparability over time, the analysis is restricted to the same geographical coverage as in the 1999 survey round. For the econometric analysis, the sample is restricted to include individuals between 15 to 6414 years of age excluding those attending school, too old/young to work, disabled and pensioners. A total sample of 17,510 individuals in 1992; 20,653 in 1999 and 17,773 in 2003 satisfy these criteria. Of these, the working sample in paid employment consisted of 3,402 employees in 1992; 2,860 in 1999 and 3,005 in 2002. For the wage equations, the sample was further reduced by eliminating those employees with missing wage information15. The samples are further divided into self-employment in agriculture, self employment in non-agriculture, private and public sector workers. Our analysis is able to capture two important periods in Uganda’s poverty reduction efforts, namely period of poverty reduction 1992-99 and 1999-02 a reversal in poverty reduction. These series of household surveys also capture the period of economic reforms in Uganda. The study discusses the labour market activities of the individuals rather than focusing on the activities of the head of the household.
14 . One would have restricted the analysis to the retirement age of 60 years. However, the retirement age for the Government workers has evolved overtime from 55 to 60 years. Instead we followed the ILO standards and restricted the analysis to 15-64 years of age for the economically active population. 15 . Paid employees with missing wage/salary information were 7.8, 13.0 and 17.0 percent for 1992, 1999 and 2002 respectively. The seemingly higher percentage for 2002 has to be interpreted with caution. Since the question on wages was restricted to only those individuals that had worked during the last 7 days prior to the survey. Those individuals who had not worked in the reference period due to ill-health etc but had a job to get back to, their wage information was not gathered.
26
5. Labour market, employment and poverty: A characterization
In this section we present and discuss the changes in the labour market – employment and wages - and how these changes relate to poverty and the reforms implemented by the Government. The section is subdivided into three sections. First, we present the structure of the labour market in terms of labour force and labour participation rates for the population aged 15 to 64 years. Labour force refers to potential workers not necessarily in active workforce. Second, a discussion of the trends in employment structure and employment-poverty linkage is presented. Lastly, we examine the changes in the wage structure and later link it to poverty. 5.1 Structure of the labour market and trends
Labour force: The labour market is characterised by high rates of population growth (3.3 percent p.a.) and labour force growth. Table 6 presents the evolution of the labour force for individuals aged 15 to 64 years in Uganda since 1992. The labour force increased from 7.7 million in 1992 to 10.8 million in 2002, suggesting an average annual growth rate of 3.4 percent. In absolute terms, this represents an addition of 0.4 million to labour supply annually. With regard to location, the urban areas experienced faster growth in the labour force compared to rural areas. This is largely explained by the rural-urban migration. On the other hands, labour force growth has a regional dimension especially after 1999. The negative growth in the Northern region is explained by the insurgence that has persisted in the area since the late 1980s. Worth noting, is the result suggesting that the labour force is skewed towards the young generation. Uganda has nearly a fifth of its child population in the age group 15-19 years in the labour force, and the trend increased up to 1999 before declining in 2002.
The distribution of the labour force by gender displays a higher proportion of females than of males, a pattern consistent as that observed elsewhere in developing countries. With regard to educational attainment, the Ugandan labour force has become more educated, both for females and males. Table 6 shows the educational attainment of the overall labour force in Uganda since 1992. There have been significant drops in the proportion of individuals with no formal education especially for females, followed by increases in those with completed primary and above (Fig. 1 refers). By contrast, the proportion of females with some primary education increased against a falling trend for males at the same level. The improvements in the primary education are partly attributed to UPE16. Other contributory factors include privatization of the education system that saw an increased participation of the private sector. This in turn improved access to education.
The increases in the proportions with some secondary education were comparable between females and males, 4.9 and 4.1 percentage points between 1999 and 2002. The proportion of the female labour force with completed secondary education increased by 0.8 percentage points, a change comparable to that of males of 0.43 over the same period. In other words, the labour force in Uganda did experience a gender pattern of the changes in education composition over the entire period. Like for the entire labour force, there have been changes in the education composition of the youth defined as those aged 25-29 years (see Fig. 2). The results reveal that between 1992 and 1999 the proportion with
16 . For instance, the enrolment rates for children 6-12 years of age increased from 60 percent in 1992 to 85 percent in 2002, with an almost narrowed gender gap.
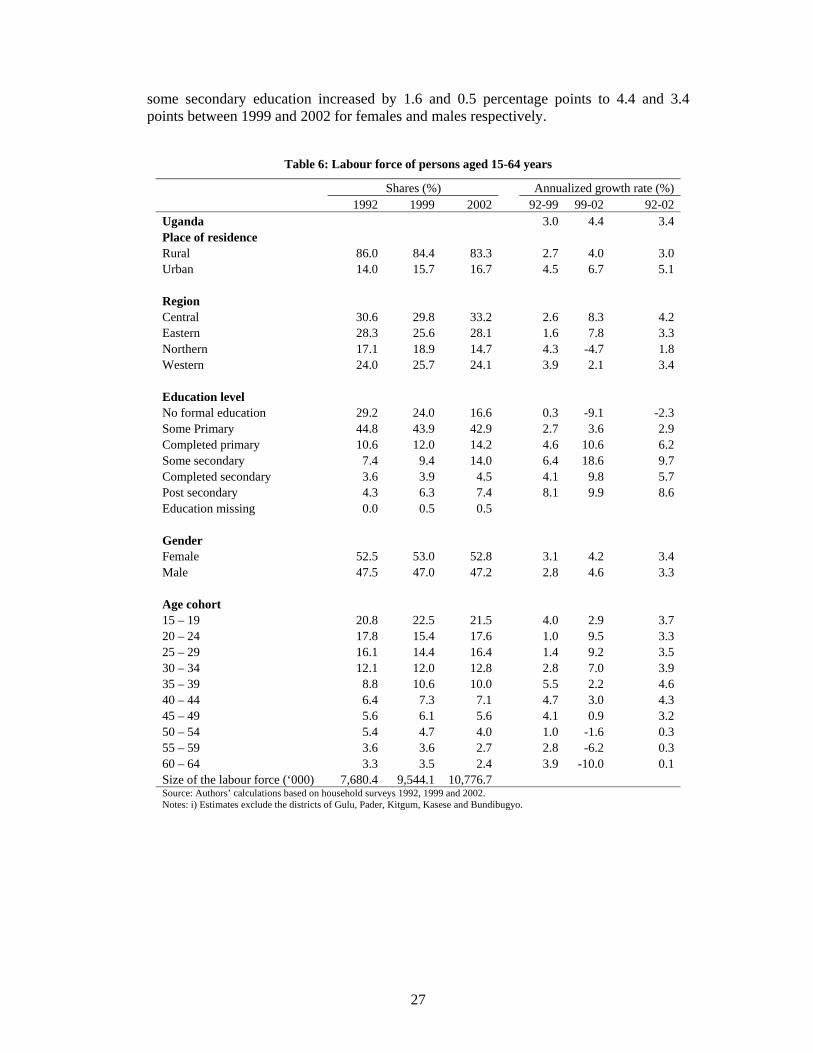
27
some secondary education increased by 1.6 and 0.5 percentage points to 4.4 and 3.4 points between 1999 and 2002 for females and males respectively.
Table 6: Labour force of persons aged 15-64 years
Shares (%) Annualized growth rate (%) 1992 1999 2002 92-99 99-02 92-02 Uganda 3.0 4.4 3.4 Place of residence Rural 86.0 84.4 83.3 2.7 4.0 3.0 Urban 14.0 15.7 16.7 4.5 6.7 5.1 Region Central 30.6 29.8 33.2 2.6 8.3 4.2 Eastern 28.3 25.6 28.1 1.6 7.8 3.3 Northern 17.1 18.9 14.7 4.3 -4.7 1.8 Western 24.0 25.7 24.1 3.9 2.1 3.4 Education level No formal education 29.2 24.0 16.6 0.3 -9.1 -2.3 Some Primary 44.8 43.9 42.9 2.7 3.6 2.9 Completed primary 10.6 12.0 14.2 4.6 10.6 6.2 Some secondary 7.4 9.4 14.0 6.4 18.6 9.7 Completed secondary 3.6 3.9 4.5 4.1 9.8 5.7 Post secondary 4.3 6.3 7.4 8.1 9.9 8.6 Education missing 0.0 0.5 0.5 Gender Female 52.5 53.0 52.8 3.1 4.2 3.4 Male 47.5 47.0 47.2 2.8 4.6 3.3 Age cohort 15 – 19 20.8 22.5 21.5 4.0 2.9 3.7 20 – 24 17.8 15.4 17.6 1.0 9.5 3.3 25 – 29 16.1 14.4 16.4 1.4 9.2 3.5 30 – 34 12.1 12.0 12.8 2.8 7.0 3.9 35 – 39 8.8 10.6 10.0 5.5 2.2 4.6 40 – 44 6.4 7.3 7.1 4.7 3.0 4.3 45 – 49 5.6 6.1 5.6 4.1 0.9 3.2 50 – 54 5.4 4.7 4.0 1.0 -1.6 0.3 55 – 59 3.6 3.6 2.7 2.8 -6.2 0.3 60 – 64 3.3 3.5 2.4 3.9 -10.0 0.1 Size of the labour force (‘000) 7,680.4 9,544.1 10,776.7 Source: Authors’ calculations based on household surveys 1992, 1999 and 2002. Notes: i) Estimates exclude the districts of Gulu, Pader, Kitgum, Kasese and Bundibugyo.
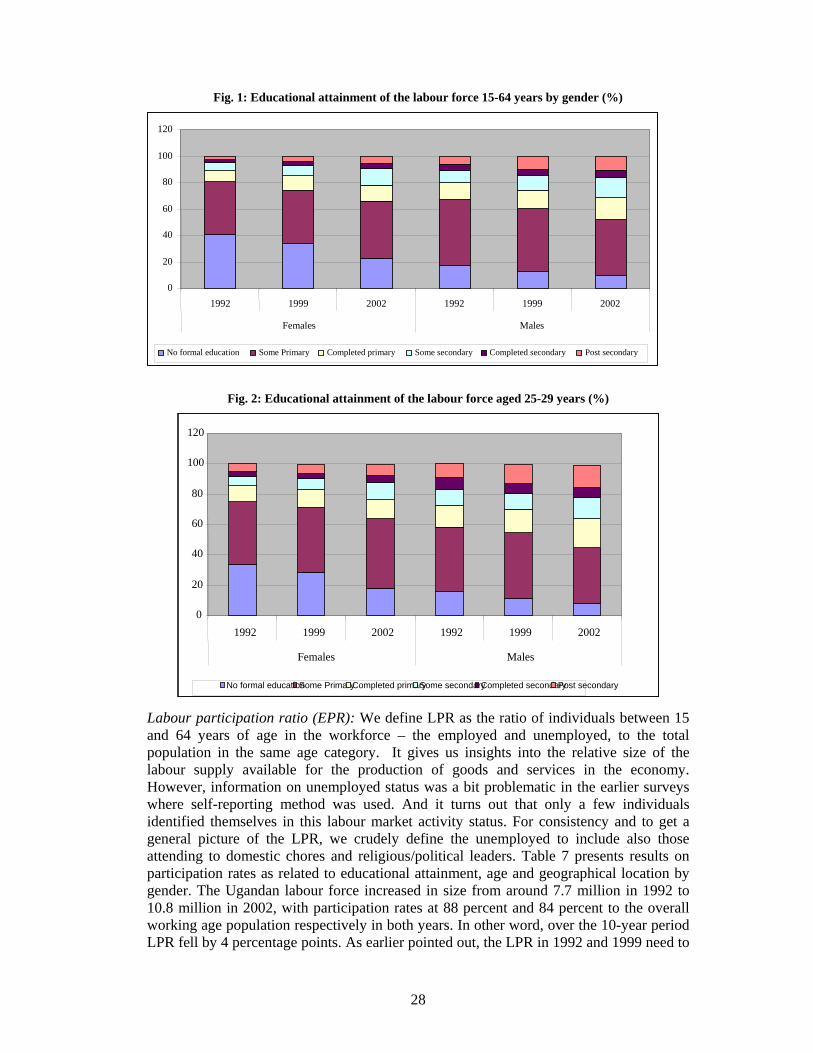
28
Fig. 1: Educational attainment of the labour force 15-64 years by gender (%)
Fig. 2: Educational attainment of the labour force aged 25-29 years (%)
Labour participation ratio (EPR): We define LPR as the ratio of individuals between 15 and 64 years of age in the workforce – the employed and unemployed, to the total population in the same age category. It gives us insights into the relative size of the labour supply available for the production of goods and services in the economy. However, information on unemployed status was a bit problematic in the earlier surveys where self-reporting method was used. And it turns out that only a few individuals identified themselves in this labour market activity status. For consistency and to get a general picture of the LPR, we crudely define the unemployed to include also those attending to domestic chores and religious/political leaders. Table 7 presents results on participation rates as related to educational attainment, age and geographical location by gender. The Ugandan labour force increased in size from around 7.7 million in 1992 to 10.8 million in 2002, with participation rates at 88 percent and 84 percent to the overall working age population respectively in both years. In other word, over the 10-year period LPR fell by 4 percentage points. As earlier pointed out, the LPR in 1992 and 1999 need to
0
20
40
60
80
100
120
1992 1999 2002 1992 1999 2002
Females Males
No formal education Some Primary Completed primary Some secondary Completed secondary Post secondary
0
20
40
60
80
100
120
1992 1999 2002 1992 1999 2002 Females Males
No formal education Some PrimaryCompleted primarySome secondaryCompleted secondaryPost secondary

29
be deciphered cautiously. But focusing on 2002 results we observe that the participation rate increase with age and a higher participation of females compared to males. In terms of education, the results are mixed, with participation least for those individuals with some secondary education and highest for those with no formal education.
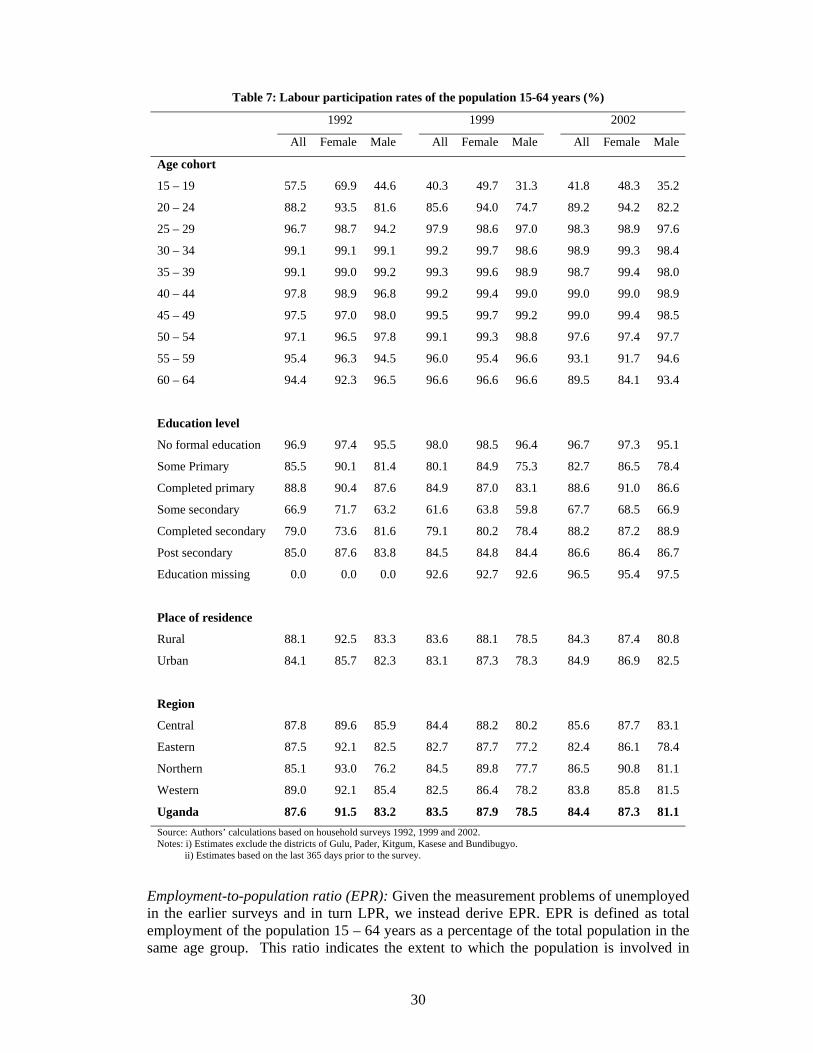
30
Table 7: Labour participation rates of the population 15-64 years (%)
1992 1999 2002
All Female Male All Female Male All Female Male
Age cohort
15 – 19 57.5 69.9 44.6 40.3 49.7 31.3 41.8 48.3 35.2
20 – 24 88.2 93.5 81.6 85.6 94.0 74.7 89.2 94.2 82.2
25 – 29 96.7 98.7 94.2 97.9 98.6 97.0 98.3 98.9 97.6
30 – 34 99.1 99.1 99.1 99.2 99.7 98.6 98.9 99.3 98.4
35 – 39 99.1 99.0 99.2 99.3 99.6 98.9 98.7 99.4 98.0
40 – 44 97.8 98.9 96.8 99.2 99.4 99.0 99.0 99.0 98.9
45 – 49 97.5 97.0 98.0 99.5 99.7 99.2 99.0 99.4 98.5
50 – 54 97.1 96.5 97.8 99.1 99.3 98.8 97.6 97.4 97.7
55 – 59 95.4 96.3 94.5 96.0 95.4 96.6 93.1 91.7 94.6
60 – 64 94.4 92.3 96.5 96.6 96.6 96.6 89.5 84.1 93.4
Education level
No formal education 96.9 97.4 95.5 98.0 98.5 96.4 96.7 97.3 95.1
Some Primary 85.5 90.1 81.4 80.1 84.9 75.3 82.7 86.5 78.4
Completed primary 88.8 90.4 87.6 84.9 87.0 83.1 88.6 91.0 86.6
Some secondary 66.9 71.7 63.2 61.6 63.8 59.8 67.7 68.5 66.9
Completed secondary 79.0 73.6 81.6 79.1 80.2 78.4 88.2 87.2 88.9
Post secondary 85.0 87.6 83.8 84.5 84.8 84.4 86.6 86.4 86.7
Education missing 0.0 0.0 0.0 92.6 92.7 92.6 96.5 95.4 97.5
Place of residence
Rural 88.1 92.5 83.3 83.6 88.1 78.5 84.3 87.4 80.8
Urban 84.1 85.7 82.3 83.1 87.3 78.3 84.9 86.9 82.5
Region
Central 87.8 89.6 85.9 84.4 88.2 80.2 85.6 87.7 83.1
Eastern 87.5 92.1 82.5 82.7 87.7 77.2 82.4 86.1 78.4
Northern 85.1 93.0 76.2 84.5 89.8 77.7 86.5 90.8 81.1
Western 89.0 92.1 85.4 82.5 86.4 78.2 83.8 85.8 81.5
Uganda 87.6 91.5 83.2 83.5 87.9 78.5 84.4 87.3 81.1 Source: Authors’ calculations based on household surveys 1992, 1999 and 2002. Notes: i) Estimates exclude the districts of Gulu, Pader, Kitgum, Kasese and Bundibugyo. ii) Estimates based on the last 365 days prior to the survey.
Employment-to-population ratio (EPR): Given the measurement problems of unemployed in the earlier surveys and in turn LPR, we instead derive EPR. EPR is defined as total employment of the population 15 – 64 years as a percentage of the total population in the same age group. This ratio indicates the extent to which the population is involved in
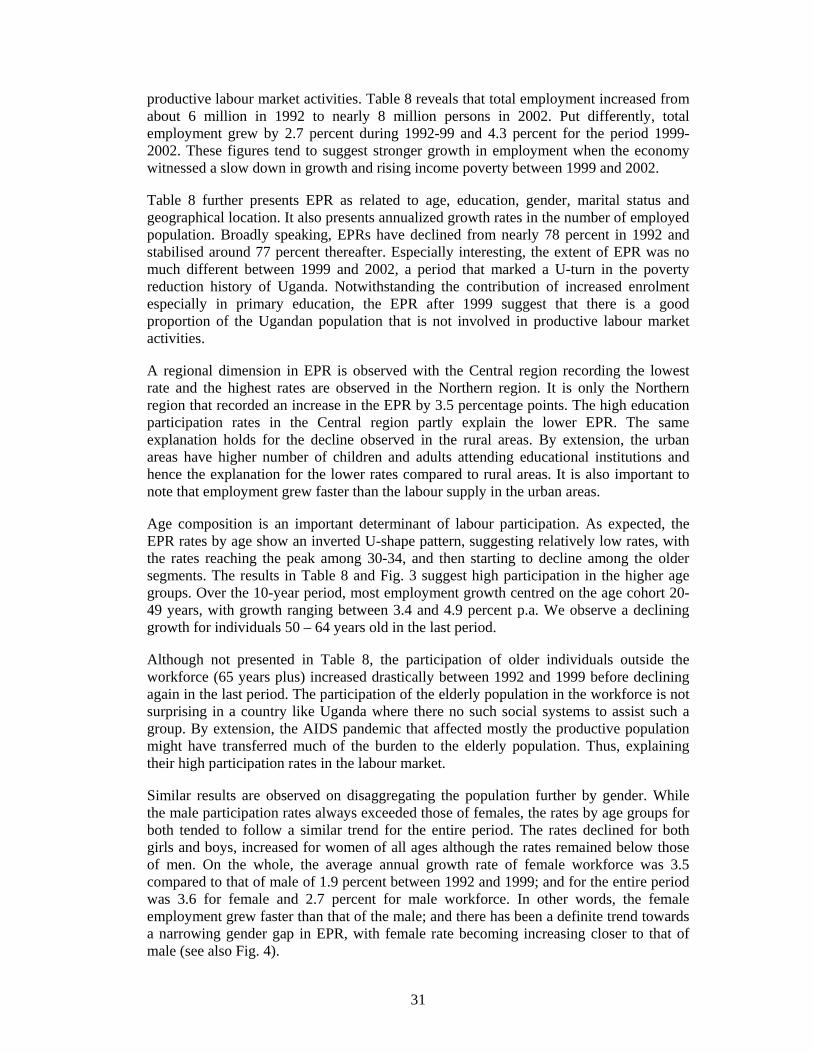
31
productive labour market activities. Table 8 reveals that total employment increased from about 6 million in 1992 to nearly 8 million persons in 2002. Put differently, total employment grew by 2.7 percent during 1992-99 and 4.3 percent for the period 1999-2002. These figures tend to suggest stronger growth in employment when the economy witnessed a slow down in growth and rising income poverty between 1999 and 2002.
Table 8 further presents EPR as related to age, education, gender, marital status and geographical location. It also presents annualized growth rates in the number of employed population. Broadly speaking, EPRs have declined from nearly 78 percent in 1992 and stabilised around 77 percent thereafter. Especially interesting, the extent of EPR was no much different between 1999 and 2002, a period that marked a U-turn in the poverty reduction history of Uganda. Notwithstanding the contribution of increased enrolment especially in primary education, the EPR after 1999 suggest that there is a good proportion of the Ugandan population that is not involved in productive labour market activities.
A regional dimension in EPR is observed with the Central region recording the lowest rate and the highest rates are observed in the Northern region. It is only the Northern region that recorded an increase in the EPR by 3.5 percentage points. The high education participation rates in the Central region partly explain the lower EPR. The same explanation holds for the decline observed in the rural areas. By extension, the urban areas have higher number of children and adults attending educational institutions and hence the explanation for the lower rates compared to rural areas. It is also important to note that employment grew faster than the labour supply in the urban areas.
Age composition is an important determinant of labour participation. As expected, the EPR rates by age show an inverted U-shape pattern, suggesting relatively low rates, with the rates reaching the peak among 30-34, and then starting to decline among the older segments. The results in Table 8 and Fig. 3 suggest high participation in the higher age groups. Over the 10-year period, most employment growth centred on the age cohort 20-49 years, with growth ranging between 3.4 and 4.9 percent p.a. We observe a declining growth for individuals 50 – 64 years old in the last period.
Although not presented in Table 8, the participation of older individuals outside the workforce (65 years plus) increased drastically between 1992 and 1999 before declining again in the last period. The participation of the elderly population in the workforce is not surprising in a country like Uganda where there no such social systems to assist such a group. By extension, the AIDS pandemic that affected mostly the productive population might have transferred much of the burden to the elderly population. Thus, explaining their high participation rates in the labour market.
Similar results are observed on disaggregating the population further by gender. While the male participation rates always exceeded those of females, the rates by age groups for both tended to follow a similar trend for the entire period. The rates declined for both girls and boys, increased for women of all ages although the rates remained below those of men. On the whole, the average annual growth rate of female workforce was 3.5 compared to that of male of 1.9 percent between 1992 and 1999; and for the entire period was 3.6 for female and 2.7 percent for male workforce. In other words, the female employment grew faster than that of the male; and there has been a definite trend towards a narrowing gender gap in EPR, with female rate becoming increasing closer to that of male (see also Fig. 4).
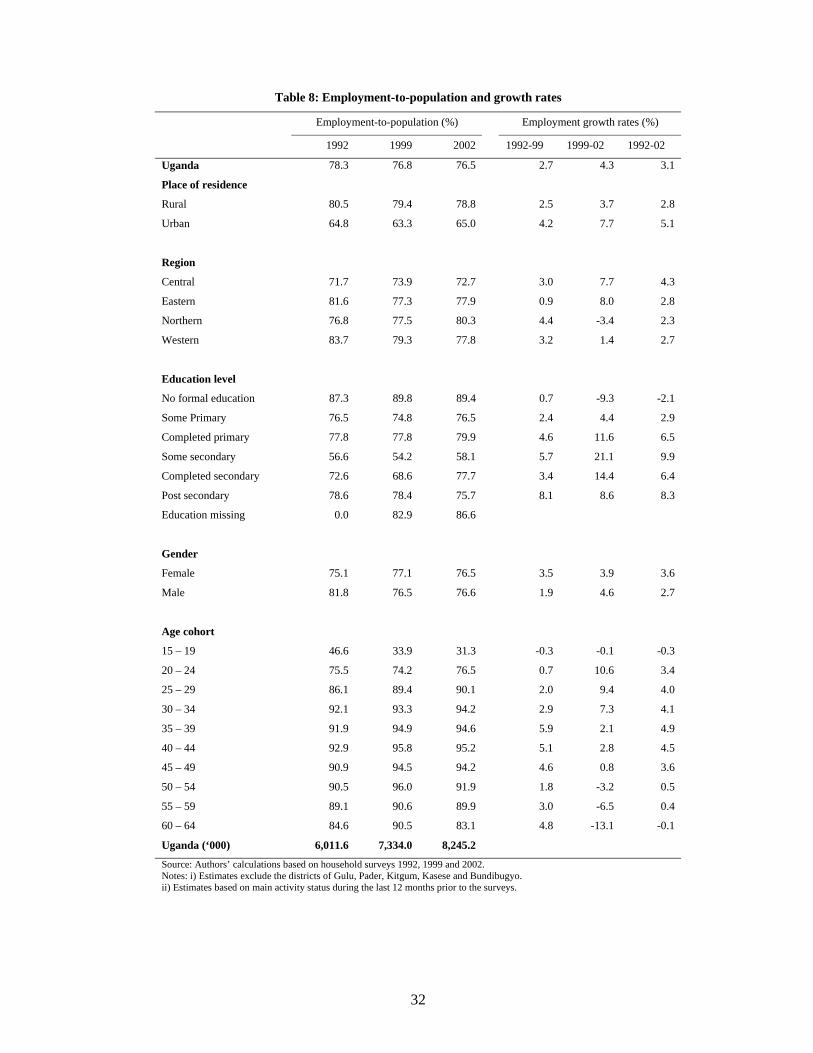
32
Table 8: Employment-to-population and growth rates
Employment-to-population (%) Employment growth rates (%)
1992 1999 2002 1992-99 1999-02 1992-02
Uganda 78.3 76.8 76.5 2.7 4.3 3.1
Place of residence
Rural 80.5 79.4 78.8 2.5 3.7 2.8
Urban 64.8 63.3 65.0 4.2 7.7 5.1
Region
Central 71.7 73.9 72.7 3.0 7.7 4.3
Eastern 81.6 77.3 77.9 0.9 8.0 2.8
Northern 76.8 77.5 80.3 4.4 -3.4 2.3
Western 83.7 79.3 77.8 3.2 1.4 2.7
Education level
No formal education 87.3 89.8 89.4 0.7 -9.3 -2.1
Some Primary 76.5 74.8 76.5 2.4 4.4 2.9
Completed primary 77.8 77.8 79.9 4.6 11.6 6.5
Some secondary 56.6 54.2 58.1 5.7 21.1 9.9
Completed secondary 72.6 68.6 77.7 3.4 14.4 6.4
Post secondary 78.6 78.4 75.7 8.1 8.6 8.3
Education missing 0.0 82.9 86.6
Gender
Female 75.1 77.1 76.5 3.5 3.9 3.6
Male 81.8 76.5 76.6 1.9 4.6 2.7
Age cohort
15 – 19 46.6 33.9 31.3 -0.3 -0.1 -0.3
20 – 24 75.5 74.2 76.5 0.7 10.6 3.4
25 – 29 86.1 89.4 90.1 2.0 9.4 4.0
30 – 34 92.1 93.3 94.2 2.9 7.3 4.1
35 – 39 91.9 94.9 94.6 5.9 2.1 4.9
40 – 44 92.9 95.8 95.2 5.1 2.8 4.5
45 – 49 90.9 94.5 94.2 4.6 0.8 3.6
50 – 54 90.5 96.0 91.9 1.8 -3.2 0.5
55 – 59 89.1 90.6 89.9 3.0 -6.5 0.4
60 – 64 84.6 90.5 83.1 4.8 -13.1 -0.1
Uganda (‘000) 6,011.6 7,334.0 8,245.2
Source: Authors’ calculations based on household surveys 1992, 1999 and 2002. Notes: i) Estimates exclude the districts of Gulu, Pader, Kitgum, Kasese and Bundibugyo. ii) Estimates based on main activity status during the last 12 months prior to the surveys.
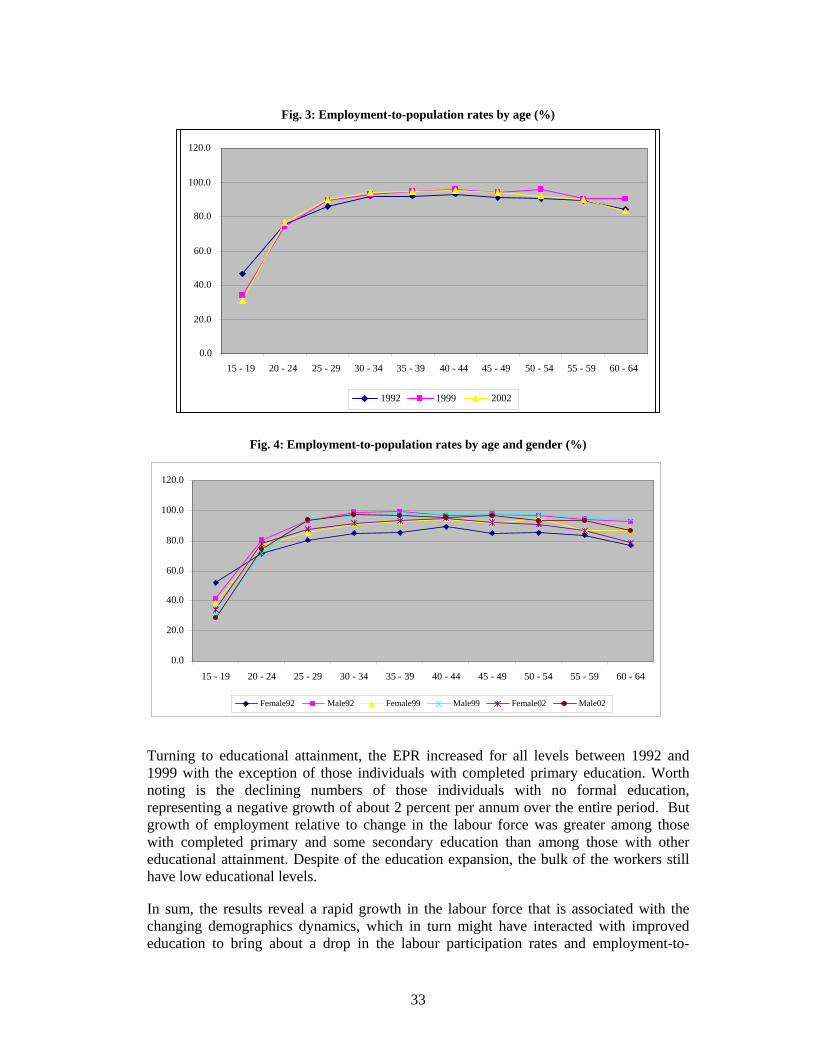
33
Fig. 3: Employment-to-population rates by age (%)
Fig. 4: Employment-to-population rates by age and gender (%)
Turning to educational attainment, the EPR increased for all levels between 1992 and 1999 with the exception of those individuals with completed primary education. Worth noting is the declining numbers of those individuals with no formal education, representing a negative growth of about 2 percent per annum over the entire period. But growth of employment relative to change in the labour force was greater among those with completed primary and some secondary education than among those with other educational attainment. Despite of the education expansion, the bulk of the workers still have low educational levels.
In sum, the results reveal a rapid growth in the labour force that is associated with the changing demographics dynamics, which in turn might have interacted with improved education to bring about a drop in the labour participation rates and employment-to-
0.0
20.0
40.0
60.0
80.0
100.0
120.0
15 - 19 20 - 24 25 - 29 30 - 34 35 - 39 40 - 44 45 - 49 50 - 54 55 - 59 60 - 64
1992 1999 2002
0.0
20.0
40.0
60.0
80.0
100.0
120.0
15 - 19 20 - 24 25 - 29 30 - 34 35 - 39 40 - 44 45 - 49 50 - 54 55 - 59 60 - 64
Female92 Male92 Female99 Male99 Female02 Male02
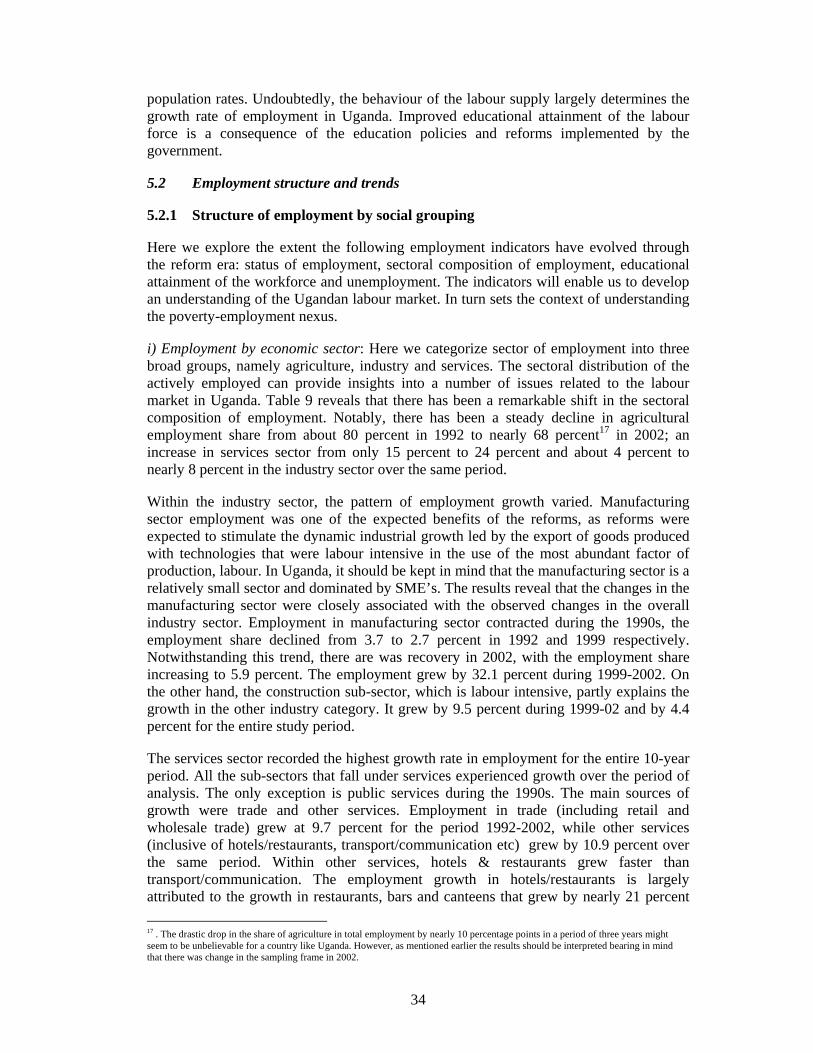
34
population rates. Undoubtedly, the behaviour of the labour supply largely determines the growth rate of employment in Uganda. Improved educational attainment of the labour force is a consequence of the education policies and reforms implemented by the government.
5.2 Employment structure and trends
5.2.1 Structure of employment by social grouping
Here we explore the extent the following employment indicators have evolved through the reform era: status of employment, sectoral composition of employment, educational attainment of the workforce and unemployment. The indicators will enable us to develop an understanding of the Ugandan labour market. In turn sets the context of understanding the poverty-employment nexus.
i) Employment by economic sector: Here we categorize sector of employment into three broad groups, namely agriculture, industry and services. The sectoral distribution of the actively employed can provide insights into a number of issues related to the labour market in Uganda. Table 9 reveals that there has been a remarkable shift in the sectoral composition of employment. Notably, there has been a steady decline in agricultural employment share from about 80 percent in 1992 to nearly 68 percent17 in 2002; an increase in services sector from only 15 percent to 24 percent and about 4 percent to nearly 8 percent in the industry sector over the same period.
Within the industry sector, the pattern of employment growth varied. Manufacturing sector employment was one of the expected benefits of the reforms, as reforms were expected to stimulate the dynamic industrial growth led by the export of goods produced with technologies that were labour intensive in the use of the most abundant factor of production, labour. In Uganda, it should be kept in mind that the manufacturing sector is a relatively small sector and dominated by SME’s. The results reveal that the changes in the manufacturing sector were closely associated with the observed changes in the overall industry sector. Employment in manufacturing sector contracted during the 1990s, the employment share declined from 3.7 to 2.7 percent in 1992 and 1999 respectively. Notwithstanding this trend, there are was recovery in 2002, with the employment share increasing to 5.9 percent. The employment grew by 32.1 percent during 1999-2002. On the other hand, the construction sub-sector, which is labour intensive, partly explains the growth in the other industry category. It grew by 9.5 percent during 1999-02 and by 4.4 percent for the entire study period.
The services sector recorded the highest growth rate in employment for the entire 10-year period. All the sub-sectors that fall under services experienced growth over the period of analysis. The only exception is public services during the 1990s. The main sources of growth were trade and other services. Employment in trade (including retail and wholesale trade) grew at 9.7 percent for the period 1992-2002, while other services (inclusive of hotels/restaurants, transport/communication etc) grew by 10.9 percent over the same period. Within other services, hotels & restaurants grew faster than transport/communication. The employment growth in hotels/restaurants is largely attributed to the growth in restaurants, bars and canteens that grew by nearly 21 percent 17 . The drastic drop in the share of agriculture in total employment by nearly 10 percentage points in a period of three years might seem to be unbelievable for a country like Uganda. However, as mentioned earlier the results should be interpreted bearing in mind that there was change in the sampling frame in 2002.
35
during 1992-02. The strong growth in the road transport (including the boda boda transport) of nearly 10.5 percent p.a largely explains the employment growth in the transport/communication sub-sector. On the other hand, the public services employment declined by 1.3 percent during 1992-99 and grew by 9 percent for the period 1999-02. The public services sub-sector is a heterogenous sector comprising of highly skilled jobs such as in public administration, education, health and others that require less formal education such as army; but also include services offered by the private and public sectors. The presence of the public sector in this sub-sector partly explains the low growth relative to other sub-sectors within the services sector. Further disaggregation reveals that over a 10-year period, employment in the education sub-sector grew annually by 5.2 percent, health sub-sector by 3.2 and public administration and defence declined by 6.4 percent.
Broadly speaking, there have been structural changes in employment away from agriculture but the rate of growth in employment remains well below that of the labour force. This presents a challenge to the government of creating an environment that will lead to creation of jobs to match the growth in the labour force. The shift in employment structure across sectors is consistent with the structural transformation in the economy (see Table 1).
Then, what role did the reforms play in the sectoral employment trends discussed above? The expectations of the reforms induced-job centred on activities producing tradable goods, while evolution of the employment in activities producing non-tradable goods and services was viewed as residual. The findings so far suggest that industry sector performed modestly in this regard, whereas the services sector was fairly dynamic in creating jobs. During the late 1990s some sub-sectors under the services sector were particularly stimulated by some of the reforms. The financial reforms led to the development of microfinance institutions that in turn made access to credit easier; liberalization stimulated the growth of the road transport especially the boda boda and taxi transport and also increased the participation of the private sector in education and health sub-sectors. Not much could be said about the export sub-sector in the agricultural sector as the household data could not permit this level of analysis.
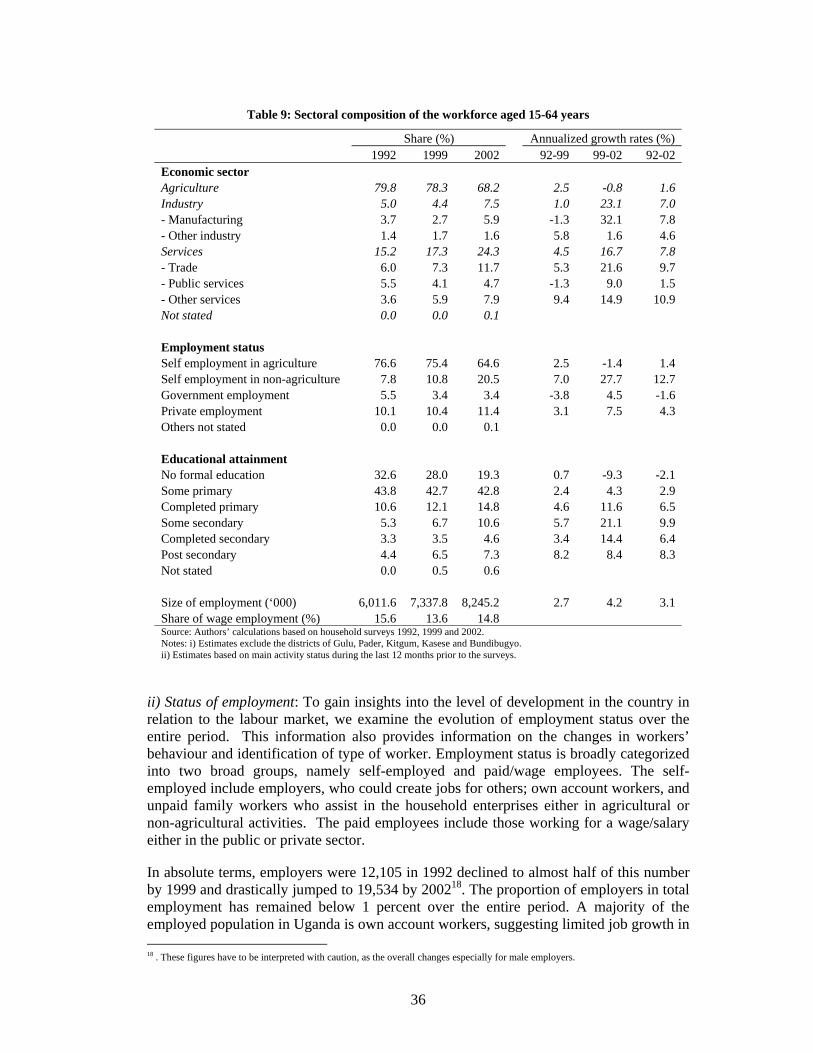
36
Table 9: Sectoral composition of the workforce aged 15-64 years
Share (%) Annualized growth rates (%) 1992 1999 2002 92-99 99-02 92-02 Economic sector Agriculture 79.8 78.3 68.2 2.5 -0.8 1.6 Industry 5.0 4.4 7.5 1.0 23.1 7.0 - Manufacturing 3.7 2.7 5.9 -1.3 32.1 7.8 - Other industry 1.4 1.7 1.6 5.8 1.6 4.6 Services 15.2 17.3 24.3 4.5 16.7 7.8 - Trade 6.0 7.3 11.7 5.3 21.6 9.7 - Public services 5.5 4.1 4.7 -1.3 9.0 1.5 - Other services 3.6 5.9 7.9 9.4 14.9 10.9 Not stated 0.0 0.0 0.1 Employment status Self employment in agriculture 76.6 75.4 64.6 2.5 -1.4 1.4 Self employment in non-agriculture 7.8 10.8 20.5 7.0 27.7 12.7 Government employment 5.5 3.4 3.4 -3.8 4.5 -1.6 Private employment 10.1 10.4 11.4 3.1 7.5 4.3 Others not stated 0.0 0.0 0.1 Educational attainment No formal education 32.6 28.0 19.3 0.7 -9.3 -2.1 Some primary 43.8 42.7 42.8 2.4 4.3 2.9 Completed primary 10.6 12.1 14.8 4.6 11.6 6.5 Some secondary 5.3 6.7 10.6 5.7 21.1 9.9 Completed secondary 3.3 3.5 4.6 3.4 14.4 6.4 Post secondary 4.4 6.5 7.3 8.2 8.4 8.3 Not stated 0.0 0.5 0.6 Size of employment (‘000) 6,011.6 7,337.8 8,245.2 2.7 4.2 3.1 Share of wage employment (%) 15.6 13.6 14.8 Source: Authors’ calculations based on household surveys 1992, 1999 and 2002. Notes: i) Estimates exclude the districts of Gulu, Pader, Kitgum, Kasese and Bundibugyo. ii) Estimates based on main activity status during the last 12 months prior to the surveys.
ii) Status of employment: To gain insights into the level of development in the country in relation to the labour market, we examine the evolution of employment status over the entire period. This information also provides information on the changes in workers’ behaviour and identification of type of worker. Employment status is broadly categorized into two broad groups, namely self-employed and paid/wage employees. The self-employed include employers, who could create jobs for others; own account workers, and unpaid family workers who assist in the household enterprises either in agricultural or non-agricultural activities. The paid employees include those working for a wage/salary either in the public or private sector.
In absolute terms, employers were 12,105 in 1992 declined to almost half of this number by 1999 and drastically jumped to 19,534 by 200218. The proportion of employers in total employment has remained below 1 percent over the entire period. A majority of the employed population in Uganda is own account workers, suggesting limited job growth in 18 . These figures have to be interpreted with caution, as the overall changes especially for male employers.
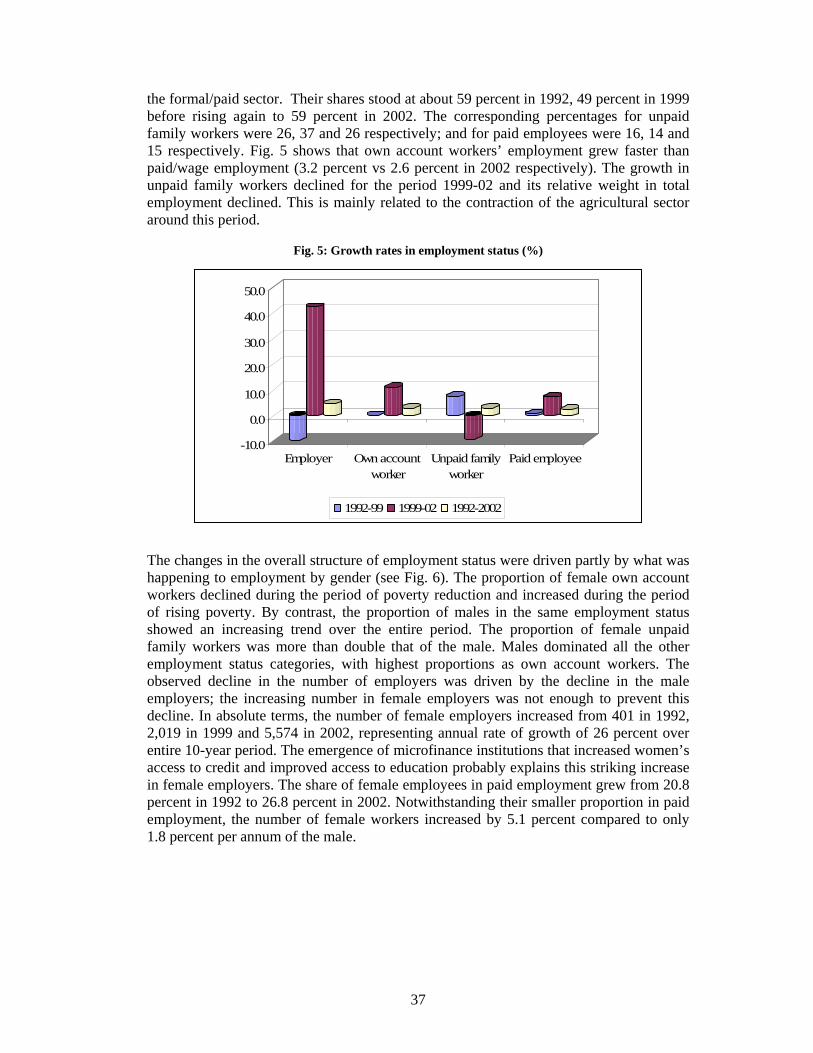
37
the formal/paid sector. Their shares stood at about 59 percent in 1992, 49 percent in 1999 before rising again to 59 percent in 2002. The corresponding percentages for unpaid family workers were 26, 37 and 26 respectively; and for paid employees were 16, 14 and 15 respectively. Fig. 5 shows that own account workers’ employment grew faster than paid/wage employment (3.2 percent vs 2.6 percent in 2002 respectively). The growth in unpaid family workers declined for the period 1999-02 and its relative weight in total employment declined. This is mainly related to the contraction of the agricultural sector around this period.
Fig. 5: Growth rates in employment status (%)
-10.0
0.0
10.0
20.0
30.0
40.0
50.0
Employer Own accountworker
Unpaid familyworker
Paid employee
1992-99 1999-02 1992-2002
The changes in the overall structure of employment status were driven partly by what was happening to employment by gender (see Fig. 6). The proportion of female own account workers declined during the period of poverty reduction and increased during the period of rising poverty. By contrast, the proportion of males in the same employment status showed an increasing trend over the entire period. The proportion of female unpaid family workers was more than double that of the male. Males dominated all the other employment status categories, with highest proportions as own account workers. The observed decline in the number of employers was driven by the decline in the male employers; the increasing number in female employers was not enough to prevent this decline. In absolute terms, the number of female employers increased from 401 in 1992, 2,019 in 1999 and 5,574 in 2002, representing annual rate of growth of 26 percent over entire 10-year period. The emergence of microfinance institutions that increased women’s access to credit and improved access to education probably explains this striking increase in female employers. The share of female employees in paid employment grew from 20.8 percent in 1992 to 26.8 percent in 2002. Notwithstanding their smaller proportion in paid employment, the number of female workers increased by 5.1 percent compared to only 1.8 percent per annum of the male.
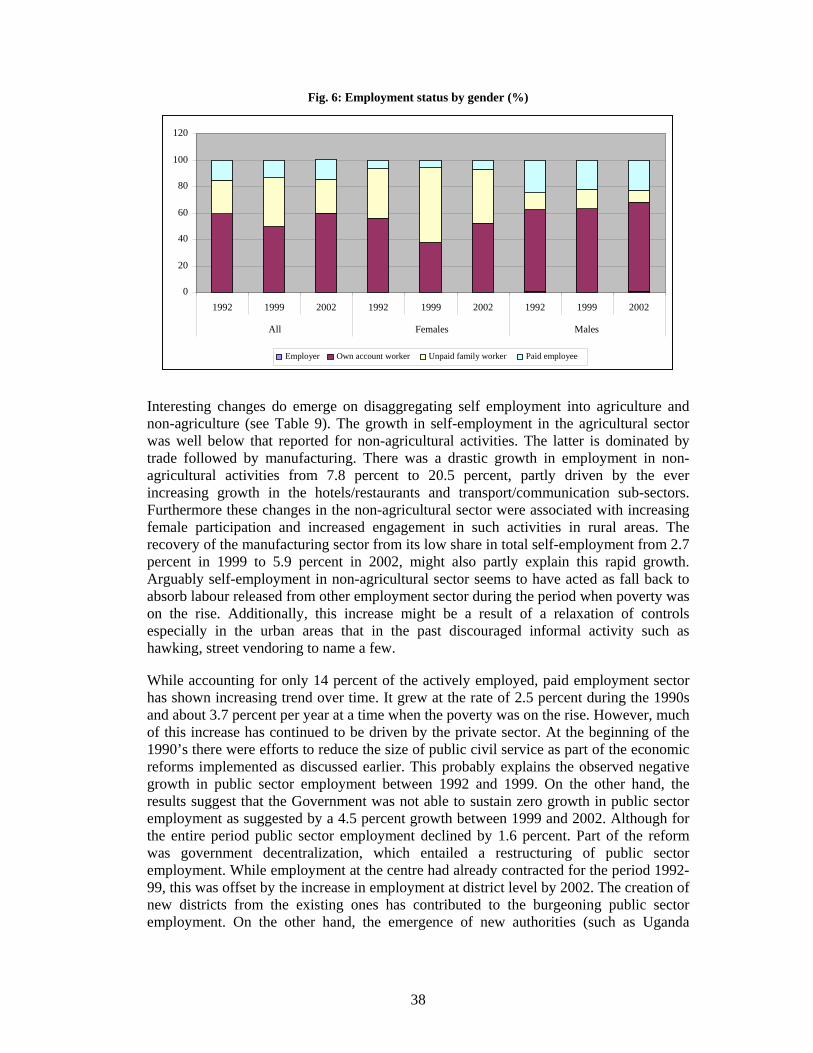
38
Fig. 6: Employment status by gender (%)
Interesting changes do emerge on disaggregating self employment into agriculture and non-agriculture (see Table 9). The growth in self-employment in the agricultural sector was well below that reported for non-agricultural activities. The latter is dominated by trade followed by manufacturing. There was a drastic growth in employment in non-agricultural activities from 7.8 percent to 20.5 percent, partly driven by the ever increasing growth in the hotels/restaurants and transport/communication sub-sectors. Furthermore these changes in the non-agricultural sector were associated with increasing female participation and increased engagement in such activities in rural areas. The recovery of the manufacturing sector from its low share in total self-employment from 2.7 percent in 1999 to 5.9 percent in 2002, might also partly explain this rapid growth. Arguably self-employment in non-agricultural sector seems to have acted as fall back to absorb labour released from other employment sector during the period when poverty was on the rise. Additionally, this increase might be a result of a relaxation of controls especially in the urban areas that in the past discouraged informal activity such as hawking, street vendoring to name a few.
While accounting for only 14 percent of the actively employed, paid employment sector has shown increasing trend over time. It grew at the rate of 2.5 percent during the 1990s and about 3.7 percent per year at a time when the poverty was on the rise. However, much of this increase has continued to be driven by the private sector. At the beginning of the 1990’s there were efforts to reduce the size of public civil service as part of the economic reforms implemented as discussed earlier. This probably explains the observed negative growth in public sector employment between 1992 and 1999. On the other hand, the results suggest that the Government was not able to sustain zero growth in public sector employment as suggested by a 4.5 percent growth between 1999 and 2002. Although for the entire period public sector employment declined by 1.6 percent. Part of the reform was government decentralization, which entailed a restructuring of public sector employment. While employment at the centre had already contracted for the period 1992-99, this was offset by the increase in employment at district level by 2002. The creation of new districts from the existing ones has contributed to the burgeoning public sector employment. On the other hand, the emergence of new authorities (such as Uganda
0
20
40
60
80
100
120
1992 1999 2002 1992 1999 2002 1992 1999 2002
All Females Males
Employer Own account worker Unpaid family worker Paid employee
39
Investment Authority, Uganda Cotton Authority, etc) and recruitment of teachers in UPE schools might account for the observed increase in public employees.
The working group is dominated by individuals between the ages of 20-39 years, consistent with their slightly higher number in the overall labour force19. The share of the working population outside the economically active age brackets while declined for the younger generation, a mixed picture emerges for the older generation. With regard to youth employment, positive growth rates are observed with highest growth between 1999 and 2002 period.
More critical examination of the employment status with age, education level, economic sector and geographical location yields interesting results (see Table 10). While males’ dominance in all employment groupings except self employment in agriculture is observed, their shares are falling with increasing participation of females. Worth noting is the increase of females in the self-employment in non-agricultural activities from nearly 38 percent in 1992 to about 45 percent in 1999 before falling to 43 percent in 2002. Share of female agricultural employment increased from 58 percent in 1992 to 60 percent in 1999 and 62 percent in 2002. The growth in the non-traditional exports such as flowers might have boosted the female employment in this sector. Employment rates for workers with less education fell throughout the period of analysis and this decline was higher for the self employment in agriculture. Over time, the private sector is continuing to demand for more educated employees, for instance the demand for post secondary employees increased form its low level in 1992 of 9 percent to 16.4 percent in 2002. However, we could not establish based on the survey data why the private sector’s demand for higher skilled employees increased. The raising of the labour force’s educational attainment might drive them to choose the most skilled employees even though their skill requirements are not that high. By extension, share of urban employment in the private sector fell by nearly 7 percentage points between 1999 and 2002. Regionally, while the share of public sector employment show a declining trend in the Central region, an increasing trend is observed in the Western region (increasing from 19.7 percent in 1992 to 33.1 percent in 2002). In addition, the presence of the paid private sector employment is more pronounced in the Central and Western regions.
19 . The share of children 10-14 years in the total employment declined from 4.1 percent in 1992 to 1.7 percent in 2002. The increased school enrolment of children in this age bracket could possibly explain this declining trend.
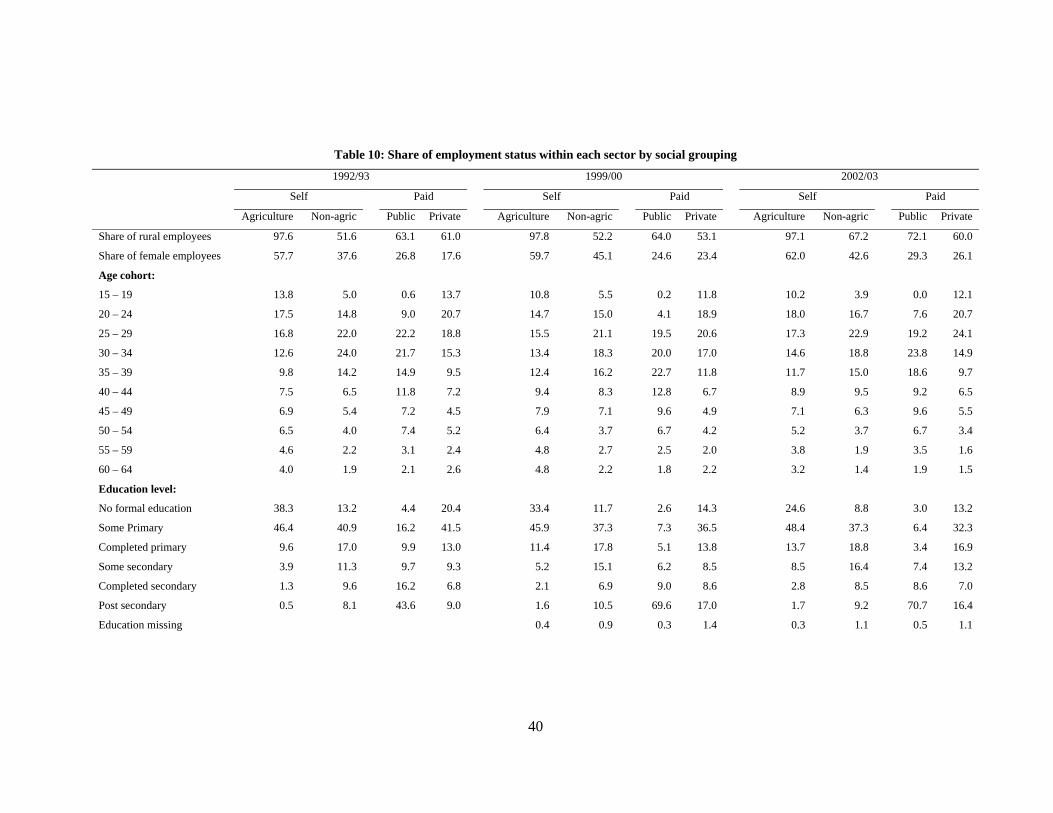
40
Table 10: Share of employment status within each sector by social grouping
1992/93 1999/00 2002/03
Self Paid Self Paid Self Paid
Agriculture Non-agric Public Private Agriculture Non-agric Public Private Agriculture Non-agric Public Private
Share of rural employees 97.6 51.6 63.1 61.0 97.8 52.2 64.0 53.1 97.1 67.2 72.1 60.0
Share of female employees 57.7 37.6 26.8 17.6 59.7 45.1 24.6 23.4 62.0 42.6 29.3 26.1
Age cohort:
15 – 19 13.8 5.0 0.6 13.7 10.8 5.5 0.2 11.8 10.2 3.9 0.0 12.1
20 – 24 17.5 14.8 9.0 20.7 14.7 15.0 4.1 18.9 18.0 16.7 7.6 20.7
25 – 29 16.8 22.0 22.2 18.8 15.5 21.1 19.5 20.6 17.3 22.9 19.2 24.1
30 – 34 12.6 24.0 21.7 15.3 13.4 18.3 20.0 17.0 14.6 18.8 23.8 14.9
35 – 39 9.8 14.2 14.9 9.5 12.4 16.2 22.7 11.8 11.7 15.0 18.6 9.7
40 – 44 7.5 6.5 11.8 7.2 9.4 8.3 12.8 6.7 8.9 9.5 9.2 6.5
45 – 49 6.9 5.4 7.2 4.5 7.9 7.1 9.6 4.9 7.1 6.3 9.6 5.5
50 – 54 6.5 4.0 7.4 5.2 6.4 3.7 6.7 4.2 5.2 3.7 6.7 3.4
55 – 59 4.6 2.2 3.1 2.4 4.8 2.7 2.5 2.0 3.8 1.9 3.5 1.6
60 – 64 4.0 1.9 2.1 2.6 4.8 2.2 1.8 2.2 3.2 1.4 1.9 1.5
Education level:
No formal education 38.3 13.2 4.4 20.4 33.4 11.7 2.6 14.3 24.6 8.8 3.0 13.2
Some Primary 46.4 40.9 16.2 41.5 45.9 37.3 7.3 36.5 48.4 37.3 6.4 32.3
Completed primary 9.6 17.0 9.9 13.0 11.4 17.8 5.1 13.8 13.7 18.8 3.4 16.9
Some secondary 3.9 11.3 9.7 9.3 5.2 15.1 6.2 8.5 8.5 16.4 7.4 13.2
Completed secondary 1.3 9.6 16.2 6.8 2.1 6.9 9.0 8.6 2.8 8.5 8.6 7.0
Post secondary 0.5 8.1 43.6 9.0 1.6 10.5 69.6 17.0 1.7 9.2 70.7 16.4
Education missing 0.4 0.9 0.3 1.4 0.3 1.1 0.5 1.1
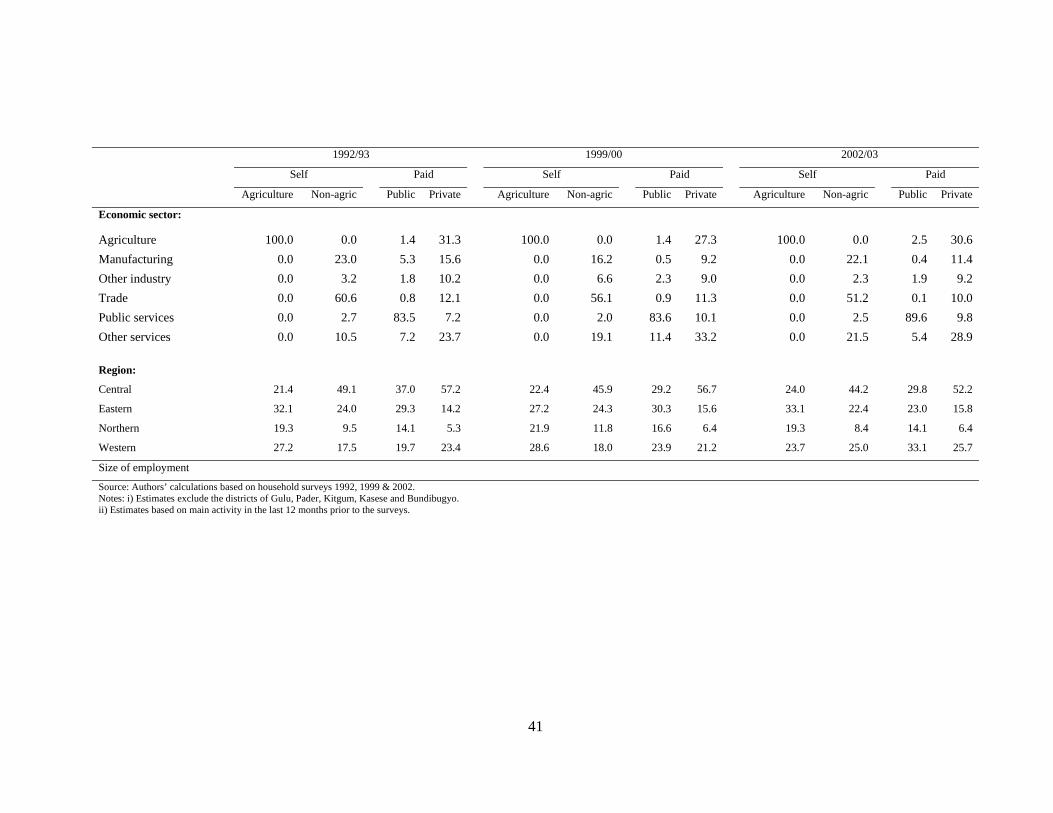
41
1992/93 1999/00 2002/03
Self Paid Self Paid Self Paid
Agriculture Non-agric Public Private Agriculture Non-agric Public Private Agriculture Non-agric Public Private
Economic sector:
Agriculture 100.0 0.0 1.4 31.3 100.0 0.0 1.4 27.3 100.0 0.0 2.5 30.6 Manufacturing 0.0 23.0 5.3 15.6 0.0 16.2 0.5 9.2 0.0 22.1 0.4 11.4 Other industry 0.0 3.2 1.8 10.2 0.0 6.6 2.3 9.0 0.0 2.3 1.9 9.2 Trade 0.0 60.6 0.8 12.1 0.0 56.1 0.9 11.3 0.0 51.2 0.1 10.0 Public services 0.0 2.7 83.5 7.2 0.0 2.0 83.6 10.1 0.0 2.5 89.6 9.8 Other services 0.0 10.5 7.2 23.7 0.0 19.1 11.4 33.2 0.0 21.5 5.4 28.9
Region:
Central 21.4 49.1 37.0 57.2 22.4 45.9 29.2 56.7 24.0 44.2 29.8 52.2
Eastern 32.1 24.0 29.3 14.2 27.2 24.3 30.3 15.6 33.1 22.4 23.0 15.8
Northern 19.3 9.5 14.1 5.3 21.9 11.8 16.6 6.4 19.3 8.4 14.1 6.4
Western 27.2 17.5 19.7 23.4 28.6 18.0 23.9 21.2 23.7 25.0 33.1 25.7
Size of employment
Source: Authors’ calculations based on household surveys 1992, 1999 & 2002. Notes: i) Estimates exclude the districts of Gulu, Pader, Kitgum, Kasese and Bundibugyo. ii) Estimates based on main activity in the last 12 months prior to the surveys.
42
iii) Job creation/losses: While there has been a shift in the sectoral composition of employment, the growth of labour demand has lagged behind that of the labour supply. The entire period of study experienced job losses and creation. About 1.5 million jobs were created between 1992 and 1999 compared to 0.6 million jobs between 1999 and 2002. On the sectoral front, the public services and manufacturing recorded a decline in employment in 1992 to 1999, whereas such a decline was in the crop agriculture and public utilities between 1999 and 2002. The self employment in agriculture experienced the highest job losses, although still remains the largest employment sector. The job losses in the manufacturing sector matches the period when this sector recorded the lowest growth rate of 3.6 percent, the lowest since 1993/94. From 1999, the manufacturing sector became the major source of job growth. However, the impact on overall labour market structure was limited due to its small base. The decline in public utilities is partly explained by the government’s privatisation of its telecommunication and energy parastatals. On a positive note, job losses were lower than job created over the entire period.
iv)`Wage employment: Here we do provide a further analysis of the evolution of wage employment in Uganda. With the implementation of reforms since mid-1980s one would have expected an increasing trend in the formalization of the labour market. Yet, only a seventh of total employment is still accounted for by the “formal”/paid sector. In terms of annualized growth rates, the period 1992-99 experienced the lowest growth in wage employment of only 0.9 percent compared to 7.4 per cent over the period 1999-2002. In absolute numbers, formal paid employment grew from about 0.9 million persons in 1992 to nearly 1.2 million persons in 2002, representing a growth rate of 2.6 percent. But this growth was lower than the overall growth in employment (of 3.1 percent) and particularly that of labour supply (of 3.4 percent). The share of rural wage employment in total wage employment increased from 53.8 percent to 61.4 percent in 1999 and 2002 respectively. In terms of annualized growth rate, it grew by nearly 12 percent between 1999 and 2002, a growth rate well above the nation-wide average. This finding is partly attributed to recruitment of primary school teachers for the UPE program. The mushrooming Non-government Organizations (NGOs) might also explain this growth.
Wage employment has a marked regional dimension, with Northern Uganda recording the least share. It remained below 10 percent over the entire period. The share of those employees with post secondary education increased from 22.3 percent in 1992 to 28.7 percent in 2002. In contrast, the share of employees with some primary declined from 32 percent to 26.8 percent in 1992 and 2002 respectively. There has been a marked increase in the participation of female employees in wage employment of nearly 9.3 percentage points as already noted. Worth noting is the share of wage employment in the manufacturing sector. It declined from 12.5 percent in 1992 to 7.8 percent in 1999 before rising to 9.8 percent in 2002. The patterns do mirror growth rates in the manufacturing sector at macro level.
Next we discuss wage employment by private/public typology. As observed by Ruhweza (2003) the creation of jobs in the private sector has been slow in the earlier years of reforms (of 2.8 percent per annum) but a drastic increase is observed between 1999 and 2002 (of 8.1 percent per annum). Contrary to expectations, the increase in latter period did not lead to welfare improvements. Private sector employment grew faster than the public sector employment (see Table 11). Over a 10-year period, it grew by 4.3 percent while for the public sector it declined by 1.6 percent. However, common to both sectors is
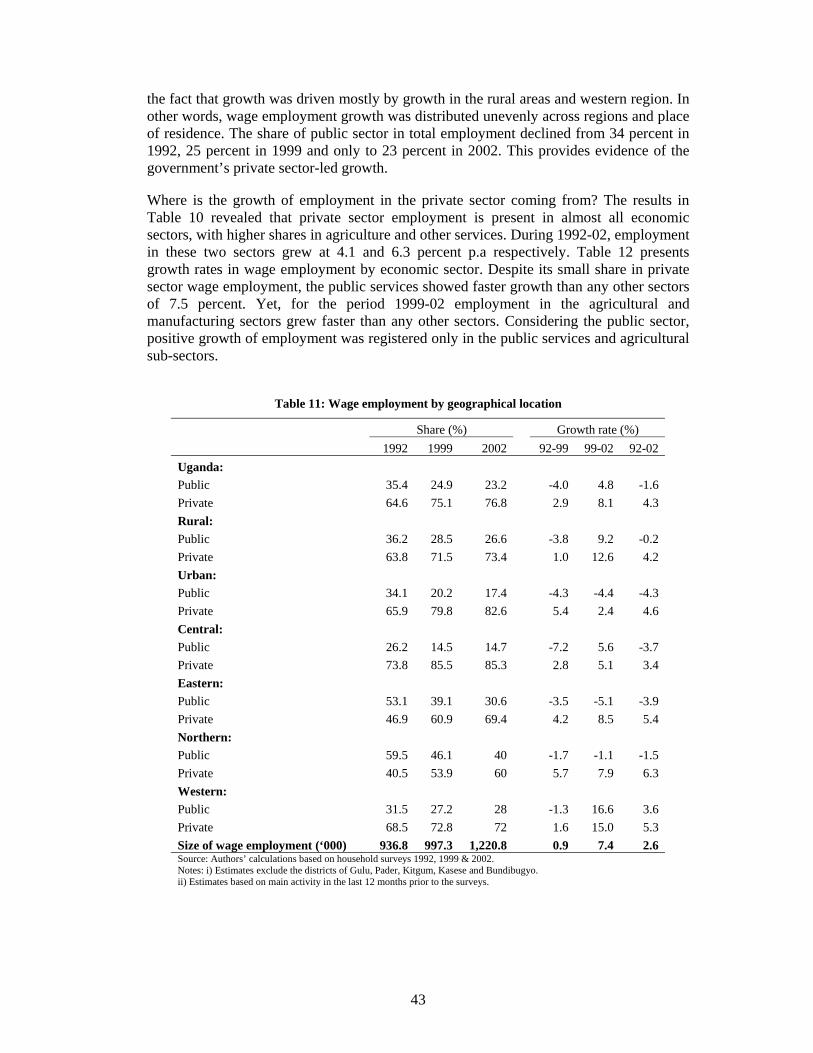
43
the fact that growth was driven mostly by growth in the rural areas and western region. In other words, wage employment growth was distributed unevenly across regions and place of residence. The share of public sector in total employment declined from 34 percent in 1992, 25 percent in 1999 and only to 23 percent in 2002. This provides evidence of the government’s private sector-led growth.
Where is the growth of employment in the private sector coming from? The results in Table 10 revealed that private sector employment is present in almost all economic sectors, with higher shares in agriculture and other services. During 1992-02, employment in these two sectors grew at 4.1 and 6.3 percent p.a respectively. Table 12 presents growth rates in wage employment by economic sector. Despite its small share in private sector wage employment, the public services showed faster growth than any other sectors of 7.5 percent. Yet, for the period 1999-02 employment in the agricultural and manufacturing sectors grew faster than any other sectors. Considering the public sector, positive growth of employment was registered only in the public services and agricultural sub-sectors.
Table 11: Wage employment by geographical location
Share (%) Growth rate (%) 1992 1999 2002 92-99 99-02 92-02 Uganda: Public 35.4 24.9 23.2 -4.0 4.8 -1.6 Private 64.6 75.1 76.8 2.9 8.1 4.3 Rural: Public 36.2 28.5 26.6 -3.8 9.2 -0.2 Private 63.8 71.5 73.4 1.0 12.6 4.2 Urban: Public 34.1 20.2 17.4 -4.3 -4.4 -4.3 Private 65.9 79.8 82.6 5.4 2.4 4.6 Central: Public 26.2 14.5 14.7 -7.2 5.6 -3.7 Private 73.8 85.5 85.3 2.8 5.1 3.4 Eastern: Public 53.1 39.1 30.6 -3.5 -5.1 -3.9 Private 46.9 60.9 69.4 4.2 8.5 5.4 Northern: Public 59.5 46.1 40 -1.7 -1.1 -1.5 Private 40.5 53.9 60 5.7 7.9 6.3 Western: Public 31.5 27.2 28 -1.3 16.6 3.6 Private 68.5 72.8 72 1.6 15.0 5.3 Size of wage employment (‘000) 936.8 997.3 1,220.8 0.9 7.4 2.6 Source: Authors’ calculations based on household surveys 1992, 1999 & 2002. Notes: i) Estimates exclude the districts of Gulu, Pader, Kitgum, Kasese and Bundibugyo. ii) Estimates based on main activity in the last 12 months prior to the surveys.
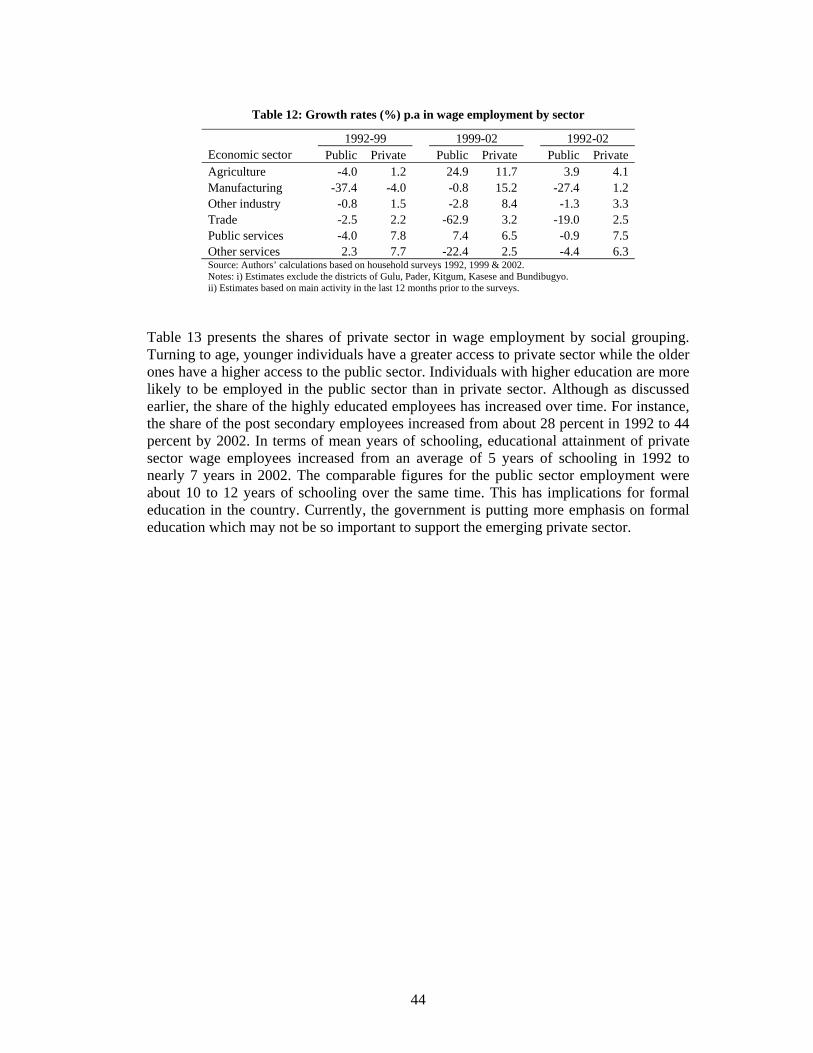
44
Table 12: Growth rates (%) p.a in wage employment by sector
1992-99 1999-02 1992-02 Economic sector Public Private Public Private Public Private Agriculture -4.0 1.2 24.9 11.7 3.9 4.1 Manufacturing -37.4 -4.0 -0.8 15.2 -27.4 1.2 Other industry -0.8 1.5 -2.8 8.4 -1.3 3.3 Trade -2.5 2.2 -62.9 3.2 -19.0 2.5 Public services -4.0 7.8 7.4 6.5 -0.9 7.5 Other services 2.3 7.7 -22.4 2.5 -4.4 6.3 Source: Authors’ calculations based on household surveys 1992, 1999 & 2002. Notes: i) Estimates exclude the districts of Gulu, Pader, Kitgum, Kasese and Bundibugyo. ii) Estimates based on main activity in the last 12 months prior to the surveys.
Table 13 presents the shares of private sector in wage employment by social grouping. Turning to age, younger individuals have a greater access to private sector while the older ones have a higher access to the public sector. Individuals with higher education are more likely to be employed in the public sector than in private sector. Although as discussed earlier, the share of the highly educated employees has increased over time. For instance, the share of the post secondary employees increased from about 28 percent in 1992 to 44 percent by 2002. In terms of mean years of schooling, educational attainment of private sector wage employees increased from an average of 5 years of schooling in 1992 to nearly 7 years in 2002. The comparable figures for the public sector employment were about 10 to 12 years of schooling over the same time. This has implications for formal education in the country. Currently, the government is putting more emphasis on formal education which may not be so important to support the emerging private sector.
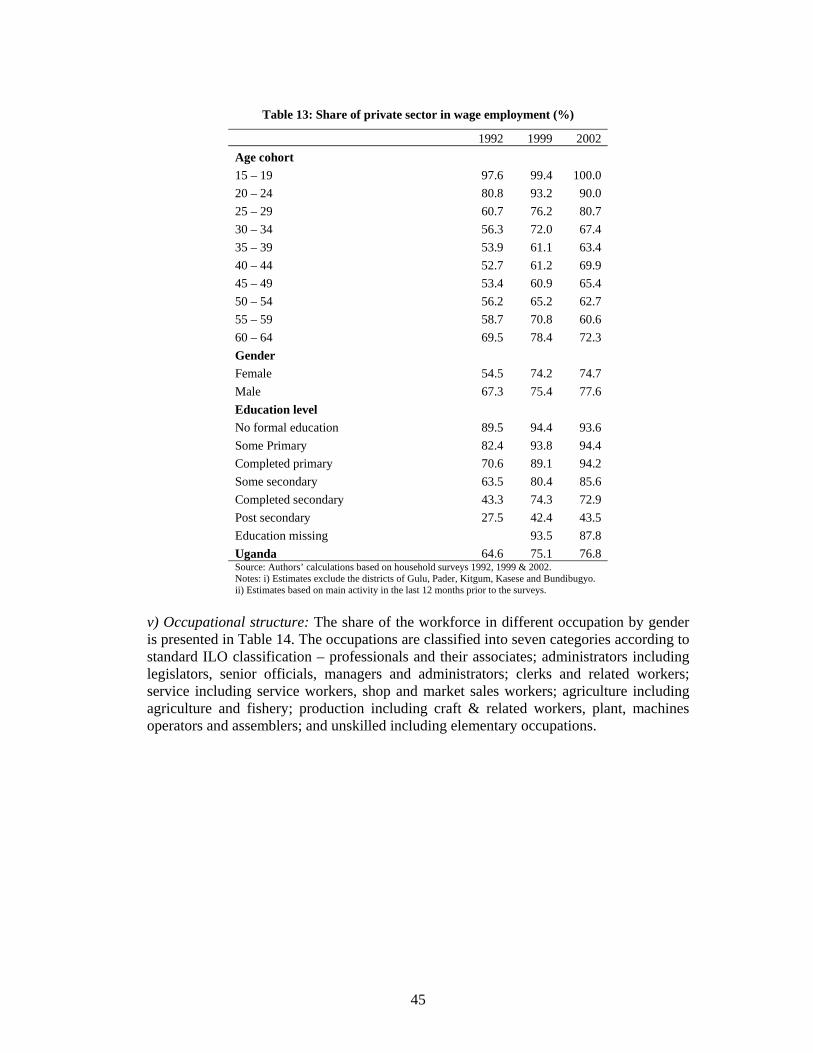
45
Table 13: Share of private sector in wage employment (%)
1992 1999 2002 Age cohort 15 – 19 97.6 99.4 100.0 20 – 24 80.8 93.2 90.0 25 – 29 60.7 76.2 80.7 30 – 34 56.3 72.0 67.4 35 – 39 53.9 61.1 63.4 40 – 44 52.7 61.2 69.9 45 – 49 53.4 60.9 65.4 50 – 54 56.2 65.2 62.7 55 – 59 58.7 70.8 60.6 60 – 64 69.5 78.4 72.3 Gender Female 54.5 74.2 74.7 Male 67.3 75.4 77.6 Education level No formal education 89.5 94.4 93.6 Some Primary 82.4 93.8 94.4 Completed primary 70.6 89.1 94.2 Some secondary 63.5 80.4 85.6 Completed secondary 43.3 74.3 72.9 Post secondary 27.5 42.4 43.5 Education missing 93.5 87.8 Uganda 64.6 75.1 76.8 Source: Authors’ calculations based on household surveys 1992, 1999 & 2002. Notes: i) Estimates exclude the districts of Gulu, Pader, Kitgum, Kasese and Bundibugyo. ii) Estimates based on main activity in the last 12 months prior to the surveys.
v) Occupational structure: The share of the workforce in different occupation by gender is presented in Table 14. The occupations are classified into seven categories according to standard ILO classification – professionals and their associates; administrators including legislators, senior officials, managers and administrators; clerks and related workers; service including service workers, shop and market sales workers; agriculture including agriculture and fishery; production including craft & related workers, plant, machines operators and assemblers; and unskilled including elementary occupations.
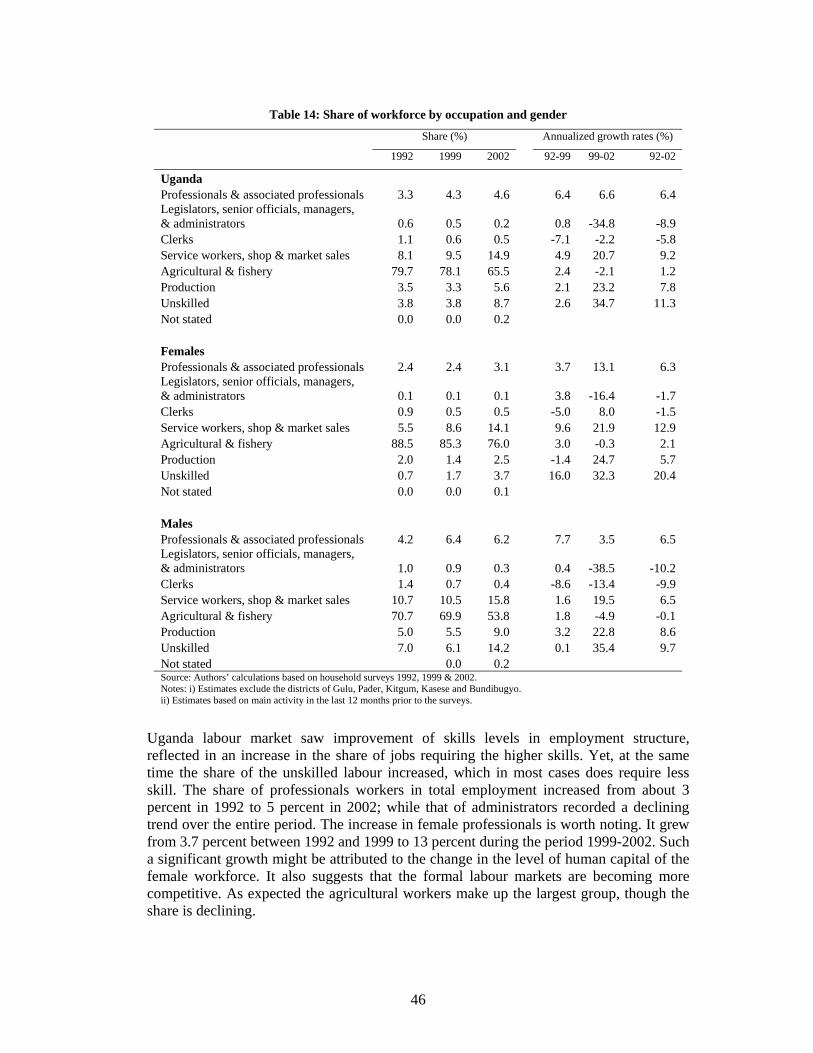
46
Table 14: Share of workforce by occupation and gender
Share (%) Annualized growth rates (%)
1992 1999 2002 92-99 99-02 92-02
Uganda Professionals & associated professionals 3.3 4.3 4.6 6.4 6.6 6.4 Legislators, senior officials, managers, & administrators 0.6 0.5 0.2 0.8 -34.8 -8.9 Clerks 1.1 0.6 0.5 -7.1 -2.2 -5.8 Service workers, shop & market sales 8.1 9.5 14.9 4.9 20.7 9.2 Agricultural & fishery 79.7 78.1 65.5 2.4 -2.1 1.2 Production 3.5 3.3 5.6 2.1 23.2 7.8 Unskilled 3.8 3.8 8.7 2.6 34.7 11.3 Not stated 0.0 0.0 0.2 Females Professionals & associated professionals 2.4 2.4 3.1 3.7 13.1 6.3 Legislators, senior officials, managers, & administrators 0.1 0.1 0.1 3.8 -16.4 -1.7 Clerks 0.9 0.5 0.5 -5.0 8.0 -1.5 Service workers, shop & market sales 5.5 8.6 14.1 9.6 21.9 12.9 Agricultural & fishery 88.5 85.3 76.0 3.0 -0.3 2.1 Production 2.0 1.4 2.5 -1.4 24.7 5.7 Unskilled 0.7 1.7 3.7 16.0 32.3 20.4 Not stated 0.0 0.0 0.1 Males Professionals & associated professionals 4.2 6.4 6.2 7.7 3.5 6.5 Legislators, senior officials, managers, & administrators 1.0 0.9 0.3 0.4 -38.5 -10.2 Clerks 1.4 0.7 0.4 -8.6 -13.4 -9.9 Service workers, shop & market sales 10.7 10.5 15.8 1.6 19.5 6.5 Agricultural & fishery 70.7 69.9 53.8 1.8 -4.9 -0.1 Production 5.0 5.5 9.0 3.2 22.8 8.6 Unskilled 7.0 6.1 14.2 0.1 35.4 9.7 Not stated 0.0 0.2 Source: Authors’ calculations based on household surveys 1992, 1999 & 2002. Notes: i) Estimates exclude the districts of Gulu, Pader, Kitgum, Kasese and Bundibugyo. ii) Estimates based on main activity in the last 12 months prior to the surveys.
Uganda labour market saw improvement of skills levels in employment structure, reflected in an increase in the share of jobs requiring the higher skills. Yet, at the same time the share of the unskilled labour increased, which in most cases does require less skill. The share of professionals workers in total employment increased from about 3 percent in 1992 to 5 percent in 2002; while that of administrators recorded a declining trend over the entire period. The increase in female professionals is worth noting. It grew from 3.7 percent between 1992 and 1999 to 13 percent during the period 1999-2002. Such a significant growth might be attributed to the change in the level of human capital of the female workforce. It also suggests that the formal labour markets are becoming more competitive. As expected the agricultural workers make up the largest group, though the share is declining.
47
There is evidence of growing female representation as service workers over time, with almost similar shares for males in 2002. Yet, these jobs are traditionally associated with lower earnings and more insecure conditions. Generally speaking, the change in the occupational distribution by gender over the entire study period was relatively modest. There is evidence of changes in the female position within the occupation though the allocation across broad occupational aggregates remained limited. Turning to occupational structure by employment status, interesting results do emerge. The share of professional employees in the private sector increased from only 5.7 percent in 1992 to 10.8 percent in 2002; while that of unskilled employees increased from 27 percent in 1992 to 49 percent by 2002. Considering the public sector, the share of professionals increased from 45 percent in 1992 to 75 percent in 2002. In sum, trends towards upgrading of employment were evident: not only did the educational attainment of workforce rise but the share of higher skilled jobs in employment also increased.
The analysis so far suggests that there are some changes in the labour market that cannot be detected and the other changes are evident. The EPR remained relatively stable. The features of the labour market that have changed significantly include: female participation, more skilled workforce and growth in private sector employment. In the proceeding sub-sector a discussion how there developments in the labour market relate to the evolution of poverty in Uganda is presented.
5.2.2 Poverty-employment linkage
How do employment indicators link up with poverty? We have so far demonstrated that the period under review was characterised with mixed signals in the labour market in terms of employment. There are discernible patterns in employment trends during the period of poverty reduction and of rising poverty. For instance, one would argue that the period 1999-2002 became more employment friendly. Previous poverty studies (such as Appleton, 2001; Appleton & Ssewanyana, 2003) endeavoured to provide insights into poverty-employment linkages at the household level. These studies concluded that the bulk of the poor do reside in households whose heads reported agriculture as the main activity. Here a further analysis is done in the perspective of the structural changes discussed so far and the poverty-employment linkage is done at the individual level.
The Uganda economy experienced strong economic growth through the 1990s as previously discussed in Section 2. The economic growth might have provided new employment opportunities for the population in the labour force. It is clear from the results that even the period when poverty was rising, employment grew by 3.1 percent (1992-1999) compared to the previous period of 2.7 percent (1999-02). We further discussed in Section 2 that Uganda has undergone structural transformation of its economy. The share of agriculture in GDP fell from 49.3 percent in 1992 to 38.7 percent in 2002, and corresponding shares for industry and services rose from 11.8 to 21.7; and 38.9 to 43.2 respectively. We have demonstrated above that the share of agriculture in total employment fell by 11 percentage points between 1992 and 2002; and the share of industry rose by 2.4 percentage points and services by 8.9 percentage points over the same period. The growth in GDP created jobs outside agriculture, which is consistent with the overall objectives of the reforms. Yet, growth is concentrated in sectors that employ a small portion of the workforce, such as manufacturing which as discussed above employed only 6 percent as against 64 percent in crop agriculture in 2002.
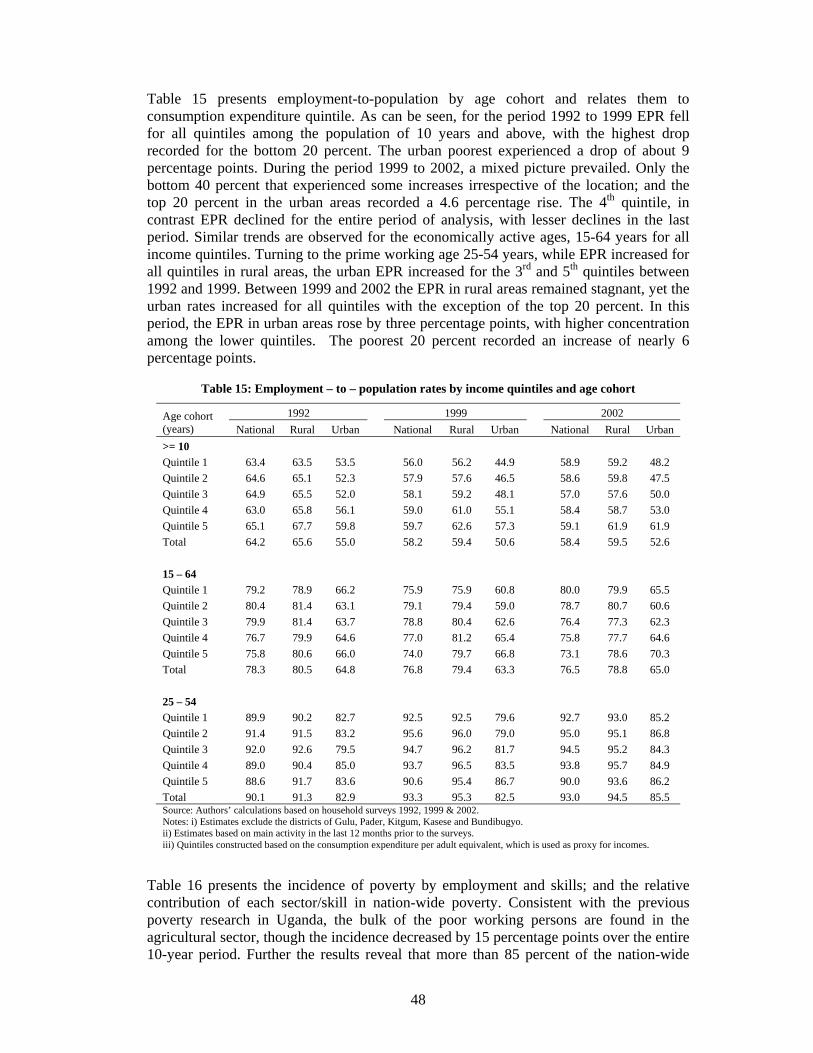
48
Table 15 presents employment-to-population by age cohort and relates them to consumption expenditure quintile. As can be seen, for the period 1992 to 1999 EPR fell for all quintiles among the population of 10 years and above, with the highest drop recorded for the bottom 20 percent. The urban poorest experienced a drop of about 9 percentage points. During the period 1999 to 2002, a mixed picture prevailed. Only the bottom 40 percent that experienced some increases irrespective of the location; and the top 20 percent in the urban areas recorded a 4.6 percentage rise. The 4th quintile, in contrast EPR declined for the entire period of analysis, with lesser declines in the last period. Similar trends are observed for the economically active ages, 15-64 years for all income quintiles. Turning to the prime working age 25-54 years, while EPR increased for all quintiles in rural areas, the urban EPR increased for the 3rd and 5th quintiles between 1992 and 1999. Between 1999 and 2002 the EPR in rural areas remained stagnant, yet the urban rates increased for all quintiles with the exception of the top 20 percent. In this period, the EPR in urban areas rose by three percentage points, with higher concentration among the lower quintiles. The poorest 20 percent recorded an increase of nearly 6 percentage points.
Table 15: Employment – to – population rates by income quintiles and age cohort
1992 1999 2002 Age cohort (years) National Rural Urban National Rural Urban National Rural Urban >= 10 Quintile 1 63.4 63.5 53.5 56.0 56.2 44.9 58.9 59.2 48.2 Quintile 2 64.6 65.1 52.3 57.9 57.6 46.5 58.6 59.8 47.5 Quintile 3 64.9 65.5 52.0 58.1 59.2 48.1 57.0 57.6 50.0 Quintile 4 63.0 65.8 56.1 59.0 61.0 55.1 58.4 58.7 53.0 Quintile 5 65.1 67.7 59.8 59.7 62.6 57.3 59.1 61.9 61.9 Total 64.2 65.6 55.0 58.2 59.4 50.6 58.4 59.5 52.6 15 – 64 Quintile 1 79.2 78.9 66.2 75.9 75.9 60.8 80.0 79.9 65.5 Quintile 2 80.4 81.4 63.1 79.1 79.4 59.0 78.7 80.7 60.6 Quintile 3 79.9 81.4 63.7 78.8 80.4 62.6 76.4 77.3 62.3 Quintile 4 76.7 79.9 64.6 77.0 81.2 65.4 75.8 77.7 64.6 Quintile 5 75.8 80.6 66.0 74.0 79.7 66.8 73.1 78.6 70.3 Total 78.3 80.5 64.8 76.8 79.4 63.3 76.5 78.8 65.0 25 – 54 Quintile 1 89.9 90.2 82.7 92.5 92.5 79.6 92.7 93.0 85.2 Quintile 2 91.4 91.5 83.2 95.6 96.0 79.0 95.0 95.1 86.8 Quintile 3 92.0 92.6 79.5 94.7 96.2 81.7 94.5 95.2 84.3 Quintile 4 89.0 90.4 85.0 93.7 96.5 83.5 93.8 95.7 84.9 Quintile 5 88.6 91.7 83.6 90.6 95.4 86.7 90.0 93.6 86.2 Total 90.1 91.3 82.9 93.3 95.3 82.5 93.0 94.5 85.5 Source: Authors’ calculations based on household surveys 1992, 1999 & 2002. Notes: i) Estimates exclude the districts of Gulu, Pader, Kitgum, Kasese and Bundibugyo. ii) Estimates based on main activity in the last 12 months prior to the surveys. iii) Quintiles constructed based on the consumption expenditure per adult equivalent, which is used as proxy for incomes.
Table 16 presents the incidence of poverty by employment and skills; and the relative contribution of each sector/skill in nation-wide poverty. Consistent with the previous poverty research in Uganda, the bulk of the poor working persons are found in the agricultural sector, though the incidence decreased by 15 percentage points over the entire 10-year period. Further the results reveal that more than 85 percent of the nation-wide
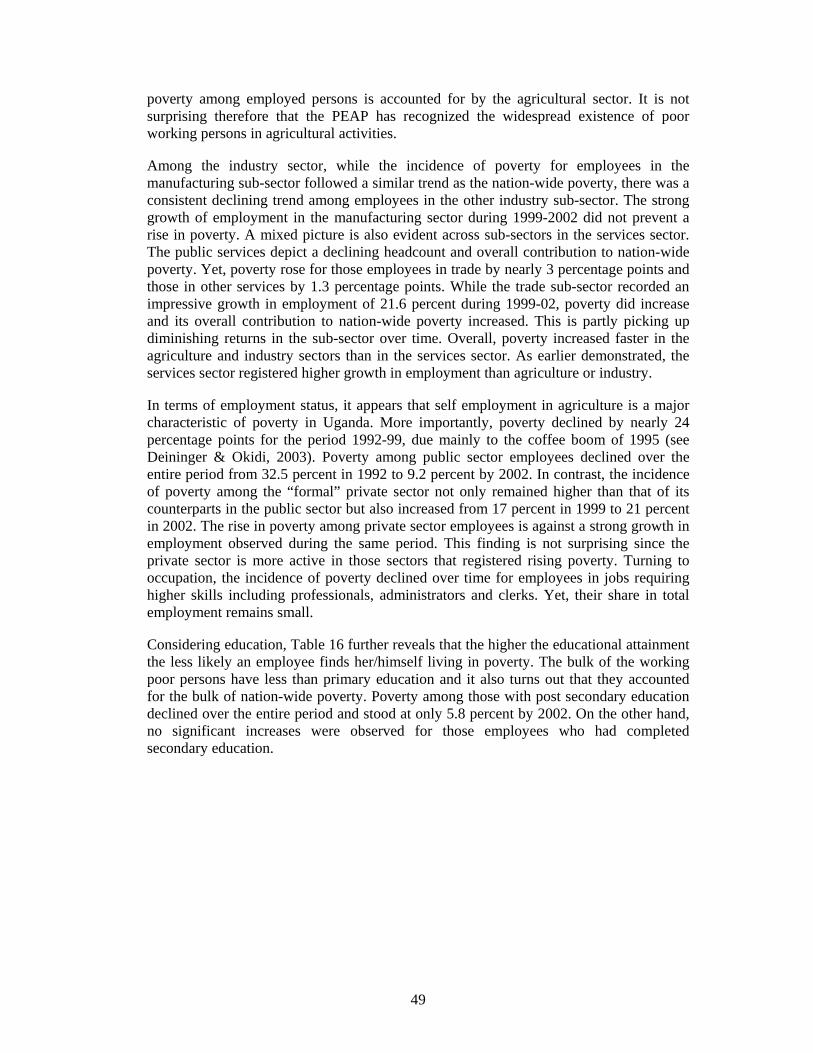
49
poverty among employed persons is accounted for by the agricultural sector. It is not surprising therefore that the PEAP has recognized the widespread existence of poor working persons in agricultural activities.
Among the industry sector, while the incidence of poverty for employees in the manufacturing sub-sector followed a similar trend as the nation-wide poverty, there was a consistent declining trend among employees in the other industry sub-sector. The strong growth of employment in the manufacturing sector during 1999-2002 did not prevent a rise in poverty. A mixed picture is also evident across sub-sectors in the services sector. The public services depict a declining headcount and overall contribution to nation-wide poverty. Yet, poverty rose for those employees in trade by nearly 3 percentage points and those in other services by 1.3 percentage points. While the trade sub-sector recorded an impressive growth in employment of 21.6 percent during 1999-02, poverty did increase and its overall contribution to nation-wide poverty increased. This is partly picking up diminishing returns in the sub-sector over time. Overall, poverty increased faster in the agriculture and industry sectors than in the services sector. As earlier demonstrated, the services sector registered higher growth in employment than agriculture or industry.
In terms of employment status, it appears that self employment in agriculture is a major characteristic of poverty in Uganda. More importantly, poverty declined by nearly 24 percentage points for the period 1992-99, due mainly to the coffee boom of 1995 (see Deininger & Okidi, 2003). Poverty among public sector employees declined over the entire period from 32.5 percent in 1992 to 9.2 percent by 2002. In contrast, the incidence of poverty among the “formal” private sector not only remained higher than that of its counterparts in the public sector but also increased from 17 percent in 1999 to 21 percent in 2002. The rise in poverty among private sector employees is against a strong growth in employment observed during the same period. This finding is not surprising since the private sector is more active in those sectors that registered rising poverty. Turning to occupation, the incidence of poverty declined over time for employees in jobs requiring higher skills including professionals, administrators and clerks. Yet, their share in total employment remains small.
Considering education, Table 16 further reveals that the higher the educational attainment the less likely an employee finds her/himself living in poverty. The bulk of the working poor persons have less than primary education and it also turns out that they accounted for the bulk of nation-wide poverty. Poverty among those with post secondary education declined over the entire period and stood at only 5.8 percent by 2002. On the other hand, no significant increases were observed for those employees who had completed secondary education.
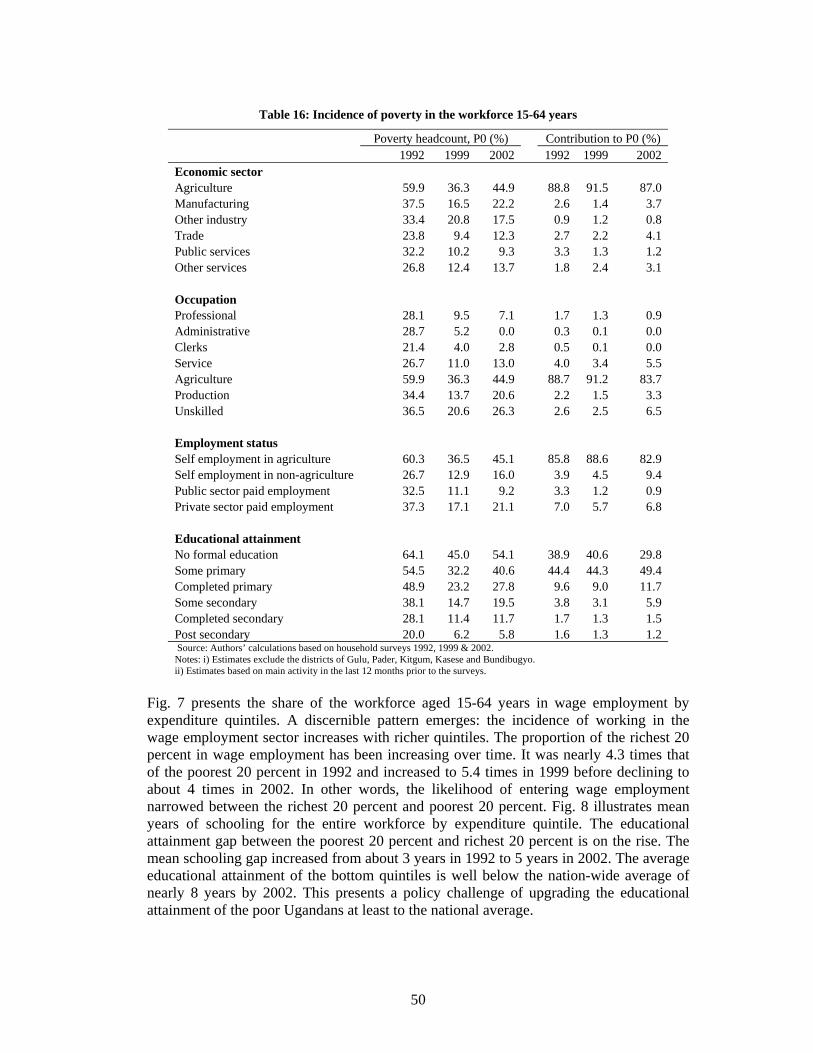
50
Table 16: Incidence of poverty in the workforce 15-64 years
Poverty headcount, P0 (%) Contribution to P0 (%) 1992 1999 2002 1992 1999 2002 Economic sector Agriculture 59.9 36.3 44.9 88.8 91.5 87.0 Manufacturing 37.5 16.5 22.2 2.6 1.4 3.7 Other industry 33.4 20.8 17.5 0.9 1.2 0.8 Trade 23.8 9.4 12.3 2.7 2.2 4.1 Public services 32.2 10.2 9.3 3.3 1.3 1.2 Other services 26.8 12.4 13.7 1.8 2.4 3.1 Occupation Professional 28.1 9.5 7.1 1.7 1.3 0.9 Administrative 28.7 5.2 0.0 0.3 0.1 0.0 Clerks 21.4 4.0 2.8 0.5 0.1 0.0 Service 26.7 11.0 13.0 4.0 3.4 5.5 Agriculture 59.9 36.3 44.9 88.7 91.2 83.7 Production 34.4 13.7 20.6 2.2 1.5 3.3 Unskilled 36.5 20.6 26.3 2.6 2.5 6.5 Employment status Self employment in agriculture 60.3 36.5 45.1 85.8 88.6 82.9 Self employment in non-agriculture 26.7 12.9 16.0 3.9 4.5 9.4 Public sector paid employment 32.5 11.1 9.2 3.3 1.2 0.9 Private sector paid employment 37.3 17.1 21.1 7.0 5.7 6.8 Educational attainment No formal education 64.1 45.0 54.1 38.9 40.6 29.8 Some primary 54.5 32.2 40.6 44.4 44.3 49.4 Completed primary 48.9 23.2 27.8 9.6 9.0 11.7 Some secondary 38.1 14.7 19.5 3.8 3.1 5.9 Completed secondary 28.1 11.4 11.7 1.7 1.3 1.5 Post secondary 20.0 6.2 5.8 1.6 1.3 1.2 Source: Authors’ calculations based on household surveys 1992, 1999 & 2002. Notes: i) Estimates exclude the districts of Gulu, Pader, Kitgum, Kasese and Bundibugyo. ii) Estimates based on main activity in the last 12 months prior to the surveys.
Fig. 7 presents the share of the workforce aged 15-64 years in wage employment by expenditure quintiles. A discernible pattern emerges: the incidence of working in the wage employment sector increases with richer quintiles. The proportion of the richest 20 percent in wage employment has been increasing over time. It was nearly 4.3 times that of the poorest 20 percent in 1992 and increased to 5.4 times in 1999 before declining to about 4 times in 2002. In other words, the likelihood of entering wage employment narrowed between the richest 20 percent and poorest 20 percent. Fig. 8 illustrates mean years of schooling for the entire workforce by expenditure quintile. The educational attainment gap between the poorest 20 percent and richest 20 percent is on the rise. The mean schooling gap increased from about 3 years in 1992 to 5 years in 2002. The average educational attainment of the bottom quintiles is well below the nation-wide average of nearly 8 years by 2002. This presents a policy challenge of upgrading the educational attainment of the poor Ugandans at least to the national average.
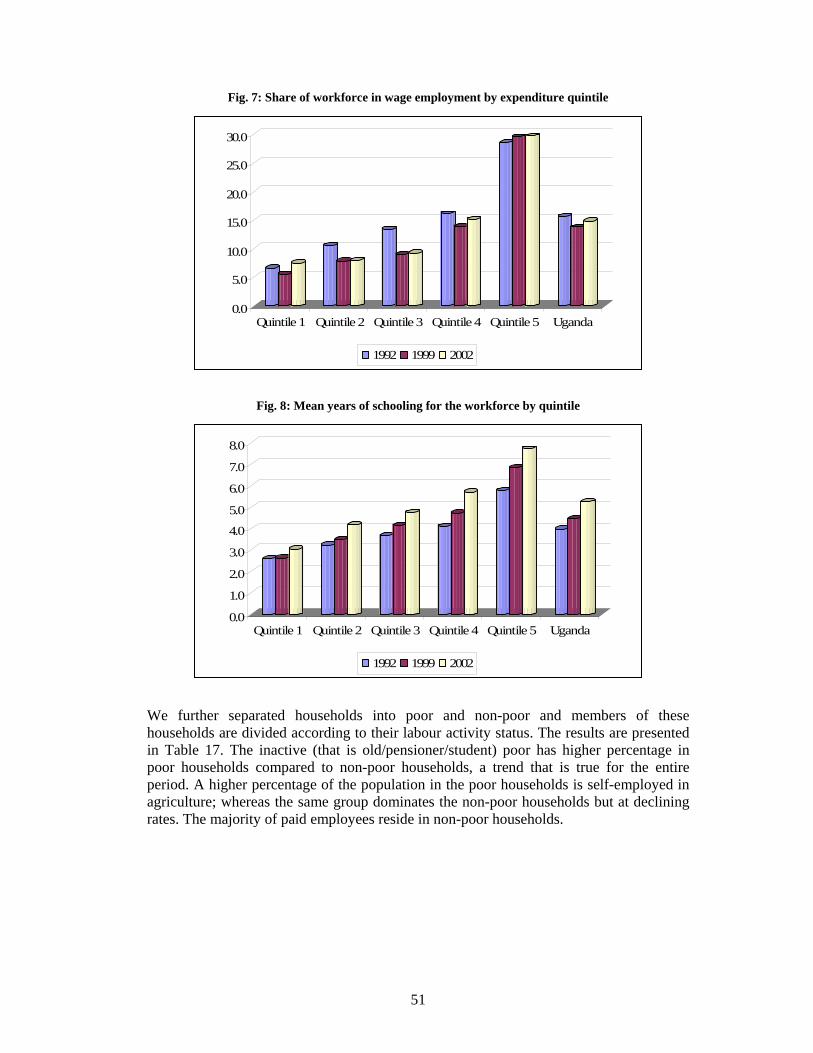
51
Fig. 7: Share of workforce in wage employment by expenditure quintile
0.0
5.0
10.0
15.0
20.0
25.0
30.0
Quintile 1 Quintile 2 Quintile 3 Quintile 4 Quintile 5 Uganda
1992 1999 2002
Fig. 8: Mean years of schooling for the workforce by quintile
0.0
1.0
2.0
3.0
4.0
5.0
6.0
7.0
8.0
Quintile 1 Quintile 2 Quintile 3 Quintile 4 Quintile 5 Uganda
1992 1999 2002
We further separated households into poor and non-poor and members of these households are divided according to their labour activity status. The results are presented in Table 17. The inactive (that is old/pensioner/student) poor has higher percentage in poor households compared to non-poor households, a trend that is true for the entire period. A higher percentage of the population in the poor households is self-employed in agriculture; whereas the same group dominates the non-poor households but at declining rates. The majority of paid employees reside in non-poor households.
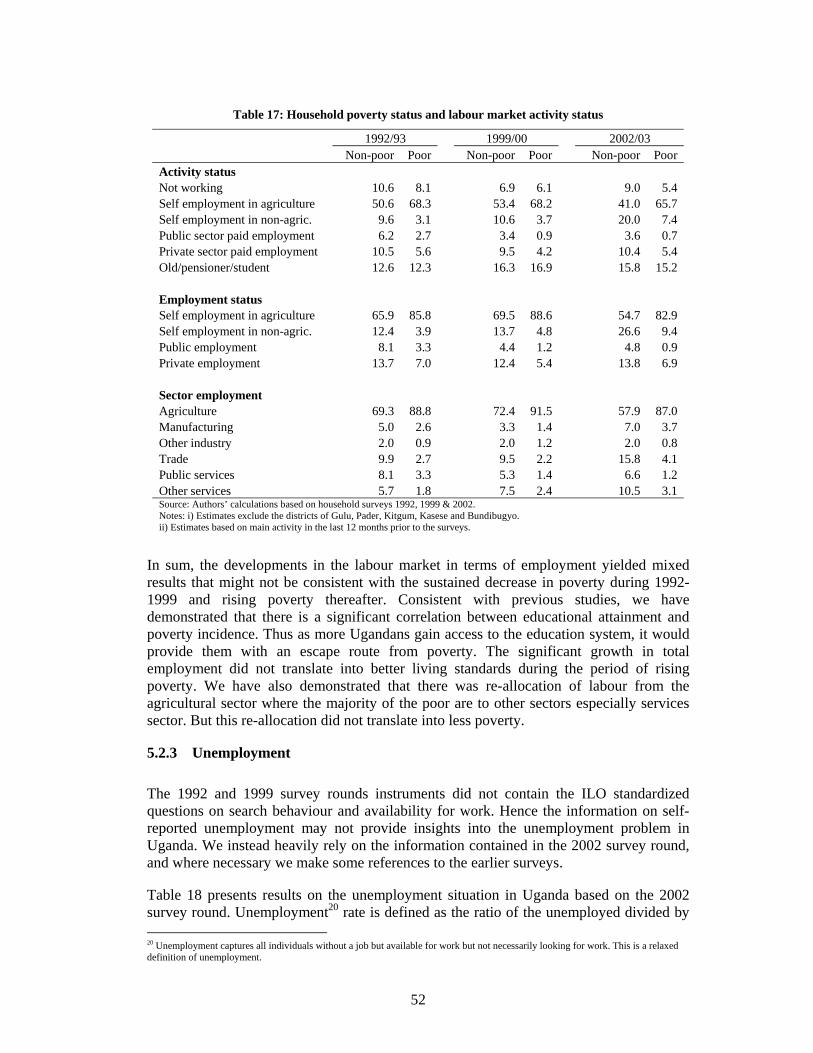
52
Table 17: Household poverty status and labour market activity status
1992/93 1999/00 2002/03 Non-poor Poor Non-poor Poor Non-poor Poor Activity status Not working 10.6 8.1 6.9 6.1 9.0 5.4 Self employment in agriculture 50.6 68.3 53.4 68.2 41.0 65.7 Self employment in non-agric. 9.6 3.1 10.6 3.7 20.0 7.4 Public sector paid employment 6.2 2.7 3.4 0.9 3.6 0.7 Private sector paid employment 10.5 5.6 9.5 4.2 10.4 5.4 Old/pensioner/student 12.6 12.3 16.3 16.9 15.8 15.2 Employment status Self employment in agriculture 65.9 85.8 69.5 88.6 54.7 82.9 Self employment in non-agric. 12.4 3.9 13.7 4.8 26.6 9.4 Public employment 8.1 3.3 4.4 1.2 4.8 0.9 Private employment 13.7 7.0 12.4 5.4 13.8 6.9 Sector employment Agriculture 69.3 88.8 72.4 91.5 57.9 87.0 Manufacturing 5.0 2.6 3.3 1.4 7.0 3.7 Other industry 2.0 0.9 2.0 1.2 2.0 0.8 Trade 9.9 2.7 9.5 2.2 15.8 4.1 Public services 8.1 3.3 5.3 1.4 6.6 1.2 Other services 5.7 1.8 7.5 2.4 10.5 3.1 Source: Authors’ calculations based on household surveys 1992, 1999 & 2002. Notes: i) Estimates exclude the districts of Gulu, Pader, Kitgum, Kasese and Bundibugyo. ii) Estimates based on main activity in the last 12 months prior to the surveys.
In sum, the developments in the labour market in terms of employment yielded mixed results that might not be consistent with the sustained decrease in poverty during 1992-1999 and rising poverty thereafter. Consistent with previous studies, we have demonstrated that there is a significant correlation between educational attainment and poverty incidence. Thus as more Ugandans gain access to the education system, it would provide them with an escape route from poverty. The significant growth in total employment did not translate into better living standards during the period of rising poverty. We have also demonstrated that there was re-allocation of labour from the agricultural sector where the majority of the poor are to other sectors especially services sector. But this re-allocation did not translate into less poverty.
5.2.3 Unemployment
The 1992 and 1999 survey rounds instruments did not contain the ILO standardized questions on search behaviour and availability for work. Hence the information on self-reported unemployment may not provide insights into the unemployment problem in Uganda. We instead heavily rely on the information contained in the 2002 survey round, and where necessary we make some references to the earlier surveys.
Table 18 presents results on the unemployment situation in Uganda based on the 2002 survey round. Unemployment20 rate is defined as the ratio of the unemployed divided by 20 Unemployment captures all individuals without a job but available for work but not necessarily looking for work. This is a relaxed definition of unemployment.
53
the total workforce multiplied by 100. It gives insights into the extent of underutilized labour supply in the country. But aggregate unemployment rate is inappropriate indicator of the state of the Uganda labour market given its stage of development. Unfortunately, we cannot say much about the trends as the data are available only at one point in time. Unemployment rate stood at 2.8 percent, which seems to be relatively low for a developing country like Uganda.
The key findings are that unemployment is more concentrated in urban areas and among female. Individuals in Central region are more likely to be unemployed compared to other regions. Unemployment rate increases with increasing education level but a declining pattern is observed according to age cohorts. The incidence of unemployment among the age cohorts 15-20 & 20-24 is more than one-half times the overall rate of unemployment, suggesting high rate of youth unemployment. There is also a high share of the youth unemployment in total unemployment of 57.4 percent. This figure disaggregated by gender shows a higher proportion of female of 61.7 compared to 49.8 for males. In other words, the youth are disproportionately affected by unemployment, suggesting that school-to-work transition is difficult in Uganda.
Turning to education, results show that the unemployment rate was much higher among the better educated individuals than among the less educated individuals. The possible explanation could be that the less educated will be in position to take on any kind of job, whereas the better educated will be looking for better paying jobs in line with their training. On the other hand, one would argue that the more educated are more able to report themselves as unemployed than the less educated. Nonetheless, this raises the issue of what the education system produces and what the labour market needs. From a gender perspective, among the better educated, the unemployment rate was higher among females than among males.
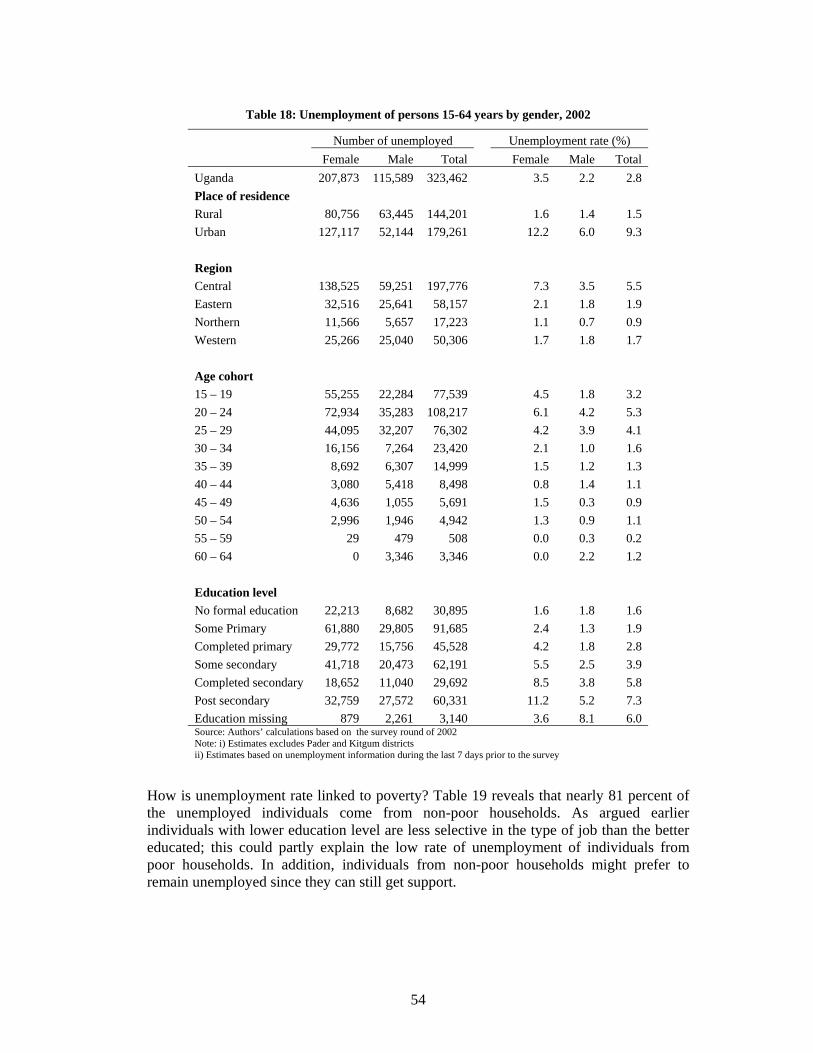
54
Table 18: Unemployment of persons 15-64 years by gender, 2002
Number of unemployed Unemployment rate (%) Female Male Total Female Male Total Uganda 207,873 115,589 323,462 3.5 2.2 2.8 Place of residence Rural 80,756 63,445 144,201 1.6 1.4 1.5 Urban 127,117 52,144 179,261 12.2 6.0 9.3 Region Central 138,525 59,251 197,776 7.3 3.5 5.5 Eastern 32,516 25,641 58,157 2.1 1.8 1.9 Northern 11,566 5,657 17,223 1.1 0.7 0.9 Western 25,266 25,040 50,306 1.7 1.8 1.7 Age cohort 15 – 19 55,255 22,284 77,539 4.5 1.8 3.2 20 – 24 72,934 35,283 108,217 6.1 4.2 5.3 25 – 29 44,095 32,207 76,302 4.2 3.9 4.1 30 – 34 16,156 7,264 23,420 2.1 1.0 1.6 35 – 39 8,692 6,307 14,999 1.5 1.2 1.3 40 – 44 3,080 5,418 8,498 0.8 1.4 1.1 45 – 49 4,636 1,055 5,691 1.5 0.3 0.9 50 – 54 2,996 1,946 4,942 1.3 0.9 1.1 55 – 59 29 479 508 0.0 0.3 0.2 60 – 64 0 3,346 3,346 0.0 2.2 1.2 Education level No formal education 22,213 8,682 30,895 1.6 1.8 1.6 Some Primary 61,880 29,805 91,685 2.4 1.3 1.9 Completed primary 29,772 15,756 45,528 4.2 1.8 2.8 Some secondary 41,718 20,473 62,191 5.5 2.5 3.9 Completed secondary 18,652 11,040 29,692 8.5 3.8 5.8 Post secondary 32,759 27,572 60,331 11.2 5.2 7.3 Education missing 879 2,261 3,140 3.6 8.1 6.0 Source: Authors’ calculations based on the survey round of 2002 Note: i) Estimates excludes Pader and Kitgum districts ii) Estimates based on unemployment information during the last 7 days prior to the survey
How is unemployment rate linked to poverty? Table 19 reveals that nearly 81 percent of the unemployed individuals come from non-poor households. As argued earlier individuals with lower education level are less selective in the type of job than the better educated; this could partly explain the low rate of unemployment of individuals from poor households. In addition, individuals from non-poor households might prefer to remain unemployed since they can still get support.
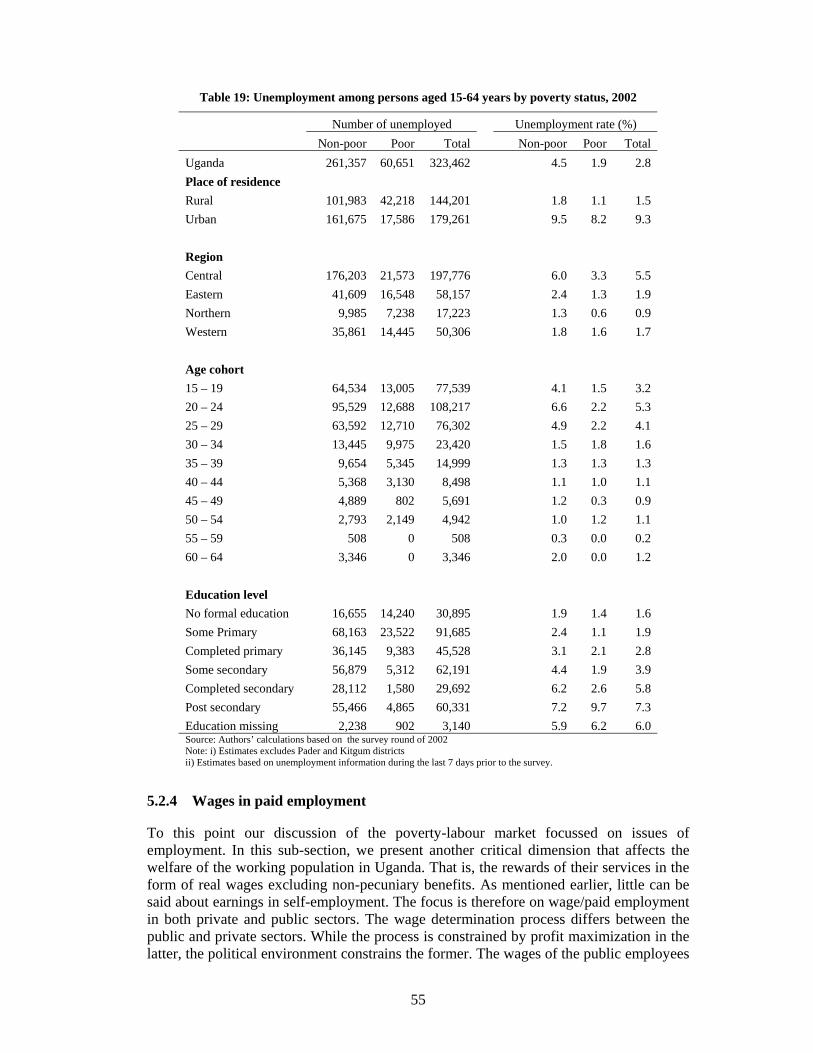
55
Table 19: Unemployment among persons aged 15-64 years by poverty status, 2002
Number of unemployed Unemployment rate (%) Non-poor Poor Total Non-poor Poor Total Uganda 261,357 60,651 323,462 4.5 1.9 2.8 Place of residence Rural 101,983 42,218 144,201 1.8 1.1 1.5 Urban 161,675 17,586 179,261 9.5 8.2 9.3 Region Central 176,203 21,573 197,776 6.0 3.3 5.5 Eastern 41,609 16,548 58,157 2.4 1.3 1.9 Northern 9,985 7,238 17,223 1.3 0.6 0.9 Western 35,861 14,445 50,306 1.8 1.6 1.7 Age cohort 15 – 19 64,534 13,005 77,539 4.1 1.5 3.2 20 – 24 95,529 12,688 108,217 6.6 2.2 5.3 25 – 29 63,592 12,710 76,302 4.9 2.2 4.1 30 – 34 13,445 9,975 23,420 1.5 1.8 1.6 35 – 39 9,654 5,345 14,999 1.3 1.3 1.3 40 – 44 5,368 3,130 8,498 1.1 1.0 1.1 45 – 49 4,889 802 5,691 1.2 0.3 0.9 50 – 54 2,793 2,149 4,942 1.0 1.2 1.1 55 – 59 508 0 508 0.3 0.0 0.2 60 – 64 3,346 0 3,346 2.0 0.0 1.2 Education level No formal education 16,655 14,240 30,895 1.9 1.4 1.6 Some Primary 68,163 23,522 91,685 2.4 1.1 1.9 Completed primary 36,145 9,383 45,528 3.1 2.1 2.8 Some secondary 56,879 5,312 62,191 4.4 1.9 3.9 Completed secondary 28,112 1,580 29,692 6.2 2.6 5.8 Post secondary 55,466 4,865 60,331 7.2 9.7 7.3 Education missing 2,238 902 3,140 5.9 6.2 6.0 Source: Authors’ calculations based on the survey round of 2002 Note: i) Estimates excludes Pader and Kitgum districts ii) Estimates based on unemployment information during the last 7 days prior to the survey.
5.2.4 Wages in paid employment
To this point our discussion of the poverty-labour market focussed on issues of employment. In this sub-section, we present another critical dimension that affects the welfare of the working population in Uganda. That is, the rewards of their services in the form of real wages excluding non-pecuniary benefits. As mentioned earlier, little can be said about earnings in self-employment. The focus is therefore on wage/paid employment in both private and public sectors. The wage determination process differs between the public and private sectors. While the process is constrained by profit maximization in the latter, the political environment constrains the former. The wages of the public employees
56
depend on their ability to compete with other interest groups over the allocation of the government budget and with taxpayers and donors over the size of the budget.
We review the long-run behaviour of real wages, highlight episodes of falling real wages with reference to period of poverty reduction/rises, relationship between wages and poverty at both sectoral and aggregate levels. Broadly speaking, the total wage bill in both sectors increased over the entire period. Based on the survey estimates, the government wage bill grew annually by 17.9 percent between 1992 and 1999, and 9.4 percent between 1999 and 2002. Notwithstanding a declining growth rate, the growth in the wage bill is worrisome and defeats the overall objectives of the public service reforms. This finding partially explains re-emergence of concerns regarding the size of government. The corresponding figures for the private sector were 15.9 and 12.8 percent respectively. The growth for the entire period was nearly 15 percent for both sectors.
i) Evolution of the wage structure: The growth in wage employment and in total wage bill was followed by a mixed growth in wages/salaries per person. Nationally, the mean (median) real wages grew rapidly in the early 1990s by 9.1 percent (11.4 percent) before the rise in poverty but declined between 1999 and 2002 by 1.7 percent (3 percent) per annum. For the entire period, mean (median) real wages grew 6.1 percent (7.4 percent) per annum (Table 20 refers). The observed growth in mean real wages during the 1990s was considerably faster than the growth in household consumption expenditure per adult equivalent of 5 percent during the same period. The decline observed in 1999-02 is consistent with the decline in consumption expenditure per adult equivalent in the same period. More importantly, the ability of the government to control inflation rate helped to keep the average real wages to decline further in 2002.
Considering economic sectors, Table 20 further reveals that the mean real wages of employees grew faster in public services than in other sectors. Except for the period 1999-2002 when the growth in the agricultural sector surpassed that in public services. The real wages in the manufacturing and other services sectors declined by 6 percent and 15.3 percent respectively between 1999 and 2002. Over a 10-year period, trade and other services registered the least growth in real wages. Yet, these sector experienced strong growth of employment.
Turning to private/public sector typology, both sectors witnessed an increase in real wages in the 1990s. Indeed real wages in the public sector were higher than the nation-wide average and the reverse is observed in the private sector. The growth rates were also markedly higher in the public sector than in private sector. Since real wages in the public sector are higher than the nation-wide average while those in private sector were lower than the nation-wide average, these differentials growth rates lead to the widening of the wage differentials between the sectors as will be discussed later. Comparing wages in the public sector to those in the private sector, the results reveal that the ratio between the two sectors on average changed from 1.1 in 1992 to 2.0 in 1999 before increasing to 2.4 in 2002. This finding contrast that of Dercon et al. (2005) in Ethiopia and that of Horton et al. (1994) in Ghana who found a fall in the public sector wages coupled with an increase in private sector wages over the reform period.
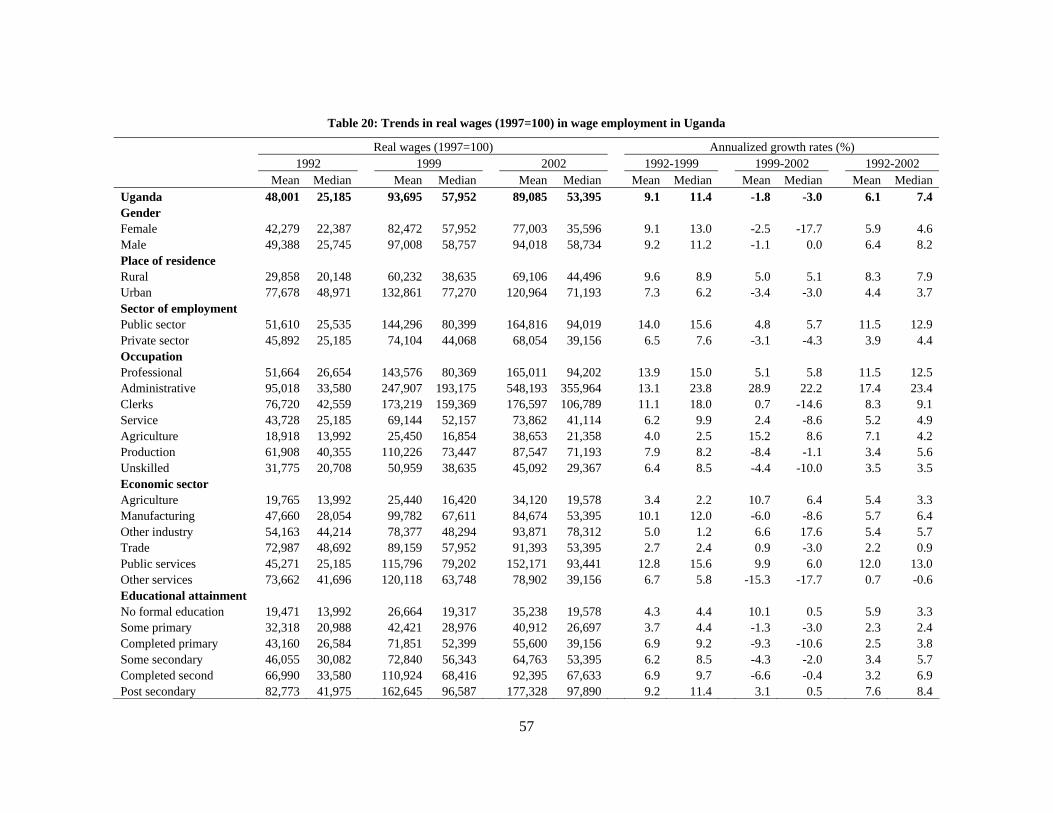
57
Table 20: Trends in real wages (1997=100) in wage employment in Uganda
Real wages (1997=100) Annualized growth rates (%) 1992 1999 2002 1992-1999 1999-2002 1992-2002 Mean Median Mean Median Mean Median Mean Median Mean Median Mean Median Uganda 48,001 25,185 93,695 57,952 89,085 53,395 9.1 11.4 -1.8 -3.0 6.1 7.4 Gender Female 42,279 22,387 82,472 57,952 77,003 35,596 9.1 13.0 -2.5 -17.7 5.9 4.6 Male 49,388 25,745 97,008 58,757 94,018 58,734 9.2 11.2 -1.1 0.0 6.4 8.2 Place of residence Rural 29,858 20,148 60,232 38,635 69,106 44,496 9.6 8.9 5.0 5.1 8.3 7.9 Urban 77,678 48,971 132,861 77,270 120,964 71,193 7.3 6.2 -3.4 -3.0 4.4 3.7 Sector of employment Public sector 51,610 25,535 144,296 80,399 164,816 94,019 14.0 15.6 4.8 5.7 11.5 12.9 Private sector 45,892 25,185 74,104 44,068 68,054 39,156 6.5 7.6 -3.1 -4.3 3.9 4.4 Occupation Professional 51,664 26,654 143,576 80,369 165,011 94,202 13.9 15.0 5.1 5.8 11.5 12.5 Administrative 95,018 33,580 247,907 193,175 548,193 355,964 13.1 23.8 28.9 22.2 17.4 23.4 Clerks 76,720 42,559 173,219 159,369 176,597 106,789 11.1 18.0 0.7 -14.6 8.3 9.1 Service 43,728 25,185 69,144 52,157 73,862 41,114 6.2 9.9 2.4 -8.6 5.2 4.9 Agriculture 18,918 13,992 25,450 16,854 38,653 21,358 4.0 2.5 15.2 8.6 7.1 4.2 Production 61,908 40,355 110,226 73,447 87,547 71,193 7.9 8.2 -8.4 -1.1 3.4 5.6 Unskilled 31,775 20,708 50,959 38,635 45,092 29,367 6.4 8.5 -4.4 -10.0 3.5 3.5 Economic sector Agriculture 19,765 13,992 25,440 16,420 34,120 19,578 3.4 2.2 10.7 6.4 5.4 3.3 Manufacturing 47,660 28,054 99,782 67,611 84,674 53,395 10.1 12.0 -6.0 -8.6 5.7 6.4 Other industry 54,163 44,214 78,377 48,294 93,871 78,312 5.0 1.2 6.6 17.6 5.4 5.7 Trade 72,987 48,692 89,159 57,952 91,393 53,395 2.7 2.4 0.9 -3.0 2.2 0.9 Public services 45,271 25,185 115,796 79,202 152,171 93,441 12.8 15.6 9.9 6.0 12.0 13.0 Other services 73,662 41,696 120,118 63,748 78,902 39,156 6.7 5.8 -15.3 -17.7 0.7 -0.6 Educational attainment No formal education 19,471 13,992 26,664 19,317 35,238 19,578 4.3 4.4 10.1 0.5 5.9 3.3 Some primary 32,318 20,988 42,421 28,976 40,912 26,697 3.7 4.4 -1.3 -3.0 2.3 2.4 Completed primary 43,160 26,584 71,851 52,399 55,600 39,156 6.9 9.2 -9.3 -10.6 2.5 3.8 Some secondary 46,055 30,082 72,840 56,343 64,763 53,395 6.2 8.5 -4.3 -2.0 3.4 5.7 Completed second 66,990 33,580 110,924 68,416 92,395 67,633 6.9 9.7 -6.6 -0.4 3.2 6.9 Post secondary 82,773 41,975 162,645 96,587 177,328 97,890 9.2 11.4 3.1 0.5 7.6 8.4
58
In terms of educational attainment, real wages of employees with some secondary education and less were below the nation-wide average (Table 20 refers). The real wages of those with completed secondary education and beyond rose faster than those with lower education. Broadly speaking, real wages fell during the period of rising poverty. The exceptions are employees with post secondary education and no formal education. Notably, at post secondary level the real wages rose in line with the nation average during 1992-2002, while continuing to grow - though at a lower rate - in period of declining overall real wages. There was a marked gender gap in the real wages. The male-female wage ratio remained more stable for 1992 and 2002 at 1.1 and only increased to 1.8 in 1999. Overall, there was a general rise in wages for all social groupings during the 1990s (see also Appendix 2, nominal wages), though the rise was quickly cut short in 2002.
Narrowing the discussion to private/public sector comparisons, the results reveal that the negative change in wages was driven by what was happening to wages in the urban areas and the regions of Eastern and Western. Higher wages in the Central region could be due to the fact that the demographic characteristics of workers and types of employment are different in different parts of the country. UNDP (2000) cites abundance of unskilled labour and low levels of human capital as a possible explanation for lower wages/salaries in the private sector. Rural real wages in the private sector grew faster than real wages in urban areas (6.2 percent vs 2 percent p.a). This differential growth led to the narrowing of urban-rural wages, suggesting tighter labour market conditions.
Changes in education and in the gender balance, however, took place over the entire period (Table 21 refers). Within each education level, we observe a higher growth in real wages in the public sector compared to the private sector except the period 1999-02 when some groups experienced negative growth rates. Although wages increased for all educational levels in the 1990s, the private sector could not sustain the high pay thereafter. On average after 1999, wages among private employees declined. The only exception was for employees with post secondary education and higher. For these employees, real wages rose in line with the strong economic growth during the 1990s (average of 6.9 percent) but continued to grow though at a less rate in a period of slow down in the economic growth and rise in poverty. Only those with some secondary and completed secondary levels suffered a decline in real wages among public sector employees. This result is difficult to explain. Although one might argue that the reforms did not protect the lower skilled workers in this sector. The dynamic nature of wages in the private sector after 1999 is evidence that the wages in this sector are more closely linked to the performance of the economy (see Table 1). This is especially true for the less educated employees. Over 10-year period, real wages of public sector employees with some primary education and less rose relatively more rapidly than those with completed primary education and beyond; leading to narrowing of the wage differentials. In other words, employees with less than primary education improved their position relative to those with higher educational attainment.
With regard to gender, female workers earned less that their male counterparts both within and across sectors. While the real wages of male employees in the public sector grew faster than for females during the 1990s, the reverse was observed for the period 1999-2002. But for the entire 10-year period both sexes registered the same growth of nearly 12 percent p.a. The gap seems to have narrowed with the implementation of reforms which were seen to have favoured women. On the other hand, there real wages of males in the private sector grew faster than for females (4.2 percent vs 3.9 percent p.a).
59
Changes or fluctuations in the real wages might be reflecting the dynamics of labour demand especially in the private sector. More so, these fluctuations are closely related to the economic growth at national level. There is a marked negative correlation between wage employment and real wages.
While the private sector has continued to create new job opportunities, it has on the other hand raised new issues among which are the wage differentials. The higher wages in the public sector especially in the late 1990s is consistent with government’s retrenchment policy to downsize public servants and pay them better. Although the public sector, on average, pays a higher wage, wage variations are much larger than those observed in the private sector. The deregulation of the labour market (removal of minimum wage) played a major role in influencing the behaviour of wages in the private sector, especially when the economic growth slowed down. As it stands, Uganda does not have a minimum wage policy to protect low skilled workers in the name of reforms. The detailed discussion of the changes in wages inequality over the entire period of analysis is presented in the next sub-section.
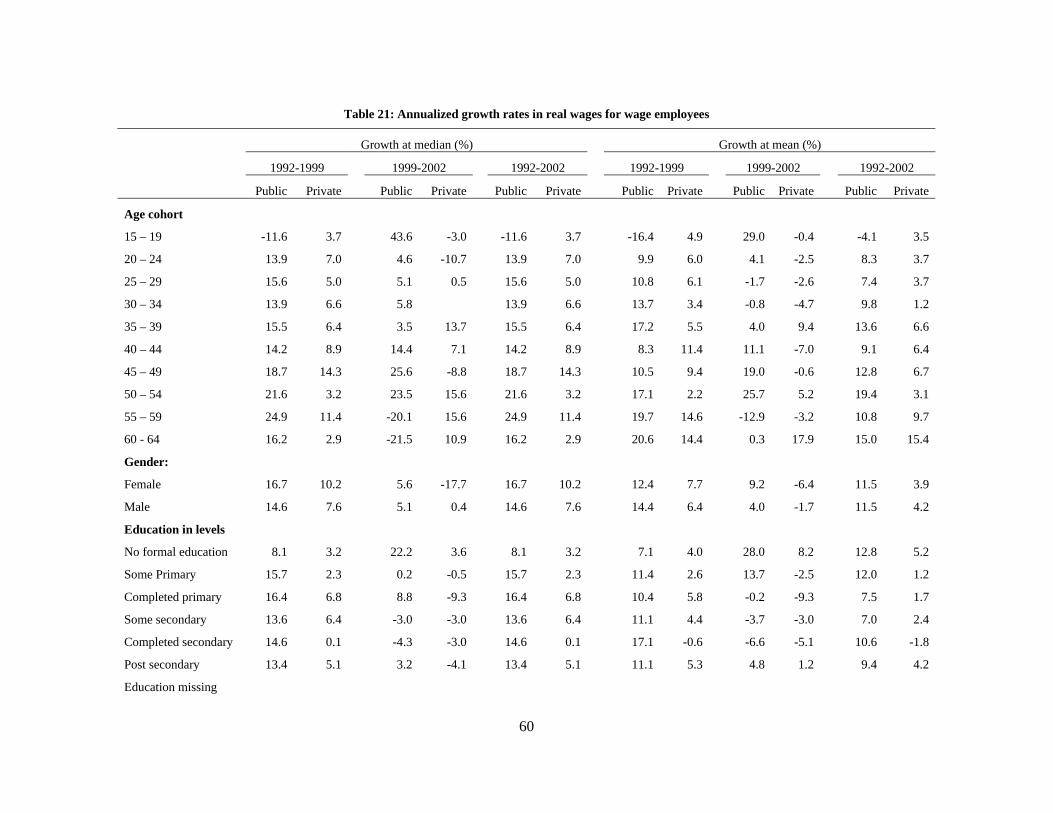
60
Table 21: Annualized growth rates in real wages for wage employees
Growth at median (%) Growth at mean (%)
1992-1999 1999-2002 1992-2002 1992-1999 1999-2002 1992-2002
Public Private Public Private Public Private Public Private Public Private Public Private
Age cohort
15 – 19 -11.6 3.7 43.6 -3.0 -11.6 3.7 -16.4 4.9 29.0 -0.4 -4.1 3.5
20 – 24 13.9 7.0 4.6 -10.7 13.9 7.0 9.9 6.0 4.1 -2.5 8.3 3.7
25 – 29 15.6 5.0 5.1 0.5 15.6 5.0 10.8 6.1 -1.7 -2.6 7.4 3.7
30 – 34 13.9 6.6 5.8 13.9 6.6 13.7 3.4 -0.8 -4.7 9.8 1.2
35 – 39 15.5 6.4 3.5 13.7 15.5 6.4 17.2 5.5 4.0 9.4 13.6 6.6
40 – 44 14.2 8.9 14.4 7.1 14.2 8.9 8.3 11.4 11.1 -7.0 9.1 6.4
45 – 49 18.7 14.3 25.6 -8.8 18.7 14.3 10.5 9.4 19.0 -0.6 12.8 6.7
50 – 54 21.6 3.2 23.5 15.6 21.6 3.2 17.1 2.2 25.7 5.2 19.4 3.1
55 – 59 24.9 11.4 -20.1 15.6 24.9 11.4 19.7 14.6 -12.9 -3.2 10.8 9.7
60 - 64 16.2 2.9 -21.5 10.9 16.2 2.9 20.6 14.4 0.3 17.9 15.0 15.4
Gender:
Female 16.7 10.2 5.6 -17.7 16.7 10.2 12.4 7.7 9.2 -6.4 11.5 3.9
Male 14.6 7.6 5.1 0.4 14.6 7.6 14.4 6.4 4.0 -1.7 11.5 4.2
Education in levels
No formal education 8.1 3.2 22.2 3.6 8.1 3.2 7.1 4.0 28.0 8.2 12.8 5.2
Some Primary 15.7 2.3 0.2 -0.5 15.7 2.3 11.4 2.6 13.7 -2.5 12.0 1.2
Completed primary 16.4 6.8 8.8 -9.3 16.4 6.8 10.4 5.8 -0.2 -9.3 7.5 1.7
Some secondary 13.6 6.4 -3.0 -3.0 13.6 6.4 11.1 4.4 -3.7 -3.0 7.0 2.4
Completed secondary 14.6 0.1 -4.3 -3.0 14.6 0.1 17.1 -0.6 -6.6 -5.1 10.6 -1.8
Post secondary 13.4 5.1 3.2 -4.1 13.4 5.1 11.1 5.3 4.8 1.2 9.4 4.2
Education missing
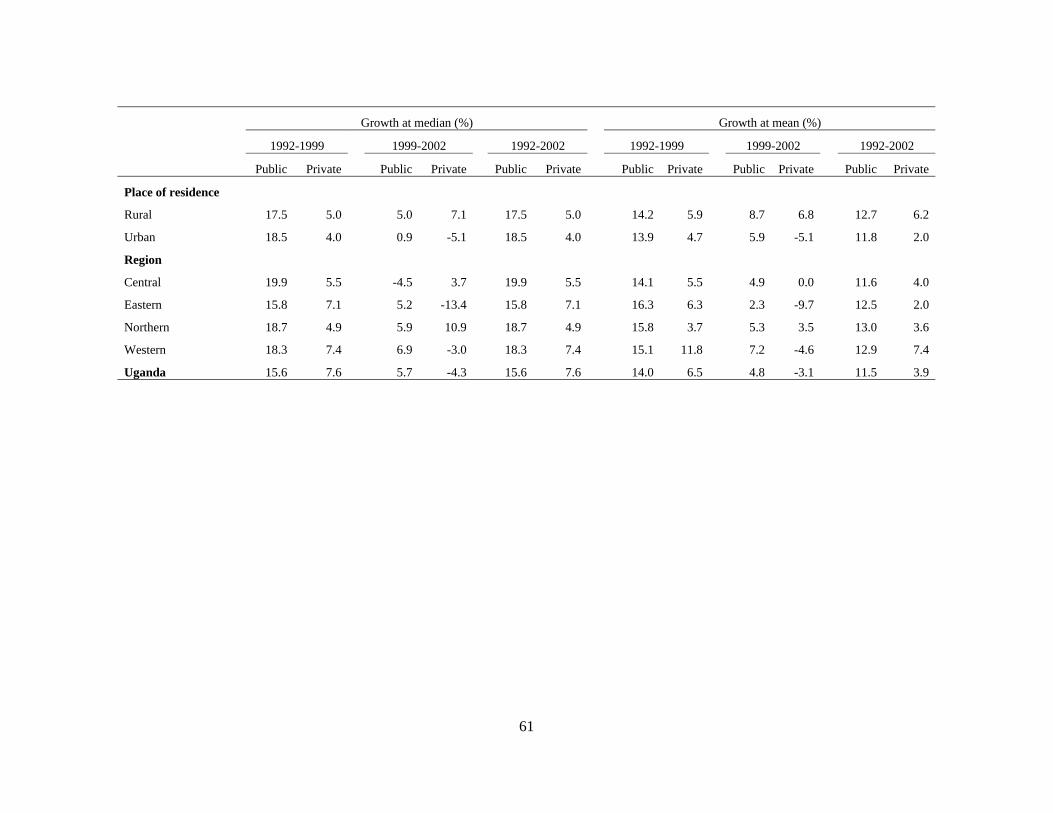
61
Growth at median (%) Growth at mean (%)
1992-1999 1999-2002 1992-2002 1992-1999 1999-2002 1992-2002
Public Private Public Private Public Private Public Private Public Private Public Private
Place of residence
Rural 17.5 5.0 5.0 7.1 17.5 5.0 14.2 5.9 8.7 6.8 12.7 6.2
Urban 18.5 4.0 0.9 -5.1 18.5 4.0 13.9 4.7 5.9 -5.1 11.8 2.0
Region
Central 19.9 5.5 -4.5 3.7 19.9 5.5 14.1 5.5 4.9 0.0 11.6 4.0
Eastern 15.8 7.1 5.2 -13.4 15.8 7.1 16.3 6.3 2.3 -9.7 12.5 2.0
Northern 18.7 4.9 5.9 10.9 18.7 4.9 15.8 3.7 5.3 3.5 13.0 3.6
Western 18.3 7.4 6.9 -3.0 18.3 7.4 15.1 11.8 7.2 -4.6 12.9 7.4
Uganda 15.6 7.6 5.7 -4.3 15.6 7.6 14.0 6.5 4.8 -3.1 11.5 3.9
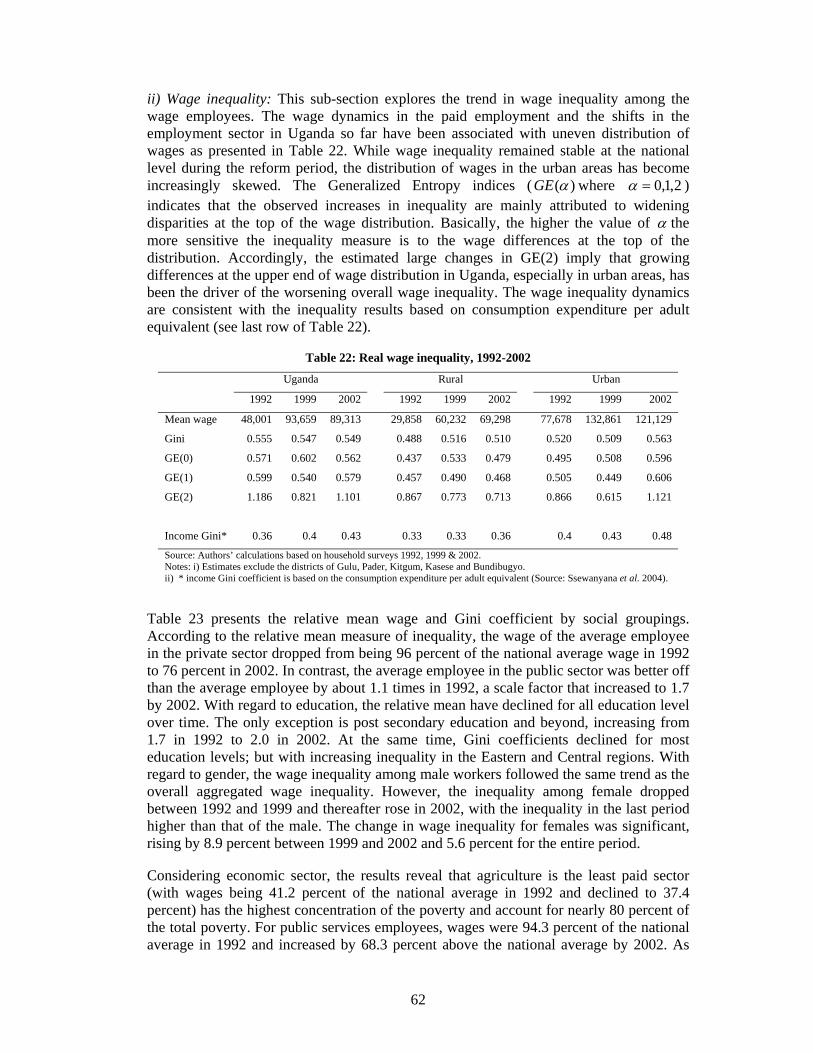
62
ii) Wage inequality: This sub-section explores the trend in wage inequality among the wage employees. The wage dynamics in the paid employment and the shifts in the employment sector in Uganda so far have been associated with uneven distribution of wages as presented in Table 22. While wage inequality remained stable at the national level during the reform period, the distribution of wages in the urban areas has become increasingly skewed. The Generalized Entropy indices ( )(αGE where 2,1,0=α ) indicates that the observed increases in inequality are mainly attributed to widening disparities at the top of the wage distribution. Basically, the higher the value of α the more sensitive the inequality measure is to the wage differences at the top of the distribution. Accordingly, the estimated large changes in GE(2) imply that growing differences at the upper end of wage distribution in Uganda, especially in urban areas, has been the driver of the worsening overall wage inequality. The wage inequality dynamics are consistent with the inequality results based on consumption expenditure per adult equivalent (see last row of Table 22).
Table 22: Real wage inequality, 1992-2002
Uganda Rural Urban
1992 1999 2002 1992 1999 2002 1992 1999 2002
Mean wage 48,001 93,659 89,313 29,858 60,232 69,298 77,678 132,861 121,129
Gini 0.555 0.547 0.549 0.488 0.516 0.510 0.520 0.509 0.563
GE(0) 0.571 0.602 0.562 0.437 0.533 0.479 0.495 0.508 0.596
GE(1) 0.599 0.540 0.579 0.457 0.490 0.468 0.505 0.449 0.606
GE(2) 1.186 0.821 1.101 0.867 0.773 0.713 0.866 0.615 1.121
Income Gini* 0.36 0.4 0.43 0.33 0.33 0.36 0.4 0.43 0.48
Source: Authors’ calculations based on household surveys 1992, 1999 & 2002. Notes: i) Estimates exclude the districts of Gulu, Pader, Kitgum, Kasese and Bundibugyo. ii) * income Gini coefficient is based on the consumption expenditure per adult equivalent (Source: Ssewanyana et al. 2004).
Table 23 presents the relative mean wage and Gini coefficient by social groupings. According to the relative mean measure of inequality, the wage of the average employee in the private sector dropped from being 96 percent of the national average wage in 1992 to 76 percent in 2002. In contrast, the average employee in the public sector was better off than the average employee by about 1.1 times in 1992, a scale factor that increased to 1.7 by 2002. With regard to education, the relative mean have declined for all education level over time. The only exception is post secondary education and beyond, increasing from 1.7 in 1992 to 2.0 in 2002. At the same time, Gini coefficients declined for most education levels; but with increasing inequality in the Eastern and Central regions. With regard to gender, the wage inequality among male workers followed the same trend as the overall aggregated wage inequality. However, the inequality among female dropped between 1992 and 1999 and thereafter rose in 2002, with the inequality in the last period higher than that of the male. The change in wage inequality for females was significant, rising by 8.9 percent between 1999 and 2002 and 5.6 percent for the entire period.
Considering economic sector, the results reveal that agriculture is the least paid sector (with wages being 41.2 percent of the national average in 1992 and declined to 37.4 percent) has the highest concentration of the poverty and account for nearly 80 percent of the total poverty. For public services employees, wages were 94.3 percent of the national average in 1992 and increased by 68.3 percent above the national average by 2002. As
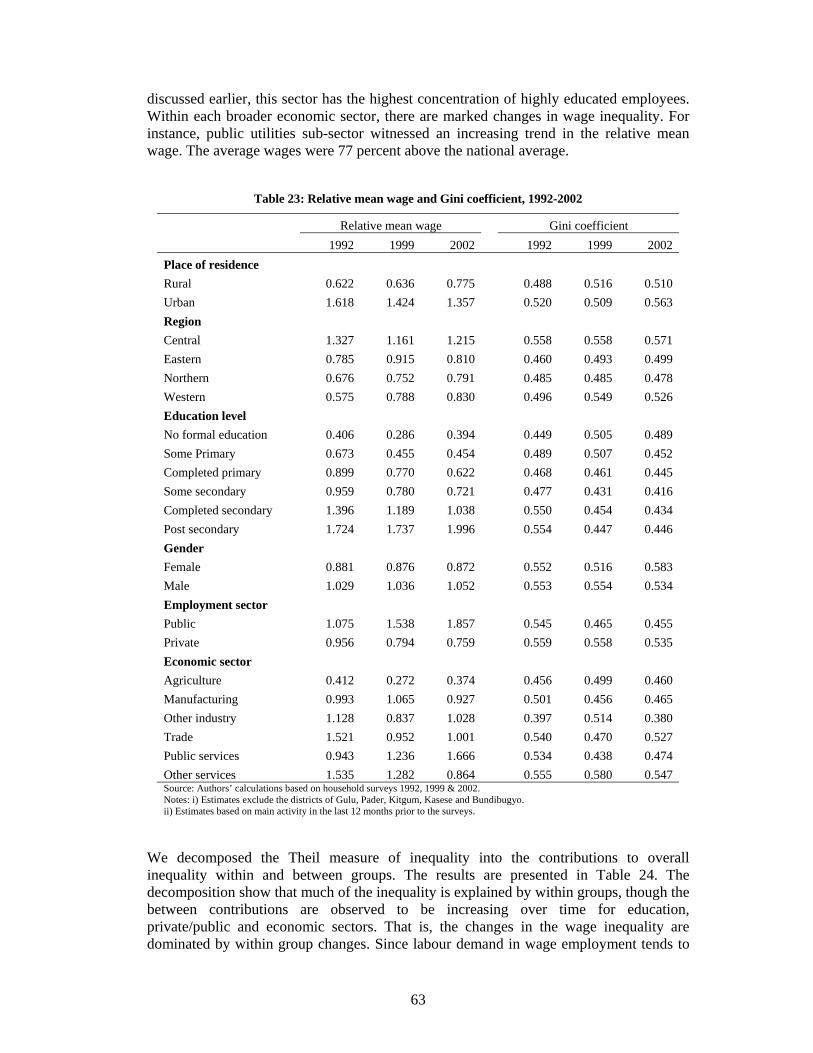
63
discussed earlier, this sector has the highest concentration of highly educated employees. Within each broader economic sector, there are marked changes in wage inequality. For instance, public utilities sub-sector witnessed an increasing trend in the relative mean wage. The average wages were 77 percent above the national average.
Table 23: Relative mean wage and Gini coefficient, 1992-2002
Relative mean wage Gini coefficient 1992 1999 2002 1992 1999 2002 Place of residence Rural 0.622 0.636 0.775 0.488 0.516 0.510 Urban 1.618 1.424 1.357 0.520 0.509 0.563 Region Central 1.327 1.161 1.215 0.558 0.558 0.571 Eastern 0.785 0.915 0.810 0.460 0.493 0.499 Northern 0.676 0.752 0.791 0.485 0.485 0.478 Western 0.575 0.788 0.830 0.496 0.549 0.526 Education level No formal education 0.406 0.286 0.394 0.449 0.505 0.489 Some Primary 0.673 0.455 0.454 0.489 0.507 0.452 Completed primary 0.899 0.770 0.622 0.468 0.461 0.445 Some secondary 0.959 0.780 0.721 0.477 0.431 0.416 Completed secondary 1.396 1.189 1.038 0.550 0.454 0.434 Post secondary 1.724 1.737 1.996 0.554 0.447 0.446 Gender Female 0.881 0.876 0.872 0.552 0.516 0.583 Male 1.029 1.036 1.052 0.553 0.554 0.534 Employment sector Public 1.075 1.538 1.857 0.545 0.465 0.455 Private 0.956 0.794 0.759 0.559 0.558 0.535 Economic sector Agriculture 0.412 0.272 0.374 0.456 0.499 0.460 Manufacturing 0.993 1.065 0.927 0.501 0.456 0.465 Other industry 1.128 0.837 1.028 0.397 0.514 0.380 Trade 1.521 0.952 1.001 0.540 0.470 0.527 Public services 0.943 1.236 1.666 0.534 0.438 0.474 Other services 1.535 1.282 0.864 0.555 0.580 0.547 Source: Authors’ calculations based on household surveys 1992, 1999 & 2002. Notes: i) Estimates exclude the districts of Gulu, Pader, Kitgum, Kasese and Bundibugyo. ii) Estimates based on main activity in the last 12 months prior to the surveys.
We decomposed the Theil measure of inequality into the contributions to overall inequality within and between groups. The results are presented in Table 24. The decomposition show that much of the inequality is explained by within groups, though the between contributions are observed to be increasing over time for education, private/public and economic sectors. That is, the changes in the wage inequality are dominated by within group changes. Since labour demand in wage employment tends to
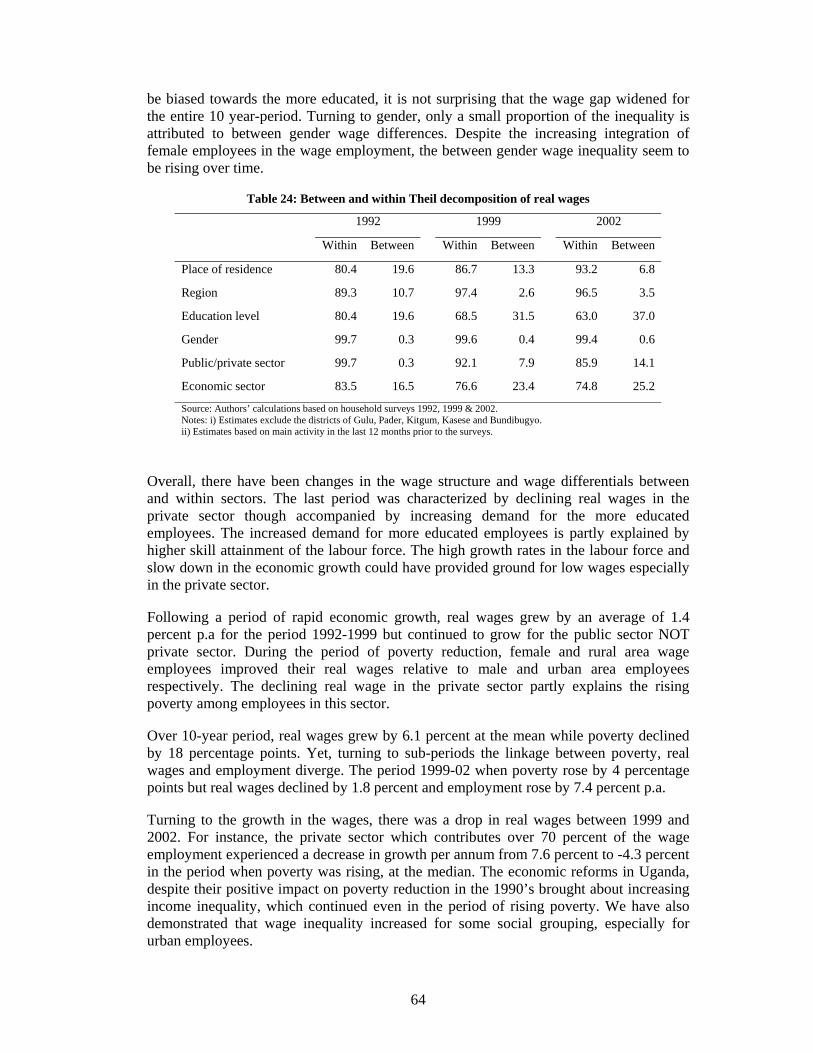
64
be biased towards the more educated, it is not surprising that the wage gap widened for the entire 10 year-period. Turning to gender, only a small proportion of the inequality is attributed to between gender wage differences. Despite the increasing integration of female employees in the wage employment, the between gender wage inequality seem to be rising over time.
Table 24: Between and within Theil decomposition of real wages
1992 1999 2002
Within Between Within Between Within Between
Place of residence 80.4 19.6 86.7 13.3 93.2 6.8
Region 89.3 10.7 97.4 2.6 96.5 3.5
Education level 80.4 19.6 68.5 31.5 63.0 37.0
Gender 99.7 0.3 99.6 0.4 99.4 0.6
Public/private sector 99.7 0.3 92.1 7.9 85.9 14.1
Economic sector 83.5 16.5 76.6 23.4 74.8 25.2
Source: Authors’ calculations based on household surveys 1992, 1999 & 2002. Notes: i) Estimates exclude the districts of Gulu, Pader, Kitgum, Kasese and Bundibugyo. ii) Estimates based on main activity in the last 12 months prior to the surveys.
Overall, there have been changes in the wage structure and wage differentials between and within sectors. The last period was characterized by declining real wages in the private sector though accompanied by increasing demand for the more educated employees. The increased demand for more educated employees is partly explained by higher skill attainment of the labour force. The high growth rates in the labour force and slow down in the economic growth could have provided ground for low wages especially in the private sector.
Following a period of rapid economic growth, real wages grew by an average of 1.4 percent p.a for the period 1992-1999 but continued to grow for the public sector NOT private sector. During the period of poverty reduction, female and rural area wage employees improved their real wages relative to male and urban area employees respectively. The declining real wage in the private sector partly explains the rising poverty among employees in this sector.
Over 10-year period, real wages grew by 6.1 percent at the mean while poverty declined by 18 percentage points. Yet, turning to sub-periods the linkage between poverty, real wages and employment diverge. The period 1999-02 when poverty rose by 4 percentage points but real wages declined by 1.8 percent and employment rose by 7.4 percent p.a.
Turning to the growth in the wages, there was a drop in real wages between 1999 and 2002. For instance, the private sector which contributes over 70 percent of the wage employment experienced a decrease in growth per annum from 7.6 percent to -4.3 percent in the period when poverty was rising, at the median. The economic reforms in Uganda, despite their positive impact on poverty reduction in the 1990’s brought about increasing income inequality, which continued even in the period of rising poverty. We have also demonstrated that wage inequality increased for some social grouping, especially for urban employees.
65
Despite the shift in the sectoral employment composition especially away from agriculture to other sectors, which one would term as more remunerative activities; it did little to prevent poverty from rising after almost a decade of declining trends. When the economy experienced the strong economic growth, with increased opportunities for new employment and increases in the real wages, the number of poor people reduced. However, the opportunities for new employment further increased with a slight decline in GDP growth preceded by lower real wages, the number of poor people increased. These findings emphasize the impact the operations of the labour market can have on poverty reduction.
From a macro perspective, growth in real wages kept pace with economic growth. We have demonstrated that real wages contracted when there was a slow down in the economy. Growth in real wages varied across economic sectors. The growth in real wages in the public utilities coincided with the liberalization of the energy sub-sectors; whereas growth real wages of the public sector employees is as a consequence of the public sector reforms.
Wage is an important indicator of job quality, but we have demonstrated above that real wages especially in the private sector declined in the last period; suggesting deteriorating remuneration. Although there are other indicators of job quality such as job tenureship, we cannot comment on this over time since the surveys other than the 2002 one did not gather such information. Based on 2002 labour data, employment in public sector is more permanent relative to that in the private sector (82.4 percent vs 18.3 percent respectively); more educated workers are more likely to be on temporary terms in the private sector; crop agriculture employs individuals on casual terms; and there was not pronounced gender bias (Ssewanyana & Appleton, 2006). In other words, contractual conditions in the public sector are more stable than in the private sector wage employment.
To sum up, the labour market in Uganda is characterized by high rates of population and labour force growth, stagnation in EPR, low share of wage earners in the total workforce but large share of the private sector in wage employment. The declining LPR and EPR are partly explained by increased enrolments in school especially among the younger groups. The period under study is characterized with shifts in the employment composition, structural changes in the wages for those in paid employment and more demand for better educated workers. Notably, the female participation in the productive labour market activities increased faster than that of male. Yet, most of these female remain located in lower paying activities. This raises a need to have a better understanding of the factors influencing choice of employment and whether significant structural shifts in these factors have taken place over the 10-year period. A discussion presented in section 6. There have also been increases in self-employment over the years. This is not surprising given the low absorption capacity of the formal economy in the face of increasing in labour supply. On the other hand, the descriptive analysis clearly shows an increasing demand for better educated workers. This has to some extent resulted into better wages of these workers relative to others, which has had an adverse effect on wage distribution especially in the urban areas. We have also demonstrated a growing wage gap between the private and public sector employees. The factors explaining this phenomenon is the subject of the section 7.
66
6. Employment choice
6.1 Model specification
The first major step to our understanding of the labour market in Uganda concerns the factors influencing an individual’s employment choice. We endeavour to give insights into the factors influencing the selection into any of the five employment states based on the employment status of the main activity. UBoS defines the main activity as that activity where an individual spends most time. The employment states include the unemployed - individuals not employed for more than six months in a given year according to the international standards. However, we redefine the unemployed concept as discussed later in the text. We split the self-employed21 category into two groups – agriculture and non-agriculture. Lastly, we split paid employment into public and private.
We assume individuals are allocated by some data generating process into 5 mutually exclusive employment states. The equation for the underlying latent variable is given as in Eq. (1).
(1) isttist ZP εβ += '*
where *isP is a latent variable representing the thi individual utility gain from choosing the
ths employment choice (s=not working, self employed in agriculture, self employed in non-agriculture, public and private, indexed s=0,1,2,3,4) in the tht survey year (t=1992, 1999, 2002). The error term is assumed to be normally distributed with mean zero and unity variance. The Z vector contains exogenous factors including individual characteristics such as age, sex, education and marital status; household characteristics such as gender of the household head; and community characteristics especially infrastructure services. The individual chooses an employment state for which utility is highest.
The probability of choosing the ths employment state conditional of Z vector takes the multinomial logit form as expressed in Eq. (2). For identification, t0β are normalised to zero, that is, we make not working the base employment state.
(2) ∑
= =
=
4
0
'
'
)exp(
)exp()/( s
sstit
stit
Z
ZtZsP
β
β
i) Description of the model variables
Individual demographic characteristics: These include age, sex, marital status and education. Information on age was collected in terms of completed years. It enters in the econometric models in a quadratic term and used as a proxy for years of experience in the wage equation. Unfortunately, the surveys provide no information on working experience. Neither do they contain information on the age at which the individuals left the educational system nor on the age at which they entered the labour market. While most studies have been able to impute years of experience based on information on age and years of schooling, we strongly believe that such imputations in Uganda are likely to 21 . We do not separate employers from other type of self employment due to small numbers involved. Otherwise they should have been treated as separate groups. As Earle & Sakova (2000) argue, employers represent clear cases of genuine entrepreneurship contrasted to others self employed individuals.
67
be biased. Before the introduction of UPE the repetition rates were very high and also individuals tended to start schooling beyond the 6 years of age.
Information on education is collected on the highest grade attained at the time of the survey. This variable was converted into years of schooling which we latter divided into seven levels. These levels include, no formal education, some primary education, completed primary education, some secondary education, completed secondary education and post secondary education. The last category included all those individuals who have gone beyond ordinary level education including university graduates and above. No formal education is used as the base category. Sex and marital status are also included in the model in dummy form with female and unmarried as the base categories, respectively.
Main labour activity characteristics: The surveys collected information on the activity status including the employment status, industry and occupation status. The information was aggregated into broad categories to ease the analysis.
Household characteristics: In the employment selection models, some researchers such as Schultz (1990) argued inclusion of some measure of wealth such as non-labour income and land. As there are expected to reduce the probability of labour participation by raising the shadow value of an individual’s time in non-market activities and self employment. Unfortunately, the 2002 survey round did not capture information on non-labour income. By extension, the land variable seems to suffer from some measurement problems. This explains the exclusion of these variables in the employment choice models. Besides these variables, previous studies (such as Lassibille, 1998; Wambugu, 2002) included household demographics to account for the cost of entering the labour market. We also included gender of the household head and social networking.
Community characteristics: These community characteristics are considered in the Z vector above. These include the availability of banking institutions that can ease the credit constraint; health facilities which are assumed to indirectly influence labour participation; availability of electricity and telephone facilities; and proximity to road infrastructure. On the other hand, the geographical location of an individual is included to control for differentials in the labour market opportunities. But location also enters the Z vector.
6.2 Estimation issues
Estimation and data issues considered included sample weights, heteroscedasticity, clustering (possible non-independence of observations from the same sampling unit), multicollinearity, missing observations and outliers. In all cases, appropriate univariate and regression statistics (means and standard errors) are reported, which are adjusted for sample weight (thus representative of the Uganda population) and robust to heteroscedasticity and clustering.
Missing observations are observed among the exogenous variables. As much as the number of missing observations for any single variable may not be large, the set of individuals for whom there is missing data for at least one variable increases with the number of exogenous variables. More still dropping such individuals would affect the national representation of our estimates. Instead the variable(s) were recorded so that a missing or 0 value is replaced by the median value based on the non-zero observations for a particular variable. Then separate dummy variables, coded as 1 when the corresponding variable is missing and 0 when it is not is included in the model. This approach reduces the potential problem of sample selection bias.
68
With regard to outliers, some observations with unbelievable data values were dropped. The models specified above were estimated separately for each survey year. The multinomial logit models were subjected to several specification tests including the IIA property. The results from the preferred model are discussed in the next section.
6.3 Results
The multinomial logit estimates for the employment states are presented in Table 25 -Table 27. These estimates are marginal effects of each variable on the probability of joining a particular employment state calculated at the mean values of the variables and the associated asymptotic z-values. The reference category is the not working. In other words, all coefficients should be interpreted relative to the default category of not working. The chi-square for every pair was statistically significant at 0.001 level. In other words, the split of the employment choices was appropriate. Further still the Hausman tests for the null hypothesis that employment choices are independent is not rejected for all survey years.
Individual characteristics: The results suggest that males are significantly less likely to be employed in the agriculture sector but are significantly more likely to be working in non-agriculture, public or private sector. The results are robust across all the survey years. The marginal effect of a male individual working in the public sector declined between 1992 and 2002 by almost a third. This suggests increased entry to this sector by female individuals, a finding consistent with the descriptive analysis. In addition, the results suggest that unmarried individuals have a higher probability of working in the private sector but less likely to be self-employed in the agricultural sector than married individuals. This finding is robust across survey years. However, the results were not robust for non-agriculture and public sectors.
Education has a very clear influence on the allocation of individuals across employment states as expected, but its effect depends on the level of education. Generally speaking, the pattern of coefficients is similar for all survey years. The results indicate brighter prospects for the better educated. The estimates suggest that education significantly increases the individual’s likelihood of being employed in the public or self-employed in non-agricultural activities relative to being not working. In each case the higher the education level, the higher its contribution to participation in that employment sector. However, the marginal effects for some levels portray a declining trend. For instance, effects of post secondary education are higher for the public sector, for which the chance was 59 percent in 1992. The corresponding figures for 1999 and 2002 were 29 and 32 percent respectively. This finding is consistent with Terrell (1993) for Haiti. The retrenchment of public employees partly explains the drop between 1992 and 1999. Over time, it has become increasing difficult for individuals with lower education to enter the private sector, while mixed results are observed for post secondary education. More education has encouraged entry in the non-agricultural sector except for post secondary education. For instance, entry for primary education graduates increased from 5.3 percent in 1992 to 11.8 percent in 2002. In contrast, additional education significantly reduces the chance of being self-employed in the agricultural sector. The probability of leaving the agricultural sector is highest for post secondary graduates while lowest for individuals that have attained only some primary education.
Holding everything constant, an individual with some primary education was almost twenty times as likely to be employed in the public sector as in non-agricultural sector.
69
While individuals with post secondary education were more likely to be employed in the private sector in 1999, such significant effect is lost in 2002. This result is difficult to explain. In summary, the majority of the coefficients are positive and significant, implying that education qualifications increase the tendency not to choose the category of non-working. Investment is human development is a key to moving the masses from agriculture to other sectors.
Household characteristics: An individual with relative(s) in the public sector is significantly more likely to choose paid employment in the public sector compared to one without such a network and reduces the chance of being in any other sector. During the 1990’s such an individual had nearly 60 percent chance of being employed in the public sector, but the chances decreased to about 39 percent at the beginning of the new millennium. We further observe that such networks raised the chance of an individual entering private sector by 3 percent in 1999 and 4 percent in 2002. There are no significant differences observed in 1992.
With respect to head of the household, individuals residing in households headed by males are significantly more likely to seek self employment in agriculture relative to households headed by unmarried female. And the results portray an increasing trend over the years. This is not surprising as male headed households are more likely to have access to farming land compared to the female headed households. We further observe significant differences in the chances of entering any sector within female headed household category. The results are robust across the survey years. The results have implications for the land policy reforms.
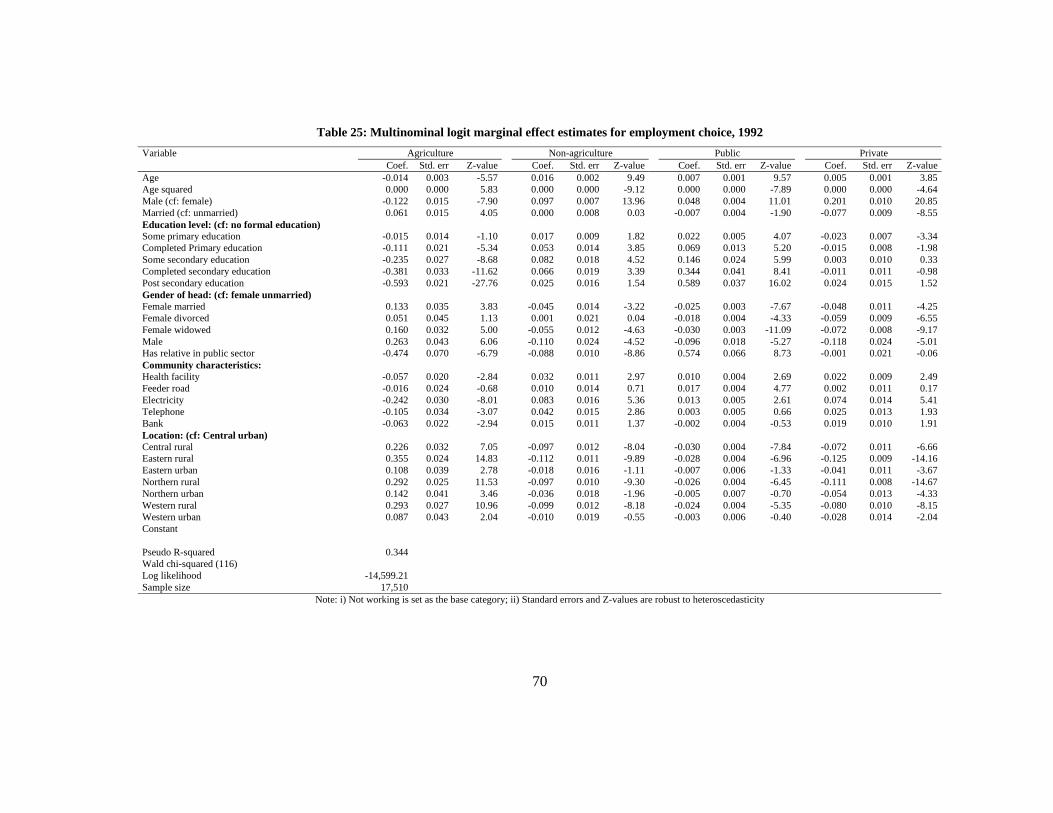
70
Table 25: Multinominal logit marginal effect estimates for employment choice, 1992 Variable Agriculture Non-agriculture Public Private Coef. Std. err Z-value Coef. Std. err Z-value Coef. Std. err Z-value Coef. Std. err Z-valueAge -0.014 0.003 -5.57 0.016 0.002 9.49 0.007 0.001 9.57 0.005 0.001 3.85Age squared 0.000 0.000 5.83 0.000 0.000 -9.12 0.000 0.000 -7.89 0.000 0.000 -4.64Male (cf: female) -0.122 0.015 -7.90 0.097 0.007 13.96 0.048 0.004 11.01 0.201 0.010 20.85Married (cf: unmarried) 0.061 0.015 4.05 0.000 0.008 0.03 -0.007 0.004 -1.90 -0.077 0.009 -8.55Education level: (cf: no formal education) Some primary education -0.015 0.014 -1.10 0.017 0.009 1.82 0.022 0.005 4.07 -0.023 0.007 -3.34Completed Primary education -0.111 0.021 -5.34 0.053 0.014 3.85 0.069 0.013 5.20 -0.015 0.008 -1.98Some secondary education -0.235 0.027 -8.68 0.082 0.018 4.52 0.146 0.024 5.99 0.003 0.010 0.33Completed secondary education -0.381 0.033 -11.62 0.066 0.019 3.39 0.344 0.041 8.41 -0.011 0.011 -0.98Post secondary education -0.593 0.021 -27.76 0.025 0.016 1.54 0.589 0.037 16.02 0.024 0.015 1.52Gender of head: (cf: female unmarried) Female married 0.133 0.035 3.83 -0.045 0.014 -3.22 -0.025 0.003 -7.67 -0.048 0.011 -4.25Female divorced 0.051 0.045 1.13 0.001 0.021 0.04 -0.018 0.004 -4.33 -0.059 0.009 -6.55Female widowed 0.160 0.032 5.00 -0.055 0.012 -4.63 -0.030 0.003 -11.09 -0.072 0.008 -9.17Male 0.263 0.043 6.06 -0.110 0.024 -4.52 -0.096 0.018 -5.27 -0.118 0.024 -5.01Has relative in public sector -0.474 0.070 -6.79 -0.088 0.010 -8.86 0.574 0.066 8.73 -0.001 0.021 -0.06Community characteristics: Health facility -0.057 0.020 -2.84 0.032 0.011 2.97 0.010 0.004 2.69 0.022 0.009 2.49Feeder road -0.016 0.024 -0.68 0.010 0.014 0.71 0.017 0.004 4.77 0.002 0.011 0.17Electricity -0.242 0.030 -8.01 0.083 0.016 5.36 0.013 0.005 2.61 0.074 0.014 5.41Telephone -0.105 0.034 -3.07 0.042 0.015 2.86 0.003 0.005 0.66 0.025 0.013 1.93Bank -0.063 0.022 -2.94 0.015 0.011 1.37 -0.002 0.004 -0.53 0.019 0.010 1.91Location: (cf: Central urban) Central rural 0.226 0.032 7.05 -0.097 0.012 -8.04 -0.030 0.004 -7.84 -0.072 0.011 -6.66Eastern rural 0.355 0.024 14.83 -0.112 0.011 -9.89 -0.028 0.004 -6.96 -0.125 0.009 -14.16Eastern urban 0.108 0.039 2.78 -0.018 0.016 -1.11 -0.007 0.006 -1.33 -0.041 0.011 -3.67Northern rural 0.292 0.025 11.53 -0.097 0.010 -9.30 -0.026 0.004 -6.45 -0.111 0.008 -14.67Northern urban 0.142 0.041 3.46 -0.036 0.018 -1.96 -0.005 0.007 -0.70 -0.054 0.013 -4.33Western rural 0.293 0.027 10.96 -0.099 0.012 -8.18 -0.024 0.004 -5.35 -0.080 0.010 -8.15Western urban 0.087 0.043 2.04 -0.010 0.019 -0.55 -0.003 0.006 -0.40 -0.028 0.014 -2.04Constant
Pseudo R-squared 0.344 Wald chi-squared (116) Log likelihood -14,599.21 Sample size 17,510
Note: i) Not working is set as the base category; ii) Standard errors and Z-values are robust to heteroscedasticity
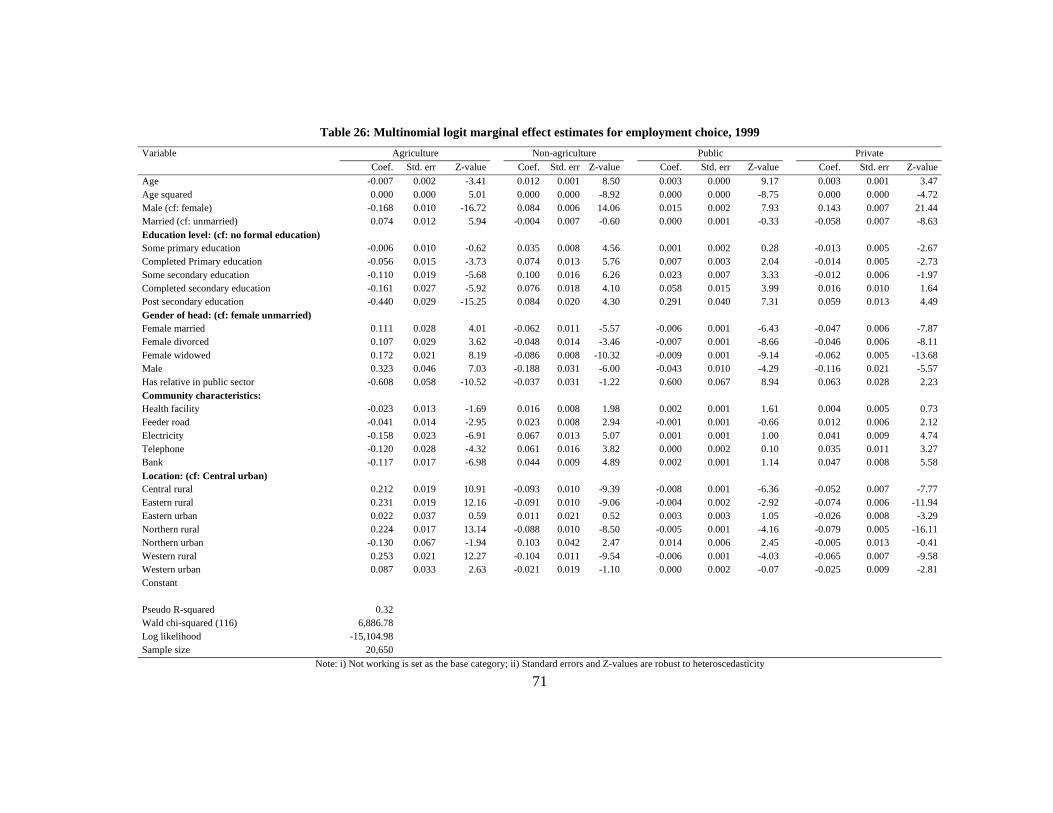
71
Table 26: Multinomial logit marginal effect estimates for employment choice, 1999 Variable Agriculture Non-agriculture Public Private Coef. Std. err Z-value Coef. Std. err Z-value Coef. Std. err Z-value Coef. Std. err Z-valueAge -0.007 0.002 -3.41 0.012 0.001 8.50 0.003 0.000 9.17 0.003 0.001 3.47Age squared 0.000 0.000 5.01 0.000 0.000 -8.92 0.000 0.000 -8.75 0.000 0.000 -4.72Male (cf: female) -0.168 0.010 -16.72 0.084 0.006 14.06 0.015 0.002 7.93 0.143 0.007 21.44Married (cf: unmarried) 0.074 0.012 5.94 -0.004 0.007 -0.60 0.000 0.001 -0.33 -0.058 0.007 -8.63Education level: (cf: no formal education) Some primary education -0.006 0.010 -0.62 0.035 0.008 4.56 0.001 0.002 0.28 -0.013 0.005 -2.67Completed Primary education -0.056 0.015 -3.73 0.074 0.013 5.76 0.007 0.003 2.04 -0.014 0.005 -2.73Some secondary education -0.110 0.019 -5.68 0.100 0.016 6.26 0.023 0.007 3.33 -0.012 0.006 -1.97Completed secondary education -0.161 0.027 -5.92 0.076 0.018 4.10 0.058 0.015 3.99 0.016 0.010 1.64Post secondary education -0.440 0.029 -15.25 0.084 0.020 4.30 0.291 0.040 7.31 0.059 0.013 4.49Gender of head: (cf: female unmarried) Female married 0.111 0.028 4.01 -0.062 0.011 -5.57 -0.006 0.001 -6.43 -0.047 0.006 -7.87Female divorced 0.107 0.029 3.62 -0.048 0.014 -3.46 -0.007 0.001 -8.66 -0.046 0.006 -8.11Female widowed 0.172 0.021 8.19 -0.086 0.008 -10.32 -0.009 0.001 -9.14 -0.062 0.005 -13.68Male 0.323 0.046 7.03 -0.188 0.031 -6.00 -0.043 0.010 -4.29 -0.116 0.021 -5.57Has relative in public sector -0.608 0.058 -10.52 -0.037 0.031 -1.22 0.600 0.067 8.94 0.063 0.028 2.23Community characteristics: Health facility -0.023 0.013 -1.69 0.016 0.008 1.98 0.002 0.001 1.61 0.004 0.005 0.73Feeder road -0.041 0.014 -2.95 0.023 0.008 2.94 -0.001 0.001 -0.66 0.012 0.006 2.12Electricity -0.158 0.023 -6.91 0.067 0.013 5.07 0.001 0.001 1.00 0.041 0.009 4.74Telephone -0.120 0.028 -4.32 0.061 0.016 3.82 0.000 0.002 0.10 0.035 0.011 3.27Bank -0.117 0.017 -6.98 0.044 0.009 4.89 0.002 0.001 1.14 0.047 0.008 5.58Location: (cf: Central urban) Central rural 0.212 0.019 10.91 -0.093 0.010 -9.39 -0.008 0.001 -6.36 -0.052 0.007 -7.77Eastern rural 0.231 0.019 12.16 -0.091 0.010 -9.06 -0.004 0.002 -2.92 -0.074 0.006 -11.94Eastern urban 0.022 0.037 0.59 0.011 0.021 0.52 0.003 0.003 1.05 -0.026 0.008 -3.29Northern rural 0.224 0.017 13.14 -0.088 0.010 -8.50 -0.005 0.001 -4.16 -0.079 0.005 -16.11Northern urban -0.130 0.067 -1.94 0.103 0.042 2.47 0.014 0.006 2.45 -0.005 0.013 -0.41Western rural 0.253 0.021 12.27 -0.104 0.011 -9.54 -0.006 0.001 -4.03 -0.065 0.007 -9.58Western urban 0.087 0.033 2.63 -0.021 0.019 -1.10 0.000 0.002 -0.07 -0.025 0.009 -2.81Constant
Pseudo R-squared 0.32 Wald chi-squared (116) 6,886.78 Log likelihood -15,104.98 Sample size 20,650
Note: i) Not working is set as the base category; ii) Standard errors and Z-values are robust to heteroscedasticity
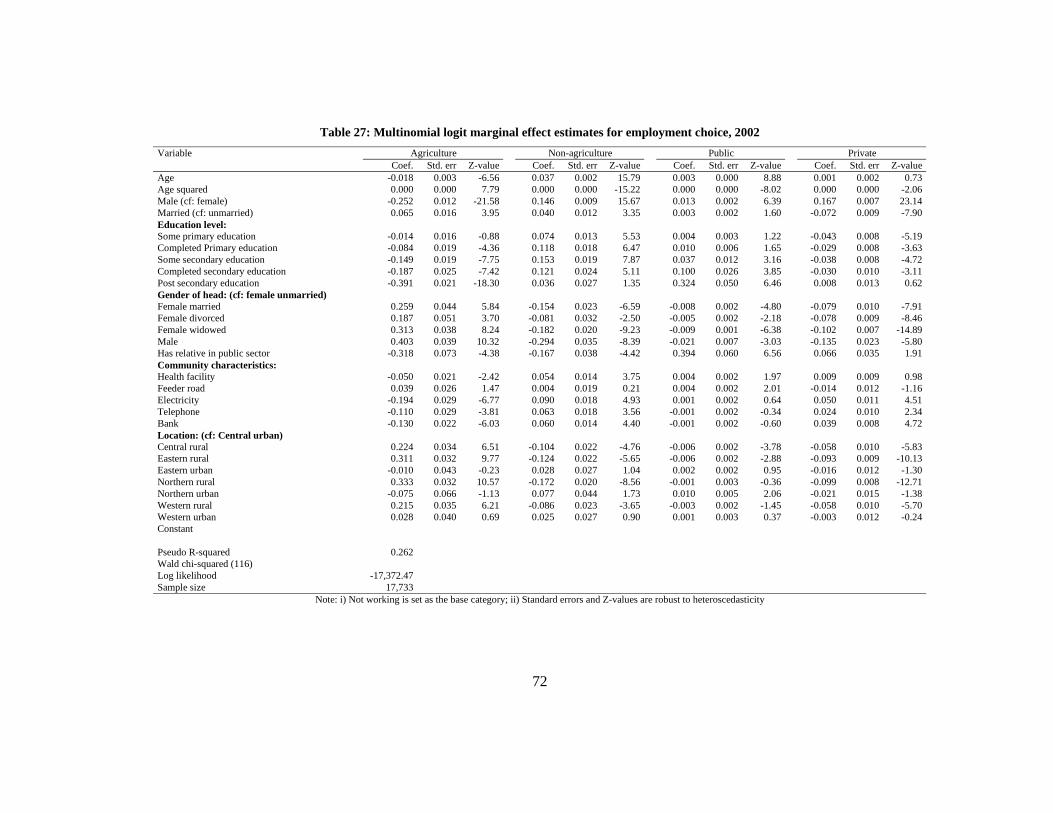
72
Table 27: Multinomial logit marginal effect estimates for employment choice, 2002 Variable Agriculture Non-agriculture Public Private Coef. Std. err Z-value Coef. Std. err Z-value Coef. Std. err Z-value Coef. Std. err Z-valueAge -0.018 0.003 -6.56 0.037 0.002 15.79 0.003 0.000 8.88 0.001 0.002 0.73Age squared 0.000 0.000 7.79 0.000 0.000 -15.22 0.000 0.000 -8.02 0.000 0.000 -2.06Male (cf: female) -0.252 0.012 -21.58 0.146 0.009 15.67 0.013 0.002 6.39 0.167 0.007 23.14Married (cf: unmarried) 0.065 0.016 3.95 0.040 0.012 3.35 0.003 0.002 1.60 -0.072 0.009 -7.90Education level: Some primary education -0.014 0.016 -0.88 0.074 0.013 5.53 0.004 0.003 1.22 -0.043 0.008 -5.19Completed Primary education -0.084 0.019 -4.36 0.118 0.018 6.47 0.010 0.006 1.65 -0.029 0.008 -3.63Some secondary education -0.149 0.019 -7.75 0.153 0.019 7.87 0.037 0.012 3.16 -0.038 0.008 -4.72Completed secondary education -0.187 0.025 -7.42 0.121 0.024 5.11 0.100 0.026 3.85 -0.030 0.010 -3.11Post secondary education -0.391 0.021 -18.30 0.036 0.027 1.35 0.324 0.050 6.46 0.008 0.013 0.62Gender of head: (cf: female unmarried) Female married 0.259 0.044 5.84 -0.154 0.023 -6.59 -0.008 0.002 -4.80 -0.079 0.010 -7.91Female divorced 0.187 0.051 3.70 -0.081 0.032 -2.50 -0.005 0.002 -2.18 -0.078 0.009 -8.46Female widowed 0.313 0.038 8.24 -0.182 0.020 -9.23 -0.009 0.001 -6.38 -0.102 0.007 -14.89Male 0.403 0.039 10.32 -0.294 0.035 -8.39 -0.021 0.007 -3.03 -0.135 0.023 -5.80Has relative in public sector -0.318 0.073 -4.38 -0.167 0.038 -4.42 0.394 0.060 6.56 0.066 0.035 1.91Community characteristics: Health facility -0.050 0.021 -2.42 0.054 0.014 3.75 0.004 0.002 1.97 0.009 0.009 0.98Feeder road 0.039 0.026 1.47 0.004 0.019 0.21 0.004 0.002 2.01 -0.014 0.012 -1.16Electricity -0.194 0.029 -6.77 0.090 0.018 4.93 0.001 0.002 0.64 0.050 0.011 4.51Telephone -0.110 0.029 -3.81 0.063 0.018 3.56 -0.001 0.002 -0.34 0.024 0.010 2.34Bank -0.130 0.022 -6.03 0.060 0.014 4.40 -0.001 0.002 -0.60 0.039 0.008 4.72Location: (cf: Central urban) Central rural 0.224 0.034 6.51 -0.104 0.022 -4.76 -0.006 0.002 -3.78 -0.058 0.010 -5.83Eastern rural 0.311 0.032 9.77 -0.124 0.022 -5.65 -0.006 0.002 -2.88 -0.093 0.009 -10.13Eastern urban -0.010 0.043 -0.23 0.028 0.027 1.04 0.002 0.002 0.95 -0.016 0.012 -1.30Northern rural 0.333 0.032 10.57 -0.172 0.020 -8.56 -0.001 0.003 -0.36 -0.099 0.008 -12.71Northern urban -0.075 0.066 -1.13 0.077 0.044 1.73 0.010 0.005 2.06 -0.021 0.015 -1.38Western rural 0.215 0.035 6.21 -0.086 0.023 -3.65 -0.003 0.002 -1.45 -0.058 0.010 -5.70Western urban 0.028 0.040 0.69 0.025 0.027 0.90 0.001 0.003 0.37 -0.003 0.012 -0.24Constant
Pseudo R-squared 0.262 Wald chi-squared (116) Log likelihood -17,372.47 Sample size 17,733
Note: i) Not working is set as the base category; ii) Standard errors and Z-values are robust to heteroscedasticity
73
Community characteristics: As for geographical location variables, the probabilities of working in non-agriculture or the private sector are lower in all regions as compared to Central urban. This result is as expected since there is much concentration of the private sector and non-agricultural activities in Central urban. However, marginal effects of working in agriculture are higher in all regions relative to that in Central urban. Similar geographical location patterns hold for all the survey years. The only exception is the Northern urban in 1999 and 2002; and Eastern urban in 1992. For the last two survey years, the chance of being employed in the public sector for individuals in Northern urban was positive and statistically significant. This result could be explained by the insurgency in the areas that might have led to recruitment of health workers etc to this region.
The local characteristics have an effect on employment choice as expected. The presence of banking facilities, which presumably loosens financial constraints, increases the likelihood to being self-employed in non-agricultural sector or private sector. All estimates are statistically significant across the years, with the exception of 1992 for choosing non-agricultural sector. Availability of banking facilities raised the chance by 4.4 percent in 1999 and by 6 percent in 2002 of being in self-employed in non-agriculture. The corresponding figures for private sector were 2, 5 and 4 percent in 1992, 1999 and 2002 respectively. The results confirm that the financial sector reforms partly attributed to the positive and increasing probabilities of entering the private sector or the non-agriculture sector. Although, presence of banking facilities seems to encourage entry more in non-agriculture than in the private sector. In contrast, bank presence reduces the chances of being self-employed in the agricultural sector. This may be accounted for by the fact that the banking sector is risk averse to lending to the agricultural sector because of the returns in the agricultural sector being subject to price and exogenous shocks (like drought, floods and pests). The high variability of agricultural incomes raises likelihood of loan default which in turn reduces the profitability of the banks. In addition, the gestation period for the returns from the agricultural sector is higher. For these reasons, the banks prefer to lend to non-agricultural sectors.
Turning to presence of electricity, the results indicate reduction of the likelihood of self-employment in agriculture choice. The results reveal that presence of electricity increases the likelihood of choosing the non-agriculture, private or public sector. Similarly, presence of telephone and health facilities increases the likelihood of working in all employment sectors relative to not working. The only exception is self employment in agriculture. Similar patterns are observed over the survey years. While presence of feeder roads significantly increased the likelihood of working in non-agriculture or private sector in 1992 and 1999; no effect were observed in 2002. To sum up, the status of community infrastructure influences employment sector choice. More so, the results demonstrate that infrastructural development is necessary for the successful implementation of economic reforms. These findings are of great policy relevance to the government’s anti-poverty interventions.
74
7. Wage determination
7.1 Model specification
The second major step to our understanding of the labour market in Uganda concerns the wage determination process in wage employment - private and public sectors. Other employment sectors were omitted as no information was collected on individual labour earnings. We examine the wage determination process in the two sectors while controlling for others factors and for the implied selectivity bias in the determination of wage employment status. Our comparison of these two groups is motivated by seemingly declining real wages in the private sector but increasing real wages in the public sector during the period of reforms. This kind of analysis provides insights on whether the public workers are over paid vis-à-vis their counterparts in paid private sector. While much attention has been given to such wage differentials in the developed world (see, for example Mueller, 1998; Dustmann & van Soest, 1998 and the references therein) and the transition economies (see, for example, Falaris, 2004; Jurajda, 2003; Stillman, 2000), scanty literature exists on developing countries in particular African countries. The researches on developing countries include Henrard (2003) on Colombia; Christofides & Pashardes (2002) on Cyprus; Wambugu (2002) on Kenya; and van der Gaag & Vijverberg (1988) on Cote d`Ivoire.
These studies have provided insights into the public-private sector wage determinants and differentials yet they have differed on the methodological approach. Mueller (1998), Dustmann & van Soest (1998) are some of the recent examples of studies in developed countries and Henrard (2003), Christofides & Pashardes (2002) are recent examples of studies in developing countries. First, while some researchers such as Stillman (2000) have controlled for the endogeneity of sectoral self selection, others such as Mueller (1998) typically included in the wage equation a dummy for whether an individual is employed in the public sector. Others studies such as Skoufias (2003) do not control for sample selection bias. In the former, wage equations are estimated with appropriate corrections for sample selection bias. In other words, these studies assume that state/choice of employment is not randomly assigned such that treating it as exogenous might lead to biased estimation of the wage equation. Besides, sample selectivity bias, the existing studies differ on the treatment of education in the wage equation. Some studies such as Dustmann & van Soest (1998) have demonstrated the bias introduced by assuming exogeneity of education in the wage equation. In spite of this, we assume education to be exogenous.
Here we follow the same approach as Christofides & Pashardes (2002) in their paper on Cyprus. They follow a simultaneous decision making framework that allows concurrent selection of sector and type of employment to generate sample selectivity variables that entered into the wage equation as detailed below. Here we narrow our analysis to only employed individuals, and to two industry of employment categories namely, self-employed and paid employment. The equations are as expressed in Eqs. (3) and (4). The subscript s indicates the sector (private/public); p refers to the type of employment (self employed/paid employed) and t refers to the survey year. The errors terms iptist vv & are normally distributed with mean zero and unity variances and might be correlated. The rest of the variables are as defined in section 6. (3) isttist ZD να += '*
75
(4) ipttipt ZD νγ += '*
As mentioned earlier, we sought to estimate the wage determination process in Uganda. We follow the human capital model of earnings determination developed by Becker (1964) and Mincer (1958, 1974). This model is as expressed in Eq. (5). (5) iststist XW υϕ += 'ln
where istWln is the natural logarithm of wage for the thi individual in the ths sector in the tht survey year. The error terms, istυ , are assumed to be normally distributed with mean
zero and constant variance. The probabilities of employment in equations (3) and (4) could be affected by unobserved characteristics that correlate with the individual wage. Thus, the error terms istiptist vv υ&, could be correlated and this might result into a bias in the estimation of the wage equation. However, Dustmann & van Soet (1998) caution that correcting for sample selection is only useful if appropriate instruments are identified. These instruments should play a role in the selection process but are not determinants in the wage model. In other words, the X vector of exogenous variables may overlap with the variables in Z vector, but not exactly the same for identification purposes. For the definitions of the model variables refer to discussions in section 6.
7.2 Estimation issues
Because the dependent variables in Eq. (3) and Eq. (4) are binary, a bivariate probit model was employed. We account for selection bias in Eq. (5) by employing a variant of Heckman (1979) two-step selection model22. Thus for the identification of the sector/type of employment choice equations we included community characteristics and marital status. For instance, marital status accounts for the importance of a secure job and its associated benefits in choosing a sector. In other words, the variables in Z and X vector need not to be the same to be able to identify equations (3)-(5). We therefore included several community level variables as instrumental variables in the Z vector. We hypothesize that such variables are significant predictors influencing employment choice. We statistically test the assumption of selectivity bias in Eq. (5). Regarding data, some wage employees did not declare their wages and for this matter were dropped from the wage determination models.
7.3 Results
The regressions were based only on individuals who were in wage employment. The sample corrected log wage results by sector are presented in Table 28 - Table 30. The R-squared for both sectors range from 0.370 to 0.472, which are within the ranges reported for cross-sectional data. The selection coefficients are significantly different from zero, revealing that the error terms of type of employment and sector are correlated with those of the wage equations except for 1999. Turning to the private sector estimates, we observe significant negative self selection of individuals into self employment in 2002. The unobserved factors, which encourage participation in the private sector, are associated with lower earnings. Generally speaking, the determinants of log wage are the same in both sectors, but differ in terms of magnitudes. This is not surprising, since the descriptive analysis (see Section 5) revealed differences in characteristics across the two sectors. 22 . These models are estimated in LIMDEP/NLOGIT software.
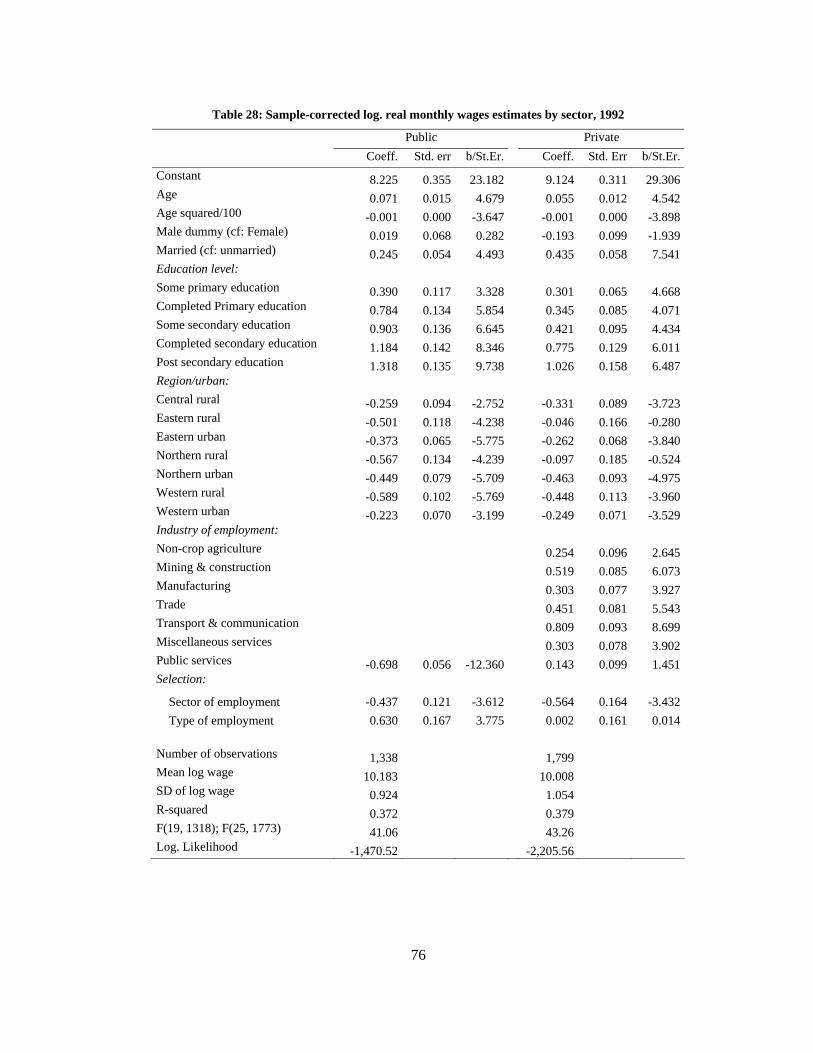
76
Table 28: Sample-corrected log. real monthly wages estimates by sector, 1992
Public Private Coeff. Std. err b/St.Er. Coeff. Std. Err b/St.Er.
Constant 8.225 0.355 23.182 9.124 0.311 29.306Age 0.071 0.015 4.679 0.055 0.012 4.542Age squared/100 -0.001 0.000 -3.647 -0.001 0.000 -3.898Male dummy (cf: Female) 0.019 0.068 0.282 -0.193 0.099 -1.939Married (cf: unmarried) 0.245 0.054 4.493 0.435 0.058 7.541Education level: Some primary education 0.390 0.117 3.328 0.301 0.065 4.668Completed Primary education 0.784 0.134 5.854 0.345 0.085 4.071Some secondary education 0.903 0.136 6.645 0.421 0.095 4.434Completed secondary education 1.184 0.142 8.346 0.775 0.129 6.011Post secondary education 1.318 0.135 9.738 1.026 0.158 6.487Region/urban: Central rural -0.259 0.094 -2.752 -0.331 0.089 -3.723Eastern rural -0.501 0.118 -4.238 -0.046 0.166 -0.280Eastern urban -0.373 0.065 -5.775 -0.262 0.068 -3.840Northern rural -0.567 0.134 -4.239 -0.097 0.185 -0.524Northern urban -0.449 0.079 -5.709 -0.463 0.093 -4.975Western rural -0.589 0.102 -5.769 -0.448 0.113 -3.960Western urban -0.223 0.070 -3.199 -0.249 0.071 -3.529Industry of employment: Non-crop agriculture 0.254 0.096 2.645Mining & construction 0.519 0.085 6.073Manufacturing 0.303 0.077 3.927Trade 0.451 0.081 5.543Transport & communication 0.809 0.093 8.699Miscellaneous services 0.303 0.078 3.902Public services -0.698 0.056 -12.360 0.143 0.099 1.451Selection:
Sector of employment -0.437 0.121 -3.612 -0.564 0.164 -3.432Type of employment 0.630 0.167 3.775 0.002 0.161 0.014
Number of observations 1,338 1,799 Mean log wage 10.183 10.008 SD of log wage 0.924 1.054 R-squared 0.372 0.379 F(19, 1318); F(25, 1773) 41.06 43.26 Log. Likelihood -1,470.52 -2,205.56
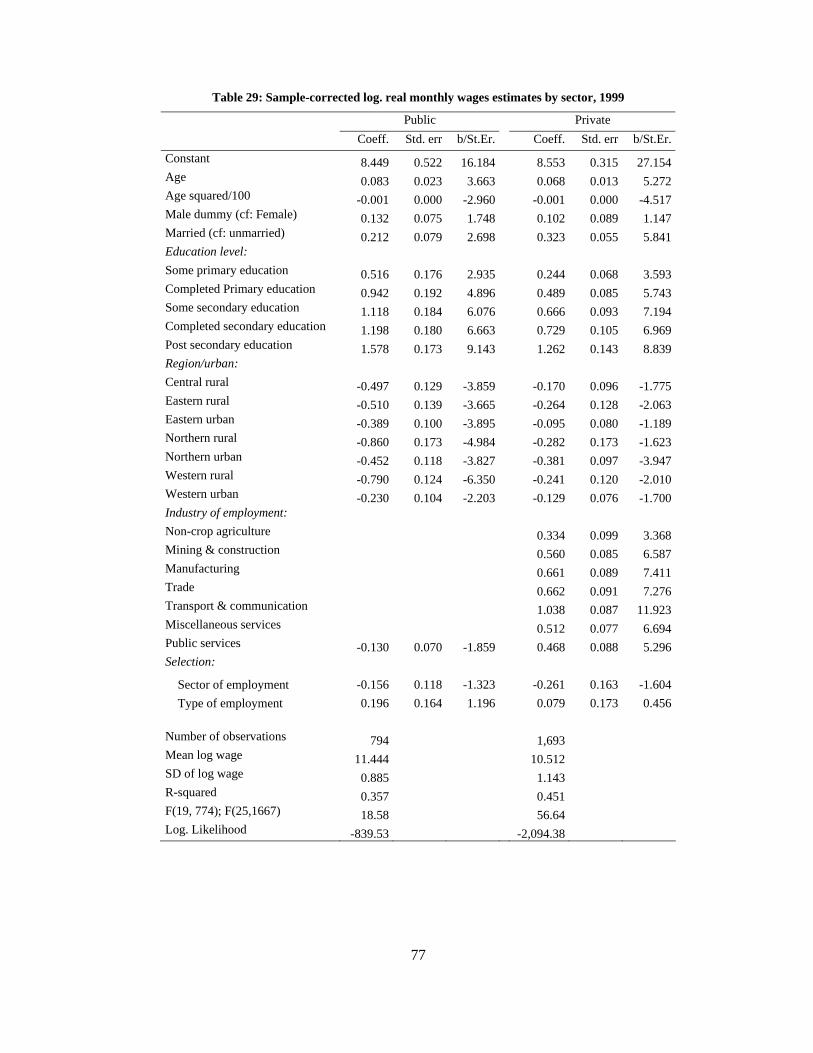
77
Table 29: Sample-corrected log. real monthly wages estimates by sector, 1999
Public Private Coeff. Std. err b/St.Er. Coeff. Std. err b/St.Er.
Constant 8.449 0.522 16.184 8.553 0.315 27.154Age 0.083 0.023 3.663 0.068 0.013 5.272Age squared/100 -0.001 0.000 -2.960 -0.001 0.000 -4.517Male dummy (cf: Female) 0.132 0.075 1.748 0.102 0.089 1.147Married (cf: unmarried) 0.212 0.079 2.698 0.323 0.055 5.841Education level: Some primary education 0.516 0.176 2.935 0.244 0.068 3.593Completed Primary education 0.942 0.192 4.896 0.489 0.085 5.743Some secondary education 1.118 0.184 6.076 0.666 0.093 7.194Completed secondary education 1.198 0.180 6.663 0.729 0.105 6.969Post secondary education 1.578 0.173 9.143 1.262 0.143 8.839Region/urban: Central rural -0.497 0.129 -3.859 -0.170 0.096 -1.775Eastern rural -0.510 0.139 -3.665 -0.264 0.128 -2.063Eastern urban -0.389 0.100 -3.895 -0.095 0.080 -1.189Northern rural -0.860 0.173 -4.984 -0.282 0.173 -1.623Northern urban -0.452 0.118 -3.827 -0.381 0.097 -3.947Western rural -0.790 0.124 -6.350 -0.241 0.120 -2.010Western urban -0.230 0.104 -2.203 -0.129 0.076 -1.700Industry of employment: Non-crop agriculture 0.334 0.099 3.368Mining & construction 0.560 0.085 6.587Manufacturing 0.661 0.089 7.411Trade 0.662 0.091 7.276Transport & communication 1.038 0.087 11.923Miscellaneous services 0.512 0.077 6.694Public services -0.130 0.070 -1.859 0.468 0.088 5.296Selection:
Sector of employment -0.156 0.118 -1.323 -0.261 0.163 -1.604Type of employment 0.196 0.164 1.196 0.079 0.173 0.456
Number of observations 794 1,693 Mean log wage 11.444 10.512 SD of log wage 0.885 1.143 R-squared 0.357 0.451 F(19, 774); F(25,1667) 18.58 56.64 Log. Likelihood -839.53 -2,094.38
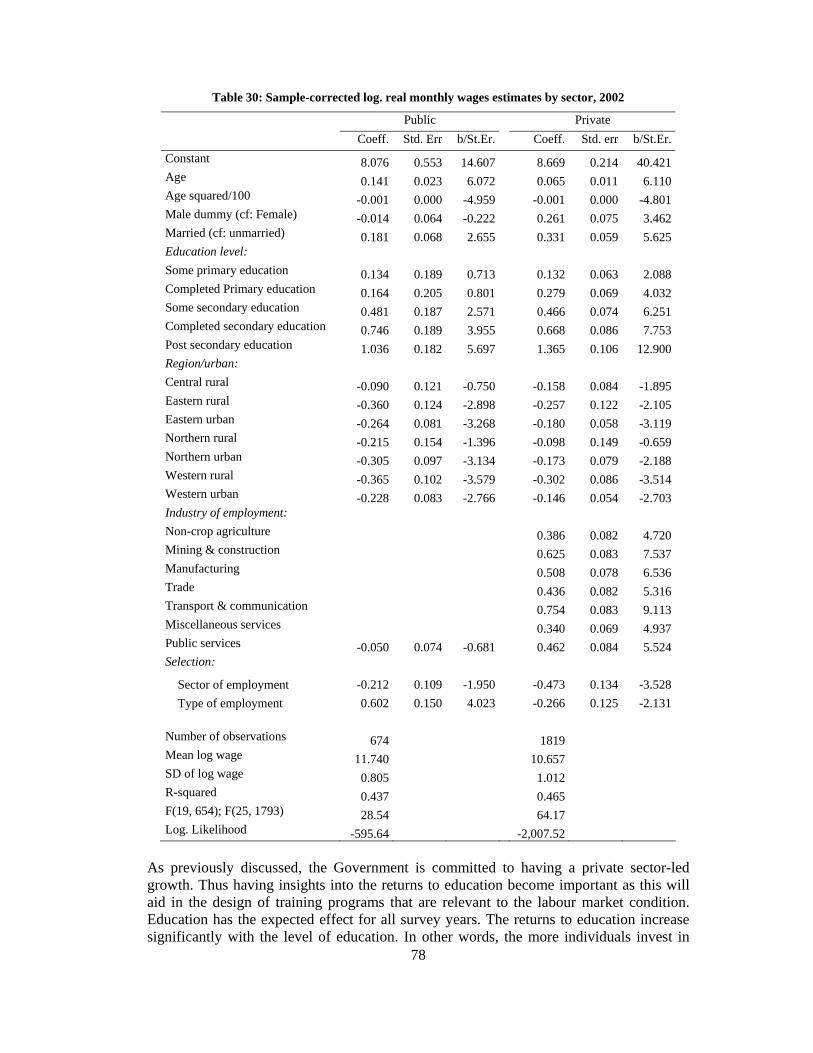
78
Table 30: Sample-corrected log. real monthly wages estimates by sector, 2002
Public Private Coeff. Std. Err b/St.Er. Coeff. Std. err b/St.Er.
Constant 8.076 0.553 14.607 8.669 0.214 40.421Age 0.141 0.023 6.072 0.065 0.011 6.110Age squared/100 -0.001 0.000 -4.959 -0.001 0.000 -4.801Male dummy (cf: Female) -0.014 0.064 -0.222 0.261 0.075 3.462Married (cf: unmarried) 0.181 0.068 2.655 0.331 0.059 5.625Education level: Some primary education 0.134 0.189 0.713 0.132 0.063 2.088Completed Primary education 0.164 0.205 0.801 0.279 0.069 4.032Some secondary education 0.481 0.187 2.571 0.466 0.074 6.251Completed secondary education 0.746 0.189 3.955 0.668 0.086 7.753Post secondary education 1.036 0.182 5.697 1.365 0.106 12.900Region/urban: Central rural -0.090 0.121 -0.750 -0.158 0.084 -1.895Eastern rural -0.360 0.124 -2.898 -0.257 0.122 -2.105Eastern urban -0.264 0.081 -3.268 -0.180 0.058 -3.119Northern rural -0.215 0.154 -1.396 -0.098 0.149 -0.659Northern urban -0.305 0.097 -3.134 -0.173 0.079 -2.188Western rural -0.365 0.102 -3.579 -0.302 0.086 -3.514Western urban -0.228 0.083 -2.766 -0.146 0.054 -2.703Industry of employment: Non-crop agriculture 0.386 0.082 4.720Mining & construction 0.625 0.083 7.537Manufacturing 0.508 0.078 6.536Trade 0.436 0.082 5.316Transport & communication 0.754 0.083 9.113Miscellaneous services 0.340 0.069 4.937Public services -0.050 0.074 -0.681 0.462 0.084 5.524Selection:
Sector of employment -0.212 0.109 -1.950 -0.473 0.134 -3.528Type of employment 0.602 0.150 4.023 -0.266 0.125 -2.131
Number of observations 674 1819 Mean log wage 11.740 10.657 SD of log wage 0.805 1.012 R-squared 0.437 0.465 F(19, 654); F(25, 1793) 28.54 64.17 Log. Likelihood -595.64 -2,007.52
As previously discussed, the Government is committed to having a private sector-led growth. Thus having insights into the returns to education become important as this will aid in the design of training programs that are relevant to the labour market condition. Education has the expected effect for all survey years. The returns to education increase significantly with the level of education. In other words, the more individuals invest in
79
their human capital, the more likely they are to realize higher returns in forms of higher wages. This finding is consistent across survey years. In the public sector, earnings of an individual with post secondary education rise by more than 100 percent relative that one with no formal education.
However, the returns in the public sector have followed a declining trend over the years. The reverse is observed for the private sector. The rate of return to higher education has been increasing in the private sector while those at lower levels have continued to decline. The UPE might have played a role in depressing the returns to education. It is worth noting that returns to post secondary education in the private sector were slightly higher than in the public sector in 2002. This finding is consistent with our descriptive analysis. This implies that with the growing private sector, the returns to higher education are expected to continue holding other things constant. This trend continued even in the period when poverty was on the rise. An ordinary level graduate, who are the majority in the public sector, receive earnings which are more than 70 percent higher than those with no education across all survey period. While significant returns of primary education in the public sector were observed in the earlier years of the reform, these returns were almost non-existent in 2002. This is partly attributed to the improvement of human capital over time.
A quadratic association is observed between age and wages. Age is a significant predictor of earnings in both the public and private sectors over the survey periods which may be accounted for by experience and seniority. However, wage earnings tend to decline at old age in both sectors. The earnings in the private sector reach a maximum at 44, 44, and 47 years in 1992, 1999 and 2002 respectively. For the public sector, wages peak around 50 years for all the survey years. These results agree with Teal (2000a) who noted that in Ghana wages are positively and significantly influenced by age and experience.
With regard to gender, the effect on wages is mixed across years. From the most recent survey, male employees in the private sector seem to earn a significantly higher positive premium compared to their female counterparts; while the reverse is observed in 1992. This finding suggests that female employees may be facing some degree of discrimination in the private sector. Turning to public sector, no gender wage differentials are observed after controlling for educational level and other factors. This is not surprising since wages in this sector are set irrespective of gender. The finding is consistent with that of Lassibille & Tan (2005), Terrell (1993) and van der Gaag & Vijverberg (1988).
The results reveal that married individuals earn significantly higher wages than their unmarried counterparts, a finding consistent with Wambugu’s (2003) in Kenya. In case of Uganda, this should not be interpreted as discrimination based on marital status. Married individuals earn a premium ranging from 18-24 percent in the public sector and 32-44 percent in the private sector, on average. In other words, the effect is more pronounced in the private sector. The results are positive and statistically significant for the years, but portray a declining effect in both sectors.
Overall results, provide support that earnings in both sectors do not depend on an individual’s educational attainment per se but also more likely to be related to the status of an individual’s industry of employment. Industry of employment captures additional differences in wages between private and public sectors. It captures differences in the working conditions. The returns to industry of employment differ significantly across the
80
sectors. For the private sector, the positive coefficients of the industry dummies imply that other industries pay significantly higher wages in comparison with crop agriculture. Lack of significance in the public sector over time is not surprising, as government’s involvement in most of the industry of employment ceased with the progress in the implementation of economic reforms. With regard to the private sector, individuals employed in the transport and communication sector, consistently received a higher wage over the survey years. More so, it is the industry of employment sectors with a smaller share in total paid employment that enjoyed higher wages. This could partly explain the observed increasing wage inequality. The results reveal that there are geographical location wage differentials in both sectors for all the survey years. As expected the wages are significantly higher in the Central urban.
Having estimated the log wage equations, in section 8 we use the results to examine the wage differentials in paid employment over the study period. This analysis was intended to provide insights into whether the observed differences in characteristics in both sectors have influenced the wage gap.
8. Wage decomposition
8.1 Methods
The third step in our analysis involved the decomposition of wage differentials between the public and private sector for each survey year. We employ the wage decomposition method of Blinder (1973), Oaxaca (1973), Idson & Feaster (1990) as expressed in Eq. (6). The subscripts g and p refer to the public and private sectors respectively; Wln and X vectors are mean values over the individuals in a given sector of employment. We use the separately estimated wage equations for the two sectors as presented in the previous section to decompose the observed wage gap into the following components namely, that related to the differences in endowments of wage determining attributes; the other related to differences in the estimated ‘returns’ to the above attributes excluding the constant; constant; and selection effects. The second and third components make up the unexplained component of the wage structure. It provides insights on whether a given sector enjoys a wage premium.
In Eq. (6) we adopt the public sector wage structure as the non-discriminatory norm. In other words, we assume the discriminatory wage difference to be ascribed to underpayment of the private sector rather than overpayment of the public sector. However, the literature on the empirical application of standard Oaxaca wage decomposition has shown the sensitivity of the share of the observed wage differences that can be attributed to the mean differences in endowments based on the choice of the non-discriminatory wage structure. A more general application to wage decomposition is found in Oaxaca & Ransom (1994). Here we employ the non-discriminatory wage structure as estimated from a pooled sample of the two sectors. And the coefficient component is further disaggregated into public sector advantage and private sector disadvantage as expressed in Eq. (7). For the purpose of wage decomposition employing Oaxaca and Ransom (1994), we estimate of wage equation for all the individuals in wage employment using univariate Probit and control for paid employment selectivity, cβ .

81
(6) 44344214444 34444 21
4444 34444 2143421
effectselection
ppgg
tscoefficien
pgpg
endowments
pgpg
tcons
pgpg
XX
XXWW
)ˆˆ()ˆˆ)((5.0
))(ˆˆ(5.0)ˆˆ(lnlntan
00
λθλθββ
ββββ
−++−
+−++−=−
(7) 443442144344214434421
44344214444 34444 21
effectselection
ppgg
gedisadvantatorprivate
pcp
advantagetorpublic
cgg
endowments
cpg
tcons
pccgpg
XX
XXWW
)ˆˆ()ˆˆ()ˆˆ(ˆ
ˆ)()()(lnln
secsec
tan
0000
λθλθββββ
βββββ
−+−+−
+−+−+−=−
8.2 Results
Table 31 presents the wage decomposition results for all the three survey years. As already discussed in the previous sections, the wage gap between the public and private sector exhibited a widening gap for the entire economic reform period. We discuss the results based on the standard wage decomposition prior to the Oaxaca & Ransom. In absolute terms, the portion due to observable characteristics became much larger with the implementation of the economic reforms. The contribution of endowments has been increasing as increases were also reported in wage differentials. Nearly 89.6 percent of the observed wage gap of 0.175 was due to superior endowments of the public sector employees in 1992. The percentages declined to 61.4 (of 0.933) in 1999 before rising again to 78.8 (of 1.083) in 2002. Much of this difference is explained by the fact that public sector employees, on average, are better educated individuals. The results show that differences in the endowment of employees are more important in accounting for wage differentials than are differences in the coefficients.
Table 31: Wage decomposition with selection
Contribution (%)
1992
1999
2002 1992 1999 2002
Oaxaca (1973) Wage differential 0.175 0.933 1.083 Constant -0.900 -0.103 -0.592 -514.1 -11.1 -54.7 Endowments 0.157 0.572 0.854 89.6 61.4 78.8 Coefficients 0.147 -0.015 0.742 84.1 -1.6 68.5 Selection 0.770 0.478 0.079 440.3 51.3 7.3 Oaxaca-Ransom (1994) Wage differential 0.175 0.933 1.083 Constant -0.900 -0.103 -0.592 -514.1 -11.1 -54.7 Endowments 0.020 0.610 0.818 11.3 65.4 75.5 Public advantage 0.150 -0.175 0.840 85.7 -18.8 77.6 Private disadvantage 0.134 0.123 -0.062 76.7 13.2 -5.8 Selection 0.770 0.478 0.079 440.3 51.3 7.3
Turning to the wage decomposition based on Oaxaca & Ransom interesting results do emerge. The sensitivity of the endowments component to the wage decomposition

82
method used is obvious from our results in Table 31. The results indicate only 11.3 percent of the observed gap in 1992 can be explained by super endowments in the public sector compared to nearly 90 percent based on the standard Oaxaca wage decomposition. However, the differences attributed to individual endowments in the two methods narrows for 1999 and 2002. Almost 86 percent of the gap is attributed to observed characteristics in the public sector in 1992, which falls slightly by 9 percentage points in 2002. The public sector advantage was 0.840 while the private sector disadvantage relative to the non-discriminatory wage structure as -0.062 in 2002.
The selection effect is positive, though it exhibited a declining trend over the entire period. That is due to unobservable characteristics of those persons who chose the public sector, the observed differences between the wages in the two sectors is larger than would be the case in the whole population.
Table 32 presents the relative contribution of the characteristics to the wage differential. Differences in the educational attainment of employees play a more important role than differences in the returns to education, a finding that contrasts that of Lassibille & Tan (2005) in Rwanda. The results suggest that education is the most important aspect of an employee’s profile in accounting for wage differences between the private and public sectors. The contribution due to educational attainment exhibited an upward trend over the entire reform period. Yet, the contribution due to returns to education recorded a negative effect in 2002. These results suggest that differences in educational attainment over the reform period have played a very important role in widening the public/private sector wage gap.
Turning to geographical location and economic sector, the results suggest that these variables contributed to the narrowing of wage gaps over the entire study period. In absolute terms, differences in the mean endowments of these variables make a larger contribution to the total impact than are differences in their impact on wages. The contribution of gender arises mainly from its impact on earnings than differences in the gender composition of the employees in each sector. The gender shares in paid employment as already noted narrowed over the entire period. Differences in the marital status composition of the employees in each sector are offset by differential returns to marital status between the two sectors. Age behaves in a similar manner as education, although education remains the most important factor.
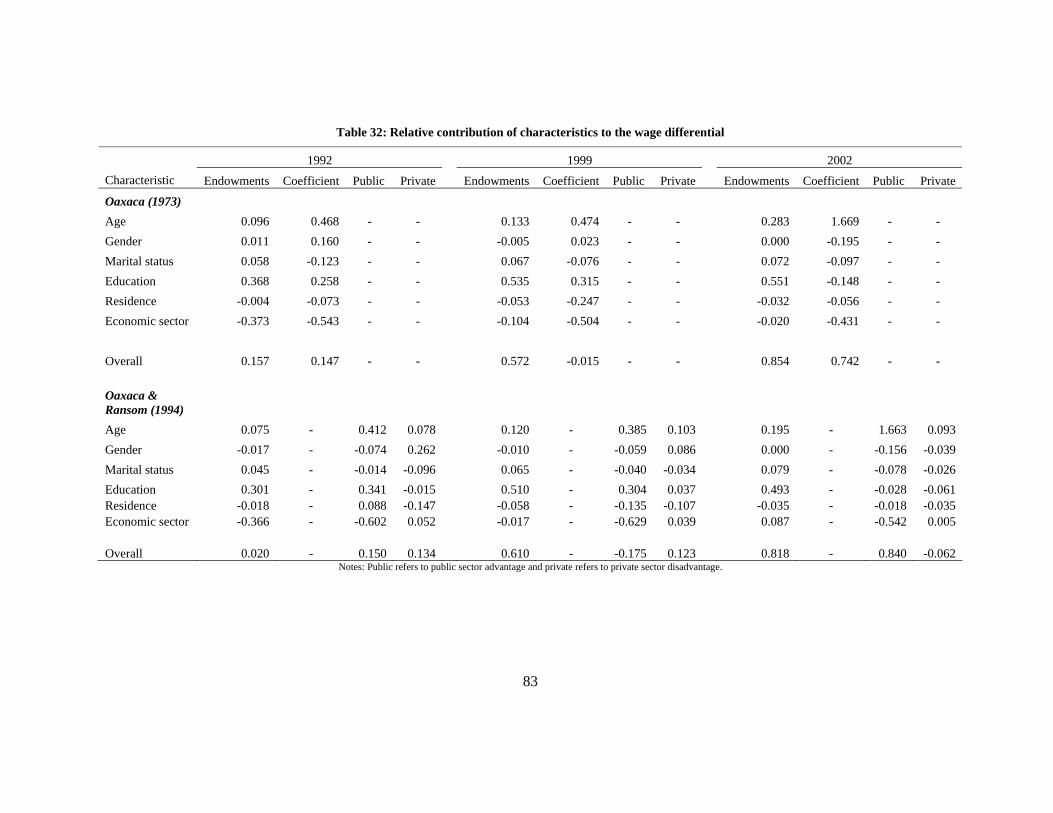
83
Table 32: Relative contribution of characteristics to the wage differential
1992 1999 2002 Characteristic Endowments Coefficient Public Private Endowments Coefficient Public Private Endowments Coefficient Public Private
Oaxaca (1973) Age 0.096 0.468 - - 0.133 0.474 - - 0.283 1.669 - - Gender 0.011 0.160 - - -0.005 0.023 - - 0.000 -0.195 - - Marital status 0.058 -0.123 - - 0.067 -0.076 - - 0.072 -0.097 - - Education 0.368 0.258 - - 0.535 0.315 - - 0.551 -0.148 - - Residence -0.004 -0.073 - - -0.053 -0.247 - - -0.032 -0.056 - - Economic sector -0.373 -0.543 - - -0.104 -0.504 - - -0.020 -0.431 - - Overall 0.157 0.147 - - 0.572 -0.015 - - 0.854 0.742 - - Oaxaca & Ransom (1994) Age 0.075 - 0.412 0.078 0.120 - 0.385 0.103 0.195 - 1.663 0.093 Gender -0.017 - -0.074 0.262 -0.010 - -0.059 0.086 0.000 - -0.156 -0.039 Marital status 0.045 - -0.014 -0.096 0.065 - -0.040 -0.034 0.079 - -0.078 -0.026 Education 0.301 - 0.341 -0.015 0.510 - 0.304 0.037 0.493 - -0.028 -0.061 Residence -0.018 - 0.088 -0.147 -0.058 - -0.135 -0.107 -0.035 - -0.018 -0.035 Economic sector -0.366 - -0.602 0.052 -0.017 - -0.629 0.039 0.087 - -0.542 0.005 Overall 0.020 - 0.150 0.134 0.610 - -0.175 0.123 0.818 - 0.840 -0.062
Notes: Public refers to public sector advantage and private refers to private sector disadvantage.
84
9. Summary and conclusion
Using data from three nationally representative household surveys of 1992, 1999 and 2002, the study sought to investigate the effect of economic reforms on the labour market outcomes and in turn poverty outcomes in Uganda with specific reference to the factors that influence the choice of employment sector, and wage earnings and wage differentials between private and public sectors. The period 1992-2002 was further divided into two sub-periods: 1992-1999, a period of impressive income poverty reduction and strong economic growth; and 1999-2002 a period marked by a rise in poverty and a slow down in economic growth. The analysis was restricted to the economically active population aged 15-64 years. Our main conclusions in respect of the effects of economic reforms on labour market outcomes and in turn on poverty outcomes are:
9.1 Employment
The micro data show that employment growth rate remained well below that of the labour supply. Over a 10-year period, the former grew at 3.1 percent and the later grew at 3.4 percent per annum. The reform period witnessed job losses and creation, though the former was lower than the latter. About 1.5 million jobs were created between 1992 and 1999 compared to 0.6 million jobs for the period 1999-2002. Public utilities suffered job losses due to the government’s privatisation of its telecommunication and energy sectors. While the manufacturing sector suffered job losses during 1992-1999, it was a main source of job growth between 1999 and 2002. This presents a challenge to the government of creating an environment that will lead to creation of jobs that match the growth in the labour supply on a sustainable basis.
A majority of the employed population in Uganda is own account workers, suggesting limited job creation in the “formal” sector. Notably, the proportion of employers in total employment has remained below 1 percent through the reform period. But there was a marked gender dimension in this category of workers. While there was a sharp decline for male employers between 1992 and 1999, there was a consistent increasing trend in the number of female employers. The latter grew by 26 percent over a 10-year period, mainly due to the emergence of MFIs. These MFIs eased up the credit constraints faced by females.
On the other hand, the share of wage employment in total employment has not changed as much as one would have expected under economic reforms. By 2002, it stood at 15 percent of which 76.8 percent were employed in the private sector. During 1992-2002, the public sector employment declined nearly by 1.6 percent annually. But this aggregate figure masks policy relevant information. While public sector employment declined by 4 percent during the period of poverty reduction, it rose by 4.8 percent between 1999 and 2002. The civil service reforms and voluntary retirement, privatization of the government parastatals/enterprises partly explain the decline in the first sub-period. Yet, the Government’s failure to sustain zero growth in public employment explains the increase in the last sub-period. More notably, the decentralization process, emergence of new authorities (such as Uganda Investment Authority, Uganda Cotton Authority, etc.), creation of new districts from the existing ones, recruitment of teachers for UPE program and recruitment of health workers might account for the observed increases in public employees. Besides the recruitment of teachers and health workers, the other avenues have been used as employment generation vehicles. The private sector had a positive
85
employment growth rate of about 4.3 percent annually between 1992 and 2002; with a higher growth registered at a time when poverty was rising. The incentive structure provided to the private sector by the government under the reforms partly explains this finding.
The structural labour shifts did take place during the reforms period. There has been a remarkable shift in the sectoral composition of employment away from agriculture (low productive activities) to services (non-tradables) and industry sectors. The shift in the employment structure across sectors is consistent with the structural transformation in the economy. The growth in GDP created jobs outside the agricultural sector, which is consistent with the overall objectives of the reforms. Yet, growth in GDP is concentrated in sectors that employ a small proportion of the workforce. While economic policy reforms (such as liberalization of the foreign exchange rate and the agricultural product marketing) were aimed at enhancing the agricultural sector through increased producer prices, the fall in the employment share of agriculture might reflect the existence of other structural bottlenecks. Other shifts worth noting are the increased share of private sector in total wage employment; increase in self-employment but driven largely by non-agricultural activities and increased participation of females in the labour market.
The micro data further show that there has been a steady integration of females into the labour market. The indicators of this process are their (i) increased participation in the labour market. This was largely driven by their increased access to credit facilities, increased access to education etc; (ii) increased presence in self employment in non-agricultural activities; and (iii) increased share in professional occupations. All in all, the findings suggest that there has been a narrowing gender gap in the level of participation in the labour market.
The lack of comparable survey data on unemployment in Uganda did not allow the analysis of unemployment trends. Instead, using the 2002 survey data the unemployment rate was estimated at 2.8 percent for persons aged 15-64 years. Unemployment was more concentrated among females, youth, more educated and among urban residents. Unemployment was also found to be lower for individuals from poor households (of 1.9 percent) than their counterparts from non-poor households (4.5 percent). Individuals from non-poor households might prefer to remain unemployed since they can still get support.
The improved education attainment of the labour force is as a consequence of the education policies and reforms. More importantly, the results have revealed that education has a very clear influence on the allocation of individuals across employment states but its effects depend on the level of educational attainment. The higher the education level the higher is an individual’s likelihood of being employed in the public or self-employment in non-agricultural activities relative to being not working. Notably, the effects of post secondary education are higher for the public sector, though depicted a declining trend through the reform period. Again retrenchment of public employees partly explains this finding. Over time, it has become increasing difficult for individuals with lower education to enter the “formal” private sector. In addition, more education has encouraged entry in the non-agricultural sector (self-employment). For instance, entry of primary education graduates increased from 5.3 percent in 1992 to 11.8 percent in 2002. On the other hand, additional education significantly reduces the chances of being self employed in agriculture. Thus, investment in human capital development is a key to moving the masses from agriculture to other sectors.
86
Besides education, local community characteristics have an effect on employment sector choice. The presence of banking facilities increases the likelihood to being self employed in non-agricultural sector or private sector, but reduces the chances of being self employed in agriculture. The financial sector reforms partly attributed to the positive and increasing probabilities of entering non-agricultural sector or private sector. Similarly, presence of electricity, telephone and health facilities increased the likelihood of being employed in non-agricultural or private sector over time. While the presence of feeder roads was significant in these two sectors, it became insignificant during 1999-2002. All this suggest that infrastructural development is necessary for the successful implementation of economic reforms.
9.2 Wages
The structural changes in the composition of employment were followed by structural changes in the real wages, both at the mean and median. There was a marked decline in the private sector at a time when poverty was rising. The fall in the real wages in the private sector – a sector that contributes over 70 percent of the wage employment - was followed by structural changes in the allocation of labour. The restructuring of the public service led to increased real wages. But the reforms seem to have led to a widening gap in the wages between the private and public sectors. The real wages tend to be lower in the private sector than in the public sector, mainly because the public sector employs workers with higher educational attainment. But also the deregulation of the labour market partly explains the lower wages in the private sector.
Consistent with income inequality, inequalities in wages have continued to rise. Nationally, overall wage inequality has remained fairly constant, but increased in urban areas and among female wage employees. Wage inequalities have not only remained constant among public sector employees but are lower than in the private sector. Males’ wages grew faster than that of females, mainly because of their higher human capital accumulation. But females experienced an increase in inequalities in wage between 1999 and 2002. Wage inequality is driven mostly by the within-social groupings inequality relative to between-social grouping inequality. Nonetheless, a widening gap was observed between economic sectors, private/public sector and educational attainment. Notably, the wage gap between regions and rural/urban dichotomy depicted a declining trend. While the male’s wages grew faster than that of females, there was a marked gender wage gap. Contrary to the expectations of reforms, demand for more skilled labour employees in wage employment did rise, leading to widening of the wage gap between education levels.
The returns to education both in the private and public sector changed, suggesting that the labour market was somewhat responsive to the reforms. More notably the returns to skills turned out to be relatively high in Uganda compared to other sub-Saharan African countries. Since 1992 onwards there was a significant and substantial rise in the returns to education especially at higher levels, but marked a decline after 1999. The only exception was post secondary education. The boost to returns to post secondary education was not accompanied by any slowdown in the share of post secondary graduates in the workforce.
From a policy perspective, one may conclude that the economic reforms have had mixed impact on the labour market outcomes and in turn poverty. Despite the shift in the
87
sectoral employment composition especially away from agriculture to other sectors, it did little to prevent poverty from rising after almost a decade of declining trends. When the economy experienced the strong economic growth, with increased opportunities for new employment and increases in the real wages, the number of persons living in poverty reduced. However, the opportunities for new employment further increased with a slight decline in GDP growth preceded by lower real wages especially in the private sector, the number of poor people increased. These findings emphasize the impact the operations of the labour market can have on poverty reduction.
9.3 Emerging issues
i) Labour employment is the main source of income to Ugandans. The other sources such as transfers play an insignificant role. Thus strengthening the understanding of the changes in labour employment becomes important in the government’s poverty reduction efforts;
ii) Private sector-led growth: While employment opportunities in the private sector have continued to grow, the real wages fell in the last years when the number of persons living in poverty rose. This presents a challenge, given the higher contribution of this sector in wage employment. There is need for government to provide further incentives to the private sector to create more employment opportunities with better pays;
iii) Increasing public sector employment with rising real wages has serious implications for the government’s budget. The government’s public administration is already considered to be high and there are concerns within the donor community over this. Yet, the government has not shown commitment to address this issue As much as recruitment of teachers and health workers is understandable; the increasing recruitment under the decentralization process, emergence of new authorities and creation of new districts as vehicles of public employment generation is worrisome. While employment at the centre had already contracted between 1992 and 1999 due to restructuring of the public employment, this was partly offset by the increase in employment at the district level;
iv) Education has a very clear influence on the allocation of individuals across employment choices and has a strong effect on the wage structure. Notably, the demand for better educated Ugandans has risen in the private sector. And the returns to education for those employees with post secondary education increased throughout the reform period. Therefore,
(a) Investment in human capital development is a key to moving the masses from agriculture to other sectors;
(b) There is a need for more public and private investment in education as the results have revealed that human capital development through education enhances the attainment of higher wages; and
(c) There is need to ensure that the education system graduates individuals with skills relevant to the private sector.
88
v) Infrastructural development: Access to banking facilities, electricity, health facilities and feeder roads depicted positive and significant effects on the employment choice and wages. More importantly, the marginal effects portrayed increasing trends during the reform period. Thus suggesting that infrastructural development is necessary for the successful implementation of economic reforms;
vi) Increasing self employment especially in the non-agricultural activities. This was driven mainly by improvement in the human capital development in terms of education; and increased access to credit facilities and road infrastructure;
vii) There is a steady integration of females into the labour market but most of them remain employed in relatively low paying jobs.
viii) Geographical dimension in the employment growth. There is more concentration of private sector employment in the Central region relative to the other regions. This is not surprising given the level of infrastructural development in this part of the country;
ix) Uganda’s population growth is very high and this has implications for the labour supply in a country characterized by low job creation. This calls for measures aimed at controlling the rapid population growth rate; and
x) The low level of unemployment in Uganda has to be interpreted with caution. It is misleading. We need to go beyond the conventional measure of unemployment to looking into the quality of employment if we are to critically gauge how the economy is generating employment.
89
References
Alwang, J., P.B. Siegel, and S.L. Jorgensen (1996), “Seeking guidelines for poverty reduction in rural Zambia”, World Development, 24(11): 1711 – 1723.
Appleton, S. (2001), “Poverty reduction during growth: the case of Uganda, 1992-2000”, University of Nottingham, Mimeo
__________ (2001), “Education, Incomes and Poverty in Uganda in the 1990s”, Centre for Research in Economic Development and International Trade; School of Economics, University of Nottingham: Credit Research Paper No. 01/22.
Appleton, S., A. Bigsten and D.K. Manda (1999), “Educational expansion and economic decline: returns to education in Kenya, 1978 – 1995” Centre for the Study of African Economies, Working Paper No. WPS/99-6.
Appleton, S. and S. Ssewanyana (2003), “Poverty analysis in Uganda,” 2002/03, Economic Policy Research Centre, Mimeo.
Atkin J.S, C.C. Griffin, D.K. Guilbery, and B.M. Popkin (1987), “The Demand for Primary Health Service in The Third World ”
Ayoki, M; M. Obwona and M.Ogwapus (2005), “Tax Reforms and Domestic Revenue Mobilization in Uganda” A research Report presented to Global Development Network (GDN), Washington D.C.
Barret C. B, M. Bezuneh and A. Aboud (2001), “Income diversification, poverty traps and policy shocks in Cote d’Ivoire and Kenya” Food Policy, 26: 367-384
Bahiigwa, G., D. Rigby and P. Woodhouse (2005), “Right target, wrong mechanism?: Agricultural modernization and poverty reduction in Uganda”, World Development, 33(3): 481-496.
Bategeka, L., M. Ayoki and A. Mukungu (2004), “Financing Primary Education For All: Public Expenditure and Primary Education Outcomes in Uganda”, Institute of Development Studies, University of Sussex.
Bevan, G. P, Collier and J.W. Gunning (1990): Controlled Open Economies; a Neoclassical Approach to Structuralism, Oxford, Clarendon Press.
Bigsten, A. and S.Kayizzi-Mugerwa (1999), Crisis, Adjustment and Growth in Uganda, Macmillan Press Ltd, London.
Blinder, A. (1973), “Wage discrimination – reduced form and structural estimate”, Journal of Human Resources, 8: 436-455.
Canagarajah, S. and S. Thomas (1997), “Ghana’s Labour Market: 1987 – 92” World Bank Polic y Research Paper, No. 1752, World Bank, Washington, DC.
Christofides, L. N. and P. Pashardes (2002), “Self/paid employment, public/private sector selection and wage differentials”, Labour Economics, 9: 737-762.
Corkery, J. (2000), “Public Sector Reforms and their Impact on Health Sector Employment in Uganda”, International Labour Organization, Mimeo.
Daniels, L. (1999), “The role of small enterprise in the household and national economy in Kenya: a significant contribution or a last resort”, World Development, 27(1): 55-65.
Deininger, K. (2003), “Does cost of schooling affect enrolment by the poor? Universal Primary Education in Uganda”, Economics of Education Review, 22: 291-305.

90
Deininger, K. and J. Okidi (2003), “Growth and Poverty reduction in Uganda”, Development Policy Review, 21(4):481-509.
Dercon, S., T.G. Selassie and P. Krishnan (2005), “The urban labour market during structural adjustment in Ethiopia 1990 – 1997” in Bigsten, A., A. Shimeles and B. Kebede (eds) Poverty, Income Distribution and Labour Markets in Ethiopia: 133 – 165.
Dustamann, C. and A. van Soest (1998), “Public and private sector wages of male workers in Germany”, European Economic Review, 42: 1417-1441.
Earle, J. S. and Z. Sakova (2000). “Business start-ups or disguised unemployment? Evidence on the character of self-employment from transition economies”, Labour Economics, 7: 575-601.
Falaris, E. M. (2004), “Private and public sector wages in Bulgaria.” Journal of Comparative Economics, 32: 56-72.
Fallon, P.R. and L.A. Riveros (1989), “Adjustment and the Labour Market” World Bank Policy Research Paper, No. 214, World Bank, Washington, DC.
Francis, P and R. James, (2003), “Balancing rural poverty reduction and citizen participation: The contradictions of Uganda’s Decentralization Program” World Development, 31(2): 325-337.
Glewwe, P. and D. de Tray (1990), “The poor during adjustment: A Case study of the Cote D’Ivoire”, in P. Pinstrup-Andersen (Ed.) Macroeconomic Policy Reforms, Poverty and Nutrition: Analytical Methodologies, Ithaca: Cornell University.
Hollister, R. and M. Goldstein (1994), “Reforming Labour Markets in the Near East: Implications for Structural Adjustment and Market Economies, Sector Study”, No.8, ICEC.
Horton, S., R. Kanbar and D. Muzumdar (eds) (1994), Labour Markets in an era of Adjustment, Vols. 1 and 2, World Bank EDI Development Studies, World Bank, Washington, DC.
Hussain, I. And Faruqee (Eds) (1994), Adjustment in Africa: Lessons from Country Case Studies, Washington, D.C: The World Bank
Idson, T and J. Feaster (1990), “A selectivity model of employer-size wage differentials”, Journal of Labour Economics, 8: 99-122.
International Labour Organization (1998), Economic Reforms and the Labour Market, New Dehli: ILO Geneva.
Jurajda, S. (2003), “Gender wage gap and segregation in enterprises and the public sector in late transition economies”, Journal of Comparative Economics, 31: 199-222.
Kabananukye K.I.B, A.E.K Kabananukye, J.K. Krishnamurty and D. Owomugasho (2004), Economic Growth, Employment, Poverty and Pro-Poor Policies in Uganda, Issues in Employment and Poverty Discussion Paper No. 15, Geneva ILO.
Kappel, R., J. Lay, and S. Steiner (2005), “Uganda: No more pro-poor growth?”, Development Policy Review, 23(1): 27-53.
Katimbo-Mugwanya, E. (1999), “Policies of regulating and supervising microfinance- the case of Uganda”, Journal of the Uganda Institute of Bankers, 7(4): 20 - 23.
Keefer, P. (2000), “Growth and Poverty Reduction in Uganda: The Role of Institutional Reform”, mimeo, Development Economic Research Group, Washington, D.C.
91
Kikeri, S (1998), “Privatization and Labour: What Happens to Workers when Governments Divest?” World Bank Technical Paper, No. 396, World Bank, Washington, DC.
Lanot, C. and C. Muller (1997), “Dualistic Sector Choice and Female Labour Supply: Evidence from Formal and Informal Sectors in Cameroon” Centre for the Study of African Economies, Working Paper No. WPS/97-9
Lassibille, G. and J.P. Tan (2005), “The returns to education in Rwanda”, Journal of African Economies, 14(1): 92-116.
Lassibille, G. (1998), “Wage gaps between the public and private sectors in Spain.” Economics of Education Review, 17(1): 83-92.
Lawson, D., A. Mckay, and Okidi, J. (2003), “Poverty Persistence and Transitions in Uganda” Chronic Poverty Research Centre Working Paper No. 39.
Ledgerwood, J., D. Burand and G. Braun (2002), “The Ugandan Microfinance Industry: Prospects for Regulation of MFIs”, Journal of the Uganda Institute of Bankers, 10(4): 21 - 25.
Lindauer, D.L., O.A. Meesook and P. Subsaeng (1988), “Government Wage Policy in Africa: Some Findings and Policy Issues, World Bank Research Observer, 3(1): 1-25.
Lopez, R. and L Riveros (1989), Macroeconomic Adjustment and the Labour Market in four Latin American Countries, Policy Research Working Paper Series No. 335, Washington DC, World Bank.
Lopez, R. and L. Riveros (1988), “Wage Responsiveness and Labour Market Disequilibrium” PPR Working Paper No. 85, Washington, D.C. World Bank.
Mackinnon, R. (1973), Money and Capital in Economic Development, Washington DC: Brooking Institutions.
Makhoka (2001), Uganda Country Report on Structural Adjustment Participatory Review Initiative (SAPRI): A Synthesis of the Four SAPRI Studies, Mimeo.
Matshe, I and T. Young (2004), “Off-farm labour allocation decisions in small-scale rural households in Zimbabwe”, Agricultural economics, 30: 175-186.
Marquette, C.M. (1997), “Current poverty, structural adjustment, and drought in Zimbabwe”, World Development, 25(7): 1141-1147.
Mazumdar, D. (1993), “Labour markets and adjustment in open Asian Economies: The Republic of Korea and Malaysia”, The World Bank Economic Review, 7(3): 349 – 380.
Mazumdar, D. (1989), “Macroeconomic Issues of Labour Markets in Developing Countries: Analysis and Policy Implications” Economic Development Institute Seminar Paper No. 40, World Bank, Washington, DC.
MoFPED (2005), PEAP MoFPED (Several issues), Background to the Budget. MoFPED (2001), Uganda Poverty Status Report, Kampala Mueller, R. E. (1998). “Public-private sector wage differentials in Canada: evidence from
quantile regressions”, Economic Letters 60: 229-235. Muwanga, S.L. (2000), "Is Liberalization of the Banking Sector in Uganda a reform effort
that has gone a stray?", The Journal of the Uganda Institute of Bankers, 8(1):8-14. Nannyonjo, J. (2002), “Financial Sector Reforms in Uganda (1990-2000): Interest Rate
92
Spreads, Market Structure, Bank Performance and Monetary Policy”, Göteborg University, Department of Economics, Economic Studies No.110.
Oaxaca, R. (1973), “Male-Female wage differentials in urban labour markets”, International Economic Review, 14: 693-709.
Oaxaca, R. and M.R. Ransom (1994), “On discrimination and the decomposition of wage differentials”, Journal of Econometrics, 61: 5-21.
Okerele, W.O. (1999), “Economic Reforms and Labour Market response: Evidence from Nigeria”, A paper presented in AERC workshop, Nairobi, December.
Okidi J. A. and A. McKay (2003), “Poverty Dynamics in Uganda 1992 to 2000”, Chronic Poverty Research Centre, Working paper No. 27.
Okidi, A., S. Ssewanyana, L. Bategeka and F. Muhumuza (2005). Operationalizing pro-poor growth: Uganda Case Study, DfiD.
Pagán, J. A; J. V. Gil and J. A. T. Guarjardo (2002), “Employment shifts, economic reform and changes in public/private sector wages in Mexico: 1987 - 1997”, Empirical Economics, 27: 447- 460.
Pierre, G and S. Scarpetta (2004), “How labour market policies can combine workers’ protection with job creation: A partial review of some key issues and policy options”, Background paper for WDR 2005 “A Better Investment Climate – for everyone”.
Reinhart, M. C and I. Tokatlidis (2003), “Financial liberalization: The African experience”, Journal of African Economies, 12(2): 53-88.
Riveros, L. (1994), “Chiles’s Case Study” in Horton, Kanbur and Muzumdar (eds.) Labour Markets in An Era of Adjustment, Vol. I, Issue Papers EDI, Washington, D.C., World Bank.
Riveros, L.A. and C.E. Sanchez (1990), “Argentina’s labour markets in an era of adjustment” World Bank Policy Research Paper, No. 386, World Bank, Washington, DC.
Ruhweza, A (2003), “Investor Rights vis-a-vis State Right to Regulate- The case of Uganda” A paper presented at the International conference: Moving forward from Cancun. The global Governance and Sustainable Development 30-31 October, Berlin, German.
Schultz, T.P. (1990), “Testing the neoclassical model of family labour supply and fertility”, Journal of Human Resources, 25: 599-634.
Sharer, R.L., H.R. De Zoysa and C.A. McDonald (1995), “Uganda: Adjustment with Growth 1987 -94”, International Monetary Fund, Occassional Paper, No. 121.
Skoufias, E. (2003), “The structure of wages during the economic transition in Romania.” Economic Systems, 27: 345-366.
Ssewanyana, N.S. and S. Appleton (2006), Impact of trade on employment and labour conditions in Uganda, Phase I, mimeo, EPRC.
Ssewanyana, N.S, J.A. Okidi, D. Angemi and V. Barungi (2004), “Understanding the determinants of income inequality in Uganda”, The Centre for the Study of African Economies, Working Paper No. 229.
Stillman, S. (2000). The determinants of private and government sector earnings in Russia, RAND Labour and Population Working Paper No. 00-17.
Tansel, A. (2005), “Public-private employment choice, wage differentials and gender in Turkey”, Economic Development and Cultural Change, 53: 453-477.
93
Tashobya, K.C., and P.O. Ogwal (2004), “Primary Health Care and Health Sector Reforms in Uganda”, Health Policy and Development, 2(1).
Teal, F. (2000a), “Private Sector Wages and Poverty in Ghana: 1988 – 1998”, Centre for Study of African Economies Working Paper No. WPS/2000-6.
Teal, F. (2000b), “Real wages and the demand for skilled and unskilled male labour in Ghana’s manufacturing sector: 1991 – 1995”, Journal of Development Economics, 61:447 – 461.
Terrell, K. (1993), “Public-private wage differentials in Haiti: Do public servants earn a rent?”, Journal of Development Economics, 42(2): 293-314.
Toye, J. (1999), Structural Adjustment and Employment Policy: Issues and Experience, Geneva, ILO.
Tumusiime-Mutebile, E. (2001), “The Current State of Uganda’s Financial Sector – Achievements and Challenges” Journal of the Ugandan Institute of Bankers, Vol. 9 No. 2 pp 5 – 7.
Tumusiime-Mutebile, E. (2002), “Challenges and Success in the Management of
Monetary Policy in Uganda” Journal of the Ugandan Institute of Bankers, Vol. 10 No. 1 pp 5 - 8.
UNDP (2000) van der Gaag, J. and W. Vijverberg (1988), “A switching regression model for wage
determinants in the public and private sectors of a developing country”, Review of Economics and Statistics: 244-252.
Velenchik, A. D. (1997): “Market power, firm performance and real wage growth in Zimbabwean manufacturing”, World Development, 20(5):749-762.
Wambugu, A. (2003), “Essays on earnings and human capital in Kenya” Economic Studies, No. 124, University of Goteborg.
Watkins, K. (2000), The Oxfam Education Report, Dorset, England. Wells, J. and D. Wall (2003), “The expansion of employment opportunities in the
building construction sector in the context of structural adjustment: Some evidence from Kenya and Tanzania”, Habitat International, 27: 325 – 337.
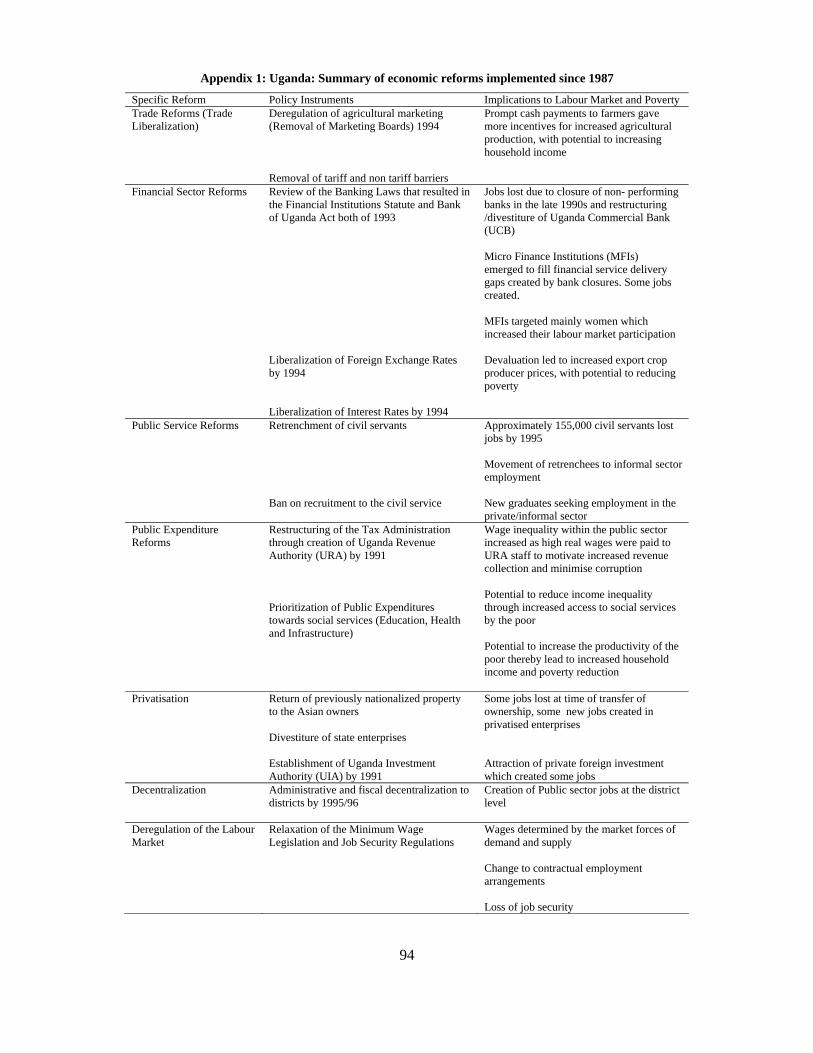
94
Appendix 1: Uganda: Summary of economic reforms implemented since 1987
Specific Reform Policy Instruments Implications to Labour Market and Poverty Trade Reforms (Trade Liberalization)
Deregulation of agricultural marketing (Removal of Marketing Boards) 1994 Removal of tariff and non tariff barriers
Prompt cash payments to farmers gave more incentives for increased agricultural production, with potential to increasing household income
Financial Sector Reforms
Review of the Banking Laws that resulted in the Financial Institutions Statute and Bank of Uganda Act both of 1993 Liberalization of Foreign Exchange Rates by 1994 Liberalization of Interest Rates by 1994
Jobs lost due to closure of non- performing banks in the late 1990s and restructuring /divestiture of Uganda Commercial Bank (UCB) Micro Finance Institutions (MFIs) emerged to fill financial service delivery gaps created by bank closures. Some jobs created. MFIs targeted mainly women which increased their labour market participation Devaluation led to increased export crop producer prices, with potential to reducing poverty
Public Service Reforms Retrenchment of civil servants Ban on recruitment to the civil service
Approximately 155,000 civil servants lost jobs by 1995 Movement of retrenchees to informal sector employment New graduates seeking employment in the private/informal sector
Public Expenditure Reforms
Restructuring of the Tax Administration through creation of Uganda Revenue Authority (URA) by 1991 Prioritization of Public Expenditures towards social services (Education, Health and Infrastructure)
Wage inequality within the public sector increased as high real wages were paid to URA staff to motivate increased revenue collection and minimise corruption Potential to reduce income inequality through increased access to social services by the poor Potential to increase the productivity of the poor thereby lead to increased household income and poverty reduction
Privatisation Return of previously nationalized property to the Asian owners Divestiture of state enterprises Establishment of Uganda Investment Authority (UIA) by 1991
Some jobs lost at time of transfer of ownership, some new jobs created in privatised enterprises Attraction of private foreign investment which created some jobs
Decentralization
Administrative and fiscal decentralization to districts by 1995/96
Creation of Public sector jobs at the district level
Deregulation of the Labour Market
Relaxation of the Minimum Wage Legislation and Job Security Regulations
Wages determined by the market forces of demand and supply Change to contractual employment arrangements Loss of job security
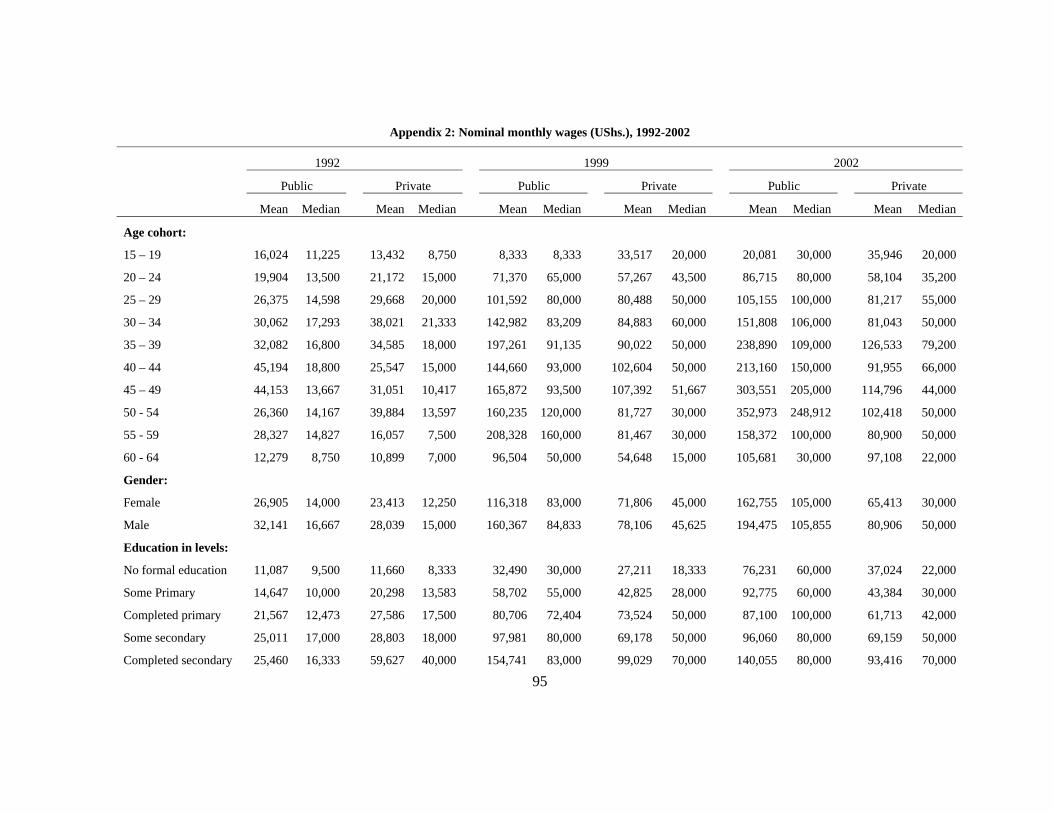
95
Appendix 2: Nominal monthly wages (UShs.), 1992-2002
1992 1999 2002
Public Private Public Private Public Private
Mean Median Mean Median Mean Median Mean Median Mean Median Mean Median
Age cohort:
15 – 19 16,024 11,225 13,432 8,750 8,333 8,333 33,517 20,000 20,081 30,000 35,946 20,000
20 – 24 19,904 13,500 21,172 15,000 71,370 65,000 57,267 43,500 86,715 80,000 58,104 35,200
25 – 29 26,375 14,598 29,668 20,000 101,592 80,000 80,488 50,000 105,155 100,000 81,217 55,000
30 – 34 30,062 17,293 38,021 21,333 142,982 83,209 84,883 60,000 151,808 106,000 81,043 50,000
35 – 39 32,082 16,800 34,585 18,000 197,261 91,135 90,022 50,000 238,890 109,000 126,533 79,200
40 – 44 45,194 18,800 25,547 15,000 144,660 93,000 102,604 50,000 213,160 150,000 91,955 66,000
45 – 49 44,153 13,667 31,051 10,417 165,872 93,500 107,392 51,667 303,551 205,000 114,796 44,000
50 - 54 26,360 14,167 39,884 13,597 160,235 120,000 81,727 30,000 352,973 248,912 102,418 50,000
55 - 59 28,327 14,827 16,057 7,500 208,328 160,000 81,467 30,000 158,372 100,000 80,900 50,000
60 - 64 12,279 8,750 10,899 7,000 96,504 50,000 54,648 15,000 105,681 30,000 97,108 22,000
Gender:
Female 26,905 14,000 23,413 12,250 116,318 83,000 71,806 45,000 162,755 105,000 65,413 30,000
Male 32,141 16,667 28,039 15,000 160,367 84,833 78,106 45,625 194,475 105,855 80,906 50,000
Education in levels:
No formal education 11,087 9,500 11,660 8,333 32,490 30,000 27,211 18,333 76,231 60,000 37,024 22,000
Some Primary 14,647 10,000 20,298 13,583 58,702 55,000 42,825 28,000 92,775 60,000 43,384 30,000
Completed primary 21,567 12,473 27,586 17,500 80,706 72,404 73,524 50,000 87,100 100,000 61,713 42,000
Some secondary 25,011 17,000 28,803 18,000 97,981 80,000 69,178 50,000 96,060 80,000 69,159 50,000
Completed secondary 25,460 16,333 59,627 40,000 154,741 83,000 99,029 70,000 140,055 80,000 93,416 70,000

96
1992 1999 2002
Public Private Public Private Public Private
Mean Median Mean Median Mean Median Mean Median Mean Median Mean Median
Post secondary 43,778 20,000 63,975 45,000 171,541 92,800 163,906 113,333 212,360 110,000 183,993 110,000
Education missing 68,771 30,000 150,685 62,500 773,658 800,000 82,383 66,000
Place of residence:
Rural 20,407 13,065 16,204 10,000 100,633 81,900 43,570 25,000 138,802 101,900 57,056 33,000
Urban 48,497 26,667 45,021 30,000 234,683 180,000 110,103 70,000 299,566 200,000 103,997 66,000
Region:
Central 48,366 25,000 34,023 19,150 236,059 187,500 88,401 50,000 293,234 180,000 95,832 60,000
Eastern 21,240 15,000 23,816 15,000 122,436 83,000 65,874 44,000 141,501 104,000 54,806 33,000
Northern 16,298 12,000 24,305 12,083 90,547 82,167 55,432 30,000 113,653 105,000 66,249 44,000
Western 22,250 12,044 13,515 10,000 117,245 80,000 56,037 30,000 154,925 105,000 53,642 30,000
Uganda 30,738 15,208 27,333 15,000 149,395 83,240 76,722 45,625 185,205 105,650 76,473 44,000 Source: Authors' calculations based on household surveys of 1992, 1999 and 2002 Notes i) Estimates restricted to main activity and usual household members in wage employment and aged 15-64 years; ii) Computation of monthly wage: for 1992 and 1999 annual wage information was reported. Monthly wage was estimated by using individual level data divided by 12 months. For 2002, respondents reported earning on daily, weekly or monthly basis. Here we assume 5 working days in a week and 22 working days in a month. Thus to convert daily wages into monthly wage we multiplied the reported wage by 22 days; whereas for weekly wages, we divided the wage by 5 and multiplied the result by 22; iii) Estimates exclude the districts of Gulu, Pader, Kitgum, Kasese and Bundibugyo.