POVERTY AND ETHNICITY IN THE LABOUR MARKET
20
POVERTY AND ETHNICITY IN THE LABOUR MARKET The UK poverty rate is twice as high for Black and Minority Ethnic (BME) groups as for white groups. This report explores some of the drivers for variations in working-age poverty rates, focusing on employment, labour markets and geography. Drawing on these findings the report also identifies four main areas for solutions to reduce poverty across ethnic groups. Key findings • There are a number of drivers for the high BME poverty rate: – higher unemployment rates: despite rising levels of employment, some groups are still more likely to experience unemployment, particularly White Gypsy/Irish Traveller groups, African groups and Mixed White and Caribbean groups – higher rates of economic inactivity: specific groups, such as women from Pakistani and Bangladeshi backgrounds, have much higher levels of economic inactivity than others, linked to unpaid caring responsibilities in the home – more likelihood of receiving low pay for those in work • One reason for lower pay among some BME groups is their concentration in low-paid sectors which often have very little prospect of progression. • There are also some groups who receive low pay in all sectors. For example, Bangladeshi workers are more likely to earn below the Living Wage and to be the lowest paid regardless of the sector they work in. • Where BME groups live and work has a great influence on their rates of unemployment – there are some regions in the UK, eg Birmingham, where unemployment rates for Pakistani, Indian, Chinese and African groups are particularly high. • The migration status of an individual and the experience of racism and discrimination when seeking and attempting to progress in work can create barriers to being able to move out of poverty. The risk of remaining in persistent poverty is especially high for African, Pakistani and Bangladeshi groups. • Educational attainment does not have a straightforward impact on success in the labour market for BME groups: while rates of academic attainment are higher among most BME groups than for White British groups, 40% of African and 39% of Bangladeshi graduates are overqualified for their roles. SEPTEMBER 2017 The Author Debbie Weekes-Bernard
Transcript of POVERTY AND ETHNICITY IN THE LABOUR MARKET

01
POVERTY AND ETHNICITY IN THE LABOUR MARKETThe UK poverty rate is twice as high for Black and Minority Ethnic (BME) groups as for white groups. This report explores some of the drivers for variations in working-age poverty rates, focusing on employment, labour markets and geography. Drawing on these findings the report also identifies four main areas for solutions to reduce poverty across ethnic groups.
Key findings
• There are a number of drivers for the high BME poverty rate:
– higher unemployment rates: despite rising levels of employment, some groups are still more likely to experience unemployment, particularly White Gypsy/Irish Traveller groups, African groups and Mixed White and Caribbean groups
– higher rates of economic inactivity: specific groups, such as women from Pakistani and Bangladeshi backgrounds, have much higher levels of economic inactivity than others, linked to unpaid caring responsibilities in the home
– more likelihood of receiving low pay for those in work
• One reason for lower pay among some BME groups is their concentration in low-paid sectors which often have very little prospect of progression.
• There are also some groups who receive low pay in all sectors. For example, Bangladeshi workers are more likely to earn below the Living Wage and to be the lowest paid regardless of the sector they work in.
• Where BME groups live and work has a great influence on their rates of unemployment – there are some regions in the UK, eg Birmingham, where unemployment rates for Pakistani, Indian, Chinese and African groups are particularly high.
• The migration status of an individual and the experience of racism and discrimination when seeking and attempting to progress in work can create barriers to being able to move out of poverty. The risk of remaining in persistent poverty is especially high for African, Pakistani and Bangladeshi groups.
• Educational attainment does not have a straightforward impact on success in the labour market for BME groups: while rates of academic attainment are higher among most BME groups than for White British groups, 40% of African and 39% of Bangladeshi graduates are overqualified for their roles.
SEPTEMBER 2017The AuthorDebbie Weekes-Bernard

02
KEY SOLUTIONSMany of the drivers of poverty among working-age groups across all ethnic groups are broadly similar, ie low pay and poor progression from low-paid sector work. This suggests similar solutions for all groups, ie better-quality jobs, higher pay. However, given that some of the drivers disproportionately affect BME groups – ie higher unemployment and inactivity rates – specific forms of outreach activity and the drawing on of local expertise/knowledge may be needed.
We recommend that:
• Employment support services, job brokerage companies and job centres:
– ensure that people across all ethnicities receive better advice and support to access higher-paid, better-quality work, engaging where necessary with community-based employment services to help to reach vulnerable communities.
• Employers:
– Improve monitoring of BME staff numbers and roles, to enhance or adapt recruitment practices where necessary. This can also help employers develop better training and development for low-paid staff
– consider the provision of part-time, flexible jobs.
• City regions, metro mayors and LEPs:
– use local decision-making/devolved powers to address adult skills, BME employment rates, engagement with local employers and access to better paid, better-quality jobs
– make ESOL courses more readily available especially in areas of high local demand; improve the availability of free provision for unemployed groups; explore and test the provision of employer-funded courses to enable those on low pay to confidently seek and access progression opportunities
• Local authorities:
– draw on childcare interventions being trialled by other authorities, such as those providing out-of-hours childminding so parents can continue with shift work/irregular hours; continue to improve the quality of childcare provision.

03
BACKGROUNDWork should be the best route out of poverty for those of working age, and it is critical that policies address equal access to the labour market across all ethnic groups. There has been an increased policy interest over recent years in tackling low pay, raising productivity and addressing ethnic inequalities in employment. This, together with wider concern about the future of the UK job market, especially in the wake of the decision to leave the European Union, provides an important context for identifying solutions to the high rates of working-age poverty among BME groups.
Policy contextIn 2015, Prime Minister David Cameron sought to reduce the employment gap between BME and White British workers by 20% by 2020. The target was contentious, given that demographic change will potentially see it reached anyway (Khan, 2015), but also because of the lack of differentiation between the types of jobs BME groups might get to meet it. In the following year, Theresa May, in her first speech as Prime Minister, spoke of addressing the ‘burning injustices’ facing a range of groups including families on low incomes and young people from poorer backgrounds failing to access higher education. Despite record levels of employment, the quality of the types of jobs people have and the amount they are paid for doing them is an issue of concern and has been explored by government commissioned reviews on ‘good work’ (Taylor, 2017) and the low levels of productivity in the UK (HM Treasury, 2015)
The government’s Industrial Strategy proposals focused on increasing growth in technology sectors where productivity rates are already high. However, a third of the productivity gap between the UK and other European countries can be accounted for in low-paid sectors such as retail, hospitality and care and it has been suggested that focusing attention on these sectors would better address this gap while helping to work with employers to tackle in-work poverty (JRF, 2017a). These reviews and consultations point towards a broader interest in developing an economy that benefits everyone, including those on lower incomes, and creating jobs that are secure and provide possibilities for training and development.
Policy challenges remain however – one in eight workers in the UK are living in poverty (Tinson et al, 2016) and the benefits system is confusing. While there is potential for Universal Credit to enable progression for those in work, long delays in receiving the first payment after a claim is made carry the risk of debt, eviction and destitution for individuals (Schmuecker, 2017). A freeze on working-age benefits from 2016, combined with rising inflation, high housing costs and stagnating wages, places pressure on household incomes and exacerbates poverty risks for many.
The government commissioned McGregor-Smith review of BME talent and progress at work estimates that having full representation of BME workers in the labour market, through improving both their rates of progression out of low-paid roles and increased access to higher paid and more senior jobs, would benefit the UK economy by £24 billion a year (McGregor-Smith, 2017). One of the recommendations was that it is essential to have better data about how different ethnic groups are employed, and the Government Race Disparity Audit launched in 2016 to identify racial disparities in outcomes across all public services including employment, will be helpful (www.gov.uk/government/news/prime-minister-orders-government-audit-to-tackle-racial-disparities-in-public-service-outcomes). However ethnic monitoring data at employer level, important for identifying employment gaps, remains patchy.

04
Research contextThere is huge variation both in poverty rates and the persistence of poverty across ethnic groups in the UK. For example, poverty rates are universally higher for ethnic minority groups and for Pakistani and Bangladeshi groups in particular. Over half of Bangladeshi individuals are living in poverty compared with 19% of people in White ethnic groups (JRF, 2017b) and those from Black African and Pakistani groups have higher rates of persistent poverty than others (Fisher and Nandi, 2015).
Figure 1: Proportion of people in poverty by ethnicity
Those ethnic minority groups and subgroups with a higher risk of poverty than others include Pakistani, Bangladeshi and African groups who are concentrated in low pay (Catney and Sabater, 2015; Brynin and Longhi, 2015) and migrants, with a poverty rate of 32% compared with 19% for those who are UK born (Hughes and Kenway, 2016). Indian and Chinese workers have relatively better success in the labour market than other ethnic minority groups. Research also suggests that some BME families have experienced greater increases in typical household income over time, growing in real terms by 38% for Bangladeshi families and 28% for Pakistani families, compared with 13% for White British households (Corlett, 2017). However Bangladeshi household incomes are around £8,900 lower, and Pakistani households £8,700 lower, than White household incomes.
The point about variation therefore is important for three reasons: first, we should focus on solving poverty for those groups at highest risk, in view of the negative impact this has on the individuals and communities directly affected. Second, understanding the drivers of different poverty rates can help develop interventions to tackle them; finally, understanding where the variations are both across and within ethnic groups may shed light on why some groups rather than others are in poverty.
What are the drivers of poverty for different ethnic groups?
Poverty rates vary across ethnic groups in the UK, with these increasing for some groups more than others. There are also some groups who find it particularly difficult to escape poverty, and Caribbean, Bangladeshi, African and Pakistani individuals have persistent poverty rates of 23%, 24%, 31% and 37% respectively (Fisher and Nandi, 2015). This compares with 13% for White groups. Those in persistent poverty are more likely to live in social housing, be younger, have no qualifications, and to be unemployed as well as having a higher risk if they are first generation migrants. And while BME groups tend to experience higher rates of poverty in comparison with White groups, poverty rates differ here too, with higher rates among some White non-British groups. For example, Gypsy/Irish Travellers experience some of the highest unemployment rates of all ethnic groups (Catney and Sabater, 2015), and concentration in low pay for some EU migrants is also high (Lucas and Jarman, 2016).
0Prop
ortio
n of
peo
ple
in p
over
ty b
y et
hnic
ity (%
)
10
20
30
40
50
60
2011/12
Source: Households Below Average Income (HBAI), Department for Work and Pensions, 2017
2012/13 2013/14 2014/15 2015/16
Pakistani (AHC) Any other Asian background (AHC)
Indian (AHC)
Bangladeshi (AHC)Other Ethnic Group (AHC)
White (AHC)Black/African/Caribbean/Black British (AHC)Mixed/Multiple ethnic groups (AHC)Chinese (AHC)

05
There are several different drivers of these variations; five in particular are useful for explaining these disparities:
• unemployment: while employment rates are high across all ethnic groups, unemployment rates for some remain particularly high
• inactivity rates: while inactivity rates have been reducing across all groups, they remain higher for Pakistani and Bangladeshi women. Caring responsibilities and higher rates of ill-health are important factors
• types of employment: some ethnic groups are concentrated in low-paid, low-quality, often insecure work with poor progression routes
• levels of pay: some ethnic groups are more likely to be paid below the Living Wage, particularly those from Pakistani backgrounds, regardless of the sector they work in
• lack of return for education qualifications/improvement of skills: BME groups tend to be overqualified for the work they do
Place, discrimination and migrationUnderlying these drivers are several other factors which include geographical location, racism and discrimination, and migration status. The latter is particularly important as it can prevent some sub-groups from both accessing and getting on in work. A person’s migration status can reveal some differences both within and between ethnic groups. For example, first generation migrant Pakistani men experience a gap in pay that cannot solely be explained by their concentration in low-skilled sectors, their lower level qualifications or increased likelihood of part-time working (Broughton, 2015). Lower levels of English language proficiency, lack of transfer of international qualifications and lack of labour market knowledge are also associated with migration status.
Figure 2: Persistent poverty by migrant generation and ethnic group
0
%
30
90
80
70
50
40
20
60
10
100
Whitemajority
Dataset: Understanding Society waves 1-3 (2009-12)Note: Longitudinal sample restricted to GB residents who responded in all three wavesSee Fisher and Nandi (2015)
Indian Pakistani Bangladeshi Chinese BlackCaribbean
BlackAfrican
Mixedparentage
OtherWhite
3rd generation 2nd generation 1st generation
0
1
Not
in p
ersi
sten
t pov
erty
Per
sist
ent p
over
ty All
Not
in p
ersi
sten
t pov
erty
Per
sist
ent p
over
ty All
Not
in p
ersi
sten
t pov
erty
Per
sist
ent p
over
ty All
Not
in p
ersi
sten
t pov
erty
Per
sist
ent p
over
ty All
Not
in p
ersi
sten
t pov
erty
Per
sist
ent p
over
ty All
Not
in p
ersi
sten
t pov
erty
Per
sist
ent p
over
ty All
Not
in p
ersi
sten
t pov
erty
Per
sist
ent p
over
ty All
Not
in p
ersi
sten
t pov
erty
Per
sist
ent p
over
ty All
Not
in p
ersi
sten
t pov
erty
Per
sist
ent p
over
ty All

06
Location also has an impact. In Merthyr Tydfil in Wales, for example, getting into work is particularly difficult for Gypsy/Irish Travellers (Nicholl et al, 2016). BME populations are also concentrated in cities, some of which have strong labour markets but few higher-paying sectors such as Cardiff or in London where skills shortages do not match up with vacancies (Thompson et al, 2016).
Racism and discrimination are real and persistent barriers to the labour market for BME groups. For example informal work practices – which include recruiting informally through social networks – create barriers to entry and progression (Hudson et al, 2013).
Finally, it is worth noting that age, gender and family size are also important factors. BME groups with larger families, particularly those from Pakistani and Bangladeshi backgrounds have a higher risk of persistent poverty (Fisher and Nandi, 2015), although family sizes are decreasing among these groups, contributing to an increase in their household income (Corlett, 2017). Most BME groups also tend to be younger than White British groups, and hence examining employment and working age poverty is particularly relevant (Nazroo and Kapadia, 2013). Finally, there are gender differences in employment and inactivity rates across groups, with women generally experiencing higher inactivity rates than men, although the rates of employment are increasing.
UnemploymentLevels of employment across the UK are currently at their highest since the 1970s. The employment rate is 74.9% (as at May 2017) and unemployment is at its lowest since 1975 (ONS, 2017). Figures suggest that the employment rate gap for minority ethnic groups and white groups has decreased by 0.5% since 2014, and that there are 670,000 more BME workers in employment since 2010 (DWP, 2016). Some ethnic groups have seen significant rises in employment. For example, Bangladeshi and Pakistani groups have seen large increases in employment among both men and women, with the biggest increases experienced by Bangladeshi men.
Figure 3: Employment rates (aged 16–64) by Ethnic Group (NSA) 4Q average
Despite this, unemployment for BME groups remains high and the figures mask some broad disparities across different ethnic groups. For example, while the unemployment rate for White individuals is 4.8%, it is 11.5% for those from Pakistani and Bangladeshi backgrounds and 14% for Black groups (DWP, 2016). The gender differences are also important – for example, rates of unemployment are particularly high for Black Caribbean men but not Caribbean women.
30
%
40
45
35
55
60
65
70
75
50
80
Apr
il 20
01 to
Mar
ch 2
002
Apr
il 20
02 to
Mar
ch 2
003
Apr
il 20
03 to
Mar
ch 2
004
Apr
il 20
04 to
Mar
ch 2
005
Apr
il 20
05 to
Mar
ch 2
006
Apr
il 20
06 to
Mar
ch 2
007
Apr
il 20
07 to
Mar
ch 2
008
Apr
il 20
08 to
Mar
ch 2
009
Apr
il 20
09 to
Mar
ch 2
010
Apr
il 20
10 to
Mar
ch 2
011
Apr
il 20
11 to
Mar
ch 2
012
Apr
il 20
12 to
Mar
ch 2
013
Apr
il 20
13 to
Mar
ch 2
014
Apr
il 20
14 to
Mar
ch 2
015
Apr
il 20
15 to
Mar
ch 2
016
Apr
il 20
16 to
Mar
ch 2
017
Total White Indian Black/African/Caribbean
Chinese Other Pakistani
Mixed
Bangladeshi
Source: Labour Force Survey (2017)

07
There are wide variations too depending on where people live. For example, there are areas in the UK where some groups fare particularly badly when accessing the labour market (Catney and Sabater, 2015): Pakistani groups have high unemployment rates across parts of the West Midlands, such as Birmingham (18%), Sandwell (18%), Walsall (17%) and Dudley (16.6%). Caribbean individuals have higher risks of unemployment if they live in certain parts of London, particularly Hackney (21%), Kensington & Chelsea (18.7%), Lambeth (18.5%), Hammersmith & Fulham (18%) and Islington (17.7%). Some areas carry high unemployment risks for a wide range of groups, such as Birmingham for Indian, Pakistani, Chinese and African individuals; some groups experience a higher risk of unemployment across far ranging areas such as African individuals in Birmingham, Liverpool, Westminster and Leicester.
There are also some ethnic groups whose risk of unemployment is particularly high compared with others. Individuals of Gypsy/Irish Traveller descent have some of the highest unemployment rates nationally (50.6% in Kingston upon Hull, 50% in Purbeck in Dorset) as do Mixed White/Black Caribbean (32% in Wolverhampton) and African groups (34% in Liverpool).
While where people live is important when looking at their labour market access, the risk of BME unemployment does not seem to relate to population density. While Black Caribbean individuals have unemployment rates of 21% in Hackney in London for example, an area in which their population is higher than the national average, their risk of unemployment is also high in South Wales and Cornwall, areas where Caribbean populations are small.
Figure 4: Unemployed age 16+ (%) by selected ethnic group. Local authorities in England & Wales 2011
See Catney and Sabater (2015)
<5 (149)
5-10 (185)
10-15 (14)
15-20 (0)
>20 (0)
White British White Gypsy/Irish Traveller
<5 (34)
5-10 (40)
10-15 (64)
15-20 (60)
>20 (150)
<5 (17)
5-10 (75)
10-15 (131)
15-20 (85)
>20 (40)
Mixed White/Black Caribbean African
<5 (50)
5-10 (128)
10-15 (95)
15-20 (42)
>20 (33)
08
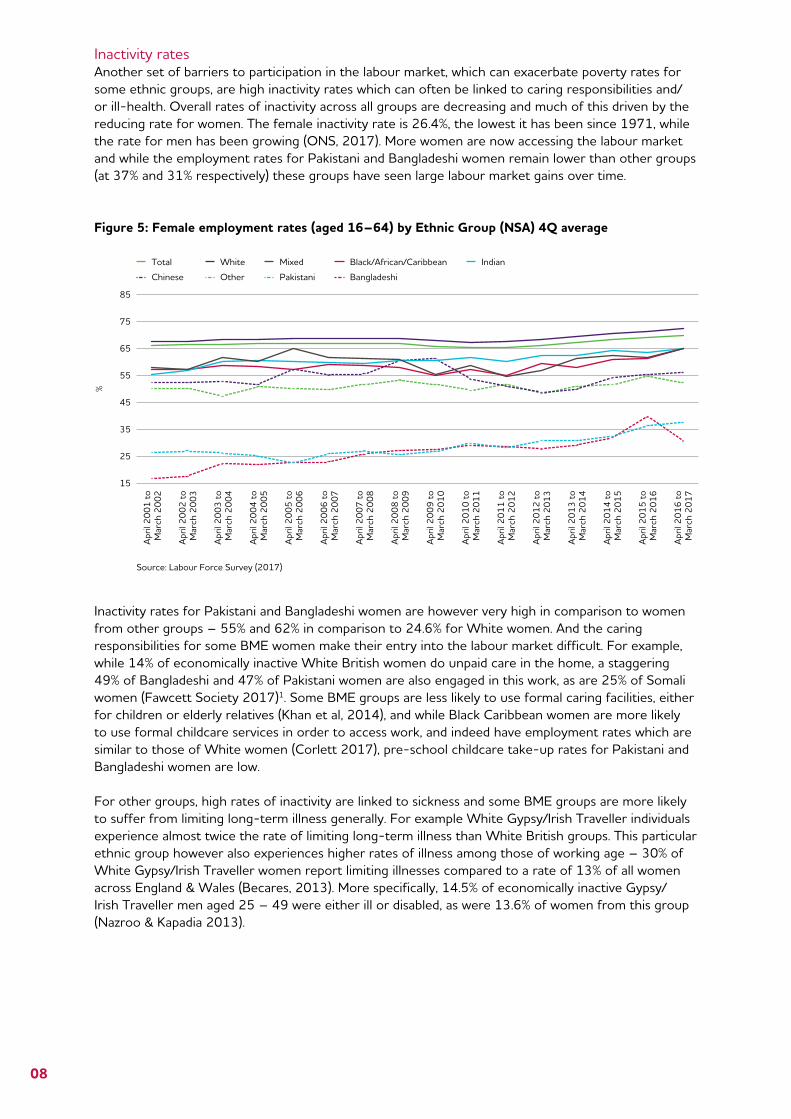
Inactivity ratesAnother set of barriers to participation in the labour market, which can exacerbate poverty rates for some ethnic groups, are high inactivity rates which can often be linked to caring responsibilities and/or ill-health. Overall rates of inactivity across all groups are decreasing and much of this driven by the reducing rate for women. The female inactivity rate is 26.4%, the lowest it has been since 1971, while the rate for men has been growing (ONS, 2017). More women are now accessing the labour market and while the employment rates for Pakistani and Bangladeshi women remain lower than other groups (at 37% and 31% respectively) these groups have seen large labour market gains over time.
Figure 5: Female employment rates (aged 16–64) by Ethnic Group (NSA) 4Q average
Inactivity rates for Pakistani and Bangladeshi women are however very high in comparison to women from other groups – 55% and 62% in comparison to 24.6% for White women. And the caring responsibilities for some BME women make their entry into the labour market difficult. For example, while 14% of economically inactive White British women do unpaid care in the home, a staggering 49% of Bangladeshi and 47% of Pakistani women are also engaged in this work, as are 25% of Somali women (Fawcett Society 2017)1. Some BME groups are less likely to use formal caring facilities, either for children or elderly relatives (Khan et al, 2014), and while Black Caribbean women are more likely to use formal childcare services in order to access work, and indeed have employment rates which are similar to those of White women (Corlett 2017), pre-school childcare take-up rates for Pakistani and Bangladeshi women are low.
For other groups, high rates of inactivity are linked to sickness and some BME groups are more likely to suffer from limiting long-term illness generally. For example White Gypsy/Irish Traveller individuals experience almost twice the rate of limiting long-term illness than White British groups. This particular ethnic group however also experiences higher rates of illness among those of working age – 30% of White Gypsy/Irish Traveller women report limiting illnesses compared to a rate of 13% of all women across England & Wales (Becares, 2013). More specifically, 14.5% of economically inactive Gypsy/Irish Traveller men aged 25 – 49 were either ill or disabled, as were 13.6% of women from this group (Nazroo & Kapadia 2013).
15
%
35
45
25
55
65
75
85
Apr
il 20
01 to
Mar
ch 2
002
Apr
il 20
02 to
Mar
ch 2
003
Apr
il 20
03 to
Mar
ch 2
004
Apr
il 20
04 to
Mar
ch 2
005
Apr
il 20
05 to
Mar
ch 2
006
Apr
il 20
06 to
Mar
ch 2
007
Apr
il 20
07 to
Mar
ch 2
008
Apr
il 20
08 to
Mar
ch 2
009
Apr
il 20
09 to
Mar
ch 2
010
Apr
il 20
10 to
Mar
ch 2
011
Apr
il 20
11 to
Mar
ch 2
012
Apr
il 20
12 to
Mar
ch 2
013
Apr
il 20
13 to
Mar
ch 2
014
Apr
il 20
14 to
Mar
ch 2
015
Apr
il 20
15 to
Mar
ch 2
016
Apr
il 20
16 to
Mar
ch 2
017
Total White IndianBlack/African/Caribbean
Chinese Other Pakistani
Mixed
Bangladeshi
Source: Labour Force Survey (2017)

09
Types of employmentOne very important driver for the disproportionately high poverty rates among some ethnic groups is the concentration or clustering of BME workers in low-paid work (Brynin and Longhi 2015; Fisher and Nandi, 2015; Catney and Sabater, 2015). Those in poverty are increasingly more likely to be in a household where at least one adult is in work – 55% of people in poverty are currently in a working family (Tinson et al, 2016). Some BME groups are more likely to work in particular low-paid sectors such as sales, catering, hairdressing, textiles and clothing – occupations with limited progression opportunities. It is this lack of movement out of low-paid work that increases the risk of poverty among groups.
So are some ethnic groups more likely to be working in low-paid sectors than others and why is this the case? What are some of the factors that might explain this? First, there are gender differences in the way clustering occurs. Men are more likely than women to experience occupational clustering and rates are highest for Black African and Pakistani male workers (Catney and Sabater, 2015). There are some ethnic groups, however, where more women than men are more likely to be working in low-paid jobs, for example Irish/Gypsy Traveller, Chinese and Other White female workers.
As with unemployment rates, place can be important when understanding where clustering occurs and for whom. For example, in Northern Ireland workers from post-2004 EU accession countries have a high overall employment rate at 72.7%. However just over half of these employees work in either plant or lower elementary occupations (Lucas and Jarman, 2016). Black workers are concentrated in production line work, Indian and Other Asian groups in health and social care and Chinese groups in accommodation and food sectors. In Scotland high proportions of individuals from Pakistani (50%), Polish and Gypsy/Traveller (32%) and Indian (30%) backgrounds work in restaurants or hotels. Similar large numbers of African (37%), Irish (37%), Black Caribbean (36%) and White Other (35%) groups work in public administration, education or health (Kelly, 2016).
Becoming trapped in a low-paid job also affects the self-employed. Self-employment accounts for about 26% of Pakistani men who are economically active, and they are the least likely of all ethnic groups to work for an employer (Broughton, 2015). The experiences that different BME groups have of self-employment suggest that this is often a route taken as a solution to the barriers they have experienced in the labour market. While self-employment has led to higher skilled work for some, this may not be an indicator of career success or job security. Indeed, Pakistani & Bangladeshi male self-employment can often be concentrated in low-paid sectors such as transport and catering
This concentration in low-paid work is likely to worsen. As intermediate jobs decrease (possibly by just over one million) the labour market is likely to become increasingly polarised. By 2022, the clustering of minority ethnic groups within low-paid sectors is projected to increase, particularly for Pakistani and Bangladeshi groups and Chinese and Other Asian female workers (Owen et al, 2015)
It has been suggested that occupational clustering can reflect barriers to wider forms of employment, which can include having insufficient information about employment options, and discrimination (Catney and Sabater, 2015). Restricted social networks, within local areas and communities, may also explain the over-representation of groups in particular employment sectors (Finney et al, 2015). Networks remain particularly important for those BME groups clustered in low pay, as well as migrants seeking information about local services and support.
Finally, finding progression routes into better paid jobs in low-paid sectors can be particularly difficult, not least because opportunities are restricted (Barnard, 2014; Wood and Wybron, 2015). Importantly, people move into and out of low-paid work frequently, and over a short time, however often this may be a movement in which pay increases only very slightly, and often not much above the Living Wage. BME groups are also more likely to move back into low pay than their White counterparts (Brynin and Longhi, 2015) and the ability of workers to move out of low pay also depends on the sector, and whether it is one in which there are a high number of low-paid jobs. Only between 3–7% of workers from low-paid sectors are able to move to better-paying sectors. Most remain in low-paying sectors and in this way become trapped.

10
Levels of payBrynin and Longhi (2015) suggest that workers from some BME groups are more likely than their White British counterparts to be paid less than the Living Wage. Most people earning below the Living Wage are employed in London (Child Poverty Action Group/Living Wage Foundation, 2017), which itself is home to the largest proportions of BME residents. These wage inequalities are greater across sectors and occupations than within them and vary widely between groups. In some jobs such as design associates and financial administration BME staff on average earn more than White workers. However, for some this is not the case and while others, such as Black Caribbean workers, earn similar rates of pay to other White employees in similar low-paid jobs, Pakistani and Bangladeshi individuals are more likely to receive less than the Living Wage in all employment types. Over a third of Pakistani men and over half of Bangladeshi men are paid below the Living Wage. Workers from these groups are more likely to receive low pay even in senior roles – 19.1% of Bangladeshi individuals who are lower managers and 9.5% who are higher managers receive less than the Living Wage. For Pakistani groups, these figures are 14.5% and 4.6% although most other BME groups in these posts do better than White groups. This does suggest that some ‘management’ positions may actually be poorly paid supervisory roles. This can be sector specific – 30% of people across all ethnic groups who work as managers in sports and fitness or hospitality and leisure services are paid less than managers in other sectors.
Figure 6: Percentage employees below Living Wage, by ethnic group and gender (1993 – 2012)
Some occupational clustering can enable individuals to access good rates of pay, but not for all, and there are some occupations in which specific groups tend to be employed. For example, while Caribbean workers are more likely to be found in administrative or secretarial occupations, African groups have the largest share of workers in personal service such as nursing auxiliaries or assistants. The Caribbean workers filling these roles are more likely to be female (Brynin and Longi, 2015) and research has shown Caribbean women earn more than their male counterparts. Caribbean men continue to experience high rates of unemployment (Breach and Li, 2017).
0
%
20
40
60
White
Brynin & Longhi (2015)
BlackCaribbean
BlackOther
Indian BlackAfrican
Other OtherAsian
Chinese Pakistani Bangladeshi
£ £
£ £
£ £
£ £
£ £
£ £
£ £
£ £
£ £
£ £
£ £
£ £
£ £
£ £
£ £
£ £
£ £
£ £
£ £
£ £
£ £
£ £
£ £
£ £
£ £
£ £
£ ££ £
£ £
£ £

11
There are also particularly high rates of underemployment for many BME groups relating both to hours worked but also over-qualification. For example 27% of economically active Pakistani men and 37% of Bangladeshi men work part time, compared with only 11% of White British men. While some groups have seen more rapid increases in employment rates, including Pakistani and Bangladeshi workers, Pakistani and Bangladeshi women have experienced larger increases in part-time work and there are low rates of full-time employment for White Gypsy/Irish Traveller workers of both genders (Nazroo and Kapadia, 2013). Higher rates of economic inactivity among some groups, combined with low-paid part-time work for male workers, signify a greater risk of poverty for BME families. The Institute for Fiscal Studies (2017) suggests that there is an even higher risk of poverty for single earner families, reliant on one National Living Wage income.
Lack of return for education/skillsDespite increasing educational gains made by BME young people which should help prevent poverty, BME groups are more likely to be overqualified for the jobs they work in and less likely to get a good return for university education (Brynin and Longhi, 2015; Morris, 2015). 40% of African and 39% of Bangladeshi employees were overqualified for their roles, compared with 25% of White workers. Overall the picture of school educational achievement is one of success, with the achievement gap at age 16 narrowing over time between the majority of BME groups and White children. Indian and Chinese children continue to outperform all ethnic groups at all key stages. However the impact of coming from a low-income background is far reaching across ethnic groups, and the gap between poorer and wealthier children is increasing (Andrews et al, 2017). This is particularly pertinent for children from Gypsy/Roma/Traveller backgrounds, who are clustered around the bottom of the attainment distribution, and for Black Caribbean pupils, who start out well in terms of academic performance at pre-school levels, but then fall back over the course of their school careers.
While higher numbers of BME groups are entering higher education – 29% in 2015/16 (HEFCE, 2017), they experience high levels of underemployment as graduates. Research also suggests that BME young people are less successful in their applications for apprenticeships. In 2011/12, 24% of applications for apprenticeships were made by BME individuals, yet only 8% were successful (Hughes, 2015)
BME groups are twice as likely to be living in an area of high deprivation (CoDE, 2013), associated with poor adult skills (basic functional literacy and numeracy skills) and those who have no formal qualifications are more likely to be found in economically weak areas. There are high rates of low skills acquisition among some groups. 25.4% of Bangladeshi individuals of working age have no qualifications at all compared with 16.7% of the White majority group.
Poor English language skills can increase the risk of persistent poverty (Fisher and Nandi, 2015). At the time of the 2011 census, 1.3% of the population reported not being able to speak English well and 0.3% could not speak it at all. While there is broad political recognition of the need to promote English language skills across migrant communities (Casey, 2016; APPG on Social Integration, 2017), the ESOL skills budget halved from £203 million in 2009/10 to £104 million in 2014/15 and there is no national strategy for ESOL delivery in England. Where English language skills are low, access to the labour market is restricted – it is therefore necessary to increase access to ESOL classes to improve labour market success.

12
Solutions
Solutions to tackle these often persistent issues will require a mix of local decision-making, co-ordination of key stakeholders and good use of local data. The solutions below are therefore targeted at key relevant decision-makers, together with a number of strategies linked to ongoing employment initiatives and case studies.
Key IssuesThis section outlines some of the strategies that can help reduce poverty across ethnic groups. Some of these solutions are of relevance to all groups – for example developing strategies to target those trapped in low pay, but for those who have specific barriers to moving out of poverty, for example migrants who have poor English language skills, more targeted initiatives are necessary.
There are two key themes:
• the importance of outreach work – enabling engagement between key decision-makers and organisations/experts embedded in local communities
• engaging with place-shapers and local decision-makers – working with key stakeholders, such as local enterprise partnerships (LEPs), combined authorities, metro mayors, anchor institutions and other local employers to identify where local initiatives can best improve access to local labour markets.
Within these two key themes are the following practical solutions:
• improving employment support
• employer engagement
• focus on skills and training.
While it is recommended that both outreach strategies to target particular, often vulnerable communities, and place-based approaches are important, there are broader national policies such as those relating to welfare reform which may create both challenges and opportunities for change.
Overarching themesThe importance of outreachSome drivers of the high rates of working-age poverty among BME groups are similar for all ethnic groups, ie low pay, low skills and working in low-paid roles. It therefore makes sense that policies and interventions that will tackle low pay for example, such as working with employers to provide better paid, better quality jobs, will help routes out of poverty for all groups.
Outreach initiatives are necessary, however, because some BME groups have specific barriers to labour market access and progression which may require specific solutions. Recommendations below will include strategies for helping to address these.
Engaging with place-shapers and local decision-makersRecognising that where people live can have an impact on their experience of work also means developing locally-based solutions. Regionally or locally-targeted initiatives provide the opportunity for specific tailored activity to occur, for example being sensitive to local employer needs and identifying skills gaps. In the West Midlands, 54% of BME individuals are employed compared with an (already low) national BME employment rate figure of 64%. The broader employment rate in the West Midlands mayoral area is 64%, lower than the national average. Work to address not simply job creation, but also job quality here will be important. Below solutions targeted at key local actors such as anchor employers and metro mayors are identified.

13
Improving employment support and job brokerageImproving the advice given to people about a wider variety of jobs, that are better paid and with better progression opportunities, is one way of tackling the routes into low-paid, insecure work taken by some BME groups. Employment support providers play an important role, particularly in engaging with the long-term unemployed and those who are economically inactive but working unpaid in the home etc.
At the national level we recommend to DWP:
• More evidence is needed about the impact of Universal Credit on those who have a difficult relationship with the labour market. This includes vulnerable groups such as new migrants or refugees with poor English skills, those at risk of homelessness and lone parents.
• Working at regional and local levels should be explored, potentially with metro mayors, to devolve responsibility for employment support and link advice and services provided more closely to local populations and employment opportunities.
We recommend at the local level:
• That employment support providers, job centres and job brokers should:
– link advice and support on access to good-quality work to local employer needs and broader economic growth plans
– provide good quality careers advice, linked to local employers with information about apprenticeship opportunities, shared with schools and colleges
– draw on the support of employment support organisations with experience of working with different BME groups in a local area
– acknowledge that employment support must be about access and progression, rather than simply moving people off benefits, and that Jobcentre Plus and employment support advisors should focus on moving people out of low pay and into higher-paid better-quality work
– support advisors to help clients progress once in work. This may involve ensuring advisors have access to training and support, given that their roles tend to focus more on getting unemployed individuals into work, sometimes regardless of its quality (Wood and Wybron, 2015; Schmuecker, 2017)
– explore what personalised advice and progression look like for different groups. As some of the practical solutions below suggest, for new migrants and those who struggle with English proficiency, personalised advice that combines employment support with information about benefit entitlement can be very helpful
– drawing on existing practice such as outreach activity in the West Midlands, using evidence of the success of the Ethnic Minority Outreach Scheme to encourage individual Jobcentre Plus use of flexible funding for BME employment and progression support (JRF, 2017c; Wood and Wybron, 2015).

14
Local practical solutions
Employer engagementEmployers can work towards poverty reduction in several ways. The challenge for business/industry leaders in low-pay sectors is to create more jobs offering better pay, hours and security with opportunities to progress (JRF, 2016). Given the disproportionate representation of some minority ethnic sub-groups in low-paid employment sectors, together with higher rates of underemployment for African graduates for example, there is also clearly a case to be made for encouraging larger employers in other sectors to create more job opportunities for those seeking progression out of low pay.
We recommend that larger employers/anchor institutions:
• monitor workforces by ethnicity which should include recruitment, retention and progression
• provide training and development to aid progression of low-paid workers
• use procurement practices that can ensure the development of more diverse workforces
• become Living Wage employers
• seek to provide flexible working options to enable previously economically inactive individuals with caring responsibilities to combine this with work.
Tackling inequality: supporting ethnic minority mothers to escape in-work poverty run by Women Like Us (Timewise) is a project testing approaches for engaging with groups of women who are seeking to move out of low-paid work, often found through local informal community-based networks. Focussing specifically on Somali, Pakistani and Polish women in south-east London, advice and support given defines ‘better jobs’ as those with better pay, that are closer to home and with better contract terms and conditions, but not necessarily incorporating more hours. Some women lacked confidence in seeking work outside of local and community boundaries due to concern about English language proficiency and fear surrounding external perceptions of religious dress. Many women supported through the project accessed low-paid work through local networks via ‘word of mouth’. Progression from these jobs often requires a steep learning curve as individuals lack CVs and may need to improve English proficiency. Therefore, enabling women to rely less on informal childcare (due to working outside of normal working hours), to seek out local opportunities, but also helping them to balance advice from social networks on available jobs with that provided by employment support advisors is key.
Brent Crisis in Harlesden, north-west London, is one of the many Crisis Skylight Centres found across the UK providing employment support, training and advice on housing and benefits. The Employment Access and Progression (EAP) project works with people who have either recently been homeless or are at risk of homelessness and is testing progression approaches for vulnerable groups. Clients can present with complex cases, for example, those with poor English language skills not understanding terms in employment contracts, and before advisors can begin to work on progression options, they may have to support clients with more immediate needs such as threats of homelessness, often related to delays in Universal Credit payments or ‘change in circumstances’ benefit recalculations. Personalised support and the building of trust between client and advisor is important. Intensive support can ensure that advice on how to access better quality work takes into consideration, for example, finding better-paid work to help with debts, particularly as clients may only reveal the extent of personal debt once the relationship with their advisor has developed. The definition of a ‘better job’ for these clients means helping to negotiate more secure work, being paid the London Living Wage and benefits maximisation, ie knowing about eligibility for Working Tax Credit.

15
We recommend that metro mayors, other city mayors, LEPs and city regions:
• use local claimant and employment data broken down by ethnic group to identify where employment gaps exist, in which sectors and in what types of work
– for example, given high rates of BME unemployment in LEPs in the West Midlands and Liverpool City Region, targeted work to address barriers to employment here is recommended
• harness the role of cities in reducing poverty, through working with employers to match local opportunities to local people and also to identify where skills gaps exist.
• work with local low-wage sector employers in sectors such as retail, care, hospitality with high proportions of low paid BME staff to specifically address low-wage traps across ethnic groups.
We recommend that councils/local authorities:
• become Living Wage employers: research suggests that London businesses and employers are more likely to pay the London Living Wage if the local authority is an accredited Living Wage employer (Child Poverty Action Group/Living Wage Foundation, 2017)
• draw on different childcare options trialled in other local authorities to both improve the quality of childcare on offer to working parents, as well as broadening the type of childcare available. For example, Brent Council, a particularly diverse authority in north London, provides a flexible childminding pool (www.brent.gov.uk/services-for-residents/children-and-family-support/childcare/flexible-child-care/) which enables parents working atypical hours, shifts etc to access a childminder 24 hours a day (JRF,2016).
Local solutions
The Bradford Producer City Talent Management Programme run by Bradford Council has developed a set of activities to address local skills gaps and an ageing workforce in the local textiles industry. Working with a local further education college in Keighley and a group of local textiles employers, the council has facilitated the setting up of an employer-led textiles academy, to develop sewing skills in the local population. Bradford has targeted a specific group within the local population – Asian, largely Pakistani women – and works with a community-based women’s centre which was already running local sewing classes, and the local Jobcentre Plus. Importantly, local textile employers are part of the board overseeing the development and running of the textile academy at Keighley college, and have helped design the course which provides elementary sewing machinist training. Some have contributed to the set-up costs of the academy and provision of training materials. The ageing population across the local textiles industry is largely White, but with a local population in Keighley which is approximately 25% Asian, the Bradford council project team has worked with local employers to recognise one way of closing their skills gaps would be to draw on the ethnic diversity in the existing surrounding working-age population. Employers visit the college, which ensures that business owners meet students while they are studying, improving familiarity between employer and course attendee, which has had a positive impact on the recruitment process.

16
Focus on skills and trainingThe election of six metro mayors during 2017 (in West Midlands, West of England, Tees Valley, Liverpool City Region, Greater Manchester and Cambridgeshire and Peterborough) has provided a useful opportunity to address poverty locally, such as improving employment advice and the raising of skills. Metro mayors have devolved budgets for transport, housing and skills with the possibility for negotiating other deals with central government. Suggestions that the concentration of BME groups in low pay will worsen by 2022 make intervention around skills and work ever more important (Owen et al, 2015). Also, it is clear that some individuals may have specific barriers which make some solutions less effective. For example the experiences of newer or first generation migrants in comparison with British born BME groups may mean that progress on ensuring they are able to translate qualifications acquired outside of the UK into work or having access to good English language course provision is critical.
At the national level we recommend to the Skills Funding Agency that:
• all adult basic skills needs be met by 2030, with a redoubling of the participation rate in relevant training programmes for ESOL, digital skills and literacy and numeracy
• the UK government follows the example of both Scotland and Wales and develops a national strategy for ESOL in England
• the government reintroduces funding for ESOL classes, offering matched employer funding and extending loans (Wood and Wybron, 2015). Broader recognition of other cost barriers for those whose status (ie as asylum seekers) precludes them from accessing free ESOL courses is critical
• the development of bridging courses or other re-qualification opportunities for new migrants and/or refugees whose qualifications are not recognised in the UK be encouraged at a national level and taken up by training providers at a local level. This will enable skilled migrants and refugees to access higher paid work in line with their qualifications and to move out of poverty.
The Mayor’s Fund for London provides employment support, training and job brokerage for disadvantaged young people across the city. The En-route to sustainable employment programme involves direct links with the transport sector, one which struggles to recruit and progress both women and young people from BME backgrounds beyond entry-level work. Working with major local employers such as Transport for London, Stagecoach and Network Rail among others, Mayor’s Fund runs a transport employer group through which employers help shape the project’s developing solutions. In these meetings the project team talks to employers about the importance of increasing workforce diversity. Part of the project involves running pre-employment courses with young people which can lead to work placement opportunities. Employers give them access to their internal jobs boards which means course participants can apply for jobs and apprenticeships they might have otherwise been unaware of. It also means that the project is tied to potential vacancies, improving the engagement of young people, and gives employers and participants the opportunity to meet.
Work with Women Like Us/Timewise has sought to reflect the importance of being able to match potential employee working patterns and childcare needs with available flexible jobs. Working with employers to make flexible working arrangements both available and clear in recruitment materials was a key recommendation of We Can Solve Poverty in the UK (JRF, 2016) and one which Timewise features prominently on its website in its engagement with employers. Women Like Us has drawn on the engagement practices of the wider Timewise organisation which have involved encouraging adoption of flexible working for specific roles within larger organisations. Enabling their clients to see the potential for flexible working employment opportunities, as well as progression pathways that include flexibility, has given some women the confidence to apply for roles that could both fit with caring responsibilities and include the possibility of future progression.

17
We also recommend that DWP:
• encourage employers to offer workplace-based ESOL courses.
At the local level we recommend that metro mayors, other city mayors, LEPs and city regions:
• ensure their devolved responsibilities include a focus on inclusive growth, and with that a focus on skills, BME employment and training to improve access to quality jobs across all ethnicities
• co-ordinate local data about educational qualifications, skills acquired, apprenticeship application and take-up etc across ethnic groups to identify where education/skills gaps exist in the local population
• use national data as a starting point for local work. For example, given existing low rates of apprenticeship take-up/application success by BME young people nationally, working specifically with community-based employment services, training providers and mentoring schemes to flag this as a potential area to focus on
• engage with local training and education providers as well as local employers to develop training and employment pathways for young people but also, given the high numbers of adults without basic or functional skills in the UK, for adults seeking either access to the labour market or progression out of low pay
• explore and test the provision of ESOL courses funded by employers to enable those on low pay to confidently seek and access progression opportunities.
Local solutions
Addressing underemployment among migrant workers is important, particularly where this relates to poor transferability of overseas qualifications. This is an area in which place-based intervention work with local employers and outreach activity with community-based employment support providers would be useful and would require some development/testing. Creating local partnerships between employers and educational or training providers would help to ensure that skills gaps in the workforce can be met by identifying what skills and experience exist among the local migrant population and enabling the recognition of overseas qualifications to take place (Patel-Fenton and Smith, 2008).
Bradford Council’s Bradford Producer City Talent Management Programme has developed a demonstration project centred on providing training for progression specifically for low-paid council staff working in the Facilities Department. This department employs approximately 1,500 staff, the majority of whom work in catering, cleaning and maintenance with a disproportionately high number of BME female employees. The council is providing literacy and numeracy training for low-paid staff to address existing poor skill levels – JRF-funded work is taking a cohort from this group and providing additional training developing skills and knowledge necessary to progress to senior roles within the department. As a major employer or ‘anchor’ in the area, Bradford Council has signalled its commitment to reducing low pay among its staff through signing the Low Pay Charter set up by West Yorkshire Combined Authority (WYCA) and this project forms an integral part of its work. The WYCA low-paid workers group of which Bradford Council is part is linked to JRF’s Leeds City Region work (the More Job, Better Jobs partnership between JRF and Leeds City Region was launched in 2014, www.jrf.org.uk/press/new-partnership-launched-leeds-city-region-ensure-economic-growth-benefits-all) on developing More Jobs, Better Jobs across the region and the council shared initial findings from this project and its work with the local textiles industry with the RSA Inclusive Growth Commission (www.thersa.org/action-and-research/rsa-projects/public-services-and-communities-folder/inclusive-growth-commission). It is also part of a wider coalition which includes a number of other larger public sector anchor institutions across the city including Bradford University, Airedale NHS Foundation Trust, Bradford District Care Foundation Trust and large private sector employers, and is using this partnership to explore ways of collaborating to create greater diversity across workforces.

18
Women Like Us has been supporting clients who have overseas qualifications but can only access low-paid work in the UK. As with the solutions outlined above, advisors engage in time intensive work to raise confidence levels with clients who have become trapped in low-paid work and feel uncertain that their employment will match their qualifications. Employer engagement is important to this process. We recommend further work to explore ways of matching jobs to skilled migrant individuals who have been unemployed or economically inactive for some time and are seeking access to higher skilled work.
Conclusions
Understanding the drivers for high rates of working-age poverty across different BME groups will help reduce poverty across all ethnic groups, particularly where the problems are associated with poor access to the labour market, or, for those in work, with becoming trapped in low pay. There remain ethnic groups who have persistently poor labour market outcomes which can contribute towards a high risk of poverty, such as Gypsy and Irish Travellers (unemployment), Bangladeshi and Pakistani men (low-paid part-time work) and Somali women (high inactivity rates). And importantly, while low pay in itself is not an indicator of poverty if a person is living in a household with other higher paid adults, it is the combination of adults in a family earning below the Living Wage, with high rates of inactivity or unemployment, freezes to benefits and high housing costs (particularly for BME families in London for example) which exacerbate the risk of poverty.
The recommendations suggested in this report seek to address all of the main themes emerging out of current research (over-concentration of groups in low pay, discrimination in recruitment processes, the barriers to labour market access and progression created by limited English language skills), with relevant solutions. For example, suggesting that employment support services better advise individuals of progression routes and opportunities; that metro mayors and other local decision-makers work collaboratively with local training providers and employers to identify and address skills gaps, and encouraging employers to monitor recruitment and retention data by ethnicity. Many of these solutions are not new. However their combined use, particularly with a focus on being place-led and conducted in conjunction with community-based organisations with outreach experience should ensure that interventions target and reduce some of the persistent inequalities in the labour market experienced by different ethnic groups.
About this paper
This paper looks at the relationship between poverty and ethnicity, exploring the drivers for the higher poverty rate among those of working age from BME backgrounds, and suggesting a set of possible solutions for tackling the difficulties experienced in the labour market. The paper sets out recommendations at the national level for the government, but also develops more locally based solutions for employers, metro mayors, LEPs and councils to ensure that strategies for addressing labour market inequalities are linked to local areas and the different ethnic groups often represented within them.
Notes
1 Across the UK, 35% of the female economically inactive population aged 16–64 are looking after a family or home, 21% are students, 19% are long term sick and 13% are retired (ONS 2017)

19
References
Andrews, J., Robinson, D. and Hutchinson, J. (2017) Closing the gap? Trends in educational attainment and disadvantage. London: Educational Policy Institute. Available at: https://epi.org.uk/wp-content/uploads/2017/08/Closing-the-Gap_EPI.pdf (accessed 14 August 2017)
All Party Parliamentary Group on Social Integration (2017) Interim report into integration of immigrants. [Online] Available at: http://bit.ly/2hUB5uQ (accessed 14 August 2017)
Barnard, H. (2014) Tackling poverty across all ethnicities in the UK. York: JRF. Available at: www.jrf.org.uk/report/tackling-poverty-across-all-ethnicities-uk (accessed 14 August 2017)
Becares, L. (2013) Which ethnic groups have the poorest health? Ethnic health inequalities 1991 to 2011. Manchester: Centre on Dynamics of Ethnicity (CoDE). Available at: www.ethnicity.ac.uk/medialibrary/briefingsupdated/which-ethnic-groups-have-the-poorest-health.pdf (accessed 14 August 2017)
Breach, A. and Li, Y. (2017) Gender pay gap by ethnicity in Britain – briefing. London: The Fawcett Society. Available at: www.fawcettsociety.org.uk/Handlers/Download.ashx?IDMF=f31d6adc-9e0e-4bfe-a3df-3e85605ee4a9 (accessed 14 August 2017)
Broughton, N. (2015) Self-employment and ethnicity – an escape from poverty. York: JRF. Available at: www.jrf.org.uk/report/self-employment-and-ethnicity-escape-poverty (accessed 14 August 2017
Brynin, M. and Longhi, S. (2015) The effect of occupation on poverty among ethnic minority. York: JRF
Casey, L. (2016) The Casey Review: A review into opportunity and integration. London: Department for Communities and Local Government. Available at: www.gov.uk/government/uploads/system/uploads/attachment_data/file/575973/The_Casey_Review_Report.pdf (accessed 14 August 2017)
Catney, G. and Sabater, A. (2015) Ethnic minority disadvantage in the labour market: participation, skills and geographical inequalities. York: JRF
Child Poverty Action Group/Living Wage Foundation (2017) Moving to the London Living Wage: A guide for local authorities in London. Available at: www.cpag.org.uk/sites/default/files/Moving%20to%20The%20London%20Living%20Wage.pdf (accessed 14 August 2017)
CoDE (2013) Ethnicity and deprivation in England: How likely are ethnic minorities to live in deprived neighbourhoods? Available at: www.ethnicity.ac.uk/medialibrary/briefingsupdated/ethnicity-and-deprivation-in-england-how-likely-are-ethnic-minorities-to-live-in-deprived-neighbourhoods%20(1).pdf (accessed 14 August 2017)
Corlett, A. (2016) Diverse outcomes: living standards by ethnicity. London: Resolution Foundation. Available at: www.resolutionfoundation.org/app/uploads/2017/08/Diverse-outcomes.pdf (accessed 14 August 2017)
Department of Work and Pensions (2016) Labour Market Status by Ethnic Group. London: DWP
Higher Education Funding Council for England (HEFCE) (2017) Higher education: student characteristics – ethnicity. London: HEFCE. Available at: www.hefce.ac.uk/analysis/HEinEngland/students/ (accessed 14 August 2017)
Finney, N., Kapadia, D. and Peters, S. (2015) How are poverty, ethnicity and social networks related? York: JRF
Fisher, P. and Nandi, A (2015) Poverty across ethnic groups through recession and austerity. York: JRF
Hudson, M., Netto, G., Sosenko, F., Noon, M., de Lima, P., Gilchrist, A. and Kamenou-Aigbekaen, N. (2013) In-work poverty, ethnicity and workplace cultures. York: JRF
HM Treasury (2015) Fixing the foundations: creating a more prosperous nation. Cm 9098. London: The Stationery Office. Available at: www.gov.uk/government/uploads/system/uploads/attachment_data/file/443897/Productivity_Plan_print.pdf (accessed 12 August 2017)
Hughes, C. & Kenway, P. (2016) Foreign-born people and poverty in the UK. York: JRF. Available at: www.jrf.org.uk/report/foreign-born-people-and-poverty-uk (accessed 14 August 2017)
Hughes, C. (2015) Ethnicity, poverty and youth employment: improving outcomes for young people. York: JRF
Institute for Fiscal Studies (2017) Living standards, poverty and inequality in the UK. London: IFS
Irwin, J., McAreavey, R. and Murphy, N. (2014) The economic and social mobility of ethnic minority communities in Northern Ireland. York: JRF. Available at: www.jrf.org.uk/report/economic-and-social-mobility-ethnic-minority-communities-northern-ireland (accessed 14 August 2017)
Joseph Rowntree Foundation (2016) We can solve poverty in the UK. York: JRF
Joseph Rowntree Foundation (2017a) JRF response to the Industrial Strategy Green Paper. Available at: www.jrf.org.uk/report/jrf-response-industrial-strategy-green-paper (accessed 14 August 2017)

Joseph Rowntree Foundation (2017b) Poverty rate by ethnicity. York: JRF. Available at: www.jrf.org.uk/data/poverty-rate-ethnicity (accessed 14 August 2017)
Joseph Rowntree Foundation (2017c) Inclusive growth in the West Midlands: an agenda for the new mayor. York: JRF. Available at: www.jrf.org.uk/report/inclusive-growth-west-midlands-agenda-new-mayor (accessed 14 August 2017)
Kelly, M. (2016) Poverty and ethnicity: Key messages for Scotland. York: JRF
Khan, O (2015) ‘How serious and enduring will Cameron’s commitment to tackle racial inequalities prove to be?’ [Online] Conservative Home. Available at: www.conservativehome.com/platform/2016/03/omar-khan-how-serious-and-enduring-will-camerons-commitment-to-tackle-racial-inequality-prove-to-be.html (accessed 14 August 2017)
Khan, O., Ahmet, A. and Victor, C. (2014) Poverty and ethnicity: Balancing caring and earning for British Caribbean, Pakistani and Somali people. York: JRF
Lucas, O. and Jarman, N. (2016) Poverty and ethnicity: Key messages for Northern Ireland. York: JRF
McGregor-Smith, R. (2017) Race in the workplace: the McGregor-Smith Review. London: Department for Business, Energy and Industrial Strategy
Morris, M. (2015) Supporting ethnic minority young people from education into work. York: JRF
Nazroo, J. and Kapadia, D. (2013) Ethnic inequalities in Labour market participation. [Online] Available at: www.ethnicity.ac.uk/medialibrary/briefingsupdated/Ethnic%20inequalities%20in%20labour%20market%20participation.pdf (accessed 14 August 2017)
Nicholl, A., Johnes, C. and Holtom, D (2016) Breaking the links between poverty and ethnicity in Wales. York: JRF
Office for National Statistics (2017) UK labour market: July 2017. [Online] Available at: www.ons.gov.uk/employmentandlabourmarket/peopleinwork/employmentandemployeetypes/bulletins/uklabourmarket/july2017 (accessed 14 August 2017)
Owen, D., Gambin, L., Green, A. and Li, Y. (2015) Projecting employment by ethnic group to 2022. York: JRF
Patel-Fenton, P. and Smith, P. (2008) Research into converting overseas qualifications into UK equivalents. Milton Keynes: Open University. Available at: www.heacademy.ac.uk/system/files/converting_overseas_qualifications_into_uk_equivalents.pdf (accessed 14 August 2017)
Schmuecker, K. (2017) Universal Credit: A Joseph Rowntree Foundation briefing. York: JRF
Taylor, M. (2017) Good work: The Taylor Review of Modern Working Practices. London: RSA. Available at: www.thersa.org/globalassets/pdfs/reports/good-work-taylor-review-into-modern-working-practices.pdf (accessed 14 August 2017)
Thompson, S., Colebrook, C. and Hatfield, I. (2016) Jobs and skills in London: Building a more responsive skills system in the capital. London: IPPR
Tinson, A., Ayrton, C., Barker, K., Barry Born, T., Aldridge, H. and Kenway, P. (2016) Monitoring Poverty and Social Exclusion 2016. York: JRF. Available at: www.jrf.org.uk/report/monitoring-poverty-and-social-exclusion-2016 (accessed 14 August 2017)
Wood, C. and Wybron, I. (2015) Entry to and progression in work. York: JRF
FOR FURTHER INFORMATIONThis Round up is part of JRF’s research and development programme. The views are those of the authors and not necessarily those of the JRF.
Poverty and ethnicity in the labour market by Debbie Weekes-Bernard is published by the Joseph Rowntree Foundation. It is available as a free pdf from www.jrf.org.uk
Read more summaries at www.jrf.org.ukOther formats availableISBN 978-1-911581-14-7
Joseph Rowntree FoundationThe Homestead40 Water EndYork YO30 6WPTel: 01904 615905
email: [email protected]: 3269