Potomac Basin Case Study
52
Transcript of Potomac Basin Case Study


Potomac Basin Case StudyCooperative Water Supply Planning & Operations
AWWA Regional Collaboration Webinar
September 24, 2018
Cherie Schultz, Ph.D.Section for Cooperative Water Supply Operations on the Potomac (CO-OP)Interstate Commission on the Potomac River Basin (ICPRB)
Lisa RagainMetropolitan Washington Council of Governments (MWCOG)

Outline
The Washington, DC, metropolitan area has had a cooperative water supply system for 35 years
• How was the system established?
• How does the system operate today?
• Regional vulnerabilities/potential options
• New challenges/next steps

Location
Potomac River Basin•Area: 14,670 mi2
•Population: 6.1 million
Washington DC metropolitan area (WMA)•Annual demand: 486 MGD• July demand: 572 MGD
Upstream areas•Annual consumptive use: 99
MGD•Summertime consumptive
use: 134 MGD
Washington, DC

Average Daily Demand
485 mgd
Water mains + 14,500 mi
Fire hydrants ≈ 114,000
Metered accounts + 1,000,000
People served + 5,000,000
Regional Water Supply

How was the system established?
• WMA water supply was originally a Federal matter
• USACE, instructed by Congress
• Built the District of Columbia’s water supply system
• Conducted WMA water supply studies Washington Aqueduct/Cabin John Bridge, 1861

Growing water supply concerns
• 1966 - historic Potomac River low flow
• 1977 - severe drought in VA’s Occoquan watershed
• Forecasted shortages
0
200
400
600
800
1000
1920 1940 1960 1980 2000 2020
De
ma
nd
, M
GD
Actual WMA demand
Forecasted WMA demand*
*US Army Corps of Engineers (USACE), 1963
1966 Potomac
River low flow

Early institutional support
1940 Congress authorizes interstate compact
• Creates ICPRB
• Pollution was the original focus
• No regulatory powers
1970 Congress amends compact to include land & water resources
1979 ICPRB Section for Cooperative Water Supply Operations on the Potomac (CO-OP)
ICPRB enhances, protects, and conserves the water and associated land resources of the Potomac River basin through regional and interstate cooperation.

A sense of crisis
US Congress authorizes series of USACE studies
1979 US Senate hearings
1976 WRDA requires an emergency allocation agreement
1978 Low Flow Allocation Agreement (LFAA) specifies emergency water allocations

Cooperative solution drivers
• Supplier vulnerabilities- MD supplier: intake difficulties in 1966
- VA supplier: reservoir almost emptied in 1977
- DC supplier (USACE): most downstream intake
• Technical studies show cooperative operations benefits during drought
• Federal pressure
- Via permitting authority
- LFAA demand ‘freeze’ clause would penalize growth

OutcomeA framework for cooperation
New agreements
1982 Water Supply Coordination Agreement (WSCA)
Reservoir Cost-Share Agreements
Little Seneca Construction & O&M
Jennings Randolph Water supply storage, construction & O&M
Savage portion of O&M
2000 Drought Response Plan Metropolitan Washington Council of Governments (COG)
Two new reservoirs
Jennings Randolph Reservoir
Little Seneca Reservoir

How does the system operate today?• WSCA governs drought planning & operations
• Coordination of operations during droughts • Planning forecasts every 5 years• Construction of new resources when need arises• Technical & managerial support by ICPRB CO-OP Section
• LFAA specifies allocations in event of water shortages
• COG Drought Plan governs imposition of water use restrictions
1.E+02
1.E+03
1.E+04
1.E+05
1890 1910 1930 1950 1970 1990 2010
Log
flo
w
Potomac River at Point of Rocks, Maryland
1930 1966 1999, 2002
WSCA

Governance
• WSCA established an Operations Committee to oversee implementation
• Committee consists of General Managers from the 3 suppliers
• Decisions are made by consensus

Cost-sharing
• Fixed formula for ICPRB CO-OP support
• Fixed formulas for original shared reservoirs
• Growth-based formula for new storage – if it is needed 50%
30%
20%
Cost-share for Jennings Randolph capital/O&M
WSSC WA FW

WMA cooperative system
• Suppliers
• VA: Fairfax Water
• MD: Washington Suburban Sanitary Commission
• DC & VA: Washington Aqueduct Division of USACE
• Shared resources – 78%
• Potomac River
• Upstream reservoirs for low flow augmentation
• Individual resources – 22%
• Occoquan Reservoir (Fairfax Water)
• Patuxent reservoirs (WSSC)
Potomac River intakes
Patuxent reservoirs
Occoquan Reservoir
Little Seneca Reservoir
Jennings Randolph Reservoir
Savage Reservoir
West Virginia
Pennsylvania
Maryland
Virginia
District of
Columbia

Water supply added to ICPRB scope
Low Flow Allocation Agreement
ICPRB Section for Cooperative Water Supply Operations
Water supply storage at Jennings Randolph and Little Seneca
Water Supply Coordination Agreement
Water Supply Emergency Plan
Water Supply & Drought Response Plan
Potomac Drinking Water Source Protection Partnership
Regional Redundancy Study
NCR Water/Wastewater Agency Response Network
Emergency water supply planning
Updated source water assessment
Regional water system resiliency study
Long-term Cooperative Water Supply Planning & Management
1970
1978
1979
1982
1982
1994/04/09
2000
2004
2007
2008
2013-16
• Cooperative regional monitoring of source & finished water
• Collaborative training, exercises & contingency planning
• Regional communication & coordination

Regional vulnerabilities & options
WMA Water Supply Alternatives (ICPRB, 2017)
Drought vulnerability study
Regional Water Supply and Distribution System Resiliency (COG, 2016)
Water supply contamination event or outage vulnerability study

Water supply alternatives study
Driver 2015 planning forecasts indicated need for new resources
Objective Assess relative abilities of alternatives to meet challenges of growth and climate change
Alternatives 4 structural, 6 operational
Results 3 multi-step options

Recommended alternatives ability to meet forecasted July demands
300
475
650
825
1000
2040Baseline
Ops 5-8 Ops 5-8 +Vulcan 1
Ops 5-8 +Vulcan 1 +
Luck 1 +35% FCimprove.
Ops 5-8 +Vulcan 1 +
Travilah
RO plant +Vulcan 1 +
35% FCimprove.
RO plant
Avera
ge J
uly
dem
and,
MG
D
SSSY, CC50 SSSY, CC75 SSSY, CC90
2040 forecast
Option A
Option B
Option C

New challengesNew water supplies
• Dual purpose – drought & spills
• How will it be funded?
Broadening the cooperative system
• Revisions of WSCA?
• A new agreement?
• How can cost-sharing and governance be updated?
• Should states be involved?
Additional areas
• Source water protection
• Monitoring
• Collaborative research

DOING MORE WITH MANY: CASE STUDIES OF REGIONAL
COLLABORATIONAWWA RESEARCH PRESENTATION
TIFFANY TRAN
SEPTEMBER 24, 2018

ACKNOWLEDGEMENTS
• Co-Authors: Adam Carpenter and Pam Kenel
• Utility Support:
• DC Water
• Fairfax Water
• Loudoun Water
• Washington Aqueduct (USACE)
• Washington Suburban Sanitary Commission
• All agencies that participated in interviews

RESEARCH PROJECT SCOPE
Regional collaboration can have many benefits. What are the
mechanisms that make it possible?
Research Questions:
1. What are the drivers that motivate regional collaborative groups?
2. How do they govern themselves and make decisions on shared goals
or projects?
3. How do they equitably fund the implementation of these decisions?

Literature Review
Research of Publicly
Available Documents
Outreach via e-mail or
phone
30-45 minute phone
interview
Follow-up questions
Write-up/ Presentation
METHODS

WHERE IN THE WORLD?
6 Partnerships
6 Projects
18 States
15+ Million People Served
= Approximate location

TASK OF COMPARING

TYPES OF COLLABORATIONS
1. Planning and Management Partnerships
2. Collaborative Projects

PLANNING AND MANAGEMENT PARTNERSHIPS
Partnerships can occur within watershed boundaries or political ones. Can be regulatory
and are shaped around shared management goals.
Organization/Project Name Acronym LocationNumber of Members
Range of Populations Served
Coordination Level Shared Investment Value
Ohio River Valley Water Sanitation Commission ORSANCO Ohio River Basin 9 Basin Population Interstate + Federal $3.3 million FY Budget
Delaware River Basin Commission DRBC Delaware River Basin 5 Basin Population Interstate + Federal $4.2 million FY Budget
Catawba-Wateree Water Management Group CWWMGCatawba-Wateree
River Basin20 Up to 1,000,000 Interstate $550,000 (Annual Dues)
Yadkin-Pee Dee Water Management Group YPDWMGYadkin-Pee Dee River
Basin18 3,000 - 1,000,000 Interstate $87,500 (Annual Dues)
Middle Rio Grande Stormwater MS4 Compliance Monitoring Cooperative
CMC New Mexico 12 1,000 - 550,000 Interagency $132,000
Municipal Water District of Orange County MWDOC California 32 25,000 - 2,500,000 Interagency varies widely

COLLABORATIVE PROJECTS
Collaboration is spurred by an opportunity to create, join, or expand a current
project. The addition of regional partners increases net benefits.
Organization/Project Name Acronym LocationNumber of Members
Range of Populations ServedService Area Population
Shared Investment Value
Logan-Todd Regional Water Commission LTRWC Kentucky, Tennessee 12 300 - 12,500 40,000 $77.5 million
Alliance Water n/a Texas 4 13,000 - 135,000 170,000 $300 million
Long Creek Regional Wastewater Treatment Plant LCRWTP North Carolina 3 10,000 - 1,000,000 1 million $300 million
Ship Canal Water Quality Project n/a Washington 2 630,000 - 1,700,000 2.3 million $570 million
Water Infrastructure and Supply Efficiency Partnership WISE Colorado 3 320,000 - 1,400,000 2 million $650 million
Los Vaqueros Reservoir Expansion Project LVE California 15 Agricultural - 2,700,000 6 million $980 million

COMMON DRIVERS FOR COLLABORATION
1. Increased or forthcoming regulatory pressure
2. Shared regional concerns or issues
3. Potential for cost savings through achieving economies of scale,
reducing duplicative efforts
4. Increased funding opportunities

TYPES OF GOVERNANCE / DECISION MAKING
Governing Board
of Representatives
Equal representation Proportion-based
representation
Population within
service area
50-year demand
forecast
Staff driven
decision-making
Lead Agency

FINANCIAL STRUCTURE / COST ALLOCATION
Equal cost-share
across all parties
Cost of services /
service level
Proportion based
cost-share
Watershed Area Watershed
Population
50-year demand
forecast
Proportion of
avoided cost

INTERESTING CASE STUDIES
Governance and cost-share mechanisms differ:
1. ORSANCO and Catawba-Wateree MWG
2. Ship Canal Project
3. Long Creek Regional WTP and WISE Partnership
COMMON FACTORS FOR SUCCESS
• Have a forum for regular communication among agencies.
• Build relationships and trust between agencies.
• Conduct studies to understand the shared water space, possibilities
for collaboration.
• Regulatory agencies can be a useful resource.
• Built to last and adjustable over time, make room for reopeners.

If you want to go fast, go alone.
If you want to go far, go together.
-African proverb
If you want to solve a localized issue, go alone.
If you want to address a regional issue by pooling resources to fully leverage
existing capital and assets, use regional collaboration.
-generous interpretation of African proverb

AWWA Regional Collaboration
September 24, 201836

AWWA Webinar September 24, 2018
37
Los Vaqueros Reservoir
• Off-stream reservoir in Contra Costa County
• Operated in conjunction with four Delta
intakes
• Capacity of 160 TAF
• Uses:
➢ Water quality
➢ Drought storage
➢ Emergency storage
➢ Flood control
➢ Recreation

AWWA Webinar September 24, 2018
38
• 20,000-acre watershed managed by CCWD for protection of:➢ Water quality
➢ Sensitive species and habitat
• CCWD also manages more than 5,000 acres of mitigation properties:➢ Contra Costa
➢ Alameda
➢ San Joaquin
Los Vaqueros Reservoir
Marina

AWWA Webinar September 24, 2018
39
Long History on Project
CCWD financed and implemented
➢ 1998 dam, intake, and conveyance construction
➢ 2009 new intake
➢ 2012 dam raise
Completed on schedule and on budget
September 27, 2011

AWWA Webinar September 24, 2018
40
Proposed Los Vaqueros Reservoir Expansion Project
What are the objectives?• Environmental Water• Water Supply Reliability• Improved Water Quality• Enhanced Recreation
Who will benefit?• San Joaquin Wildlife Refuges
• Bay Area Water Agencies
• South-of-Delta CVP Contractors
• Statewide Water System
How will benefits be achieved?• Construct new pipelines, new pump stations, raise the dam
• Re-operate existing facilities
• Integrate regional systems
• Coordinate with other state-wide water operations
San Joaquin River National Wildlife Refuge
AWWA Webinar September 24, 2018
41
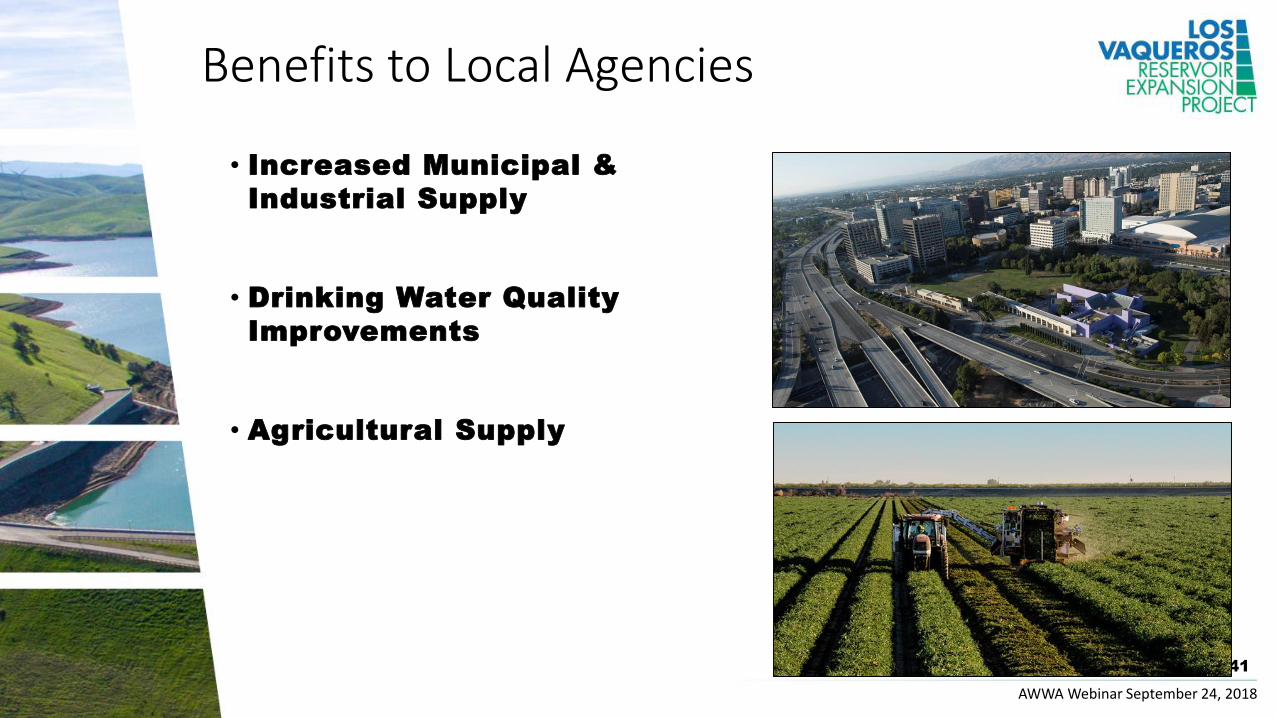
Benefits to Local Agencies
• Increased Municipal &
Industrial Supply
• Drinking Water Quality
Improvements
• Agricultural Supply

AWWA Webinar September 24, 2018
42
Local Agency Partners
1. Alameda County Water District
2. Bay Area Water Supply and Conservation Agency
3. Byron-Bethany Irrigation District
4. City of Brentwood
5. East Bay Municipal Utility District
6. East Contra Costa Irrigation District
7. Grassland Water District
8. San Francisco Public Utilities Commission
9. San Luis & Delta-Mendota Water Authority
10. Santa Clara Valley Water District
11. Zone 7 Water Agency
12. Del Puerto Water District
13. San Luis Water District
14. Westlands Water District
Additional agencies on a waiting list

AWWA Webinar September 24, 2018
43
Federal Feasibility Findings
Bureau of Reclamation determined:
• Technically and environmentally feasible
• Economically feasible➢ Benefit/Cost (B/C) ratio = 1.25
• Financially feasible➢ M&I and agricultural beneficiaries have financial ability to
pay
• Resilient: maintains its benefits under➢ Wide range of climate change scenarios
➢ California WaterFix

AWWA Webinar September 24, 2018
44
Existing Agreements
•MOU with local, state and federal agencies (2001)
•Cost Share MOU with Reclamation (2015)
• Individual Funding Agreements with LAPs (2017)
•Various agreements with EBMUD for use of
existing intertie
•Permits and water rights

AWWA Webinar September 24, 2018
45
Key Decision Milestones
•Execute Multi-party Agreement – Fall 2018
• CCWD and Local Agency Partners (LAPs)
•Execute Early Funding Agreement – Fall 2018
• CCWD and California Water Commission
•Partners & CCWD negotiate key terms of costs and
governance – Winter 2018/2019
•Commitment to form Joint Powers Authority (JPA) –
Spring 2019
•Execute JPA agreement and file paperwork with State
– Summer 2019

AWWA Webinar September 24, 2018
46
Other Agreements
• MOU with DWR
• Construction easement to tie Transfer-Bethany Pipeline into
California Aqueduct
• Conveyance agreement (use of California Aqueduct and South Bay
Aqueduct)
• Coordinated operations agreement
• Monitoring for public benefits (required by Prop. 1)
• Changes to State Water Project water rights
• MOU with Reclamation
• Long term contract with Refuge Water Supply Program
• Coordinated operations agreement
• Changes to Central Valley Project water rights
• Agreements with LAPs to backstop CCWD’s water
supply during construction

AWWA Webinar September 24, 2018
47
Near Term Activities

AWWA Webinar September 24, 2018
48
Thank you
Questions?
Project Informationhttp://www.ccwater.com/lvstudies
Contact InformationMarguerite Patil
Contra Costa Water
District
P.O. Box H20
Concord, CA 94524
(925) 688-8018
Maureen Martin
Contra Costa Water
District
P.O. Box H20
Concord, CA 94524
(925) 688-8323

AWWA Webinar September 24, 2018
49
Proposed Facilities
• New Neroly High-Lift Pump Station
• EBMUD system improvements for increased use of EBMUD-CCWD Intertie
• New Delta-Transfer Pipeline
• Expanded Transfer Facility
• New Transfer-Bethany Pipeline
• Expanded reservoir capacity of 275 TAF
• Enhanced recreation facilities
Contra Costa Water District 5/30/17
Contra Costa Canal
Expanded Los Vaqueros
Reservoir
Mokelumne Aqueduct
Possible New Facilities
Existing Facilities
Clifton Court Forebay
Delta-Transfer Pipeline
Old River Pipeline Expanded Transfer Facility
EBMUD Intertie Pump Station
EBMUD Walnut Creek Pump Plant VFDs

AWWA Webinar September 24, 2018
50
275-TAF Dam

AWWA Webinar September 24, 2018
51
Other Options Available to Partners
LVE provides a cost-competitive option, close to home, with higher reliability, certainty, and flexibility
Local Bay Area Supply Alternatives Cost ($ / AF)
SFPUC’s 2017-18 wholesale water rate $1800 (treated), $1600 (untreated)
Water Transfers (below normal years, TRD) (2030-2045) $267 - $632
* Local Groundwater (extraction, treatment, replenishment) $400 - $1,600
** Stormwater Capture and Recharge $570 - $1,600
** Recycled Water $1,500 - $9,000
** Advanced Water Purification (Potable Reuse) $1,600 - $2,700
** Desalination $1,000 - $5,500
Phase 2 LVE Project (capital, O&M) $580 ($300 - $700)(not including emergency storage)
* ACWD, SCVWD, and SFPUC (2018)
** Pacific Institute (2016) and SFPUC (2018)

CONTACTS
Marguerite Patil
Contra Costa Water
District
Lisa Ragain
Metropolitan Washington
Council of Governments
Cherie Schultz
Interstate Commission on
the Potomac River Basin
Maureen Martin
Contra Costa Water
District
Tiffany Tran
American Water Works
Association
Adam Carpenter
American Water Works
Association
Pamela Kenel
Loudoun Water