Potentiometric Sensor for the Determination of Povidone-Iodineabechem.com/No....
12
Anal. Bioanal. Electrochem., Vol. 6, No. 3, 2014, 367-378 Full Paper Potentiometric Sensor for the Determination of Povidone-Iodine Zholt Kormosh 1,* , Tanya Savchuk 1 , Yaroslav Bazel 2 , Nataliya Kormosh 3 and Svitlana Zyma 1 1 Eastern European National University, Voli ave., 13, 43025 Lutsk, Ukraine 2 P.J. Safarik University, Moyzesova st., 11, 04154 Kosice, Slovakia 3 Lutsk Base Medical College, Lesya Ukraika blv., 2, 43000 Lutsk, Ukraine *Corresponding Author, Tel.: +380332249972; Fax: +380332241007 E-Mails: [email protected] and [email protected] Received: 20 September 2013 / Received in Revised form: 10 May 2014 / Accepted: 23 May 2014/ Published online: 30 June 2014 Abstract- The triiodide-selective sensor with a PVC membrane containing ion pair of methyl violet triiodide as electro-active substance was developed. The operating рН range of the triiodide sensor is 2–12. The linearity ranges of triiodide sensor function are 9×10 -6 –1×10 -1 M, the sensor super Nernstian slope are 76 mV/decade. The efficiency of the use of sensor for povidone-iodine determination was shown by potentiometric titration methods. Keywords- Ionic associates, Triiodide sensor, Potentiometric titration, Povidone-iodine determination 1. INTRODUCTION The successful application of potentiometry as an analysis method is related in the recent years to the development and practical use of ion-selective electrodes with plasticized polymer membranes. Due to relative simplicity of the principles of the creation of these electrodes and the availability of the manufacturing technology, the realization of fundamentally new opportunities requires more theoretical research both on the nature of the Analytical & Bioanalytical Electrochemistry © 2014 by CEE www.abechem.com
Transcript of Potentiometric Sensor for the Determination of Povidone-Iodineabechem.com/No....
Anal. Bioanal. Electrochem., Vol. 6, No. 3, 2014, 367-378
Full Paper
Potentiometric Sensor for the Determination of
Povidone-Iodine
Zholt Kormosh1,*
, Tanya Savchuk1, Yaroslav Bazel
2, Nataliya Kormosh
3 and
Svitlana Zyma1
1Eastern European National University, Voli ave., 13, 43025 Lutsk, Ukraine
2P.J. Safarik University, Moyzesova st., 11, 04154 Kosice, Slovakia
3Lutsk Base Medical College, Lesya Ukraika blv., 2, 43000 Lutsk, Ukraine
*Corresponding Author, Tel.: +380332249972; Fax: +380332241007
E-Mails: [email protected] and [email protected]
Received: 20 September 2013 / Received in Revised form: 10 May 2014 /
Accepted: 23 May 2014/ Published online: 30 June 2014
Abstract- The triiodide-selective sensor with a PVC membrane containing ion pair of methyl
violet triiodide as electro-active substance was developed. The operating рН range of the
triiodide sensor is 2–12. The linearity ranges of triiodide sensor function are 9×10⁻⁶–1×10⁻¹
M, the sensor super Nernstian slope are 76 mV/decade. The efficiency of the use of sensor for
povidone-iodine determination was shown by potentiometric titration methods.
Keywords- Ionic associates, Triiodide sensor, Potentiometric titration, Povidone-iodine
determination
1. INTRODUCTION
The successful application of potentiometry as an analysis method is related in the recent
years to the development and practical use of ion-selective electrodes with plasticized
polymer membranes. Due to relative simplicity of the principles of the creation of these
electrodes and the availability of the manufacturing technology, the realization of
fundamentally new opportunities requires more theoretical research both on the nature of the
Analytical &
Bioanalytical Electrochemistry
© 2014 by CEE
www.abechem.com
Anal. Bioanal. Electrochem., Vol. 6, No. 3, 2014, 367-378 368
selectivity of the electrode membrane and the determination of the composition and
properties of ion associates that these membranes are composed of. A challenge of the
determination of important chemical-analytical properties of the developed sensor samples is
of interest. Due to their versatility, the potentiometric sensors of this kind occupy the leading
place among electrochemical sensors for the analysis of various objects, and the field of their
application constantly widens [1]. The development of scientific approaches in this direction
is far from completion. The main challenges are caused by the absence of a theory that would
forecast the structure of an ionophore for the creation of a sensor with pre-set
electroanalytical properties. A substantial role in this challenge may be played by the
determination of the interrelation of physico-chemical properties of the electrode-active
component (EAC) (formation, association, distribution constants, thermal behavior etc.) and
electroanalytical characteristics of the sensor membranes based on these components.
2. EXPERIMENTAL SECTION
2.1. Reagents and solutions
All chemicals were of analytical-reagent grade. Twice-distilled water was used to prepare
all solution and in all experiments. Dibutylphtalate (DBP), dioctylphtalate (DOP),
dinonylphtalate (DNP), dibutylsebacate (DBS), tricresylphosphate (TCP), cyclohexanone
(CHN), high molecular weight polyvinylchloride (PVC) were obtained from Sigma-Aldrich.
Methyl violet (MV) was purchased from Merck.
Standard thiosulfate solution, 1×10⁻¹
M, prepared from Na2S2O3·5H2O and standardized
with potassium iodate solution.
Standard iodine (triiodide) solution, 1×10⁻¹
M, prepared from of 40 g KI and 12.7 g of I2,
dissolved in 500 ml of twice-distilled water and standardized with thiosulfate solution.
Working solutions were prepared by dilution of the corresponding standard solutions.
Triiodide solutions used for the sensor characterization and analytical determinations (1×10⁻⁸
–1×10⁻¹
M) were prepared daily from the stock solution, diluting the required volume with
0.2 M KI and using 50 mL volumetric flasks.
The stock solution of the basic dye Methyl violet (Fig. 1) with a concentration of 1×10⁻²
M was prepared by dissolving an accurately weighed portion of dye, which was recrystallized
from methanol, in twice-distilled water.
The ionic strength of the solutions was adjusted with 0.2 M KI solution. The pH value of
solutions was maintained with the use of a buffer mixture (0.04 M CH3COOH, H3BO3,
H3PO4, and a 0.2 M NaOH solution) and controlled potentiometry with a glass electrode.

Anal. Bioanal. Electrochem., Vol. 6, No. 3, 2014, 367-378 369
2.2. Preparation of ion-pair and membrane for sensor
The ion-pair was preparing by mixing 1×10⁻² M solutions of Methyl violet and triiodide
in a ratio of 1:1. The resulting solution was settled for 2 h, and the sediment of ion-pair was
filtered out (quantitative rapid filter paper). This residue was treated with 50 mL of cold
distilled water. The filter paper containing the precipitate was then dried for 24 h at room
temperature. This IPs (low solubility in water and good solubility in membrane plasticizers,
along with ion-exchange properties) were used as an electrode-active material for preparing
membranes of triiodide sensor.
The generally accepted technique of plasticized membrane: the consists of thorough
mixing of the electrode-active substance with PVC dissolved in cyclohexanone or
tetrahydrofuran followed by the evaporation of the solvent in a glass ring. We weighed 0.1 g
PVC and the respective amount of isolated IP (such that its concentration in the membrane
was 5–25 mass%), then mixed the materials thoroughly for homogenizing. The degree of
materials homogeneity was estimated from photomicrographs obtained with a LEICA VMHT
Auto microhardness tester. Afterwards, 0.1 mL of a plasticizer (DBP, DBS, DOP, DNP or
TCP) and 0.5 mL of solvent (cyclohexanone or tetrahydrofuran) were added. The resulting
solution was transferred into a previously polished glass form 1.7 cm in diameter, glued to
the glass substrate, and dried in air for 1–2 days.
The films obtained after evaporation of the solvent were cut using a rubber cork cutter
into disks of 0.5–1.0 cm diameter. These were then glued to the end of the PVC tube with
10% PVC solution in cyclohexanone. The tube was filled with the concentrated standard
triiodide solution (1×1 0–2 M), and a copper wire was immersed into it. The sensor was then
used for the investigation.
2.3. Apparatus
All EMF measurements were carried out with the following cell assembly. An I-160 M
and AI-123 model pH-mV meter with an EVL-1MZ silver-silver chloride reference electrode
was used for the measurements of potential difference at 25.0±1.0 ºC.
The electronic absorption spectra of solution were measured on an SF-2000 spectrophoto-
meter (LOMO, RUSSIA) over a range of 450-750 nm.
The IR spectra were measured on an AVATAR 330 FT-IR instrument (Thermo Nicolet).
The thermal studies (TG, DTG and DTA) were carried out on an apparatus for complex
dynamic thermal analysis–MOM derivatograph (Hungary) under the following conditions:
temperature range 20–900 °C, heating rate 5 K/min, sample weight 36 mg, static air medium,
channel sensitivities: DTA–150 mV, TG–50 mV.

Anal. Bioanal. Electrochem., Vol. 6, No. 3, 2014, 367-378 370
2.4. Procedure of real samples analysis
The content of povidone-iodine in pharmaceutical preparations "Jox" and "Betadyne" was
determined.
The determination of povidone-iodine in "Jox" formulation was performed as follows: a
2–5 ml aliquot of the preparation was taken, then 0.2 M KI solution and 2 ml 2 М H2SO4
solution were added. The triiodide sensor and Ag/AgCl reference electrode were immersed
into the solution which was then titrated with 1×10⁻³
M Na2S2O3 solution.
"Betadyne" preparation comes as suppositories. The determination of povidone-iodine
was performed as follows: the suppositories were placed in a heat-resistant beaker, added 20
ml bidistilled water and heated to the dissolution of the preparation. After the solution cooled,
we added 0.2 M KI solution and 2 ml 2 М H2SO4 solution, immersed the triiodide sensor and
the reference electrode, and then titrated with 1×10⁻³ M Na2S2O3 solution.
3. RESULTS AND DISCUSSION
The association constant was calculated for the ion pair (IP) of methyl violet triiodide
МV+І3
–, numerically expressed as log Kas=3.56.
N+(CH
3)2
N(CH3)2
(CH3)2N
Fig. 1. The chemical structure of Methyl violet
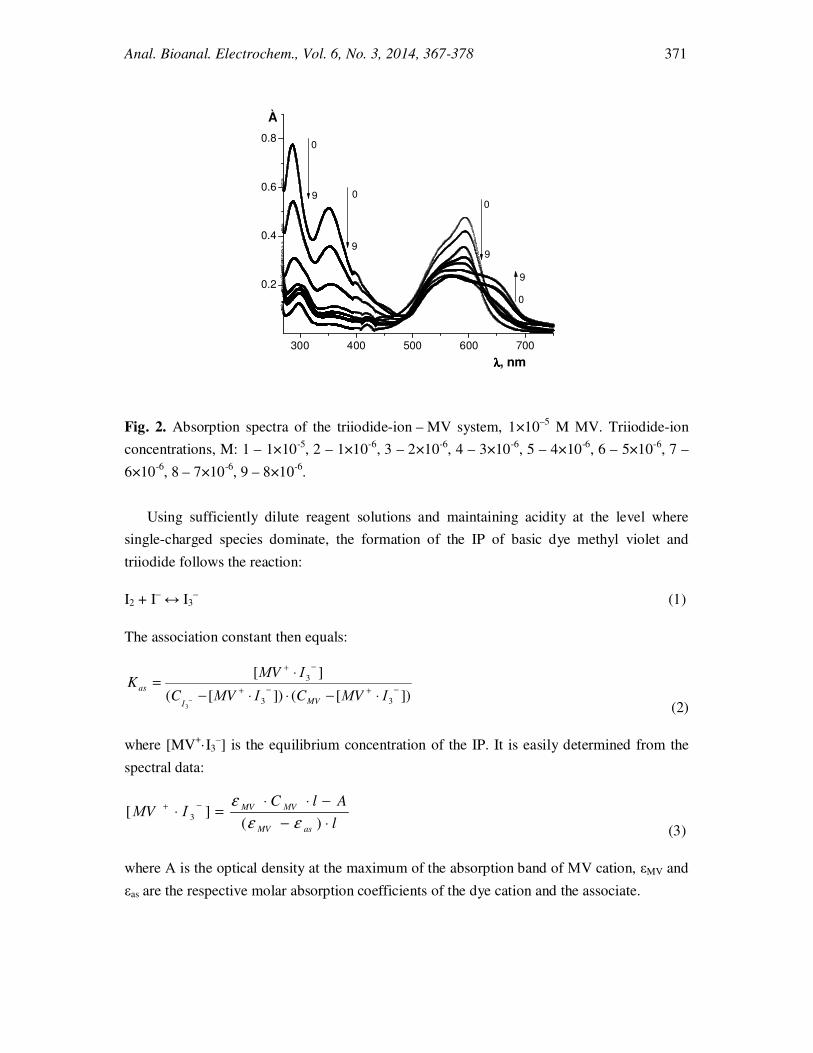
The increase of triiodide content at the constant dye concentration leads to the decrease of
intensity and the bathochromic shift of the absorption band of the basic dye.
Such a character of the spectral lines indicates the formation of IP in the aqueous phase
[2]. Absorption spectra of the aqueous solutions of IP and the dye are presented in (Fig. 2).
Anal. Bioanal. Electrochem., Vol. 6, No. 3, 2014, 367-378 371
300 400 500 600 700
0.2
0.4
0.6
0.8
0
00
9
99
λλλλ, nm
À
0
9
Fig. 2. Absorption spectra of the triiodide-ion – MV system, 1×10⁻⁵
M МV. Triiodide-ion
concentrations, M: 1 – 1×10⁻⁵, 2 – 1×10⁻⁶, 3 – 2×10⁻⁶, 4 – 3×10⁻⁶, 5 – 4×10⁻⁶, 6 – 5×10⁻⁶, 7 –
6×10⁻⁶
, 8 – 7×10⁻⁶
, 9 – 8×10⁻⁶
.
Using sufficiently dilute reagent solutions and maintaining acidity at the level where
single-charged species dominate, the formation of the IP of basic dye methyl violet and
triiodide follows the reaction:
I2 + I– ↔ I3– (1)
The association constant then equals:
])[(])[(
][
33
3
3
−+−+
−+
⋅−⋅⋅−
⋅=
− ІМVCІМVC
ІМVK
MVІ
as
(2)
where [MV+· I3
–] is the equilibrium concentration of the IP. It is easily determined from the
spectral data:
l
AlCІМV
asMV
МVMV
⋅−
−⋅⋅=⋅
−+
)(][ 3
εε
ε
(3)
where А is the optical density at the maximum of the absorption band of МV cation, εMV and
εas are the respective molar absorption coefficients of the dye cation and the associate.

Anal. Bioanal. Electrochem., Vol. 6, No. 3, 2014, 367-378 372
IR spectroscopy of the methyl violet–triiodide IP was performed. Determined values of the
vibration frequencies in the IR spectrum of the synthesized IP (Fig. 3) were compared to
those of the dye spectrum and the tabulated data [3,4].
IR spectra of MV feature a strong band at 3500–3100 cm–1 with a maximum at 3480 cm–1
that corresponds to symmetrical and asymmetric vibrations of amine group ν(N–H). A band
at 1400 cm–1, 1390 cm–1, 1170 cm–1 feature three strong and medium peaks that correspond
to valence vibrations ν(С–N) which agrees with the tabulated absorption in the range of
ν(С–N) = 1280–1180 cm–1.
Fig. 3. IR spectra of МV (1) and ion-pair (2)
Thermal behavior of obtained IP was investigated by differential thermal analysis that
would show the thermal stability and the character of the decomposition of the complexes [5–
9].
The thermolysis of MV+І3
– IP undergoes three stages that fit a theoretical interpretation.
The thermogram is shown in (Fig. 4), and its computation is presented in Table 1.
Thermal decomposition starts above 170 ºC and is accompanied by the loss of mass and
the discharge of the decomposition products. This is followed by carbonization and
combustion of the IP which is shown at the thermogram by large exothermal effects at 485

Anal. Bioanal. Electrochem., Vol. 6, No. 3, 2014, 367-378 373
and 530 ºC and a significant loss of mass. A large amount of amorphous carbon remained as
black plaque at the walls of the crucible in which the thermolysis reaction took place.
TG
DTA
DTG
T
3080100
140192 230
245
285310
350
400
445485
530565
565
630
690
750
860870
580485
485
350
300
245225
175
930
Fig. 4. Simultaneous TG, DTA and DTG curves of the IP МV+І3
– in air
It is considered that the ionic permeability of the membrane electrodes is defined by the
nature of the EAS and the membrane plasticizer-solvent, and the matrix plays the role of an
inert structure-forming element. Therefore the optimization of the electroanalytical
characteristics of the developed sensor centered on the investigation of the effects of the
membrane composition (EAS content), рН of medium, nature and content of the plasticizer
solvent, response time etc.
We have discovered that the best electroanalytical properties are exhibited by the sensors
with membranes plasticized by DNP, DOP, DBP and TCP, with the electrode function slope
close or equal to the theoretical value of Nernstian function for the single-charged ions (Table
2). The super Nernstian slope has been obtained (76 mV/decade) because possible of the
conjugate ion exchange and red-ox processes (I3-+2e-=3 I-) will resume in the membrane
phase.
DBS-plasticized sensors show somewhat poorer characteristics. The study of the effect of
EAS content in the membrane showed that the electrode function slope is steady in the range
of 7–15% of EAS (Table 2). Certain small changes were noted in the detection limit values

Anal. Bioanal. Electrochem., Vol. 6, No. 3, 2014, 367-378 374
which are n×10–4–n×10–5 M triiodide. The study of the effect of the plasticizer content proved
that the optimal amount is 55–65% of the plasticizer (Table 2).
Table 1. Data of DTA curve of the ion associate МV+І3
– and decomposition products
Ion associate Temperature
range, °С tmax, °С
Loss of mass, %
Decomposition
products
Experimental Decomposition
products
3NH3 + CH4 +
2C2H4
(12С + 3Н + 3І)
C24H28N3+ І3
–
МV+І3
–
170 – 285
285 – 350
350 – 800
205 endo
310 exo
485 exo
530 exo
16.36
10.91
61.36
16.67
71.41
Total loss of mass
88.63 88.08 7С
The effect of the background electrolyte concentration was also investigated. Its increase,
in principle, does not affect the electrode characteristics of the system. Generally, the nature
and concentration of the background electrolyte are very important in the measurement of the
electrode potential. The anion must not compete with the potential-defining anion for the
place in the membrane [10].
We also determined the mean time necessary for the membrane electrode potential to
reach the value within ±2 mV of the final equilibrium value. The sensor response time is 2–3
s for the triiodide concentration in the range of 10–4
–10–1
M and 5–6 s for the 10–6
–10–5
M І3–
solutions (Fig. 5). Upon reaching the equilibrium, the value of the potential remains constant.
The sensor lifetime is mainly determined by the frequency of its use and averages 10
months from the manufacture date.
The effect of pH on main electroanalytical characteristics of the triiodide sensors was
investigated. This factor has the greatest effect on the operation of most all electrodes, due to
the chemical processes involving the membrane components, e.g. the triiodide-determining
substance, and Н3О+ or ОН
– ions. The acidity of the medium affects also the state of IP and
other membrane components. The parallel protolytical processes at the membrane–solution
interface are quite complex in description. Generally, the operating range of the sensors is
determined by the components of the IP.
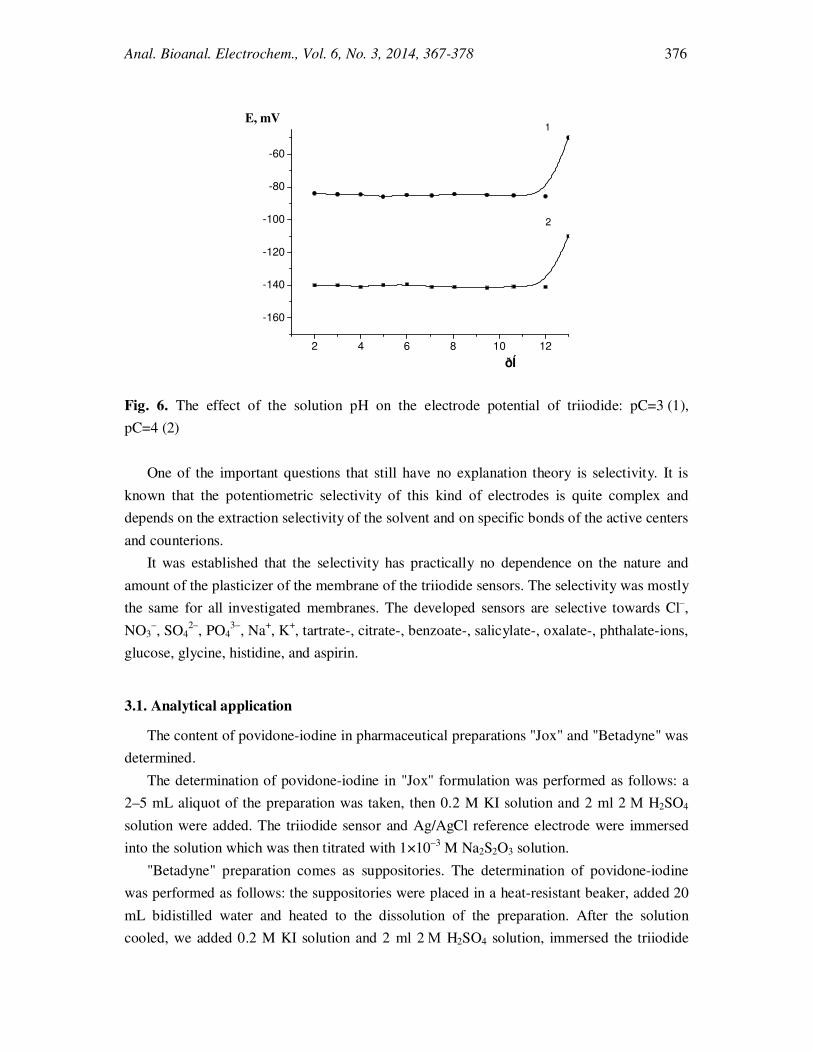
The study of the dependence of electrochemical properties of triiodide sensors for the
investigated system (МV+І3
–) on рН showed that the slope of the calibration curves retains
constant value in a wide pH range of 2–12 (Fig. 6).

Anal. Bioanal. Electrochem., Vol. 6, No. 3, 2014, 367-378 375
0 50 100 150 200
-250
-200
-150
-100
-50
0
50
10-1M
10-2M
10-3M
10-4M
10-5M
10-6M10
-7M
50 mV
E, mV
t, s
Fig. 5. Sensor response time for various triiodide concentrations
Table 2. Effect of EAS content, plasticizer content and plasticizer nature on main
electroanalytical characteristics of the developed sensors
EAS content, % Plasticizer, content, % Slope,
mVpC–1
Linearity range, M Low detection limit, M
5
DNP, 65
66±1 1×10⁻⁴
– 1×10⁻¹
3.6×10⁻⁵
7 52±1 1×10⁻⁵ – 1×10⁻¹ 2.4×10⁻⁶
9 62±1 1×10⁻⁵
– 1×10⁻¹
7.5×10⁻⁶
10 73±1 1×10⁻⁵ – 1×10⁻¹ 6.9×10⁻⁶
12 63±1 1×10⁻⁵
– 1×10⁻¹
1.2×10⁻⁶
15 62±1 1×10⁻⁵ – 1×10⁻¹ 3.5×10⁻⁶
10
DBS, 65
41±1
1×10⁻⁵ – 1×10⁻¹
1.9×10⁻⁶
DNP, 65 73±1 9×10⁻⁶
– 1×10⁻¹
1.5×10⁻⁶
DBP, 65 50±1 9×10⁻⁵ – 1×10⁻¹ 6.1×10⁻⁵
TCP, 65 60±1 9×10⁻⁶
– 1×10⁻¹
2.8×10⁻⁶
DOP, 65
50±1 9×10⁻⁵ – 1×10⁻¹ 6.5×10⁻⁵
10
DNP, 35 50±1 1×10⁻⁵ – 1×10⁻¹ 4.6×10⁻⁶
DNP, 45 53±1 9×10⁻⁶
– 1×10⁻¹
5.2×10⁻⁶
DNP, 55 76±1 1×10⁻⁵ – 1×10⁻¹ 4.1×10⁻⁶
DNP, 65 73±1 9×10⁻⁶
– 1×10⁻¹
1.5×10⁻⁶
Anal. Bioanal. Electrochem., Vol. 6, No. 3, 2014, 367-378 376
2 4 6 8 10 12
-160
-140
-120
-100
-80
-60
ðÍ
E, mV1
2
Fig. 6. The effect of the solution pH on the electrode potential of triiodide: pC=3 (1),
pC=4 (2)
One of the important questions that still have no explanation theory is selectivity. It is
known that the potentiometric selectivity of this kind of electrodes is quite complex and
depends on the extraction selectivity of the solvent and on specific bonds of the active centers
and counterions.
It was established that the selectivity has practically no dependence on the nature and
amount of the plasticizer of the membrane of the triiodide sensors. The selectivity was mostly
the same for all investigated membranes. The developed sensors are selective towards Cl–,
NO3–, SO4
2–, PO4
3–, Na
+, K
+, tartrate-, citrate-, benzoate-, salicylate-, oxalate-, phthalate-ions,
glucose, glycine, histidine, and aspirin.
3.1. Analytical application
The content of povidone-iodine in pharmaceutical preparations "Jox" and "Betadyne" was
determined.
The determination of povidone-iodine in "Jox" formulation was performed as follows: a
2–5 mL aliquot of the preparation was taken, then 0.2 M KI solution and 2 ml 2 М H2SO4
solution were added. The triiodide sensor and Ag/AgCl reference electrode were immersed
into the solution which was then titrated with 1×10⁻³ M Na2S2O3 solution.
"Betadyne" preparation comes as suppositories. The determination of povidone-iodine
was performed as follows: the suppositories were placed in a heat-resistant beaker, added 20
mL bidistilled water and heated to the dissolution of the preparation. After the solution
cooled, we added 0.2 M KI solution and 2 ml 2 М H2SO4 solution, immersed the triiodide

Anal. Bioanal. Electrochem., Vol. 6, No. 3, 2014, 367-378 377
sensor and the reference electrode, and then titrated with 1×10⁻³ M Na2S2O3 solution. The
results are given in Table 3.
Based on obtained results, we developed a new sensitive, selective, simple technique of
the potentiometric determination of povidone-iodine that was approbated in its determination
in pharmaceuticals. One can see in Table 3 that F*tabl=9.55>F; t*tabl=4.3020>t, confirming
that the developed technique has good metrological characteristics and provides a possibility
of the determination of povidone-iodine in complex pharmaceutical preparations.
Table 3. Results of the determination of povidone-iodine in pharmaceuticals (n=3; P=0.95)
Name,
manufacturer
Stated content Potentiometric titration with triiodide
sensor
Comparison method
X ∆X S2 t F X ∆X S
2
"Jox", Teva
Czech ndustries
4.25g in 50 mL 4.13 0.1 0.0016 3.5712 9.12 3.88 0.3 0.0146
"Betadyne"
Alkaloid
AD-Skopje
200 mg 198.7 0.2 0.0049 4.0195 8.26 197.2 0.5 0.0405
4. CONCLUSIONS
The triiodide-selective sensor with a PVC membrane containing ion pair of methyl violet
triiodide was developed. The operating рН range of the triiodide sensor is 2–12. The linearity
ranges of triiodide sensor function are 9×10⁻⁶
–1×10⁻¹
M. Obtained electroanalytical
characteristics of the sensors indicate their efficient application as indicator electrodes, for
instance, in the potentiometric determination of povidone-iodine in pharmaceuticals.
Acknowledgement
This study was supported by Ministry of Science and Education of Ukraine.
REFERENCES
[1] V. V. Yegorov, Rus. Khim. Zhurn 2 (2008) 37.
[2] A. A. Ishchenko, and S. A. Shapovalov, Appl. Spectros. 71 (2004) 602.
[3] K. Nakanishi, Infrared spectra and the structure of organic compounds. Mir, Moscow
(1965).

Anal. Bioanal. Electrochem., Vol. 6, No. 3, 2014, 367-378 378
[4] K. Nakamato, Infrared spectra of inorganic and coordination compounds. Mir, Moscow
(1966).
[5] D. I. Semenyshyn, V. V. Kochubei, and O. Y. Borova, Russian J. Coord. Chem. 29
(2003) 196.
[6] V. T. Yilmaz, and A. Karadag, Termochim. Acta 348 (2000) 121.
[7] S. A. Wentworth, and J. H. Sharp, Anal. Chem. 42 (1970) 1297.
[8] S. I. Ali, and M. Kowsar, Termochim. Acta 311 (1998) 173.
[9] S. I. Ali, Termochim. Acta 317 (1998) 183.
[10] R. P Buck, and E. Linder, Pure Appl. Chem. 66 (1994) 2527.
Copyright © 2014 by CEE (Center of Excellence in Electrochemistry)
ANALYTICAL & BIOANALYTICAL ELECTROCHEMISTRY (http://www.abechem.com)
Reproduction is permitted for noncommercial purposes.