
MANUAL DE OPERACIONES DEL COMPONENTE ZONAL SITP (ZONAL) V6.pdf
Upload
reginald-harringtonCategory
view
215download
0
Potential temperature(oC, Levitus 1994)
Surface
Global zonal mean
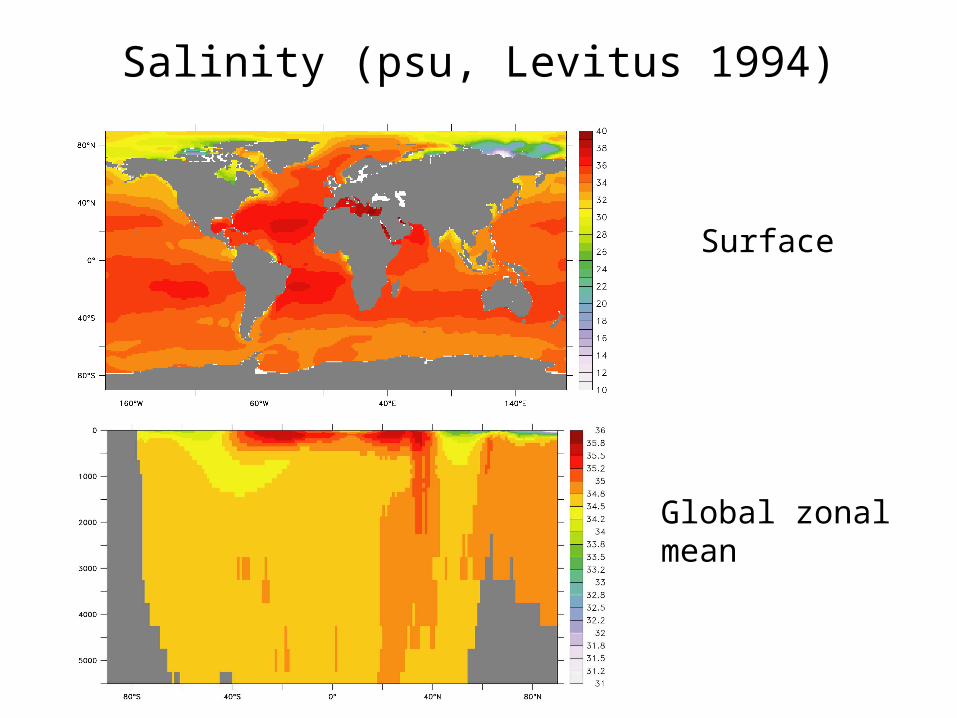
Salinity (psu, Levitus 1994)
Surface
Global zonal mean
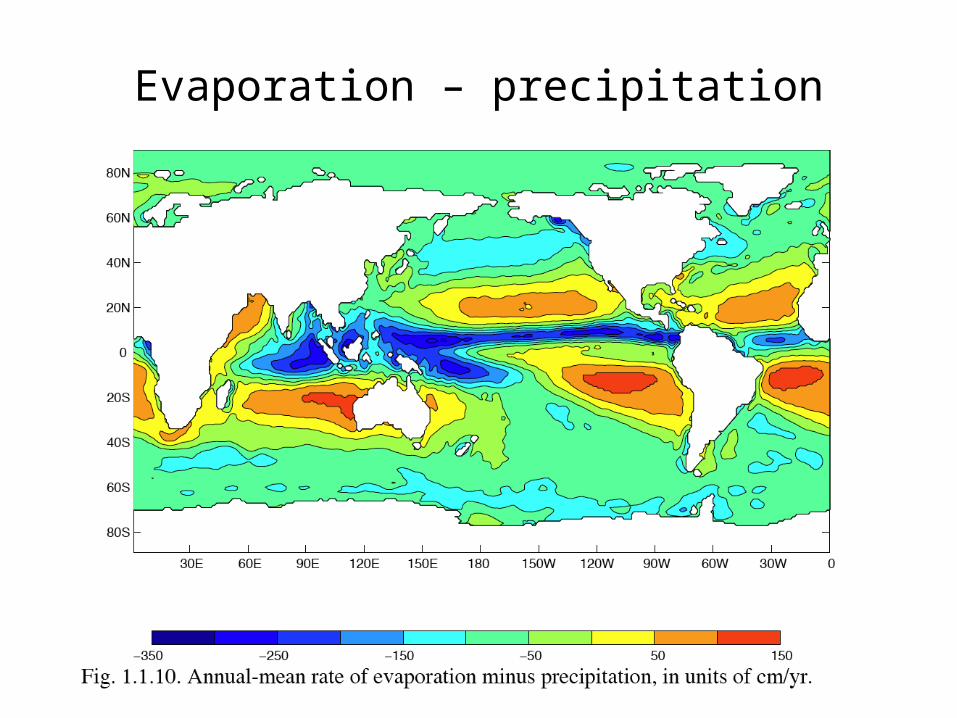
Evaporation – precipitation
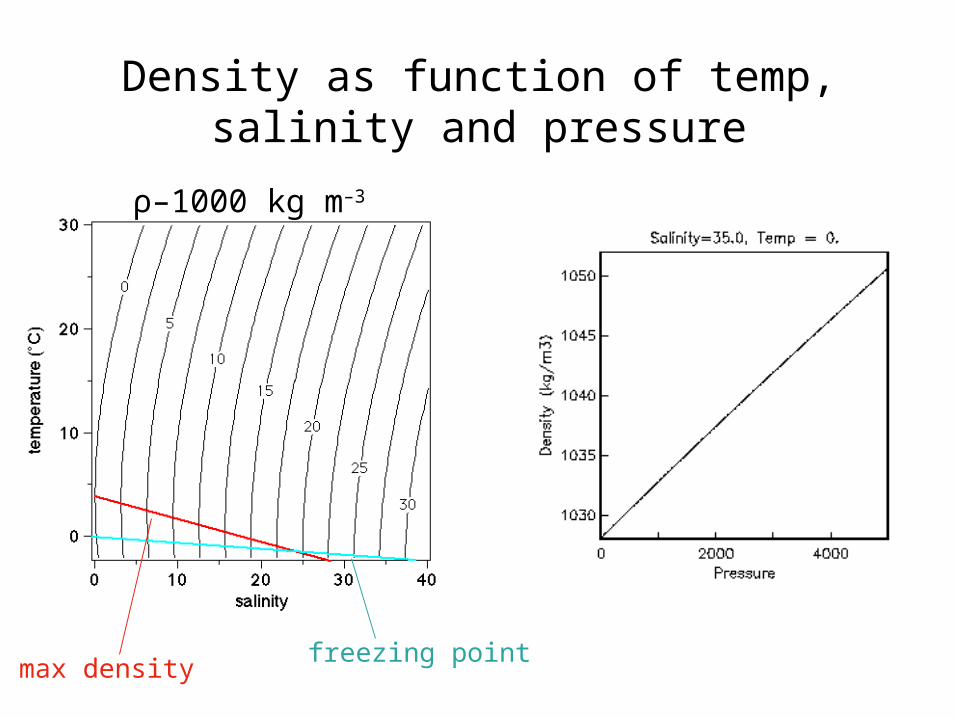
Density as function of temp, salinity and pressure
max densityfreezing point
ρ–1000 kg m–3
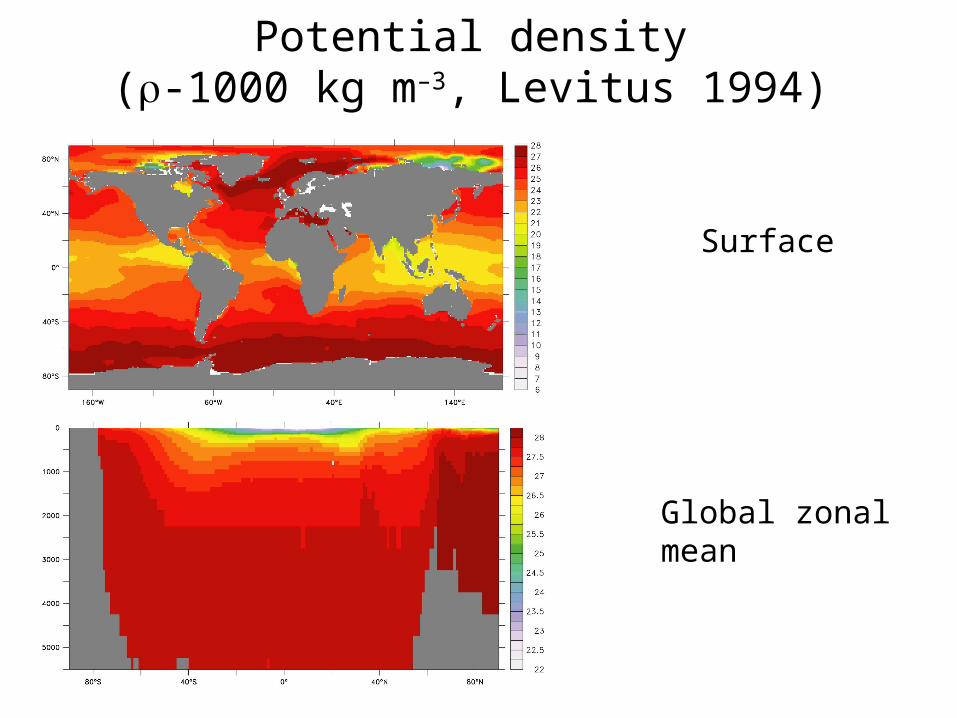
Potential density(-1000 kg m–3, Levitus 1994)
Surface
Global zonal mean

Mixed layer depth

Seasonal variation of mixed layer depth
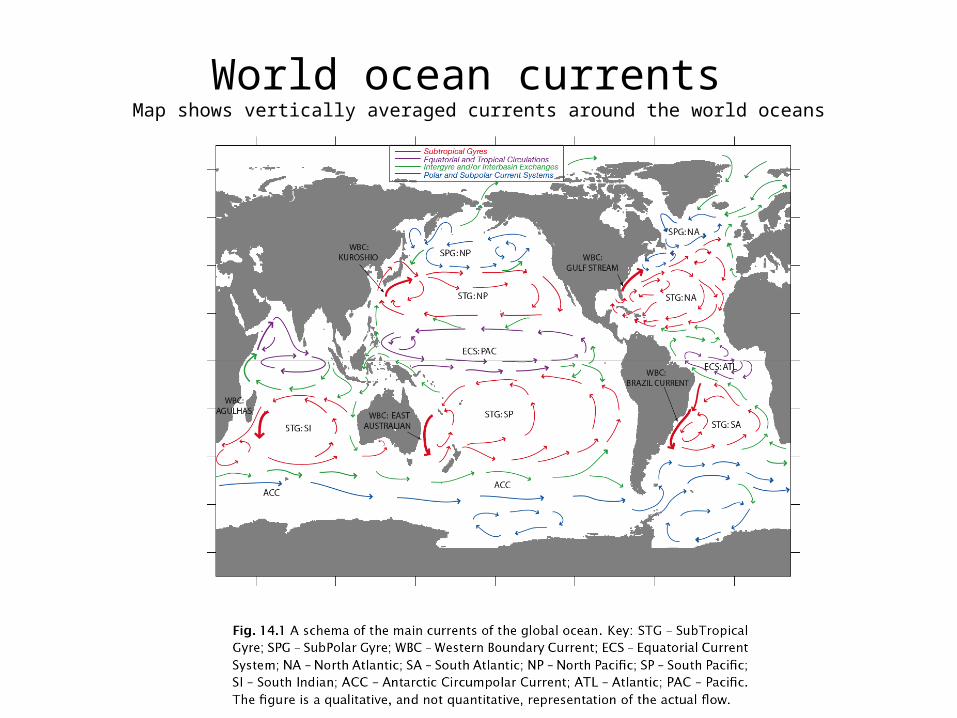
World ocean currents Map shows vertically averaged currents around the world oceans

Western boundary currents: Gulf Stream
Benjamin Franklin’s map (Richardson,
Science1980)
SST satellite image, from U. Miami
RSMAS
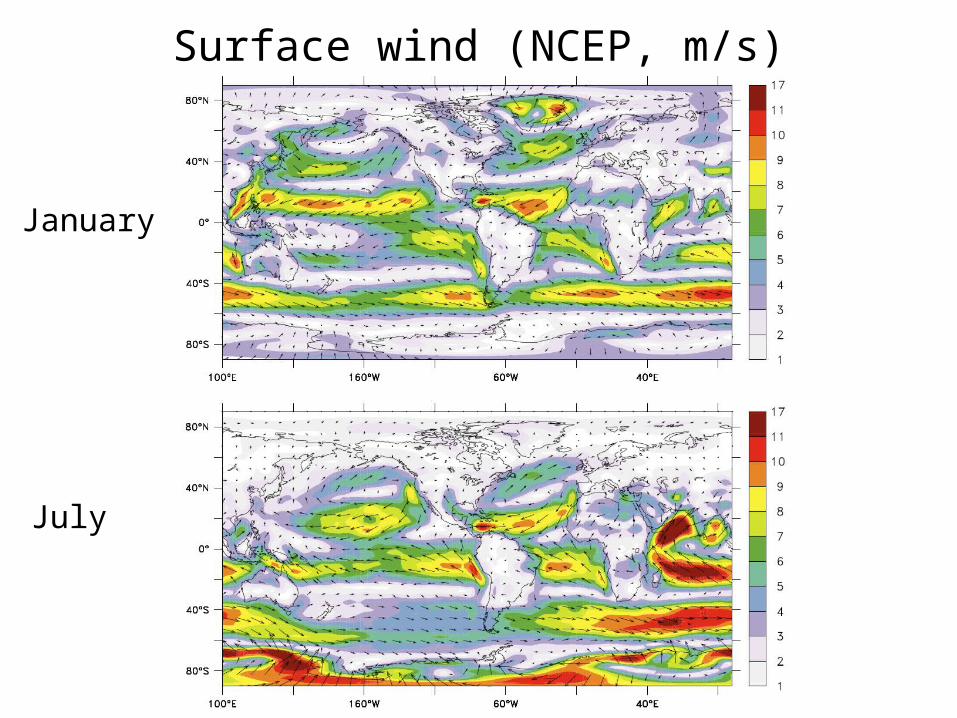
Surface wind (NCEP, m/s)
January
July

Ekman spiral

Coastal upwelling due to Ekman transport
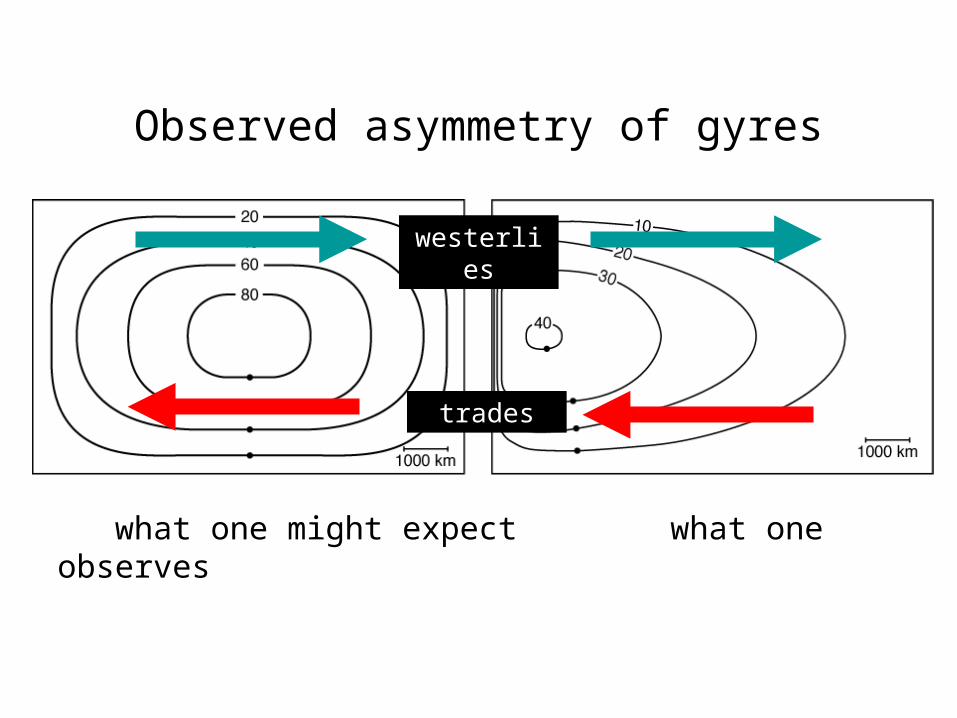
Observed asymmetry of gyres
what one might expect what one observes
westerlies
trades

Annual mean Ekman pumping (m/year)

Friction in western boundary current

World ocean overturning and heat transport
Results from a numerical model (Boccaletti et. al 2005)
mass flux (Sv)
heat flux (PW)
Eq 40N 80N40S80S
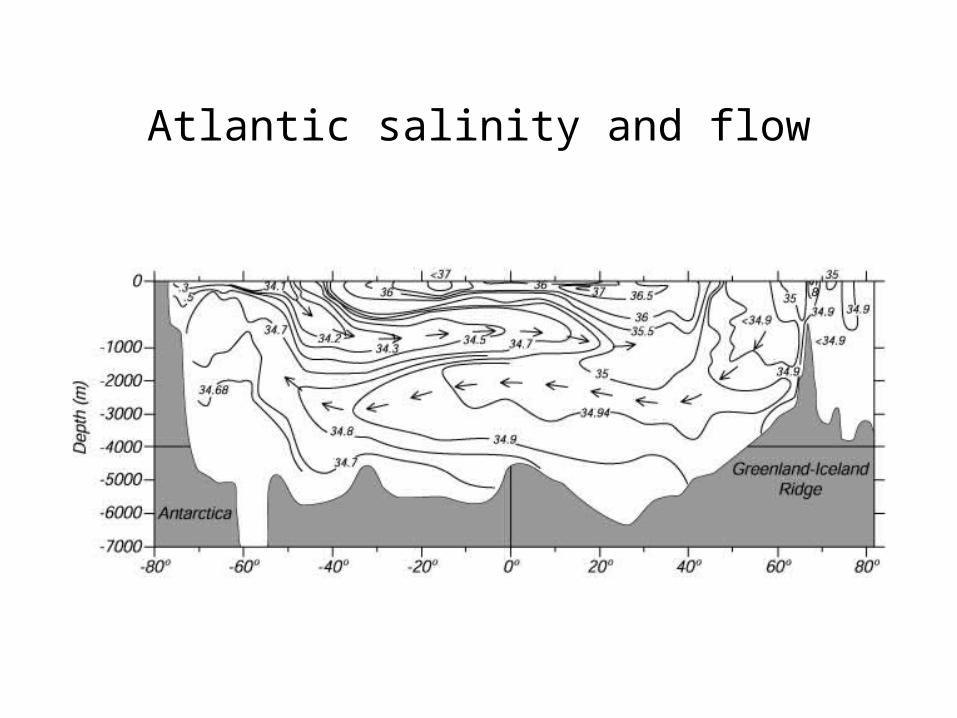
Atlantic salinity and flow
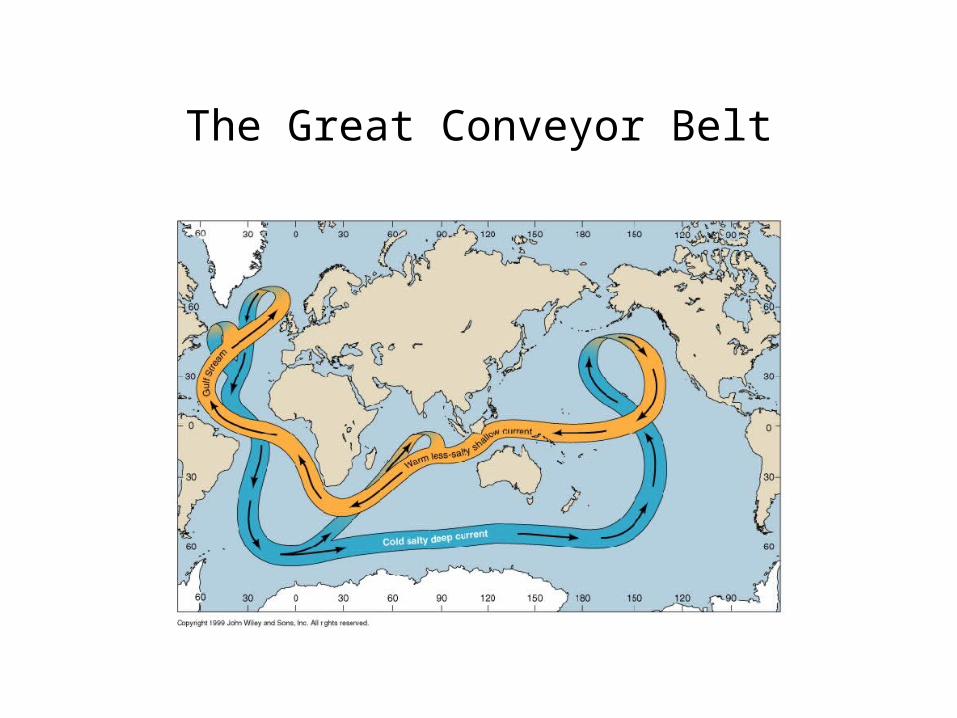
The Great Conveyor Belt
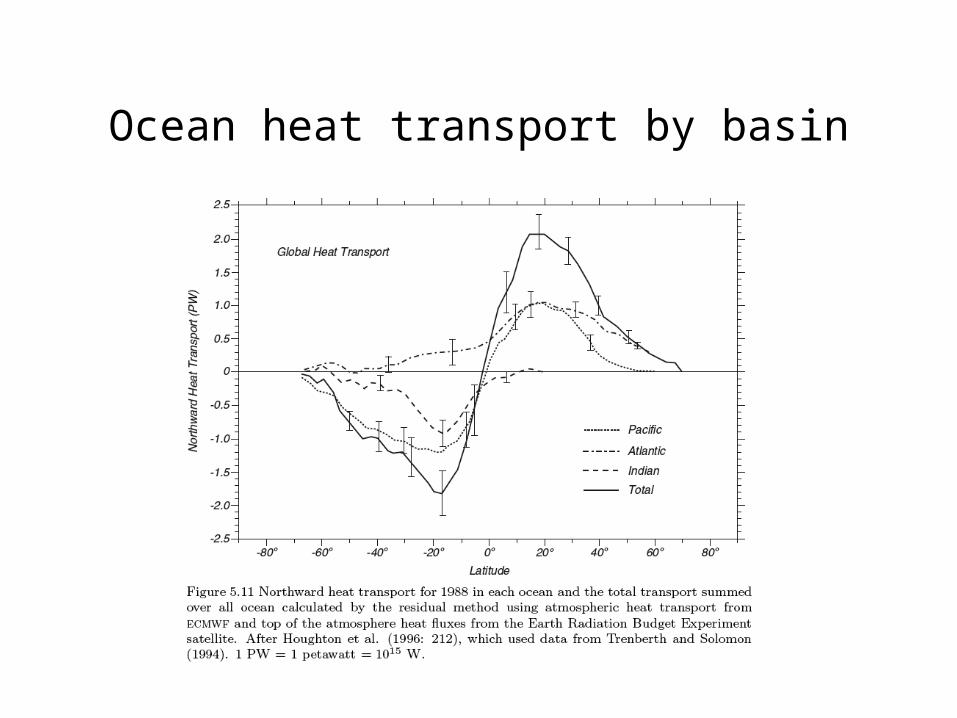
Ocean heat transport by basin

Lumpkin and Speer (2007)
The present perception of Southern Ocean
overturning: it makesthe globalglobal thermohaline circulation
possible
Speer et al., 2000; Sloyan and Rintoul, 2001ab
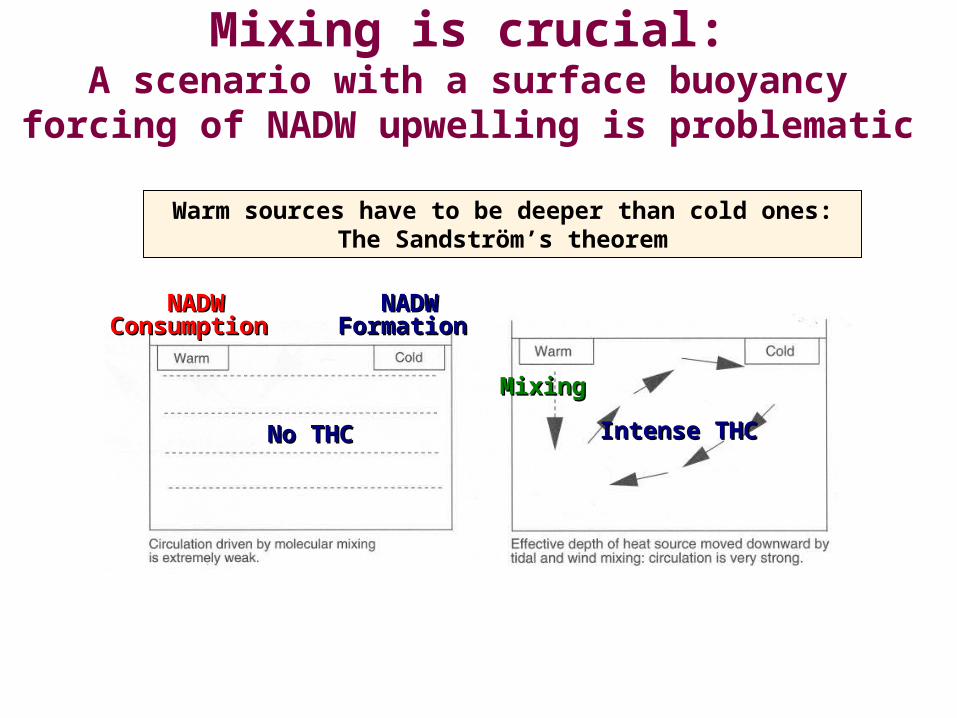
Warm sources have to be deeper than cold ones:The Sandström’s theorem
Mixing is crucial:A scenario with a surface buoyancy
forcing of NADW upwelling is problematic
NADWNADWFormation Formation
NADWNADWConsumption Consumption
Mixing Mixing
No THCNo THC Intense THCIntense THC

“[…] understanding the physics related to the spatial and temporal distribution of mixing is one of the most important research frontiers in
physical oceanography.” Huang (2004)
Mixing is crucial:Different scenarios for the NADW
upwelling
a) Pushing by deepwater formation
b) Pulling by deep mixing
c) Pulling by wind stress & surface waves
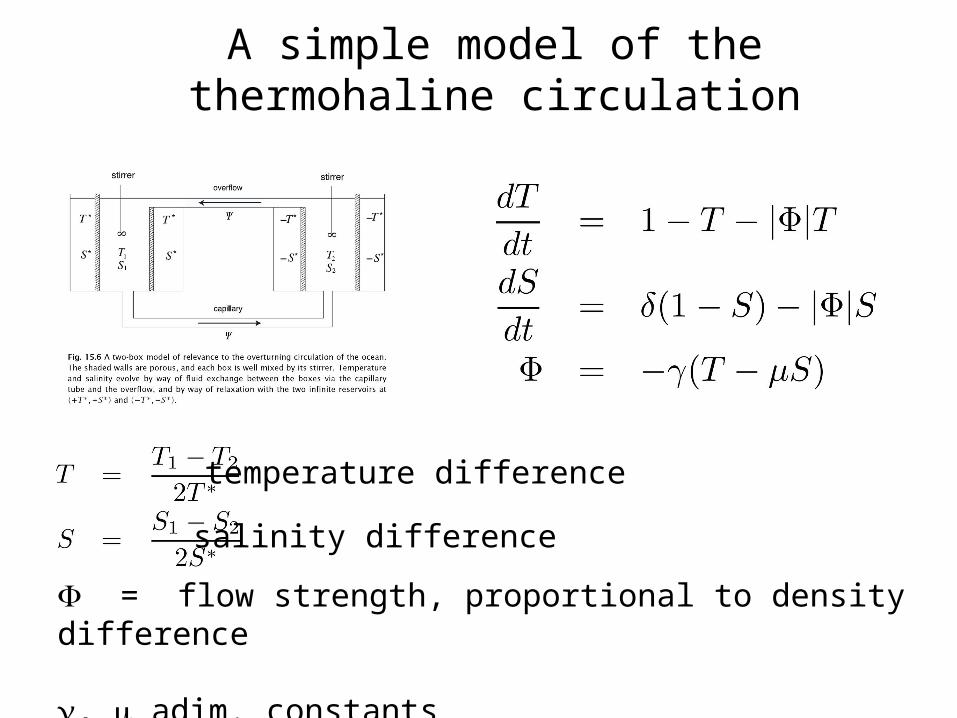
A simple model of the thermohaline circulation
= flow strength, proportional to density difference
, adim. constants
temperature difference
salinity difference

Multiple equilibria
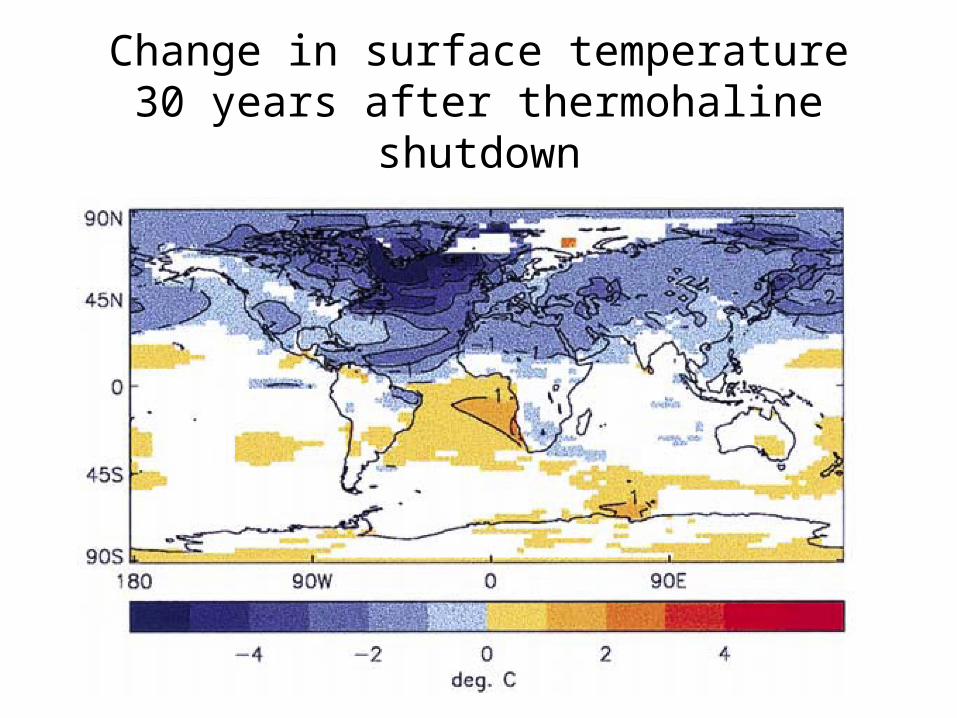
Change in surface temperature 30 years after thermohaline shutdown

Tropical Pacific sea-surface temperature

Equatorial temperature cross section
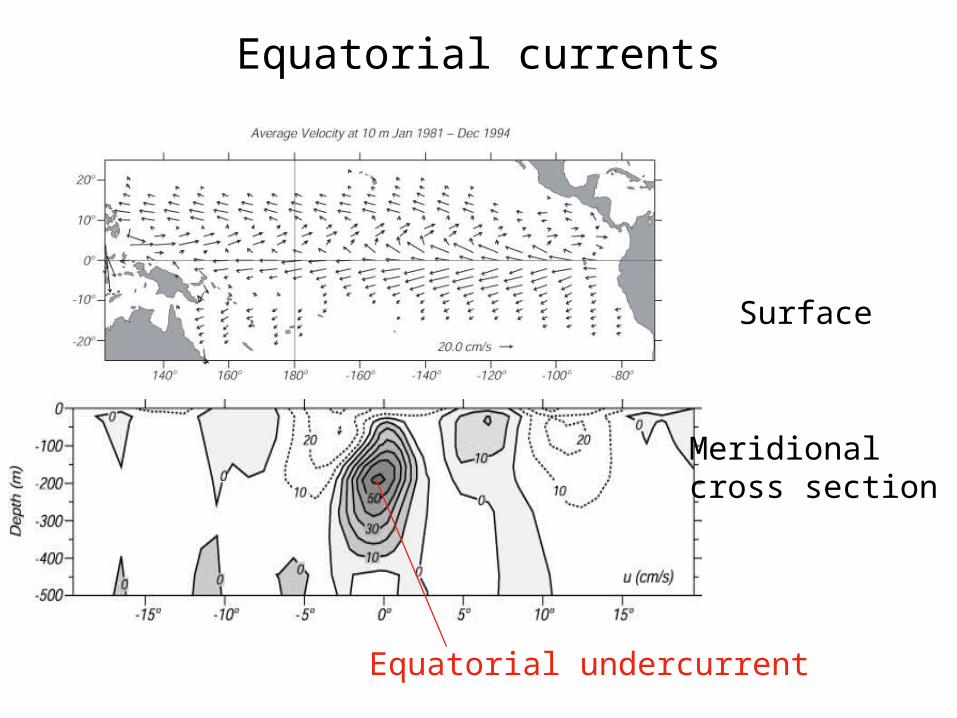
Equatorial currents
Surface
Meridional cross section
Equatorial undercurrent
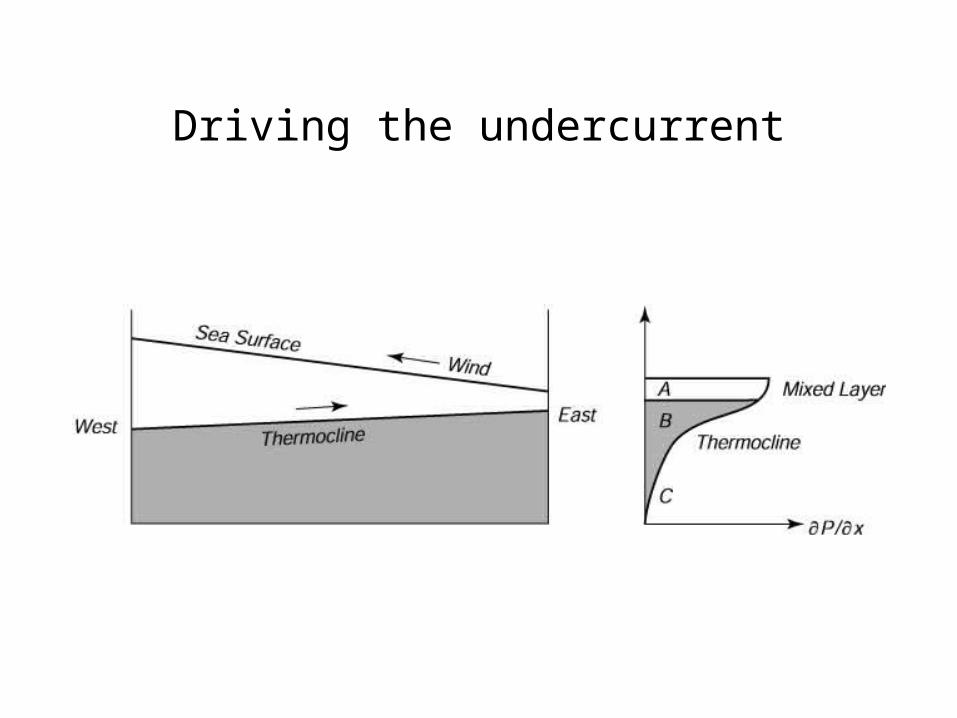
Driving the undercurrent
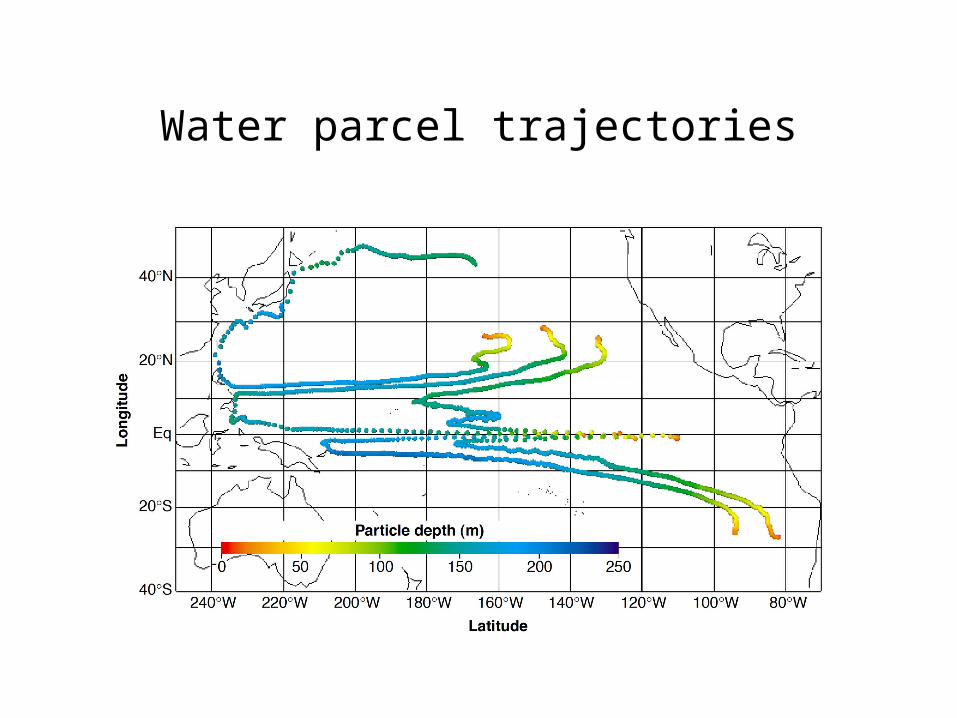
Water parcel trajectories


![Comparison of Anomalies and Trends of OLR as Observed ......AIRS Version 5 Zonal Mean Trends for September 2002 through August 2009 OLR [W/m 2 /yr] Global Mean=-0.12 National Aeronautics](https://static.fdocuments.net/doc/165x107/609fdaff7ebe190290188b5e/comparison-of-anomalies-and-trends-of-olr-as-observed-airs-version-5-zonal.jpg)