Potential population on demand for and of services
65
333I Potential long term implications of demographic and population change on the demand for and costs of public services Policy and Research Unit, Policy Council March 2012
Transcript of Potential population on demand for and of services
333I
Potential long term implications of demographic and population change on the demand for and costs of public services
Policy and Research Unit, Policy Council
March 2012

Page | 2
Contents
1. EXECUTIVE SUMMARY ................................................................................................................................... 3
2. INTRODUCTION ............................................................................................................................................. 6
3. POPULATION PROJECTIONS AND DEMOGRAPHIC CHANGE ............................................................................ 8
4. ECONOMIC OUTPUT .................................................................................................................................... 13
5. AGGREGATE EXPENDITURE .......................................................................................................................... 15
6. BREAKDOWN OF PROJECTIONS BY TYPE OF EXPENDITURE ........................................................................... 19
7. BREAKDOWN OF PROJECTIONS BY FUNDING SOURCE .................................................................................. 27
8. IMPLIED BREAK EVEN TAX RATES – GENERAL REVENUE ................................................................................ 30
9. IMPLIED BREAK EVEN CONTRIBUTION RATES ‐ SSD FUNDS ........................................................................... 34
10. CONCLUSION ............................................................................................................................................... 41
APPENDIX 1. THE EFFECT OF THE RETIREMENT AGE INCREASE .............................................................................. 42
APPENDIX 2. THE EFFECT OF VARYING THE AVERAGE RATE OF EARNINGS GROWTH ............................................. 43
APPENDIX 3. METHODOLOGICAL BACKGROUND FOR HEALTHCARE MODELLING .................................................. 49
APPENDIX 4. THE EFFECT OF VARYING HEALTHCARE EXPENDITURE ...................................................................... 50
APPENDIX 5. OTHER AREAS OF REVENUE EXPENDITURE ....................................................................................... 53
APPENDIX 6. PROGRESSION OF RESERVES HELD BY SSD FUNDS ............................................................................ 59

Page | 3
1. Executive Summary
The potential costs of changing demographics are generally acknowledged but often little understood in
detail. Rising numbers of pensioners and fewer workers, together with increasing life expectancy is likely to
increase the cost, in relative and absolute terms, of public services, in particular of pension and healthcare
provision. Increased demand and a worsening dependency ratio are the key drivers of this trend.
Whilst the potential problem in Guernsey, and indeed across the Channel Islands, is much less significant
than elsewhere in the western world (where already current levels of Social Security spending are not
matched by current revenues) the problem is real. In addition, Guernsey (again like Jersey) is fortunate that
significant Social Security reserves have been accumulated which can be used to help lessen the impact.
Similarly on the revenue front, current temporary budget deficit issues aside, Guernsey’s overall fiscal
position is strong; it has no external debts and has a low tax base.
These projections are not intended as a definitive guide to the future, but serve to illustrate the scale of the
factors and pressures that will need to be managed and mitigated to ensure that the States is able to
continue to provide a sustainable level of public services to meet the needs of the population. Despite the
substantial uncertainties surrounding projections over such long a time period, particularly in relation to the
growth of healthcare costs, such a horizon is useful for illustrating the long‐term fiscal challenges that
Guernsey faces. As the US Congressional Budget Office stated in its introduction to its projections for long
term health care projections, “The goal of the projections in this study is to examine the implications of a
continuation of current federal law, rather than to make a prediction of the future. Under that assumption, however, federal spending on health care would eventually reach unsustainable levels. In reality, federal law will change in the future, ensuring that the basis for the projections will not turn out to be correct, but the projections nevertheless provide a useful measure of the scope of the problem facing the nation.”
As this report illustrates, between the end of the States Strategic Plan planning horizon (2016) and 2040,
using the assumptions contained in this report and importantly assuming no change in current service
provisions or funding models and assuming positive net migration of 200 people per annum:
Total public sector expenditure could increase by 4.0% of GDP, rising to more than 30% of GDP in
2040.
Expenditure on pensions is likely to increase by 1% of GDP (a total rise of 1.6% of GDP between 2010
and 2040).
Healthcare costs could increase by 2.4% of GDP, increasing the proportion of public expenditure
spent on healthcare from 28% in 2016 to 32% in 2040.
The costs of public services could require a combined increase in tax and Social Security contribution
rates in the region of nine percentage points to break even on a year on year basis in 2040.
There are three key factors that will have a key impact on future costs:
1. Population growth
2. Earnings growth
3. Healthcare inflation and rates of benefit increases.

Page | 4
To illustrate:
Under a constant population model, GDP will be 17% lower in 2040 than with an assumed inward
migration rate of 200 people per annum; correspondingly public expenditure will be 3.2% of GDP
higher.
If earnings growth slows to half its average rate of the last 20 years, total public sector costs could be
8.2% of GDP higher by 2040.
If healthcare inflation remains at its current real terms rate of 3% per capita, per annum, health
expenditure could grow by 3.3 percentage points of GDP more than if the rate were kept to 2% per
capita (the assumed increase in average earnings).
The scale of the problem for Guernsey and Jersey is remarkably similar as illustrated by recent actuarial
reviews of Social Security funding completed by the UK Government Actuary’s Department. As Figures 1.1.1
and 1.1.2 illustrate both islands’ Social Security reserves are projected to be exhausted in around 30 to 40
years if expenditure continues at its current rate. If nothing else, this illustrates the scale of issue is common
to both islands and resolving it is unlikely in itself to create further sources of fiscal competition between the
two islands.
Figure 1.1.1. Progression of Guernsey Insurance Fund based on principle assumptions as at 31st December 2009
Government Actuary’s Dept., Report on the operation of the Social Insurance (Guernsey) Law in the period 1 January 2004 to 31 December 2009, June 2011
Figure 1.1.2. Progression of Jersey Social Security Fund based on principle assumptions as at 31st December 2009
Government Actuary’s Dept., Report by the Government Actuary on the financial condition of the Social Security Fund as at 31 December 2009, Nov. 2011.
These projections should not be seen as alarmist, indeed as stated above, the scale of the issues that
Guernsey faces relative to many jurisdictions throughout Europe is much smaller, particularly given the
prudence previously displayed in building up reserves. Neither should these potential costs be seen as
insurmountable or as evidence of deliberate prolificacy on the part of the public sector.
However, they do clearly highlight the need for sustained long run economic growth to fund services: a point
that is fully recognised by Fiscal and Economic Plan. However, what is clear is that the costs of current levels
of service with current funding models will rise as a result of demographics.
The objective, in publishing these projections, is to inform policy debate and ensure that the context and
costs of the welfare system, in its present form, is fully understood and choices rationally made. This policy

Page | 5
debate includes initiatives such as the Health and Social Services Department’s work on its 20/20 Vision and
the results and work of this study will assist such initiatives.
The purpose of this report is to put forward potential future scenarios in order to help policymakers in
Guernsey plan for these scenarios. It does not attempt to prescribe policy solutions. These projections do
not imply that the correct policy response is to ensure revenues rise to meet the projected demands, nor do
they suggest that expenditure must be contained to current shares of GDP and services reduced accordingly.
What is apparent from the projections is that either revenue must rise as a share of GDP, or projected
spending must fall—or some combination of the two outcomes must be achieved to ensure the States
remains in balance in the projected period.
The principle purpose of the report is to provide as definitively as is possible, given the uncertainties
involved in projecting expenditures over such a long time horizon, an indication of the likely future pressures
on public sector expenditures driven by unavoidable demographic changes.

Page | 6
2. Introduction
The potential costs of changing demographics are generally acknowledged but often little understood in
detail. This report provides an analysis of the potential impact of demographic issues on public expenditure
for Guernsey, setting out a series of projections of the path of future costs of public services in Guernsey to
2040. These projections are based on what are essentially simple extrapolations of historic trends based on
the key assumption of a continuance of current services provision and funding models.
These projections are intended to provide an objective illustration of the scale of the potential future needs.
The purpose of the projections is to make clear the consequences of unavoidable long term changes: namely
demographics.
The potential demographic change varies according to the assumed future path of the population and levels
of net migration. In this respect, the Channel Islands’ experience of continued population control and net
inward migration over recent decades means that the effects of this ‘variable’ on the relative cost of public
services is itself something that needs to be properly appreciated and thus is a consistent theme of the
projections contained in this report.
Projections have been created using historic statistics held by the Policy and Research Unit (‘PRU’), States
revenue and expenditure figures and the population projections produced by the UK Government Actuary’s
for the Social Security Department (‘SSD’). For the purpose of creating a single model incorporating all
public expenditure in Guernsey, the projections made by the UK Government Actuary’s Department for the
Guernsey Insurance Fund and the Long Term Care Fund have been reproduced (albeit using slightly boarder
assumptions).
Population growth and, by implication, migration will be itself a significant determinant of the size of future
working population and the demand for services: thus throughout this report two separate population
models, using key variants of net migration are illustrated for comparison. The first of these assumes net
immigration of 200 people per annum; the second assumes a constant population at the level reported in
March 2007.
The report focuses on two key areas of expenditure: health and social security expenditure. These are by
far the two largest components of public sector expenditure and the areas of most sensitive to demographic
change. The report builds a set of projections in stages. Section 3, illustrates as a first stage, the projected
demographic based on two population models outlined above and provides a detailed breakdown of the
implications for the working age workforce under each. Section 4 then illustrates the variance of levels of
future GDP using each population model. Immediately following this, Section 5 summarises of the projected
levels of aggregate (or total) public sector expenditure relative to GDP which is then broken down into
component spending areas in Section 6 and by the funding source in Section 7. Projections are produced for
expenditure to 2040, using series of assumptions set out in each section.
The States Strategic Plan has already firm targets for expenditure to 2016. These are incorporated into the
projections; it is only after this period that the assumptions of demand led growth in costs are produced.
Sections 8 and 9 then conclude by illustrating the required break even rates of taxation and Social Security
contribution rates that are consistent with the implied projections of the report. These sections also present

Page | 7
alternative scenarios illustrating the effect of a reduction in long term growth rates, represented by assumed
average earnings growth falling from 2% per annum to 1% per annum, and variation of the rate of rate
health service inflation (i.e. the increase in the real terms (above or below retail price inflation) costs of
healthcare per capita) by plus or minus one percentage point.
Each of these three variables, (details of which are presented in Appendix 2 and 4) have a significant
influence on long term projections contained in this paper. For example, reducing the assumed long run
average real wage growth to 1% reduces GDP by 26% percent in level by 2040; assuming net migration of
200 per annum against a static population level reduces the proportion of GDP spent on pension provision
by 1 percentage points of GDP by 2040; varying real terms growth in the per capita costs of healthcare
services from 2% (the central assumption used in the model) to 3%, increases projected healthcare
expenditures by 34% in 2040.
As is common in economics, costs are presented as a percentage of (projected) GDP to ease comparisons
across time. The effects of inflation and real economic growth, particularly compounded across significant
time periods make attempts to analysis future costs in monetary terms quite a difficult exercise (Guernsey’s
Fiscal Framework sets all its parameters as shares of GDP): except where otherwise, stated monetary values
are presented 2010 values.
The relationships between the population size and composition, the local economy and States finances are
complex, particularly as both the economy and States’ finances are subject to a wide range of internal and
external factors which it is not feasible to incorporate into the methodology. As such the data presented in
this report should be viewed as an indication of the likely trends rather than an accurate estimation of actual
levels.
This report has been independently produced by the Policy & Research Unit. Liz Laine, Research Officer, is the author of the report,
working under the supervision and direction of the States Economist, Dr Andy Sloan. Any errors are his responsibility; any opinion
provided unintentional.

Page | 8
3. Population Projections and Demographic Change
This section describes the core projections for population which form the basis of the calculations of the
projections of future demands for and costs of key public services. Two variants are included and, similar
to those used in the Policy & Research Unit’s Annual Population Bulletin, they have been chosen to
illustrate the likely path of population levels based and recent actual historic experience of net migration
(the +200 net migration model) and the demographics associated with the implications of the 2007
population policy resolution of the States.
3.1. Population projection models
Models are based on two population projections compiled by The UK Government Actuary’s for SSD
together with a ‘status quo’ scenario to illustrate the relative effects of demographic change:
The +200 net migration model1
- Assumes a net immigration of 200 people per year together with the natural change in
the population due to fertility and mortality rates.
The constant population model2
- Assumes the total population remains at 61,175 with migration rates varying throughout
the projected period in order to maintain this level. Fertility and mortality rates are the
same as those used in the +200 net migration model.
- It should be noted that the total population in March 2010 was 62,431, more than 1,200
higher than the population level used in the constant population model.
3.2. The demographic profile
Figure 3.2.1 shows the demographic profile of the population projections in 2040. It can be seen that
under both models there is a significant shift in the age distribution of the population from its current
status by 2040. Most notably the population in the ‘baby boom’ age groups (born between the end of
World War II in 1946 and the mid 1960’s and currently aged between 45 and 65) will have passed into
older age groups resulting in an upward shift of the age profile in both projected models.
1 These projections were produced using the population as at June 2008. For the purpose of this report the projections have been adjusted to project from the March 2010 population (which is the most recent headline measure). Due to seasonal variations (the population typically being higher in June than in March) and a lower than typical net migration in the twelve months proceeding March 2010, this represents a decrease in the population level of approximately 300 persons. 2 This model was produced in response to a States resolution passed in 2007 to maintain the Islands population at or around the 2007 level (Billet D’etat IV 2007, 28
th February 2007). However, the +200 net migration model was selected as the official population projections at the time of
publication as being more consistent with the current migration trends.

Page | 9
Figure 3.2.1. Demographic profile of the population, 2040 projection compared to 2010
The models assume that migration (including the emigration required to maintain the level of the
population against natural growth in the constant population model) is concentrated among adults of
working age. The immigration or emigration of adults of child bearing age is also reflected in the number
of children born in the Island. As a result the +200 net migration models show a significantly larger
population than the constant population in all age groups below the age of 60.
Figure 3.2.2. Demographic profile of the population, 2040 projection compared to 2010
3.3. The working age population
Both economic output and income tax revenue are generated primarily by those who are of working age.
The critical effect of the changing demographics and aging population is to reduce the size of the working
age population. The increase in the retirement age from 65 to 67 between 2020 and 2032 (see Appendix
1) goes some way to mitigate this effect. Under the most recent projections of the +200 net migration
model, the working age population at the point at which the transition is due to be completed (and
therefore including those aged 65 and 66) is similar to the working age population (up to the age of 65) in
March 2010 (See Figure 3.3.1). However after this point the working age population is projected to fall.
Total
population
Population
<16
Population
16‐64 (working age
up to 2020)
Population
16‐66 (working age
after to
2032)
Population
>65 (retirement
age up to
2020)
Population
>67 (retirement
age after to
2032)
+200 net
migration in 2040 70,301 9,382 ‐‐‐ 41,331 ‐‐‐ 19,558
Constant
population in 2040 61,175 7,755 ‐‐‐ 34,406 ‐‐‐ 19,014
March 2010
(for comparison) 62,431 10,161 42,044 ‐‐‐ 10,266 ‐‐‐

Page | 10
Figure 3.3.1. The working age population
The constant population model shows a much more pronounced fall in the working age population across
the period shown. This is because, in order to maintain the total population at the prescribed level (that
of March 2007) it is necessary to assume negative net migration to balance the natural growth in the
population due to the higher number of projected births than deaths during the period shown3.
3.4. The retired population
The aging population is a major cause for concern in many developed countries. The aging of the ‘baby
boom’ generation born between 1946 and the mid 1960’s combined with falling fertility rates and
increased life expectancy means that an increasing proportion of the population are above retirement
age and dependent on a smaller working age population. It can be seen in Figure 3.2.1 that using both
the +200 net migration and constant population models the population in all age groups over 60 is
projected to increase significantly.
Figure 3.4.1. The retired population
The increasing number of people above retirement age is projected to be one of the principal sources of
increasing government expenditure, a burden principally carried by the Guernsey Insurance (which funds
3 In the latter stages of the population projections (which run to 2070) the death rate increases above the birth rate as the baby boom population reach the end of their projected average life span. At this point the constant population model assumes net immigration to maintain the constant population.

Page | 11
public pensions) and Long Term Care funds. Increasing numbers of retirees is also a driver behind
increased costs of healthcare. Figure 3.4.1 shows the projected size of the retired population in the next
30 years. The population projection models assume that the majority of migration occurs within the
working age population and as such there is little difference between the projected retired population for
the +200 net migration and the constant population models.
3.5. Dependency ratios
The dependency ratio is the ratio of the non‐working age population, who are either below the minimum
school leaving age or above the age of retirement, to the working age population. The aim of the ratio is
to give a crude measure of the relative numbers of people who are likely to be making an overall positive
contribution to public revenues (i.e. by paying taxes) and those who are likely to represent an overall cost
to the public purse (i.e. by receiving pensions or education).
The projected decrease in the working age population and the increase in the retired population means
that the dependency ratio will increase significantly from its current level of 0.48 (or 48 dependent
people for every 100 working age people) over the next 30 years. Although the number of retired people
is similar in both the +200 net migration and constant population models, the smaller working age
population in the latter results in a higher dependency ratio. By 2040 the dependency ratios under the
+200 net migration and constant population models are projected to have increased to 0.70 and 0.78
respectively (see Figure 3.5.1)
Figure 3.5.1. Dependency ratios
Table 3.5.1. Dependency ratios
4 Figures represent the dependency ratio based on the current population but incorporating the relative retirement age in 2030 and 2040.
2020 2030 2040
+200 net migration 0.58 0.63 0.70
Constant population 0.63 0.70 0.78
March 2010 (for comparison)4 0.48 0.45 0.44
Page | 12
It should be noted that dependency ratios take no account of the relative distribution of ages within the
broad dependent and independent categories and the effect this may have on the supply and demand of
resources. For example, participation rates (the percentage of the population who are economically
active) are highest between the ages of 25 and 54 and decline rapidly from 55 to the current official
retirement age implying a reduced average contribution as people approach retirement. Conversely, the
cost of supporting those in their early retirement years, when they are likely to still be comparatively
healthy, is on average much less than supporting those in their late 80s who generally require more care.
As well as the financial implications of having to support a larger dependent population with a smaller
workforce, increased numbers of older people requiring care is also likely to have a significant impact on
the distribution of labour in the workforce. Health and residential care are both labour intensive and an
increased demand for nurses and carers is likely to result in a shift of labour into health and social care to
the possible detriment of other areas of the labour market.
Page | 13
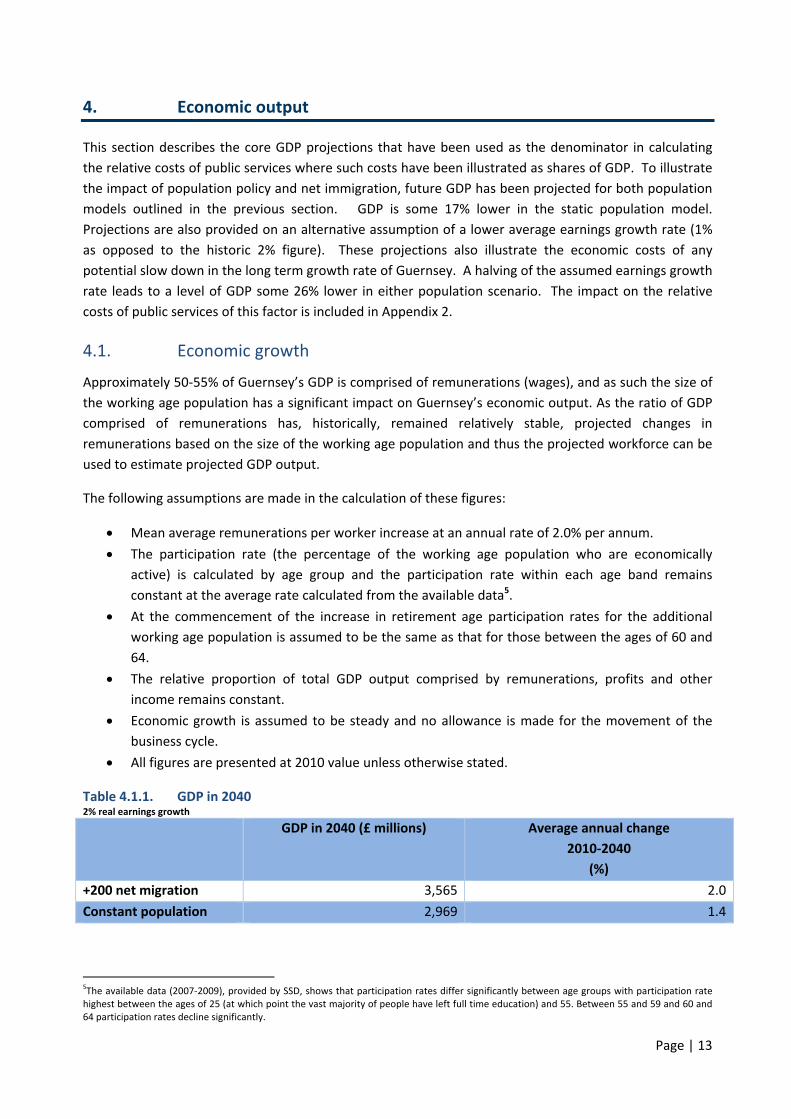
4. Economic output
This section describes the core GDP projections that have been used as the denominator in calculating
the relative costs of public services where such costs have been illustrated as shares of GDP. To illustrate
the impact of population policy and net immigration, future GDP has been projected for both population
models outlined in the previous section. GDP is some 17% lower in the static population model.
Projections are also provided on an alternative assumption of a lower average earnings growth rate (1%
as opposed to the historic 2% figure). These projections also illustrate the economic costs of any
potential slow down in the long term growth rate of Guernsey. A halving of the assumed earnings growth
rate leads to a level of GDP some 26% lower in either population scenario. The impact on the relative
costs of public services of this factor is included in Appendix 2.
4.1. Economic growth
Approximately 50‐55% of Guernsey’s GDP is comprised of remunerations (wages), and as such the size of
the working age population has a significant impact on Guernsey’s economic output. As the ratio of GDP
comprised of remunerations has, historically, remained relatively stable, projected changes in
remunerations based on the size of the working age population and thus the projected workforce can be
used to estimate projected GDP output.
The following assumptions are made in the calculation of these figures:
Mean average remunerations per worker increase at an annual rate of 2.0% per annum.
The participation rate (the percentage of the working age population who are economically
active) is calculated by age group and the participation rate within each age band remains
constant at the average rate calculated from the available data5.
At the commencement of the increase in retirement age participation rates for the additional
working age population is assumed to be the same as that for those between the ages of 60 and
64.
The relative proportion of total GDP output comprised by remunerations, profits and other
income remains constant.
Economic growth is assumed to be steady and no allowance is made for the movement of the
business cycle.
All figures are presented at 2010 value unless otherwise stated.
Table 4.1.1. GDP in 2040 2% real earnings growth
GDP in 2040 (£ millions) Average annual change
2010‐2040
(%)
+200 net migration 3,565 2.0
Constant population 2,969 1.4
5The available data (2007‐2009), provided by SSD, shows that participation rates differ significantly between age groups with participation rate highest between the ages of 25 (at which point the vast majority of people have left full time education) and 55. Between 55 and 59 and 60 and 64 participation rates decline significantly.

Page | 14
Figure 4.1.1. Projected GDP 2% real earnings growth
Under the assumptions used in these models the +200 net migration model shows annual average growth
of 2.0%, the same rate of increase as the assumed increase in mean average earnings. By contrast the
constant population model shows annual average increase at 1.4% as a result of the more rapid decline in
the size of the working age population. In consequence by 2040 the constant population model results in
a projected GDP 17% lower than the +200 net migration model.
Figure 4.1.2. The effect on GDP of varying earnings growth, +200 net migration model
Figure 4.1.3. The effect on GDP of varying earnings growth, constant population model
The main body of this report assumes a 2% per annum real growth in average earnings. However, although
this assumption is consistent with Guernsey historic mean average earnings growth, following the recent
economic stress, speculation has arisen among economists regarding the possibility of a long term reduction
in the average growth rate of developed economies. In order to consider the potential impact this would
have on Guernsey’s economic growth Figures 4.1.2 and 4.1.3 show the effect on GDP in both models of
reducing the long term growth in earnings to 1%.
The effect of this reduction on both models is, over the period shown, more significant than effect of varying
the population migration assumptions. The degree of impact on the two population models is similar, each
being reduced by 26% by 2040.

Page | 15
5. Aggregate expenditure
This section provides the central projections for total public sector expenditure to 2040. As is common in
economics, costs are presented as a percentage of (projected) GDP to ease comparisons across time. The
effects of inflation and real economic growth, particularly compounded across significant time periods make
attempts to analysis future costs in monetary terms quite a difficult exercise (Guernsey’s Fiscal Framework
sets all its parameters as shares of GDP).
As explained in the introduction, SSP forecasts to 2016 are incorporated into the projections. Post 2016 (to
2040) assumptions are as set out below.
Using the central assumptions for healthcare inflation of 2% per annum, total public expenditure is projected
to rise by between four and six percentage points of GDP between 2016 and 2040, depending on the
population projection. Of this increase approximately 45% is accounted for by increased in HSSD
expenditure, 15% by the Guernsey Health Service Fund (administered by Social Security) and 40% by other
benefits and expenditure (including pensions) administered by SSD.
As explained in Appendix 4 the increase in total healthcare costs is greater (by 3.3% of GDP) if the historic 3%
above inflation rise in healthcare costs is assumed and less (by 2.5% of GDP) if it is assumed healthcare
inflation is restricted to just 1% above general inflation.
The assumptions for non‐health and Social Security expenditure are contained in an appendix but the
general rule of thumb used is that such expenditure remains broadly constant following the current SSP
2016 planning horizon. Clearly, total expenditures can be reduced if this assumption is relaxed and real
reductions in expenditure (either in absolute or relative terms (as is the case in the SSP)) are achieved in
these areas. However, this is clearly a policy matter and is not presumed for the purposes of this report.

Page | 16
5.1. Aggregate public sector expenditure
Figure 5.1.1 and Table 5.1.1 shows projections of aggregate public expenditure using both population
models assuming a 2% per annum real increase in average earnings and a 2% per annum real increase in the
cost of healthcare per capita. The model also incorporates the savings outlined in the SSP up to the end of
the planning horizon in 2016. The assumptions used in modelling the underlying expenditure are explained
in more detail in the Section 6 where expenditure is broken down by area6.
Figure 5.1.1. Aggregate public expenditure 2% real earnings growth and 2% increase in healthcare costs per capita
Table 5.1.1. Aggregate public expenditure 2% real earnings growth and 2% increase in healthcare costs per capita
Aggregate expenditure
2010 (for comparison)
Aggregate expenditure in
2016
Aggregate expenditure in
2040
£ million % GDP £ million % GDP £ million % GDP
+200 net migration 535 27.9 587 26.2 1,074 30.1
Constant population 535 27.9 572 27.4 989 33.2
The model shows that, using the +200 net migration assumption, aggregate public expenditure is projected
to generally decrease relative to the size of the economy until the end of the current SSP planning horizon.
After this point expenditure is projected to increase steadily to 30.1% in 2040, 4.0 percentage points above
expenditure in 2016.
Although the actual monetary value of expenditure projected using the constant population assumption is
lower than that of the +200 net migration model (by 8%), because of the lower levels of economic growth
outlined in Section 4 the cost relative to GDP is 3.1 percentage points higher.
6 The following assumptions are made in addition to those outlined in Section 6:
Expenditure funded by DOI increases in line with GDP
No adjustment is made for the double counting of funds paid from SSD funds to States departments (which is incorporated in DOI)

Page | 17
5.2. Composition of public expenditure
Table 5.2.1 and Figures 5.2.2 and 5.2.1 show the composition of aggregate expenditure by expenditure area.
It can be seen that, under the assumptions used in these models, expenditure by those areas most
susceptible to changes in demographic and medical inflation, namely expenditure by the Health and Social
Services Department (‘HSSD’) and by the SSD administered funds, which fund pensions and supplement
medical care.
Table 5.2.1. Composition of public expenditure in 2010 and in 2040
Expenditure area 2010 2040
+200 net
migration
Constant
population
Percentage of
total
expenditure
Percentage of
total expenditure
Percentage of
total expenditure
Health and Social Services Department 20 24 24
Education 14 10 10
Social Security Department (revenue only) 9 8 7
Other general revenue 19 13 13
Expenditure funded by operating income 6 5 5
Social Security fund expenditure 26 34 36
Capital expenditure 7 6 5
Figure 5.2.2. Composition of aggregate public expenditure, +200 net migration model 2% real earnings growth and 2% increase in healthcare costs per capita

Page | 18
Figure 5.2.3. Composition of aggregate public expenditure, constant population model 2% real earnings growth and 2% increase in healthcare costs per capita

Page | 19
6. Breakdown of projections by type of expenditure
This section provides a detailed exposition of the projection for healthcare costs to 2040 and a complete and
detailed explanation of the methodology used. It also provides a detailed illustration of the projections of
the other key elements of welfare expenditure including pensions and long term care. Whilst historic rates
of healthcare inflation per capita have run at 3% more than general inflation, the central assumption used is
that healthcare inflation is restricted to 2% per annum. Assuming historic rates of healthcare inflation
illustrates that healthcare expenditure projections can soon reach unsustainable levels.
Public spending on healthcare is not restricted to HSSD expenditure but includes spending from the
Guernsey Health Service Fund (GHSF) administered by SSD. Total expenditure on healthcare if projected to
rises by 2.4% of GDP in the +200 net migration model and 3.2% of GDP in the constant population model
between 2016 and 2040. Using both models approximately 75% of the increase is due to additional
expenditure by HSSD and 25% due to additional expenditure by the GHSF.
Social Security spending on other contributory benefits, including pensions and long term care (assuming
current service provisions and funding models) increases by 1.8% of GDP using the +200 net migration model
and 2.7% of GDP using the constant population model.
As explained in Section 5, an assumption of a constant level of expenditure (relative to GDP) has been made
for other main components of expenditure (excluding education and non contributory Social Security
expenditure). For completeness each has been summarised in Appendix 5.
6.1. Healthcare
Healthcare in Guernsey is the single most significant area of expenditure in the General Revenue Budget and
one of the most challenging to control. In 2010, the Heath and Social Services Department expenditure
totalled £108 million7 comprising more than 30% of net revenue expenditure. In addition, the Social Security
Department Guernsey Health Service Fund spent a further £35 million funding additional healthcare costs
such as the Consultation Grant, Specialist Health Insurance and Prescription Subsidies.
Spending on healthcare is typically one of the most difficult areas to control and to predict. Combined, the
average public expenditure on health and social services (by HSSD and the GHSF) increased in real terms by
an average of 3% per capita per annum between 20068 and 2010 which forms the basis for the inflationary
element of the healthcare modelling presented in Appendix 3. However, as the growth in healthcare cost
above the rate of increase in earnings (taxes on which are the principle source of income in Guernsey) is an
unsustainable position in the long run, a 2% per capita, per annum increase in healthcare has been selected
as the central assumption for this report. Further background to the method and assumptions used in the
modelling of healthcare expenditure is provided in Appendix 3.
7 Net of the expenditure of departmental operating income. 8 Population statistics are not available on an annual basis prior to 2006

Page | 20
This section shows the projected healthcare costs in the Island using the following assumptions:
Healthcare costs by age:
o Data on the distribution of heath care costs by age group in the UK9 has been utilized in
order to create a projected model of health and social care costs in Guernsey by age group.
o Healthcare per capita within each age group is assumed to increase at 2% per annum in real
terms.
Healthcare costs by proximity to death:
o Mortality rates have been used to provide an estimate of the number of people in each age
group in their last year of life.
o Data on the distribution of heath care costs by proximity to death in the UK has been
utilized in order to create an estimate of the relative cost of healthcare of those in their last
year of life relative to the average cost per capital for each age group. This ratio is assumed
to be constant.
o The model assumes an annual improvement in mortality rates in line with the principle rate
outlined by the UK Government Actuary’s Department10 as far as is feasible. This assumes
the improvements in mortality rates (which currently vary significantly between age groups)
will converge to an annual 1% improvement in 2031 and continue at this level in all
subsequent years.
Healthcare costs and expenditure restraint:
o The projected savings resulting from the FTP have been apportioned by department in the
same proportions as the overall expenditure in 2010. The savings within HSSD have been
apportioned to the per capita expenditure levels.
o Although under the current fiscal policy of expenditure restraint HSSD are subject to a
requirement (along with all other departments) to maintain a real term restraint on revenue
expenditure until 2016 (in addition to the savings of the FTP), in light of an annual average
increase in expenditure well above inflation over the past five years this has not been
incorporated into the model.
6.1.1. Health and Social Services Department
As can be seen from Figures 6.1.1 to 6.1.3 and Table 6.1.1, under both models there is a significant increase
in HSSD expenditure from 5.6% of GDP in 2010 to 7.1% and 7.9% of GDP using the +200 net migration and
constant population models respectively.
Due to the ageing population, the older age groups (those over 65), exert a considerable upward movement
in the cost of healthcare during the period shown. In particular projected expenditure on those over the age
of 85 in 2040 is more than two and a half times its current level relative to GDP under the +200 net migration
model and more than three times its current level under the constant population assumption.
As a result of the decrease in the size of the population in the age groups up to 65, the total cost of
expenditure in these groups relative to GDP decreases between 2016 (the end of the SPP planning horizon)
and 2040 in both the +200 net migration model and (to a greater extent) in the constant population model.
9 Seshamani, M. and A. Gray (2002), “Ageing and Health‐care Expenditure: The Red Herring Argument Revisited”, Health Economics 13,303–314. 10http://www.gad.gov.uk/Demography%20Data/Life%20Tables/Varmortass.html

Page | 21
Figure 6.1.1. Projected net HSSD expenditure by age group, +200 net migration 2% real earnings growth and 2% increase in healthcare costs per capita
Figure 6.1.2. Projected net HSSD expenditure by age group, constant population 2% real earnings growth and 2% increase in healthcare costs per capita

Page | 22
Figure 6.1.3. Projected net HSSD expenditure 2% real earnings growth and 2% increase in healthcare costs per capita
Table 6.1.1. HSSD expenditure
HSSD Expenditure in
2010 (%GDP)
HSSD expenditure in
2016
HSSD expenditure in
2040
£ million % GDP £ million % GDP £ million % GDP
+200 net migration 108 5.6 120 5.3 254 7.1
Constant population 108 5.6 116 5.6 236 7.9
6.1.2. Guernsey Health Service Fund
To gain a complete overview of the total public cost of healthcare in Guernsey it is important to consider the
expenditure of the Guernsey Health Service Fund (GHSF)11. Administered by SSD, the fund covers a range of
health expenditure including the specialist health insurance scheme; the provision of drugs, medicines and
specialist medical equipment and subsidising GP and nursing consultations.
Some of the expenditure of this fund is paid directly to the Health and Social Services Department12 and is
incorporated in Departmental Operating Income in the General revenue accounts. Because the expenditure
in this section is presented net of the expenditure of Departmental operating income there is no double
counting of this expenditure at this stage.
For the purpose of this report, the expenditure from the GHSF has been modelled under the same
assumptions as those used to model HSSD expenditure13. Although there is some degree of overlap, it should
be noted that the areas of expenditure covered by the fund are, for the most part, distinct from those
covered by HSSD. As a result it may be that the future events may result in different patterns of expenditure
growth in the GHSF and HSSD.
11 It should be noted that in some instances, benefit claimants receive additional support in paying for medical expenses funded from other areas of
the Social Benefits system, most notably the medical expenses assistance scheme funded by SSD’s non contributory services. This has not been incorporated in these figures. 12 £161,161 in 2010.
13 Between 2006 and 2010 there is a clear correlation between increases in per capita expenditure by HSSD and GHSF although the time series available is limited.

Page | 23
Figure 6.1.4. Total GHSF expenditure 2% real earnings growth and 2% increase in healthcare costs per capita
Table 6.1.2. Total GHSF expenditure 2% real earnings growth and 2% increase in healthcare costs per capita
GHSF expenditure in
2010
GHSF expenditure in
2016
GHSF expenditure in
2040
£ million % GDP £ million % GDP £ million % GDP
+200 net migration 35 1.8 42 1.9 87 2.5
Constant population 35 1.8 40 1.9 81 2.7
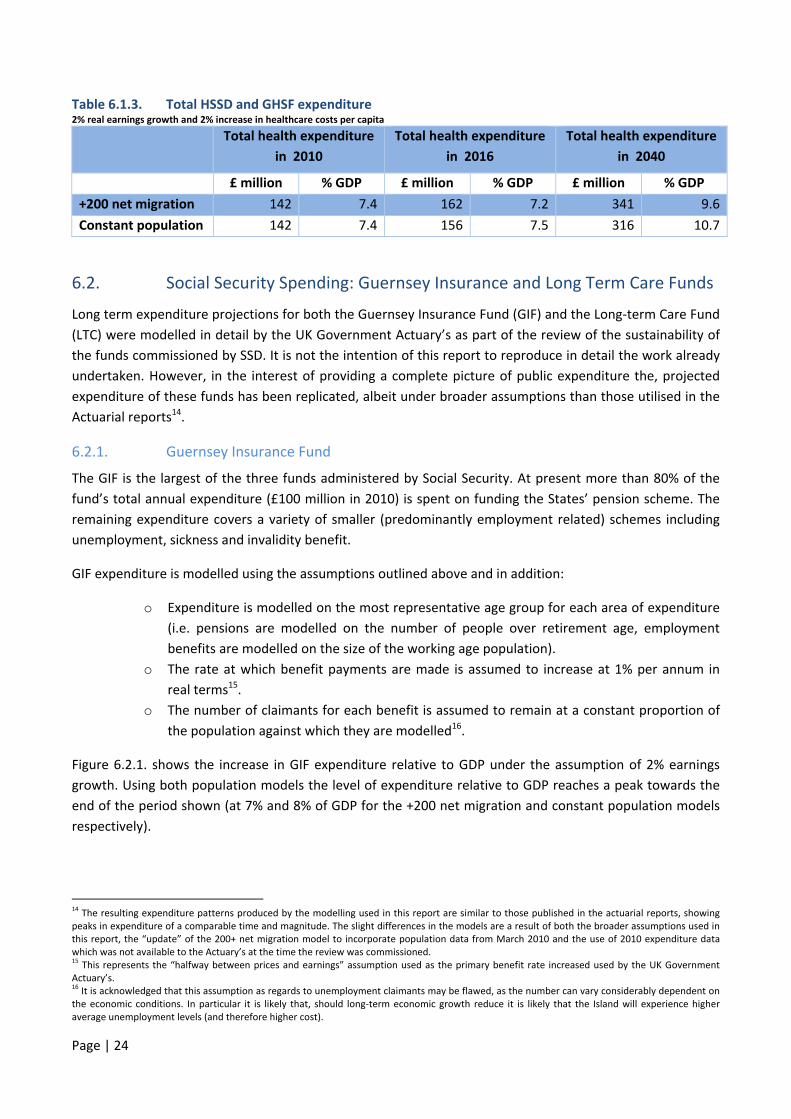
6.1.3. Total public sector expenditure on health
The expenditure of HSSD and the GHSF combined give an indication of the total level of public expenditure
on health. Figure 6.1.5 shows total healthcare cost, under the central assumptions, escalating from 7.4% of
GDP in 2010 to 9.6% and 10.7% under the +200 net migration and constant population models respectively.
Figure 6.1.5. Total HSSD and GHSF expenditure 2% real earnings growth and 2% increase in healthcare costs per capita
Page | 24
Table 6.1.3. Total HSSD and GHSF expenditure 2% real earnings growth and 2% increase in healthcare costs per capita
Total health expenditure
in 2010
Total health expenditure
in 2016
Total health expenditure
in 2040
£ million % GDP £ million % GDP £ million % GDP
+200 net migration 142 7.4 162 7.2 341 9.6
Constant population 142 7.4 156 7.5 316 10.7
6.2. Social Security Spending: Guernsey Insurance and Long Term Care Funds
Long term expenditure projections for both the Guernsey Insurance Fund (GIF) and the Long‐term Care Fund
(LTC) were modelled in detail by the UK Government Actuary’s as part of the review of the sustainability of
the funds commissioned by SSD. It is not the intention of this report to reproduce in detail the work already
undertaken. However, in the interest of providing a complete picture of public expenditure the, projected
expenditure of these funds has been replicated, albeit under broader assumptions than those utilised in the
Actuarial reports14.
6.2.1. Guernsey Insurance Fund
The GIF is the largest of the three funds administered by Social Security. At present more than 80% of the
fund’s total annual expenditure (£100 million in 2010) is spent on funding the States’ pension scheme. The
remaining expenditure covers a variety of smaller (predominantly employment related) schemes including
unemployment, sickness and invalidity benefit.
GIF expenditure is modelled using the assumptions outlined above and in addition:
o Expenditure is modelled on the most representative age group for each area of expenditure
(i.e. pensions are modelled on the number of people over retirement age, employment
benefits are modelled on the size of the working age population).
o The rate at which benefit payments are made is assumed to increase at 1% per annum in
real terms15.
o The number of claimants for each benefit is assumed to remain at a constant proportion of
the population against which they are modelled16.
Figure 6.2.1. shows the increase in GIF expenditure relative to GDP under the assumption of 2% earnings
growth. Using both population models the level of expenditure relative to GDP reaches a peak towards the
end of the period shown (at 7% and 8% of GDP for the +200 net migration and constant population models
respectively).
14 The resulting expenditure patterns produced by the modelling used in this report are similar to those published in the actuarial reports, showing
peaks in expenditure of a comparable time and magnitude. The slight differences in the models are a result of both the broader assumptions used in this report, the “update” of the 200+ net migration model to incorporate population data from March 2010 and the use of 2010 expenditure data which was not available to the Actuary’s at the time the review was commissioned. 15 This represents the “halfway between prices and earnings” assumption used as the primary benefit rate increased used by the UK Government
Actuary’s. 16 It is acknowledged that this assumption as regards to unemployment claimants may be flawed, as the number can vary considerably dependent on
the economic conditions. In particular it is likely that, should long‐term economic growth reduce it is likely that the Island will experience higher average unemployment levels (and therefore higher cost).

Page | 25
Because pension costs represent such a significant portion of expenditure of the reserve the increase in the
pension age between 2020 and 2032 has a significant impact on expenditure, reducing the rate of increase in
expenditure across that period.
Figure 6.2.1. Total expenditure from the Guernsey Insurance Fund 2% real earnings growth
Table 6.2.2. Total expenditure from the Guernsey Insurance Fund 2% real earnings growth
GIF expenditure in 2010 GIF expenditure in 2016 GIF expenditure in 2040
£ million % GDP £ million % GDP £ million % GDP
+200 net migration 104 5.4 134 6.0 250 7.0
Constant population 104 5.4 133 6.4 239 8.1
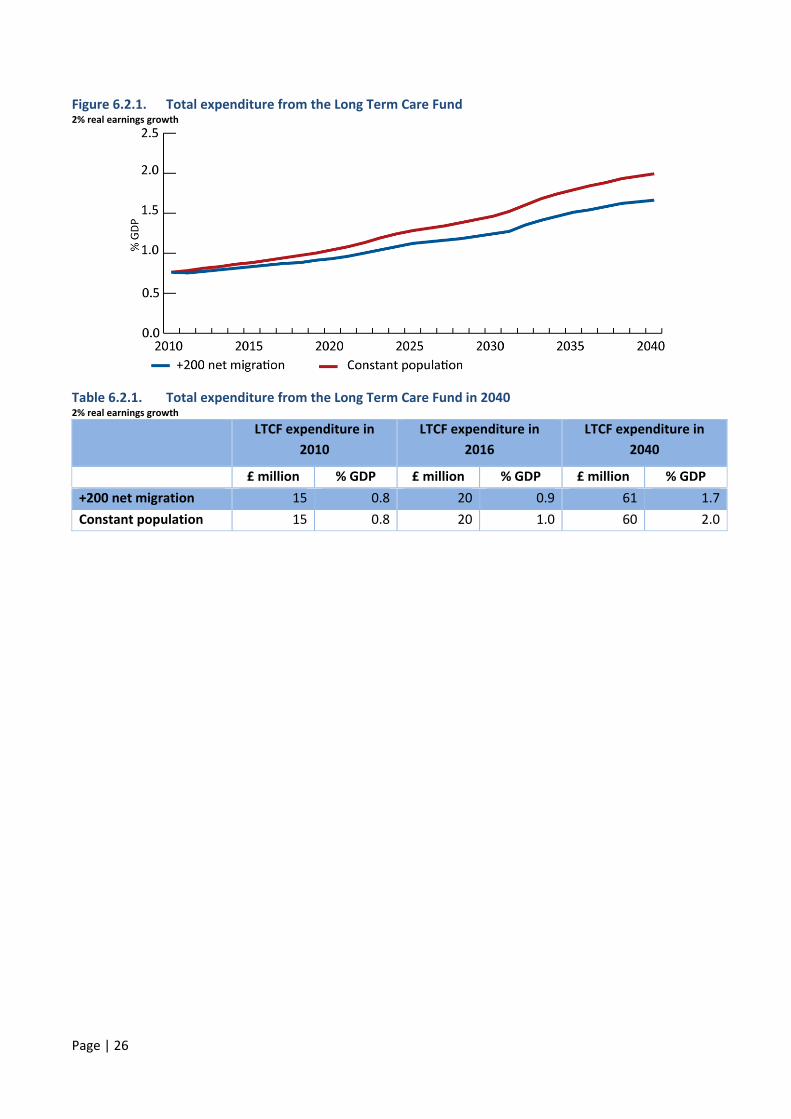
6.2.2. Long Term Care Fund
The LTCF is the newest and smallest of the funds administered by SSD. Established to fund residential and
nursing care for older people, expenditure of the fund is very sensitive to the effects of the ageing
population.
For the purpose of this report expenditure is modelled using the following assumptions:
o Residential care expenditure is proportional to the size of the population aged over 75
o Nursing care is proportional to the size of the population aged over 85
o The cost of care per capita increases at 1% per annum
Figure 6.2.1 shows the progression of expenditure from the LTCF relative to GDP. It should be noted that,
under the assumptions used in this model the progression of the “baby boom” population results in a
marked increase in the rate of expenditure growth in 2032 when the first of the “baby boomers” (those born
in 1946‐47) move into the over 85 categories used for modelling nursing care.
Page | 26
Figure 6.2.1. Total expenditure from the Long Term Care Fund 2% real earnings growth
Table 6.2.1. Total expenditure from the Long Term Care Fund in 2040 2% real earnings growth
LTCF expenditure in
2010
LTCF expenditure in
2016
LTCF expenditure in
2040
£ million % GDP £ million % GDP £ million % GDP
+200 net migration 15 0.8 20 0.9 61 1.7
Constant population 15 0.8 20 1.0 60 2.0
Page | 27
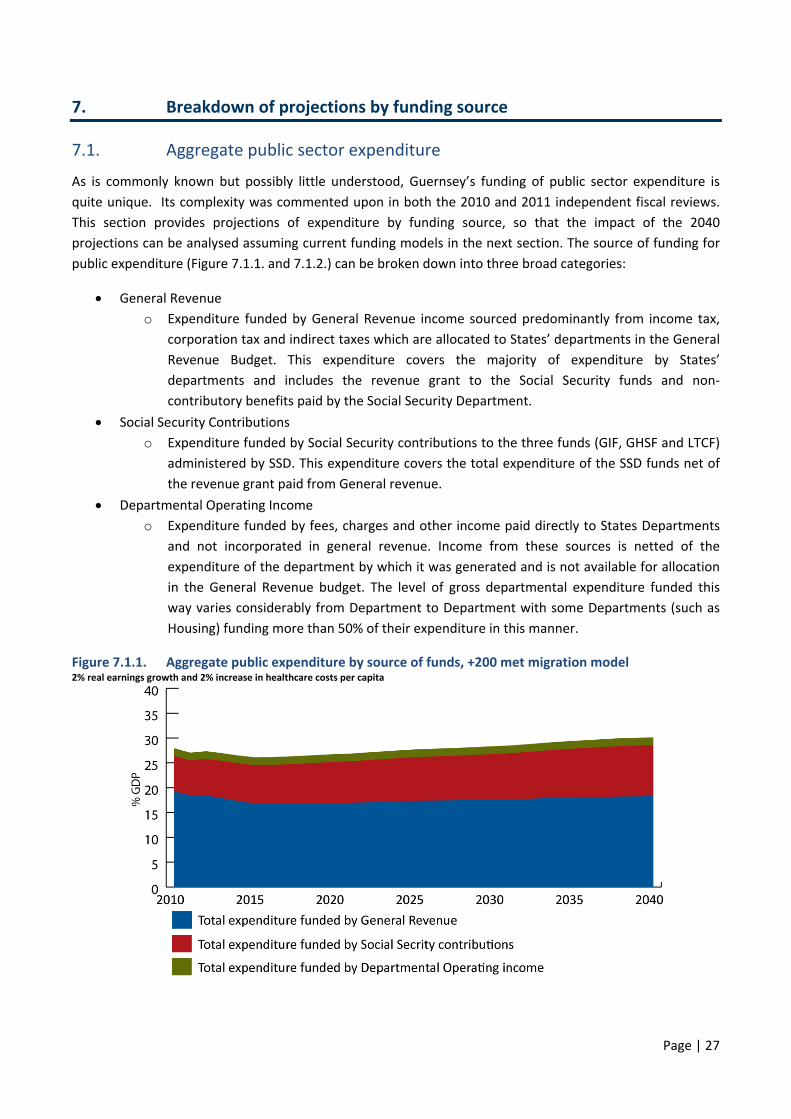
7. Breakdown of projections by funding source
7.1. Aggregate public sector expenditure
As is commonly known but possibly little understood, Guernsey’s funding of public sector expenditure is
quite unique. Its complexity was commented upon in both the 2010 and 2011 independent fiscal reviews.
This section provides projections of expenditure by funding source, so that the impact of the 2040
projections can be analysed assuming current funding models in the next section. The source of funding for
public expenditure (Figure 7.1.1. and 7.1.2.) can be broken down into three broad categories:
General Revenue
o Expenditure funded by General Revenue income sourced predominantly from income tax,
corporation tax and indirect taxes which are allocated to States’ departments in the General
Revenue Budget. This expenditure covers the majority of expenditure by States’
departments and includes the revenue grant to the Social Security funds and non‐
contributory benefits paid by the Social Security Department.
Social Security Contributions
o Expenditure funded by Social Security contributions to the three funds (GIF, GHSF and LTCF)
administered by SSD. This expenditure covers the total expenditure of the SSD funds net of
the revenue grant paid from General revenue.
Departmental Operating Income
o Expenditure funded by fees, charges and other income paid directly to States Departments
and not incorporated in general revenue. Income from these sources is netted of the
expenditure of the department by which it was generated and is not available for allocation
in the General Revenue budget. The level of gross departmental expenditure funded this
way varies considerably from Department to Department with some Departments (such as
Housing) funding more than 50% of their expenditure in this manner.
Figure 7.1.1. Aggregate public expenditure by source of funds, +200 met migration model 2% real earnings growth and 2% increase in healthcare costs per capita

Page | 28
Figure 7.1.2. Aggregate public expenditure by source of funds, constant population model 2% real earnings growth and 2% increase in healthcare costs per capita
7.2. General revenue expenditure
Figure 7.2.1. shows that, after the horizon of the current SSP and the expenditure restraint imposed by it,
aggregate public expenditure relative to the size of the economy is likely to increase regardless of the
population model used. However, the rate of growth relative to the size of the economy is lower using the
+200 net migration model, which increases to 18.3% of GDP in 2040, than using the constant population
model, which increases to 19.8% of GDP by 2040.
Figure 7.2.1. Total general revenue funded expenditure (including capital expenditure, non‐contributory benefits administered by SSD and the revenue grant)
2% real earnings growth and 2% increase in healthcare costs per capita
Table 7.2.1. General revenue expenditure 2% real earnings growth and 2% increase in healthcare costs per capita
Total revenue
expenditure in 2010
Total revenue
expenditure in 2016
Total revenue
expenditure in 2040
£ million % GDP £ million % GDP £ million % GDP
+200 net migration 368 19.2 375 16.7 677 18.3
Constant population 368 19.2 365 17.5 615 19.8

Page | 29
7.3. Expenditure funded by Social Security Contributions
Figure 7.3.1. shows the increase in expenditure funded by Social Security contributions. Both population
models show a steady increase in expenditure over the period shown. However the rate of increase using
the constant population model is higher than that shown by the +200 net migration model. As a result, by
2040 the level of expenditure shown in the constant population model is 1.6 percentage points of GDP
higher than that shown in the +200 net migration model.
Figure 7.3.1. Total SSD expenditure funded by contributions income (i.e. net of the revenue grant and excluding non‐contributory expenditure)
2% real earnings growth and 2% increase in healthcare costs per capita
Table 7.3.2. Total SSD expenditure funded by contributions income (i.e. net of the revenue grant and excluding non‐contributory expenditure)
2% real earnings growth and 2% increase in healthcare costs per capita
Total SSD expenditure
funded by contributions
in 2010
Total SSD expenditure
funded by contributions
in 2016
Total SSD expenditure
funded by contributions
in 2040
£ million % GDP £ million % GDP £ million % GDP
+200 net migration 137 7.2 176 7.9 367 10.3
Constant population 137 7.2 175 8.4 353 11.9

Page | 30
8. Implied break even tax rates – General revenue
This section provides simple estimates of the implications of the projections contained in this report for
revenue funded expenditure on the break even rate of tax. This is not to imply this is a default policy
response but it has been calculated to provide some comparison of the scale of the increased revenue
funding that would be required if the central projections of the models were to occur. Clearly an alternate
policy response could be to restrict expenditure growth to current shares of GDP and limit or reduce services
accordingly.
What the modelling exercise illustrates is that, given the assumptions of current service levels and current
methods of funding, increases in revenues are required. The size of the required increase equates to rises in
personal tax of between four and seven percentage points above the current rate depending on the
assumed population model. The impact of a lower average growth rate in earnings is also provided. The
impact of a halving of the long term growth rate is quite significant. In both population scenarios, break
even tax rates in 2040 are some 9 or 10 percentage points higher with lower assumed economic growth.
As was stated in the introduction to this report, the projections in the SSP to 2016 have been incorporated
into the report, it is only from 2016 to 2040 that demand led increases based on demographic change, etc
are modelled. Therefore to that date, as the current fiscal deficit is removed, the ‘break even’ tax rate
reduces.
8.1. General revenue
The break even tax rate is the estimated personal tax rate which would need to be charged for a balanced
budget year on year assuming any deficit was funded solely from increases in personal taxes. In order to
calculate the break even tax rate the total general revenue income has been modelled by utilising the
population projections to model Employee Tax Instalment (ETI) receipts. This model in turn has been used to
infer a level of total general revenue income against which the expenditure projections can be prepared.
The projections presented below utilise the following assumptions:
The base model of income
ETI receipts
o Tax allowances increase in real terms at 1% per annum.
o Taxable earnings increase in real terms at 2% per annum.
o The participation rate (the percentage of the working age population who are
economically active) is calculated by age group and the participation rate within each
age band remains constant at the average rate calculated from the available data.
o At the commencement of the increase in retirement age, participation rates for the
additional working age population is assumed to be the same as that for those between
the ages of 60 and 64.
o Economic growth is assumed to be steady and no allowance is made for the movement
of the business cycle.

Page | 31
Other personal income taxes
o The total value of other taxable personal income is assumed to be equal to 35% of the
total income taxable under the ETI scheme 17.
Corporate, indirect taxes and other income.
o Continue at a constant ratio to ETI receipts (at the assumed personal tax rate of 20%)
o No allowance is made for any changes in the corporate tax system which may result
from the corporate tax review.
o No allowance has been made for capital income.
Break even tax rate
o Any deficit is to be funded entirely by increases in the personal tax rate (no variation in
tax allowances, corporate or indirect taxes has been included).
o No allowance is made for the use of reserves to fund the deficit or the accumulation of
interest on the general and contingency reserves.
Figure 8.1.1. Break even tax rate, general revenue 2% real earnings growth and 2% increase in healthcare costs per capita
Table 8.1.1. Total SSD expenditure funded by contributions income (i.e. net of the revenue grant and excluding non‐contributory expenditure)
2% real earnings growth and 2% increase in healthcare costs per capita
Break even tax rate in
2010
(%)
Break even tax rate in
2016
(%)
Break even tax rate in
2040
(%)
+200 net migration 23.6 18.6 23.8
Constant population 23.6 20.0 26.9
As the general revenue budget in 2010 was in deficit the current break even tax rate is 23.6%, 3.6
percentage points above the current level of personal taxes. These projections indicate that, using the +200
net migration model that the budget will return to balance in 2015 in line with the projection published in
the SSP. The budget projected remains in surplus until 2023. However, after this point the budget is
projected to once again fall into deficit. By 2040, if the deficit were to be funded solely by increases in direct
personal taxes, the tax rate would need to be increased to 23.8% to balance the budget.
17 The time series available for the formation of this assumption is limited and the ratio between ETI and other personal income can vary considerably
as it is largely dependent on external factors such as interest rates and stock market performance.

Page | 32
Using the same assumptions applied to the constant population model, indicates that the budget will be
brought in to balance for just a single year (2015) before falling returning to a deficit position. This model
indicates that by 2040 the personal tax rate would need to be increased to 26.9% to balance the budget.
Figure 8.1.2 to 8.1.3 show that by decreasing the assumption of long term annual growth in earnings from
2% to 1% per annum (implying a lower rate of economic growth and tax revenue) the fiscal position is
adversely affected. Using the +200 net migration assumption the 1 percentage point decrease in earnings
increases the tax rate required to break even in 2040 by more than 9 percentage points. The effect on the
constant population model is more pronounced, resulting in an increase of 10 percentage points.
Figure 8.1.2. Break even tax rate: The effect of varying real annual earnings growth, +200 net migration model
Figure 8.1.3. Break even tax rate: The effect of varying real annual earnings growth, constant population model
Figures 8.1.4. and 8.1.5. show the effect on the implied break even tax rate of altering the assumed level of
heath care inflation. Between 2006 and 2010 the average cost of healthcare per capita increased by 2.9%18.
A long term increase at this level (1 percentage point above the assumed average growth in earning) would
be unsustainable. If this were to continue, theses models suggest that by 2040, the break even tax rate
could increase to 28.6% using the +200 population model and 32.2% using the constant population model.
18 Largely due to an HSSD overspend in 2008, resulting in a 10% increases in costs per capita in real terms and a lesser increase (of 6%) in 2007.

Page | 33
Figure 8.1.4. Break even tax rate: The effect of
varying real annual growth in healthcare expenditure per capita, +200 net migration
Figure 8.1.5. Break even tax rate: The effect of
varying real annual growth in healthcare expenditure per capita, constant population
Reducing the growth in healthcare costs per capita to 1 percentage point below the growth in earnings
extends the period of fiscal surplus in the +200 net migration model to 2035 and reduces the implied break
even tax rate in 2040 to just 0.4 percentage points above the current tax rate. Reducing the growth in
healthcare costs per capita to 1% in the constant population model results in a 5 year period of fiscal surplus
between 2015 and 2019 and reduces the break even tax rate in 2040 to 22.9%.

Page | 34
9. Implied break even contribution rates ‐ SSD funds
This section provides break even contribution rates to Social Security funds. The total break even
contribution rate (represented by the total rate paid by employees and employers) rise to 17.4% in the +200
net migration model and to 19.9% in the constant population model. The greatest increase is a result of
increased contributions to the Guernsey Insurance Fund in both models requiring an increase in contribution
rate to the fund from its current rate (8.3%) to between 11.4% and 13.0% to break even (in terms of
contributions income) in 2040. The Guernsey Health Service and Long Term Care Funds require increased
contributions of between 1.0% and 1.4% and 1.2% and 1.7% respectively to break even in 2040.
The effects of varying the earnings growth and healthcare inflation rates are also illustrated. The impact of
earnings growth is significant, increasing the break even contribution rate by around 34% in each case.
However, the effects of slower earnings growth can be readily mitigated by reducing the assumed annual
benefit increases in the modelling.
However, SSD hold significant reserves particularly in the GIF. These can be drawn down to lessen the
impact on the current break even rates. This is illustrated in Appendix 6. Through combining the use of the
reserves and rate increases the level of contributions can be optimised through dynamic modelling (not
attempted in this report). To provide illustration, section 9.4 shows the progression of the GIF reserves
assuming an increase in the rate of contributions to the fund in 2013 sufficient to ensure reserves do not
drop below the equivalent of two years of annual expenditure (to provide a buffer) between now and
207019. This would require an increase in the contribution rate to the GIF of 0.88% using the +200 net
migration model and 1.82% using the constant population model. This compares to increases in the
breakeven contribution rate of 3.1% or 4.7% by 2040 referred to above: vividly illustrating the mitigating
effects of using the reserves and early action.
Social Security contributions can also be modelled as a function of the population. As SSD hold a significant
value of reserves for these funds, Appendix 6 projects the value of these reserves relative to the expenditure
of the fund. The section also includes additional projections showing the impact of relaxing the central
growth and expenditure assumptions and progression of the fund reserves at a selection of higher
contribution rates.
Where possible the models presented use the same assumptions as those used in modelling of ETI receipts
in the previous section and draw on the assumptions made by the UK government Actuary’s Department.
The following additional assumptions are made:
The limit of earnings against which contributions are chargeable increases in line with inflation.
The revenue grant for each fund remains at its current percentage of contributions (i.e. 15% of GIF
and 12% of GHSF).
The ratio of contributions on behalf of employed people (from both the employer and employee) to
that paid by self‐employed and non‐employed people remains constant at the level reported in
2010.
Break even rates are reported in terms of the headline employee/employer rates. Self‐employed and
non‐employed rates are assumed to change in proportion to the changes to the headline rate.
19 Covering the full extent of the population projections produced by the UK Government Actuary’s department

Page | 35
Break even rates represent the operating surplus deficit of the fund (i.e. in year expenditure vs.
income from contributions and revenue grants) and do not incorporate the use of reserves.
The progression of the fund reserves across the period is modelled on an iterative basis based on the
operating surplus/deficit and investment income. Given the known weakness of financial markets in
2011, particularly in the later half, the fund reserves are assumed to have made no real gain on
investment in 2011. After 2011, reserves are assumed to receive 3.5% annual return on investment
regardless of the size of the remaining capital20.
9.1. Guernsey Insurance Fund
The GIF is already running an operational deficit (£3.6m in 2010) and this is projected to increase over the
period shown. In particular there is a marked increase projected between 2011 and 2012 as the current
population statistics show the first (and one of the largest21) “baby boom” year capturing those born
between March 1946 and March 1947 will be registered as having moved into the retirement age in 2012.
From 2012 onward the break even contribution rate for the GIF is projected to continue to increase reaching
a peak of 11.4% in 2040 using the +200 net migration model and of 13.0% in 2039 using the constant
population model (see Figure 9.1.1. and Table 9.1.1.)
Figure 9.1.1. GIF break even contribution rate 2% real earnings growth
Table 9.1.1. GIF break even employers/employee contribution rate 2% real earnings growth
GIF break even contribution rate in 2040
(%)
+200 net migration 11.4
Constant population 13.0
In 2010 (for comparison) 8.7
20 This is the same assumption of investment return as used by the UK government Actuary’s in the actuarial review.
21 March 2010 population statistics show 997 people in this year of age compared to 613 people who were one year older and 808 people who were
one year younger.

Page | 36
Figures 9.1.2 and 9.1.3 show the effect decreased earnings growth could have on the break even
contribution rate for this fund.
Figure 9.1.2. GIF break even contribution rate: The effect of varying real annual earnings growth, +200 net migration model
Figure 9.1.3. GIF break even contribution rate: The effect of varying real annual earnings growth, Constant population model
9.2. The Guernsey Long Term Care Fund
Although running a surplus in 2010, the expenditure of the long term care has increased in nominal terms by
more than 50% in the last five years. The projections presented in Figure 9.2.1. indicate that the fund will
begin running a deficit between 2015 and 2020. By 2040, the break even contribution rate for this fund is
projected to increase from its current level of 1.1%22 to 2.3% using the +200 net migration model and 2.8%
using the constant population model.
Figure 9.2.1. LTCF break even contribution rate 2% real earnings growth
22 Actual contribution rate in 2010 was 1.3%

Page | 37
Table 9.2.2. LTCF break even employers/employee contribution rate 2% real earnings growth and 3% increase in healthcare costs per capita
LTC break even contribution rate in 2040
(%)
+200 net migration 2.3
Constant population 2.8
In 2010 (for comparison) 1.1
Figures 9.2.2 and 9.2.3 show the effect decreased earnings growth could have on the break even
contribution rate for this fund.
Figure 9.2.2. LTCF break even contribution rate: The effect of varying real annual earnings growth, +200 net migration model
Figure 9.2.3. LTCF break even contribution rate: The effect of varying real annual earnings growth, Constant population model

Page | 38
9.3. Guernsey Health Service Fund
As stated earlier the position of the GHSF was not projected by the Government Actuary’s Department in the
same manner as the GIF and LTCF, the projections spanning only five years. The projections presented below
show that, assuming increases in the GHSF fund expenditure progresses in the same manner as central
healthcare by HSSD the fund may be running a deficit by 2020.
According to these projections by 2040 the break even contribution rate will have increased from 2.7%23 in
2010 to 3.7% using the +200 net migration model or 4.1% using the constant population models.
Figure 9.3.1. GHSF break even contribution rate 2% real earnings growth and 2% increase in healthcare costs per capita
Table 9.3.3. GHSF break even employers/employee contribution rate 2% real earnings growth and 2% increase in healthcare costs per capita
GHSF break even contribution rate in 2040
(%)
+200 net migration 3.7
Constant population 4.1
In 2010 (for comparison) 2.7
Figure 9.3.2. to 9.3.5. show the impact of varying earnings growth and healthcare expenditure growth on the break even contribution rate.
23 The current employer/employee contribution rate to this fund is 2.9%.

Page | 39
Figure 9.3.2. GHSF break even contribution rate: The effect of varying real annual earnings growth, +200 net migration model
Figure 9.3.3. GHSF break even contribution rate: The effect of varying real annual earnings growth, constant population model
Figure 9.3.4. GHSF break even contribution rate: The effect of varying real annual growth in healthcare expenditure, +200 net migration model
Figure 9.3.5. GHSF break even contribution rate: The effect of varying real annual growth in healthcare expenditure, constant population model

Page | 40
9.4. Use of reserves
As previously mentioned, the reserves currently held in the Social Security Funds could be utilised to
mitigate the effects of increased demand. To illustrate this Figure 9.4.1 shows the progression of the GIF
reserves assuming an increase in the rate of contributions to the fund from 201324 onwards sufficient to
ensure reserves do not drop below the equivalent of two years of annual expenditure between now and
2070.
An immediate increase (in 2013) of 0.9% in the +200 net migration model and 1.8% assuming a static
population to 2070 could maintain the level of reserves in the GIF above two years of expenditure beyond of
the period covered by the population projections. This compares to increases in the breakeven contribution
rate for the GIF of 3.1% or 4.7% by 2040 referred to above: vividly illustrating the mitigating effects of using
the reserves and early action.
Figure 9.4.1. Guernsey Insurance Fund: projections of reserves with assumed immediate increases 2% real earnings growth and 2% increase in healthcare costs per capita
24 This is the earliest point at which an increase could reasonably be made.

Page | 41
10. Conclusion
With the first of the “baby boom” generation progressing into retirement in 2012 the States of Guernsey
face a prolonged period during which a high proportion of the population will be largely dependent on the
government for pensions, long‐term residential, nursing, health and social care.
The impact of demographic change and the issues surrounding the aging population on public expenditure
are considerable and wide reaching affecting both Revenue and Social Security expenditure and economic
growth prospects. What is clear is that the costs of current levels of service with current funding models will
rise as a result of demographics. Positive net migration alleviates the problem but it does not fully resolve it.
The purpose of this report is to put forward potential future scenarios in order to help policymakers in
Guernsey plan for these scenarios. It does not attempt to prescribe policy solutions. These projections do
not imply that the correct policy response is to ensure revenues rise to meet the projected demands, nor do
they suggest that expenditure must be contained to current shares of GDP and services reduced accordingly.
However, policy changes will be required if public expenditure is to be sustainable in the medium and long
term.
The objective, in publishing these projections, is to inform policy debate and ensure that the context and
potential future costs of the welfare system, in its present form, is fully understood and choices rationally
made.

Page | 42
Appendix 1. The effect of the retirement age increase
The projected decrease in the working age population and the increase in the retired population means that
the dependency ratio (the ratio of the non‐working age (dependent) population, who are either below the
minimum school leaving age and above the age of retirement, to the working age population) will increase
significantly from its current level of 0.48 (or 48 dependent people for every 100 working age people) over
the next 30 years.
In light of this, in December 2008 the States passed legislation increasing the age at which a States pension
can be claimed by 2 months a year between 2020 and 2032, increasing it from 65 to 67 across this period.
These changes have been included in the projected size of the working age and retired population presented
above and the estimated workforce utilised in the estimation of revenue and economic output.
Figure 1 shows the impact of the increase in retirement age on the dependency ratio. Using the +200 net
migration model the increase of the retirement age reduces the dependency ratio in 2040 for 0.76 (76
dependents for every 100 people of working age) to 0.70 (70 dependents for every 100 people of working
age).
Figure 1. Dependency ratios

Page | 43
Appendix 2. The effect of varying the average rate of earnings growth
The main body of this report assumes a 2% per annum real growth in average earnings. However, although
this assumption is consistent with Guernsey historic mean average earnings growth, following the recent
economic stress speculation has arisen among economists regarding the possibility of a long term reduction
in the average growth rate of developed economies. In order to consider the potential impact this would
have on Guernsey’s economic growth Figures 1 and 2 show the effect on GDP in both models of reducing the
long term growth in earnings to 1%.
The effect of this reduction on both models is, over the period shown, more significant than effect of varying
the population growth assumption. The degree of impact on GDP using the two population models is similar,
each being reduced by 26% by 2040.
Figure 1. GDP: the effect of varying earnings
growth, +200 net migration model
Figure 2. GDP: the effect of varying earnings growth, constant population model
Aggregate Expenditure
Figure 3 and 4 illustrate the potential impact of decreased economic growth (using the assumption of an
assumed decrease in earnings growth) would have on the cost of aggregate public expenditure relative to
the size of the economy.
Again the effect on the two models is similar (although slightly more pronounced in the constant population
model) increasing aggregate expenditure by approximately 27% relative to GDP.

Page | 44
Figure 3. Aggregate expenditure: the effect of varying real annual earnings growth, +200 net migration model
Figure 4. Aggregate expenditure: the effect of varying real annual earnings growth, constant population model
Expenditure by area Figures 5 to 16 show the assumed impact of the long term decrease in earnings and economic growth on the
various expenditure areas. The impact is more pronounced in those areas where expenditure is considered
to be a function of the population size: health; education and the Social Security Funds, than in other general
revenue expenditure where the expenditure is assumed to be moderated in line with the available income
after the SSP horizon.
Figure 5. Total public expenditure on healthcare: the effect of varying real annual earnings growth on the +200 net migration model
Figure 6. Total public expenditure on healthcare: the effect of varying real annual earnings growth on the constant population model

Page | 45
Figure 7. Guernsey Insurance Fund: the effect of varying earnings growth, +200 net migration model
Figure 8. Guernsey Insurance Fund: the effect of varying earnings growth, constant population model
Figure 9. Long Term Care Fund: the effect of varying earnings growth, +200 net migration model
Figure 10. Long Term Care Fund: the effect of varying earnings growth, constant population model

Page | 46
Figure 11. Education expenditure: the effect of varying real annual earnings growth on the +200 net migration model
Figure 12. Education expenditure: the effect of varying real annual earnings growth on the constant population model
Figure 13. Revenue expenditure on SSD: the effect of varying real annual earnings growth on the +200 net migration model
Figure 14. Revenue expenditure on SSD: the effect of varying real annual earnings growth on the constant population model

Page | 47
Figure 15. Other general revenue and capital expenditure : the effect of varying earnings growth on the +200 net migration model
Figure 16. Other general revenue and capital expenditure : the effect of varying earnings growth on the constant population model
Expenditure by funding source
Figures 17 to 20 show the effect of reduced earnings growth on expenditure by the area of funding relative
to GDP (i.e. by general revenue funds or by Social Security contributions.).
The impact on general revenue is to increase the level of expenditure relative to the economy in 2040 by
24% in both models (although again the impact is slightly higher in the constant population model). The
impact of on expenditure funded by SSD is more pronounced, increasing relative to GDP by 37% to a total of
15% of GDP.
Figure 17. General revenue expenditure: the effect of varying real annual earnings growth, +200 net migration model
Figure 18. General revenue expenditure: the effect of varying real annual earnings growth, constant population model

Page | 48
Figure 19. SSD expenditure funded by contributions income: The effect of varying real annual earnings growth, +200 net migration model
Figure 20. SSD expenditure funded by contributions income: The effect of varying real annual earnings growth, constant population model

Page | 49
Appendix 3. Methodological Background for Healthcare Modelling
Modelling of healthcare expenditure is particularly challenging and fraught with unknowns. Future medical
and technological breakthroughs could have a major impact on health expenditure on both the positive and
negative sides. The progression of social issues which impact health (such as drugs, alcohol, smoking and
obesity) may also have a significant impact on the average cost of healthcare and average life expectancy.
The success of policies designed to tackle such issues could result in savings both in terms of lives and public
expenditure. However failure to tackle significant issues could result in an additional burden on the public
purse.
Figure 1. Relative distribution of healthcare costs by age and by proximity to death in England.
The average cost of healthcare per capita increases significantly with age (see Figure 5.3.1) and also with
proximity to death. This has a potentially significant impact on healthcare expenditure in Guernsey with an
increasing percentage of the population in the older age groups likely to result in an increase in overall
healthcare costs per capita beyond that caused by price inflation alone25,26,27.
Price inflation in medical costs also tends to be significantly higher than that exhibited by the economy as a
whole. Between 2001 and 2009 the OECD reported a real average increase in UK general government
expenditure on public health per capita of 5%, with an overall average annual increase of 4% in all reported
countries over the same period28. This level of inflation is due partly to increased cost of existing medical
service and partly due to the continuing development of new and more sophisticated medical treatments.
This also has significant implications for the cost of health services in the Island, implying a likely real
increase in medical care costs independent of changes in the population.
25 Seshamani, M. and A. Gray (2002), “Ageing and Health‐care Expenditure: The Red Herring Argument Revisited”, Health Economics 13,303–314.
26 Alastair Gray, “Population Ageing and Healthcare Expenditure”, University of Oxford, Aging horizons Issue no. 2
27 Constantina Safiliou‐Rothschild, “Are Older People Responsible For High Healthcare Costs? “,CESifo Forum 1/2009
28 http://stats.oecd.org

Page | 50
Appendix 4. The effect of varying healthcare expenditure
The central projection of healthcare expenditure growth used in the primary modelling is that the cost of
healthcare per capita will increase by 2% each year ‐ the same rate assumed rate as the growth in average
earnings. However, between 2006 and 2010 the total cost of healthcare per capita (including HSSD and
GHSF) increased by an average 2.9%, 0.9 percentage points higher than the mean average increase in
earnings over the same period. As, in these models, earnings are the primary driver of revenue for the States
of Guernsey this position is fundamentally unsustainable in the long term as it will inevitably lead to a faster
rate of growth in expenditure than income.
This appendix examines the impact of varying the assumption of per capita growth in healthcare expenditure
on public spending.
Aggregate Expenditure
Figures 1 and 2 show the impact of both reducing and increasing the level of healthcare expenditure growth
by 1 percentage point on aggregate public expenditure. This results in a range of possible expenditure
outcome ranging from 27.6% to 33.4% of GDP in 2040 using the +200 net migration model and 30.6% and
37.0% of GDP using the constant population model.
Figure 1. Aggregate Expenditure: The effect
of varying real annual growth in
healthcare expenditure per capita,
+200 net migration
Figure 2. Aggregate Expenditure: The effect of varying real annual growth in healthcare expenditure per capita, constant population
The projections show that, in order to maintain expenditure at its current level relative to the size of the
economy using the +200 net migration model, the increase in healthcare expenditure per capita would need
to be restrained to approximately 1 percentage point less than the increase in average earnings. However,
using the constant population model the aggregate expenditure relative to GDP may increase to more than
its current level (27.9%) even if per capita growth in healthcare expenditure is restrained to this level.

Page | 51
Healthcare expenditure
The total public expenditure on healthcare (including the expenditure of both HSSD and the GHSF) could
increase by an additional 3.3 percentage points of GDP by 2040 if healthcare expenditure per capita were
allowed to increase by one percentage point more than average earnings (using the +200 net migration
model). This would increase total public expenditure on health from 7.4% of GDP in 2010 to 12.9% in 2040.
Should healthcare costs per capita consistently grow at a faster rate than earnings, the principle driver of
public sector income, expenditure growth will outstrip income growth in the long term. This position is
fundamentally unsustainable even without the added pressure of an increased level of demand as a result of
the aging population.
In order to maintain public expenditure on health to it current level relative to GDP health inflation per
capita would need to be restrained to at least 1 percentage point below the growth in average earnings.
Figure 3. Total public expenditure on healthcare: The effect of varying real annual growth in healthcare expenditure per capita, +200 net migration
Figure 4. Total public expenditure on healthcare: The effect of varying real annual growth in healthcare expenditure per capita, constant population
10.2. Expenditure by funding source
Figures 5 to 8 show the relative impact of varying the healthcare expenditure assumptions on both general
revenue expenditure and expenditure funded by Social Security contributions. It can be seen that, because
of the larger burden of healthcare carried by HSSD (and therefore general revenue) than the GHSF (funded
by SSD contributions) the impact on general revenue is much larger than in the SSD funded expenditure.
Varying the healthcare expenditure assumptions between 1% and 3% per capita per annum produces a
range of projective general revenue expenditure between 16.4 and 20.7% of GDP (using the +200 net
migration model) and SSD contributions funded expenditure of between 9.7 and 11.1% of GDP.

Page | 52
Figure 1. General revenue expenditure: The effect of varying real annual growth in healthcare expenditure per capita on the +200 net migration
Figure 2. General revenue expenditure: The effect of varying real annual growth in healthcare expenditure per capita on the constant population
Figure 3. SSD expenditure funded by contributions income: The effect of varying real annual growth in healthcare expenditure per capita, +200 net migration
Figure 4. SSD expenditure funded by contributions income: The effect of varying real annual growth in healthcare expenditure per capita, constant population
Page | 53
Appendix 5. Other areas of revenue expenditure
Social Security Revenue Expenditure
As has been the methodology throughout this report, the projections are based on current service levels and
current funding models. No account has been attempted to account for potential changes that have not yet
been agreed by the States. The projections for Social Security expenditure funded from general revenue
exhibits little growth over the forecast horizon. This is due, in the main to the assumption of continued
recent practice of an increase in benefit levels lower than the historic average annual earnings increase.
Similarly, no account is attempted of potential changes in structural levels of claimants through either
changed economic circumstance, or changed eligibility criteria.
Although the expenditure of the SSD administered funds is not incorporated in the general revenue budget,
non‐contributory benefits (those to which you are eligible regardless of your contributions record) such as
supplementary benefit, are funded directly from general revenue.
In addition, a grant (known as the revenue grant) is paid from general revenue to the Guernsey Insurance
Fund (GIF) and the GHSF. The revenue grant is a formula led expenditure, equal to 15% of Social Security
Contributions to the GIF and 12% of contributions to the GHSF29. Combined the revenue grant represents
12.5% of the total amount of income received by SSD from contributions.
Modelling in this section is based on the method and assumptions mentioned in previous sectors plus:
SSD non‐contributory benefits
o The benefits incorporated by the revenue portion of SSD expenditure have been broken
down and modelled as proportional to the age group deemed most applicable (e.g. Family
allowance is modelled against the population 0‐16, Incapacity benefit against the working
age population).
o The rate at which benefit payments are made is assumed to increase at 1% per annum in
real terms.
o The number of claimants for each benefit is assumed to remain at a constant proportion of
the population against which they are modelled30.
Revenue grant to SSD funds
o The revenue grant is modelled at a constant rate of 15% of contributions to the Guernsey
Insurance Fund (GIF) and 12% of contributions to the (GHSF).
o Contributions are calculated based on the current rates applied to aggregate income figures extracted from the models used to calculate GDP projections.
29 No grant is paid to the Long Term Care Fund
30 It is acknowledged that this assumption regards to supplementary benefit claimants may be flawed, as the number of which can vary considerably
dependent on the economic conditions. In particular it is likely that, should long‐term economic growth reduce it is likely that the number of household requiring additional financial support will increase.

Page | 54
Figure 1. Total expenditure from General Revenue on Social Security 2% real earnings growth
Table 1 Total expenditure by General Revenue on Social Security 2% real earnings growth
Revenue expenditure on
SSD in 2010
Revenue expenditure on
SSD in 2016
Revenue expenditure on
SSD in 2040
£ million % GDP £ million % GDP £ million % GDP
+200 net migration 49 2.6 56 2.5 81 2.3
Constant population 49 2.6 53 2.5 71 2.4
Education
Education is also, by nature, intrinsically linked to the demographic profile. However, unlike healthcare costs,
it is the younger age groups that have the largest impact on expenditure. As fertility rates have fallen in the
last 40 years and the youngest of the ‘baby boom’ generation are now moving beyond their child bearing
age the number of children being born in the Island is projected to fall over the next thirty years resulting in
a smaller number of children than in the current demographic profile.
Education costs have been modelled using the following assumptions:
Education expenditure is assumed to be proportional to the population in the applicable age groups
for the level of education (primary, secondary, tertiary etc).
The cost of education per capita in each age group is assumed to increase in real terms at 2% per
annum.
The projected savings resulting from the FTP have been apportioned by department in the same
proportions as the overall expenditure in 2010. The savings within education have been apportioned
to the per capita expenditure levels.
Administrative costs are assumed to increase in real terms at 2% per annum independent of the
population.

Page | 55
Figure 2. Total education expenditure 2% real earnings growth
Table 2 Education expenditure
Education expenditure
in 2010
Education expenditure
in 2016
Education expenditure
in 2040
£ million % GDP £ million % GDP £ million % GDP
+200 net migration 73 3.8 71 3.2 111 3.1
Constant population 73 3.8 67 3.2 99 3.8
Other general revenue and capital expenditure (excluding Health, Education and Social Security)
The expenditure areas included in this section are those less directly linked to the population. This includes
expenditure by the majority of States Departments. As such these have been modelled using the following
assumptions:
In line with the expenditure profile outlined in the SSP expenditure in these areas shows not real
increase between 2010 and 2016
After 2016 expenditure increases at the same rate as GDP
The projected savings resulting from the FTP have been apportioned by department in the same
proportions as the overall expenditure in 2010.
Capital expenditure is projected to follow the path outlined in the SSP until 2016 and remain at a
constant proportion of GDP thereafter (See Box 4).

Page | 56
Figure 3. Other general revenue and capital expenditure, +200 net migration 2% real earnings growth
Figure 4. Other general revenue and capital expenditure, constant population 2% real earnings growth

Page | 57
Figure 5. Other general revenue and capital expenditure 2% real earnings growth
Table 3 Other general revenue and capital expenditure 2% real earnings growth
Other general revenue
expenditure in 2010
Other general revenue
expenditure in 2016
Other general revenue
expenditure in 2040
£ million % GDP £ million % GDP £ million % GDP
+200 net migration 138 7.2 129 5.7 204 5.7
Constant population 138 7.2 129 6.2 183 6.2

Page | 58
Box 1. Capital expenditure and the Fiscal Framework
The assumptions made in this section maintain capital expenditure at the level of GDP projected in 2016.
However it should be noted that under the guidelines of the Fiscal Framework, The States are required to
allocate 3% of GDP to capital expenditure per annum. The effect this has on the expenditure is illustrated in
the Figure 1. All totals in the report to the 2040 horizon assume the lower level of capital expenditure. If the
States were to meet its policy commitment around an additional 1% of GDP of revenues is required, or cuts
in other expenditure, or alternative funding of capital expenditure considered. This is not a policy issue for
this report.
Figure 1. Total revenue and capital expenditure excl. Health, Education and Social Security with capital expenditure increasing to 3% of GDP after 2016.

Page | 59
Appendix 6. Progression of reserves held by SSD funds
Guernsey Insurance Fund
Figure 1 below shows the progression of the GIF fund reserve based on the central assumption of 2%
earnings growth. At the end of 2010 there were approximately six years of expenditure in the reserve. The
effect of both the deficit and the increase in the level of expenditure is to erode the value of the reserve
relative to expenditure over time. Although this is partially offset by the return on investment, particularly in
the early stages when there is still a significant volume of funds in the reserve, this results in a depletion of
the fund reserves to less than 1 year of expenditure in 2040 using the +200 net migration model and
complete exhaustion of the fund in the mid 2030s using the constant population model.
Figure 1. GIF‐ progression of the reserve at current rate 2% real earnings growth
Figures 2 and 3 show the potential impact that reduced earnings growth could have on the progress of the
reserve. It can be seen that, should the island experience an extended period of lower earnings growth this
could significantly reduce the level of reserves and hasten the exhaustion of the fund.
Figure 2. GIF‐ progression of the reserve at current rate: The effect of varying real annual earnings growth, +200 net migration model
Figure 3. GIF progression of the reserve at current rate: The effect of varying real annual earnings growth, constant population model

Page | 60
Figure 4 and 5 show the effect of increasing the assumed contributions rates from 2013 onwards. An
increase in the contribution rate, even if by less than 1 percentage point has a significant impact on the
projected value of the fund. However, because of the larger workforce (and therefore greater contributions
income) in the +200 net migration model, the effect of raising contributions rates is more pronounced in this
model than in the constant population model.
Raising the contribution rate from its current rate (8.3%) to 8.8% results in more than three times the
available funds in 2040 using the +200 net migration model, and a three year delay in the exhaustion of the
fund using the constant population model.
It should be noted that although the pensions cost bulge due to the baby boom population is projected to
reach its peak towards the end of the 30 year period covered in this report, the operating break even
contribution rate is likely to remain in excess of 10% until at least 2060. As a result the fund reserves are
likely to continue to fall beyond the 2040 horizon.
Figure 4. GIF‐ progression of the reserve: The effect of varying the contribution rate from 2013, +200 net migration model
Figure 5. GIF‐ progression of the reserve at current rate: The effect of varying the contribution rate from 2013, constant population model
Long Term Care Fund
As the youngest and smallest of the three funds the reserves held by the LTCF are significantly smaller
relative to its expenditure than the reserves of the GIF shown in the section above. Using the central
assumption of 2% annual growth in earnings, these projections indicate that the LTCF will be exhausted by
2028 using the +200 net migration model and by 2025 using the constant population model.
Figures 7 and 8 show the effect of reduced earnings growth on the reserves held by this fund.

Page | 61
Figure 6. LTCF‐ progression of the reserve at current rate 2% real earnings growth
Figure 7. LTCF‐ progression of the reserve at
current rate: The effect of varying real annual earnings growth, +200 net migration model
Figure 8. LTCF progression of the reserve at current rate: The effect of varying real annual earnings growth, constant population model
Figures 9 and 10 show the impact of increasing the contributions rate for the LTC fund on the progression of
the fund reserves relative to expenditure. As seen in the GIF the impact of this in the +200 net migration
model is larger than in the constant population model.
Of the contribution rates shown 1.9% is the lowest at which the fund remains in credit until 2040 using the
+200 model. However, at this level using the constant population model the fund will be exhausted before
the end of the period shown.

Page | 62
Figure 9. LTCF‐ progression of the reserve: The effect of varying the contribution rate from 2013, +200 net migration model
Figure 10. LTCF‐ progression of the reserve at current rate: The effect of varying the contribution rate from 2013, constant population model
Guernsey Health Service Fund
Figure 11 shows the progression of the GHSF reserve at the current contribution rate. The GHSF currently
has the lowest level of reserves relative to its expenditure of the three funds administered by SSD and these
projections indicate that, under the central assumptions of 2%per annum earnings growth and 2% per capita
per annum growth in healthcare costs, the reserves will become exhausted between 2026 and 2028.
Figure 11. GHSF‐ progression of the reserve at current rate 2% real earnings growth and 2% increase in healthcare costs per capita
Figures 12 to 15 show the effect on the fund reserve progression of varying the assumptions of average
earnings and healthcare expenditure growth. In this instance the effect of varying the healthcare
expenditure assumptions is more significant than the variation in earnings.

Page | 63
Under the +200 net migration model by restraining the annual increase in expenditure per capita to 1
percentage point less than earnings growth at the current level of contributions the fund value is projected
to increase and remain above its current level relative to expenditure. However, growth in healthcare
expenditure per capita 1 percentage point above the annual growth in earnings could shorten the lifespan of
this fund by more than 10 years.
Figure 12. GHSF‐ progression of the reserve: The effect of varying real annual earnings growth, +200 net migration model
Figure 13. GHSF‐ progression of the reserve: The effect of varying real annual earnings growth, Constant population model
Figure 14. GHSF‐ progression of the reserve: The effect of varying real annual growth in healthcare expenditure, +200 net migration model
Figure 15. GHSF‐ progression of the reserve: The effect of varying real annual growth in healthcare expenditure, Constant population model

Page | 64
Figures 16 to 17 show the impact on the progression of the GHSF of varying the contribution rate to the
reserve. Using the assumption of 2% earnings growth and 2% growth in healthcare costs, the GHSF would
require a contribution rate of 3.1% in order to have funds left in reserve in 2040.
Figure 16. GHSF‐ progression of the reserve: The effect of varying the contribution rate from 2013, +200 net migration model
2% real earnings growth and 2% increase in healthcare costs per capita
Figure 17. GHSF‐ progression of the reserve at current rate: The effect of varying the contribution rate from 2013, constant population model
2% real earnings growth and 2% increase in healthcare costs per capita

Page | 65
This report is published by the Policy Council, Policy and Research Unit
Tel: 01481 717168
Email: [email protected]
Web: www.gov.gg/pru