
Potential of remote sensing of cirrus optical thickness by ...
21
Atmos. Chem. Phys., 17, 4283–4303, 2017 www.atmos-chem-phys.net/17/4283/2017/ doi:10.5194/acp-17-4283-2017 © Author(s) 2017. CC Attribution 3.0 License. Potential of remote sensing of cirrus optical thickness by airborne spectral radiance measurements at different sideward viewing angles Kevin Wolf 1 , André Ehrlich 1 , Tilman Hüneke 2 , Klaus Pfeilsticker 2 , Frank Werner 1,a , Martin Wirth 3 , and Manfred Wendisch 1 1 Leipzig Institute for Meteorology, University of Leipzig, Leipzig, Germany 2 Institute of Environmental Physics, University of Heidelberg, Heidelberg, Germany 3 Institute of Atmospheric Physics, German Aerospace Center, Oberpfaffenhofen, Germany a now at: Joint Center for Earth Systems Technology, University of Maryland, Baltimore, MD, USA Correspondence to: Kevin Wolf ([email protected]) Received: 2 November 2016 – Discussion started: 4 November 2016 Revised: 27 February 2017 – Accepted: 8 March 2017 – Published: 30 March 2017 Abstract. Spectral radiance measurements collected in nadir and sideward viewing directions by two airborne passive so- lar remote sensing instruments, the Spectral Modular Air- borne Radiation measurement sysTem (SMART) and the Differential Optical Absorption Spectrometer (mini-DOAS), are used to compare the remote sensing results of cirrus op- tical thickness τ . The comparison is based on a sensitivity study using radiative transfer simulations (RTS) and on data obtained during three airborne field campaigns: the North Atlantic Rainfall VALidation (NARVAL) mission, the Mid- Latitude Cirrus Experiment (ML-CIRRUS) and the Aerosol, Cloud, Precipitation, and Radiation Interactions and Dynam- ics of Convective Cloud Systems (ACRIDICON) campaign. Radiative transfer simulations are used to quantify the sen- sitivity of measured upward radiance I with respect to τ , ice crystal effective radius r eff , viewing angle of the sensor θ V , spectral surface albedo α, and ice crystal shape. From the calculations it is concluded that sideward viewing mea- surements are generally better suited than radiance data from the nadir direction to retrieve τ of optically thin cirrus, espe- cially at wavelengths larger than λ = 900 nm. Using sideward instead of nadir-directed spectral radiance measurements sig- nificantly improves the sensitivity and accuracy in retrieving τ , in particular for optically thin cirrus of τ ≤ 2. The comparison of retrievals of τ based on nadir and side- ward viewing radiance measurements from SMART, mini- DOAS and independent estimates of τ from an additional ac- tive remote sensing instrument, the Water Vapor Lidar Exper- iment in Space (WALES), shows general agreement within the range of measurement uncertainties. For the selected ex- ample a mean τ of 0.54 ± 0.2 is derived from SMART, and 0.49 ± 0.2 by mini-DOAS nadir channels, while WALES ob- tained a mean value of τ = 0.32 ± 0.02 at 532 nm wave- length, respectively. The mean of τ derived from the side- ward viewing mini-DOAS channels is 0.26 ± 0.2. For the few simultaneous measurements, the mini-DOAS sideward chan- nel measurements systematically underestimate (-17.6 %) the nadir observations from SMART and mini-DOAS. The agreement between mini-DOAS sideward viewing channels and WALES is better, showing the advantage of using side- ward viewing measurements for cloud remote sensing for τ ≤ 1. Therefore, we suggest sideward viewing measure- ments for retrievals of τ of thin cirrus because of the signifi- cantly enhanced capability of sideward viewing compared to nadir measurements. 1 Introduction The impact of cirrus on the atmospheric radiative energy bud- get and the Earth’s climate system is uncertain (IPCC, 2013), which is partly due to the limited knowledge about the for- mation and development of cirrus (Sausen et al., 2005). Until now the fraction that homogeneous or heterogeneous ice nu- Published by Copernicus Publications on behalf of the European Geosciences Union.
Transcript of Potential of remote sensing of cirrus optical thickness by ...
Atmos. Chem. Phys., 17, 4283–4303, 2017www.atmos-chem-phys.net/17/4283/2017/doi:10.5194/acp-17-4283-2017© Author(s) 2017. CC Attribution 3.0 License.
Potential of remote sensing of cirrus optical thickness by airbornespectral radiance measurements at different sidewardviewing anglesKevin Wolf1, André Ehrlich1, Tilman Hüneke2, Klaus Pfeilsticker2, Frank Werner1,a, Martin Wirth3, andManfred Wendisch1
1Leipzig Institute for Meteorology, University of Leipzig, Leipzig, Germany2Institute of Environmental Physics, University of Heidelberg, Heidelberg, Germany3Institute of Atmospheric Physics, German Aerospace Center, Oberpfaffenhofen, Germanyanow at: Joint Center for Earth Systems Technology, University of Maryland, Baltimore, MD, USA
Correspondence to: Kevin Wolf ([email protected])
Received: 2 November 2016 – Discussion started: 4 November 2016Revised: 27 February 2017 – Accepted: 8 March 2017 – Published: 30 March 2017
Abstract. Spectral radiance measurements collected in nadirand sideward viewing directions by two airborne passive so-lar remote sensing instruments, the Spectral Modular Air-borne Radiation measurement sysTem (SMART) and theDifferential Optical Absorption Spectrometer (mini-DOAS),are used to compare the remote sensing results of cirrus op-tical thickness τ . The comparison is based on a sensitivitystudy using radiative transfer simulations (RTS) and on dataobtained during three airborne field campaigns: the NorthAtlantic Rainfall VALidation (NARVAL) mission, the Mid-Latitude Cirrus Experiment (ML-CIRRUS) and the Aerosol,Cloud, Precipitation, and Radiation Interactions and Dynam-ics of Convective Cloud Systems (ACRIDICON) campaign.Radiative transfer simulations are used to quantify the sen-sitivity of measured upward radiance I with respect to τ ,ice crystal effective radius reff, viewing angle of the sensorθV, spectral surface albedo α, and ice crystal shape. Fromthe calculations it is concluded that sideward viewing mea-surements are generally better suited than radiance data fromthe nadir direction to retrieve τ of optically thin cirrus, espe-cially at wavelengths larger than λ= 900 nm. Using sidewardinstead of nadir-directed spectral radiance measurements sig-nificantly improves the sensitivity and accuracy in retrievingτ , in particular for optically thin cirrus of τ ≤ 2.
The comparison of retrievals of τ based on nadir and side-ward viewing radiance measurements from SMART, mini-DOAS and independent estimates of τ from an additional ac-
tive remote sensing instrument, the Water Vapor Lidar Exper-iment in Space (WALES), shows general agreement withinthe range of measurement uncertainties. For the selected ex-ample a mean τ of 0.54± 0.2 is derived from SMART, and0.49± 0.2 by mini-DOAS nadir channels, while WALES ob-tained a mean value of τ = 0.32± 0.02 at 532 nm wave-length, respectively. The mean of τ derived from the side-ward viewing mini-DOAS channels is 0.26± 0.2. For the fewsimultaneous measurements, the mini-DOAS sideward chan-nel measurements systematically underestimate (−17.6 %)the nadir observations from SMART and mini-DOAS. Theagreement between mini-DOAS sideward viewing channelsand WALES is better, showing the advantage of using side-ward viewing measurements for cloud remote sensing forτ ≤ 1. Therefore, we suggest sideward viewing measure-ments for retrievals of τ of thin cirrus because of the signifi-cantly enhanced capability of sideward viewing compared tonadir measurements.
1 Introduction
The impact of cirrus on the atmospheric radiative energy bud-get and the Earth’s climate system is uncertain (IPCC, 2013),which is partly due to the limited knowledge about the for-mation and development of cirrus (Sausen et al., 2005). Untilnow the fraction that homogeneous or heterogeneous ice nu-
Published by Copernicus Publications on behalf of the European Geosciences Union.

4284 K. Wolf et al.: Potential of remote sensing of cirrus optical thickness
cleation contributes to the cirrus formation has not been suf-ficiently quantified (Cziczo et al., 2013). As a result, the evo-lution of the cirrus microphysical properties during its life-cycle is insufficiently represented in climate models (IPCC,2013). Furthermore, the influence of cirrus on the Earth’s ra-diation budget is highly variable because it strongly dependson their microphysical properties such as ice crystal num-ber, size and shape (Zhang et al., 1999; Chen et al., 2000;Wendisch et al., 2005, 2007; Yang et al., 2012). In particu-lar, optically thin cirrus (τ ≤ 0.03), so called sub-visible cir-rus (SVC), is difficult to observe and not well represented ingeneral circulation models (Wiensz et al., 2013). Sub-visiblecirrus may extend over large areas (Davis et al., 2010). There-fore, their influence on the energy budget of the Earth canprobably not be neglected. Lee et al. (2009) estimated the an-nually and globally averaged radiative forcing of SVC with+1 W m−2 (warming effect), while the local forcing might besignificantly higher. Especially the location and time whereSVC occurs determine their radiative effects. Whether SVCheats or cools the atmosphere depends on surface albedo α,solar zenith angle θ0 and cirrus optical thickness τ (Fu andLiou, 1993). In general SVC and cirrus have a heating effectat the top-of-atmosphere (TOA) since the reduction of out-going infrared radiation usually dominates the cooling effectdue to reflection of solar radiation (McFarquhar et al., 2000;Comstock et al., 2002; Davis et al., 2010).
In order to quantify the microphysical and optical proper-ties of SVC, which are needed to determine their radiativeeffects, more observations of this cloud type are required.As a consequence, several satellite missions and field stud-ies were performed in the past, e.g., by Wang et al. (1996),Winker and Trepte (1998), Sassen et al. (2009), and Jensenet al. (2015), to establish a reliable database on SVC. Air-borne in situ measurements by Lampert et al. (2009), Daviset al. (2010), Froyd et al. (2010), and Frey et al. (2011) wereutilized to determine ice crystal size and ice crystal shapeof SVC. Optical and microphysical parameters derived fromthese measurements are used in radiative transfer simulations(RTS) and numerical weather prediction and climate mod-eling (Kärcher, 2002). Despite these efforts, in situ obser-vations of SVC are still scarce and partly accidental due tothe challenge of locating SVC. Lampert et al. (2009) sam-pled an Arctic SVC after it was detected by an airbornelidar. Airborne campaigns dedicated to visible cirrus, e.g.,the Contrail, volcano and Cirrus Experiment (CONCERT,Voigt et al., 2010), Mid-Latitude Cirrus (ML-CIRRUS, Voigtet al. (2016)) and tropical cirrus sampled during the AirborneTropical TRopopause EXperiment (ATTREX) are more fre-quent (Delanoe et al., 2013; Ehret et al., 2014; Gross et al.,2015; Jensen et al., 2015) and occasionally include observa-tions of SVC. Further international airborne missions like theTropical Composition, Cloud and Climate Coupling (TC4)(Toon et al., 2010) and the Cirrus Regional Study of Tropi-cal Anvils and Cirrus Layers – Florida Area Cirrus Experi-ment (CRYSTAL-FACE) mission were conducted, trying to
fill the knowledge gap about the formation process and phys-ical properties of tropical cirrus (Jensen et al., 2015).
While satellite observations are suited to study the globalcoverage of cirrus, their spatial and temporal resolution isstill limited and can not resolve the high spatial variability ofcirrus. As a consequence the three-dimensional (3-D) radia-tive effects of different cirrus properties, e.g., τ , ice crystalsize and shape, can not be studied using the coarse resolutionof satellite remote sensing. Ground-based lidar and radar re-mote sensing can provide a high temporal resolution but arelimited to a fixed location. In situ airborne measurements canprovide cirrus properties with both.
For passive remote sensing of cirrus, nadir and sidewardviewing observations are available. For nadir measurementsτ and the effective radius reff of liquid water droplets canbe retrieved by the bi-spectral reflectivity method followingTwomey and Seton (1980) and Nakajima and King (1990).Ou et al. (1993), Rolland et al. (2000), and King et al. (2004)adapted this method for ice clouds by introducing some mod-ifications with regard to the thermodynamic phase and crystalshape of the ice particles. Especially due to the crystal shapeand low values of τ , cirrus retrievals lead to additional uncer-tainties compared to liquid water clouds (Eichler et al., 2009;Fricke et al., 2014).
For low τ , the reflected radiation is dominated by the sur-face reflection below the cirrus. This may introduce a biasin the retrieval of τ of up to 30 % when α is not accu-rately known or inhomogeneous (Fricke et al., 2014). Overdark ocean surfaces the radiance I reflected by the cirrusmight be weak and can be on the same order of magnitudeas Rayleigh scattering in the atmosphere. In addition, inho-mogeneities of cirrus lead to three-dimensional (3-D) radia-tive effects, which may cause a bias in the one-dimensional(1-D) radiative transfer simulations (Eichler et al., 2009). In-correctly assumed ice crystal shapes also contribute to theretrieval uncertainty. Eichler et al. (2009) investigated the in-fluence of ice crystal shape on derived τ and reff. Evaluatinga case study, they concluded that different shapes can lead torelative differences in τ of up to 70 %. In a worst-case sce-nario, all these effects render retrievals of τ rather inaccurate.However, observations in the sideward or limb viewing direc-tion and improvements of retrieval techniques may overcomethese limitations.
Limb measurements of SVC and cirrus were first intro-duced and utilized for satellite measurements by Wood-bury and McCormick (1986). Since then, several applicationsbased on this method have been developed and are routinelyused, e.g., for trace gas measurements (Abrams et al., 1996;Wang et al., 1996; Clerbaux et al., 2003; Bourassa et al.,2005; Fu et al., 2007).
Many trace gas retrievals from aircraft, balloons and satel-lites are based on ultraviolet (UV)/visible (VIS)/near infrared(IR) sideward viewing measurements in combination withdifferential optical absorption spectroscopy (DOAS), e.g.,performed by Platt and Stutz (2008). Compared to nadir ob-
Atmos. Chem. Phys., 17, 4283–4303, 2017 www.atmos-chem-phys.net/17/4283/2017/

K. Wolf et al.: Potential of remote sensing of cirrus optical thickness 4285
servations, radiance measurements in limb or sideward view-ing geometry are supposed to be more sensitive to opticallythin clouds due to their observation geometry. One recentstudy was accomplished by Wiensz et al. (2013), who usedsatellite limb measurements, especially for SVC investiga-tion in the tropical tropopause layer. This data source im-proved SVC observations with respect to cloud climatologyand microphysics.
In the present study, retrievals of τ are based on simultane-ous airborne nadir and sideward viewing observations of cir-rus and are compared to elaborate the potential of sidewardviewing measurements to derive optical parameters of SVCand optically thin cirrus. This includes a sensitivity study us-ing RTS presented in Sect. 2 and measurements collected onboard the High Altitude and LOng range research aircraft(HALO) of the German Aerospace Center (DLR). With amaximum ceiling altitude of around 15 km HALO is capableof operating in and above SVC and cirrus at mid-latitudesand in polar regions for in situ measurements. The airborneobservations are obtained with the Spectral Modular Air-borne Radiation measurement sysTem (SMART) (Wendischet al., 2001) and the Differential Optical Absorption Spec-trometer (mini-DOAS) (Hüneke, 2016) both assembled onHALO. The instrumentation is introduced in Sect. 3. Obser-vations from four campaigns, the Mid-Latitude Cirrus ex-periment (ML-CIRRUS), the Next-generation Aircraft Re-mote sensing for Validation Studies (NARVAL North andSouth), and the Aerosol, Cloud, Precipitation, and Radia-tion Interactions and Dynamics of Convective Cloud Systems(ACRIDICON-CHUVA) (Wendisch et al., 2016) are usedto cross-calibrate the two individual instruments in termsof absolute radiance I as presented in Sect. 4. In Sect. 5an iterative retrieval of τ is introduced. Utilizing the cross-calibrations together with nadir and sideward viewing mea-surements of upward I , the retrieved results are presentedand compared to reference measurements of τ to emphasizethe advantages of sideward viewing observations. Section 6concludes the study.
2 Sensitivity of upward radiance measurements in thenadir and sideward viewing directions
Radiative transfer simulations are performed to investigatethe sensitivity of solar radiance measurements in nadir andsideward viewing geometry for SVC and thin cirrus. In thisway the potential of sideward viewing versus nadir observa-tions for cirrus cloud parameter detection is examined.
Figure 1 illustrates the measurement geometry. The solarzenith angle θ0 is the angle between zenith and the Sun. Theviewing angle θV represents the angle of the sensor viewingdirection which is measured between the line-of-sight (LOS)and the nadir direction. For a sensor measuring in nadir θVis 0◦ and a sensor orientation close to the horizon is aroundθV ≈ 90◦. The relative solar azimuth angle φ represents the
angle between the LOS and the Sun’s direction. It is calcu-lated from the difference in the azimuth angle of the Sun andthe azimuth angle of the observation geometry of the opticalinlets. For φ = 0◦ the LOS is pointing directly in the direc-tion of the Sun and with φ = 180◦ the LOS is looking awayfrom the Sun.
For the RTS a typical mid-latitude cirrus with a cloud baseheight of 10 km and a cloud top height of 12 km is assumed.This closely represents the cloud situation which is investi-gated in Sect. 4. Calculations are performed for θ0 = 25, 50and 75◦, representing three different scenarios. The relativesolar azimuth angle is set to φ = 0, 90 and 180◦.
The simulations are carried out with the libRadtran 2.0 ra-diative transfer package (Mayer and Kylling, 2005). The For-tran 77 discrete ordinate radiative transfer solver version 2.0(FDISORT 2) following Stamnes et al. (2000) is selected torun the simulations. The incoming extraterrestrial solar fluxdensity given by Gueymard (2004) is applied and molec-ular absorption is calculated using LOWTRAN (Pierluissiand Peng, 1985). A marine aerosol profile is chosen (Shet-tle, 1989), and for vertical profiles of temperature, humidity,and pressure, a mid-latitude summer atmosphere profile isassumed. A spectral α typically for oceans is chosen accord-ing to Clark et al. (2007). To represent ice crystals, a mixtureof different particle shapes is used when not otherwise spec-ified. The ice crystal scattering phase function is parameter-ized according to Yang et al. (2013).
2.1 Wavelength sensitivity
Using solar spectral radiation for passive remote sensingpurposes, measurements at wavelengths sensitive to scatter-ing and absorption by liquid water droplets and ice crystalsare selected. Wavelengths less than λ= 900 nm are appliedto retrieve τ from nadir radiance measurements. Figure 2apresents simulated upward radiances IRTS reflected by an op-tically thin cirrus with τ = 0.03 and reff = 10 µm, as wellas clear sky radiance as a function of the sensor viewingangle. Radiative transfer simulations for two wavelengths,λ= 532 nm and λ= 1180 nm, are carried out. To easily dis-tinguish the different geometries, simulated I in nadir ge-ometry is denoted with IN
RTS, while all geometries deviatingfrom nadir are referred to sideward viewing geometry and areindicated by IV
RTS. The sensitivity ετ is defined by
ετ =dIdτ. (1)
In general, IVRTS increases with increasing θV due to the
longer LOS. For a wavelength of λ= 532 nm, no differ-ence between cloudy and clear sky conditions is discerniblefor all θV, because Rayleigh scattering by molecules dom-inates and exceeds the scattering by thin cirrus. There-fore, at λ= 532 nm SVC with τ = 0.03, which is presentedin the simulations, can not be detected. Conversely, for
www.atmos-chem-phys.net/17/4283/2017/ Atmos. Chem. Phys., 17, 4283–4303, 2017

4286 K. Wolf et al.: Potential of remote sensing of cirrus optical thickness
Figure 1. Illustration of the measurement geometry. (a) shows the side view with solar zenith angle θ0 and the viewing angle θV. The openingangle of the nadir looking radiance sensor of SMART is indicated by 1. The top view (b) shows the definition of the relative solar azimuthangle φ between the line-of-sight (LOS) and the Sun.
Figure 2. Simulated upward radiance IRTS at λ= 532 nm and λ= 1180 nm for the cloudy (solid line) and clear sky (dashed line) cases as afunction of the viewing angle θV. The left plot shows simulations for a SVC with τ = 0.03 (a) and the right plot presents the simulations fora thick cirrus with τ = 2.0 (b). In the corresponding lower plots the relative difference between cloud and clear sky atmosphere with respectto the cloudy atmosphere is shown.
λ= 1180 nm separation between the simulations with andwithout cirrus at large viewing angles for θV > 70◦ is presentbecause the reflected IV
RTS is increased due to a larger LOS.At λ= 1180 nm wavelength Rayleigh scattering is compara-bly weak and does not significantly contribute to the reflectedradiation. In the nadir direction, a detection of SVC is notpossible due to low τ and the overwhelming backscatteringfrom the ground.
For comparison, simulations of a thicker cirrus withτ = 2.0 are presented in Fig. 2b. Here, the influence of theRayleigh scattering at λ= 532 nm is reduced and a distinc-tion between cloudy and clear-sky becomes possible. How-ever, the relative difference between cloudy and clear-skyconditions is still more pronounced at λ= 1180 nm.
The RTS suggest that sideward viewing observations atnear-IR wavelengths (λ > 900 nm) are more suitable for thedetection of SVC and cirrus. As a result the retrieval inSect. 4 is performed at 1180 and 1600 nm wavelengths in theIR region, which are sensitive to τ and reff and not disturbedby Rayleigh scattering.
2.2 Optical thickness and viewing angle
In general, back-scattered radiation by clouds increases withincreasing τ . This sensitivity (see Eq. 1) is the basis of mostretrieval algorithms of cloud optical properties. To quantifyhow ετ is effected by θV of the sensor, RTS are performedfor a set of different θV ranging between θV = 0◦ (nadir) andθV = 90◦ (sideward viewing). Cirrus optical thickness is var-ied in the range of τ = 0.03–4 covering various kinds of cir-rus clouds.
The first simulations presented in Fig. 3 display simu-lated IRTS,1180 at λ= 1180 nm wavelength for two differentθ0 = 25◦ (a) and θ0 = 75◦ (b) as a function of τ . For eachscenario, ετ is calculated and given in the lower panels ofFig. 3. Simulations for nadir geometry are represented bysolid black lines. Results for sideward viewing sensor orien-tations are shown by dashed (θV = 53◦) and gray (θV = 78◦)lines. All scenarios show an increase in IV
RTS for increasingτ , which results from enhanced reflection.
Due to the apparently longer LOS for both θ0, sidewardviewing sensor orientations yield larger ετ of simulated IV
RTSas compared to the nadir geometry for cirrus clouds with
Atmos. Chem. Phys., 17, 4283–4303, 2017 www.atmos-chem-phys.net/17/4283/2017/

K. Wolf et al.: Potential of remote sensing of cirrus optical thickness 4287
Figure 3. Simulated radiance IRT,1180 for three different sensor orientations as a function of cirrus optical thickness τ . Results for solarzenith angles of θ0 = 25◦ (a) and θ0 = 75◦ (b) are displayed. The sensitivity ετ is given in the lower panels.
τ ≤ 1 which includes SVC. This indicates that sideward mea-surements are most suited to retrieve τ below 1 and for thedetection of SVC. The almost linear increase in the nadir ra-diance IN
RTS indicates a constant ετ for the investigated rangeof τ and θ0. For τ ≥ 1 the sensitivity of sideward viewingobservations is in the same range compared to nadir mea-surements or slightly lower depending on the combination ofθ0 and θV.
For low τ and a high Sun, the highest ετ is given for thesideward viewing geometry (θV = 78◦) for τ ≤ 1. A similarpattern emerges for low Sun (θ0 = 75◦), resulting in largerετ and a steep decrease for increasing τ . It shows that ετdecreases with τ and for τ < 2 drops below ετ of nadir mea-surements. The sensitivity of I with respect to τ can also beinterpreted in terms of the uncertainty of retrieved τ relatedto an initial uncertainty in measured I . The higher the ετ , theweaker the impact of uncertainties in the measurements onthe uncertainties of the retrieved τ . As shown in Fig. 3b, ahigh ετ is calculated for IRTS,1180 for τ ≤ 1 and indicates alower measurement uncertainty. Therefore, sideward viewingobservations at λ= 1180 nm allow a more accurate determi-nation of τ compared to nadir observations for optically thinclouds with τ ≤ 1.
In a second step, the influence of φ is investigated on IVRTS
in respective simulations.Figure 4 shows ετ for a wide range of θV between 0◦ and
90◦ and φ between 0◦ and 180◦ for two clouds with τ = 0.1and τ = 2 and two different solar zenith angles (SZA) ofθ0 = 25◦ and θ0 = 75◦. The graphs represent ετ in units ofmW m−2 nm−1 sr−1 for different φ as a function of θV.
For τ = 0.1 and θ0 = 25◦ (Fig. 4a), ετ ranges between 5and 66 mW m−2 nm−1 sr−1. For larger θV (sideward viewingobservations), ετ increases significantly, reaching the max-imum for θV = 90◦ and φ = 0◦. Observations under theseangles are better suited in comparison to other angle com-binations as they enable us to achieve the largest possible ετ
and reduced relative measurement errors, which results in in-creased retrieval accuracy.
A similar pattern is derived for simulations assuming alower Sun (θ0 = 75◦) as shown in Fig. 4b. Compared toθ0 = 25◦ the increase in ετ for θV = 90◦ and φ = 0◦ isstronger, reaching values of 377 mW m−2 nm−1 sr−1, whilefor all other geometries ετ almost remains constant at thesame magnitude, reaching 80 mW m−2 nm−1 sr−1. Addition-ally, the maximum ετ is more concentrated on a single com-bination of θV and φ represented by the high peak for φ = 0compared to all other φ. Therefore, measurements in therange of these angles are recommended to achieve high val-ues of ετ for reasonable retrievals of τ .
Figure 4c shows the simulated ετ for clouds of τ = 2, θ0 =
25◦ and a wide range of geometries. Compared to the opti-cally thin cirrus, the maximum of ετ is reduced for opticalthick cirrus, not exceeding a value of 15 mW m−2 nm−1 sr−1
and shifted to smaller θ0. While sideward viewing measure-ments are predicted to become saturated for thick clouds, forlow τ the optimal θV is about θV = 60◦, with the largest ετoccurring for φ between 0 and 60◦. Respective simulationsfor τ = 2, θ0 = 75◦ (low Sun) are presented in Fig. 4d. Here,the maximum of ετ is small, with 5 mW m−2 nm−1 sr−1 atθV and φ = 0 compared to all other simulations varying τand θ0.
The RTS show that the choice of the best viewing geom-etry (nadir or sideward viewing observations) strongly de-pends on τ and φ. In order to probe a large range of cirruswith sufficiently large retrieval sensitivity, measurements indifferent viewing directions, at least in the nadir and side-ward viewing directions depending on τ and θ0, are recom-mended. Measurements in sideward viewing geometry arestrongly dependent on θV, especially around θV = 90◦. In or-der to avoid spurious results by mispointing with the sensor, acareful alignment of the optical sensor and an accurate deter-mination is required. Considering these findings, the retrievalof τ in Sect. 4 is performed for θV ≤ 60◦ only.
www.atmos-chem-phys.net/17/4283/2017/ Atmos. Chem. Phys., 17, 4283–4303, 2017

4288 K. Wolf et al.: Potential of remote sensing of cirrus optical thickness
Figure 4. Sensitivity ετ at 1180 nm in units of mW m−2 sr−1 as a function of viewing angle θV and relative solar azimuth angle φ forcirrus optical thickness τ and solar zenith angle θ0. Panel (a) for τ = 0.1, θ0 = 25◦, Panel (b) for τ = 0.1, θ0 = 75◦, and Panel (c) for τ = 2,θ0 = 25◦ in (c) and (d) for τ = 2, θ0 = 75◦. Different scales of the plots have to be considered.
2.3 Influence of surface albedo
The influence of α on the retrieval of cloud optical proper-ties derived by passive remote sensing using the ModerateResolution Imaging Spectroradiometer (MODIS) was inves-tigated by Rolland and Liou (2001). They showed that re-trievals of clouds with τ < 0.5 are strongly influenced byvariations in α. Based on RTS, Fricke et al. (2014) concludedthat IN measured in the nadir direction strongly depends onthe underlying surface reflectivity and that uncertainties inassumed α may cause errors of up to 50 % in the retrieval ofτ .
In order to quantify and compare the influence of α onI measured in different θV and nadir directions, RTS areperformed. To cover the natural variability of surfaces rang-ing from ocean surface to ice-covered regions, α is var-ied between α = 0.1 and α = 0.9. Figure 5 shows simulatedIV
RTS,1180 at λ= 1180 nm wavelength for two clouds withτ = 0.1 and τ = 2 and both observation geometries.
In general, the reflected I increases with increasing α. Thestronger the increase, the more strongly the measurementsare effected by α. For both observation geometries, the steep-
Figure 5. Influence of the surface albedo α on the measured upwardradiance IV
RTS,1180 at λ= 1180 nm as a function of cirrus opticalthickness τ and sensor orientation θV.
est derivative,
γ =dIdα, (2)
Atmos. Chem. Phys., 17, 4283–4303, 2017 www.atmos-chem-phys.net/17/4283/2017/
K. Wolf et al.: Potential of remote sensing of cirrus optical thickness 4289
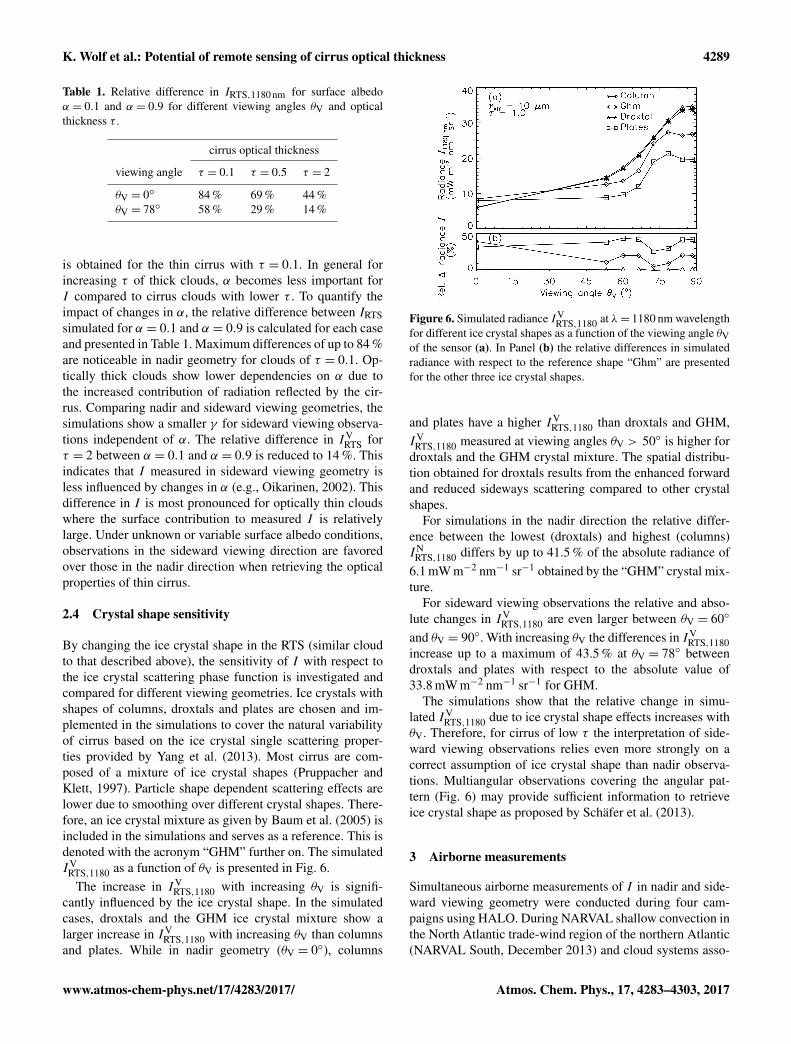
Table 1. Relative difference in IRTS,1180 nm for surface albedoα = 0.1 and α = 0.9 for different viewing angles θV and opticalthickness τ .
cirrus optical thickness
viewing angle τ = 0.1 τ = 0.5 τ = 2
θV = 0◦ 84 % 69 % 44 %θV = 78◦ 58 % 29 % 14 %
is obtained for the thin cirrus with τ = 0.1. In general forincreasing τ of thick clouds, α becomes less important forI compared to cirrus clouds with lower τ . To quantify theimpact of changes in α, the relative difference between IRTSsimulated for α = 0.1 and α = 0.9 is calculated for each caseand presented in Table 1. Maximum differences of up to 84 %are noticeable in nadir geometry for clouds of τ = 0.1. Op-tically thick clouds show lower dependencies on α due tothe increased contribution of radiation reflected by the cir-rus. Comparing nadir and sideward viewing geometries, thesimulations show a smaller γ for sideward viewing observa-tions independent of α. The relative difference in IV
RTS forτ = 2 between α = 0.1 and α = 0.9 is reduced to 14 %. Thisindicates that I measured in sideward viewing geometry isless influenced by changes in α (e.g., Oikarinen, 2002). Thisdifference in I is most pronounced for optically thin cloudswhere the surface contribution to measured I is relativelylarge. Under unknown or variable surface albedo conditions,observations in the sideward viewing direction are favoredover those in the nadir direction when retrieving the opticalproperties of thin cirrus.
2.4 Crystal shape sensitivity
By changing the ice crystal shape in the RTS (similar cloudto that described above), the sensitivity of I with respect tothe ice crystal scattering phase function is investigated andcompared for different viewing geometries. Ice crystals withshapes of columns, droxtals and plates are chosen and im-plemented in the simulations to cover the natural variabilityof cirrus based on the ice crystal single scattering proper-ties provided by Yang et al. (2013). Most cirrus are com-posed of a mixture of ice crystal shapes (Pruppacher andKlett, 1997). Particle shape dependent scattering effects arelower due to smoothing over different crystal shapes. There-fore, an ice crystal mixture as given by Baum et al. (2005) isincluded in the simulations and serves as a reference. This isdenoted with the acronym “GHM” further on. The simulatedIV
RTS,1180 as a function of θV is presented in Fig. 6.The increase in IV
RTS,1180 with increasing θV is signifi-cantly influenced by the ice crystal shape. In the simulatedcases, droxtals and the GHM ice crystal mixture show alarger increase in IV
RTS,1180 with increasing θV than columnsand plates. While in nadir geometry (θV = 0◦), columns
Figure 6. Simulated radiance IVRTS,1180 at λ= 1180 nm wavelength
for different ice crystal shapes as a function of the viewing angle θVof the sensor (a). In Panel (b) the relative differences in simulatedradiance with respect to the reference shape “Ghm” are presentedfor the other three ice crystal shapes.
and plates have a higher IVRTS,1180 than droxtals and GHM,
IVRTS,1180 measured at viewing angles θV > 50◦ is higher for
droxtals and the GHM crystal mixture. The spatial distribu-tion obtained for droxtals results from the enhanced forwardand reduced sideways scattering compared to other crystalshapes.
For simulations in the nadir direction the relative differ-ence between the lowest (droxtals) and highest (columns)IN
RTS,1180 differs by up to 41.5 % of the absolute radiance of6.1 mW m−2 nm−1 sr−1 obtained by the “GHM” crystal mix-ture.
For sideward viewing observations the relative and abso-lute changes in IV
RTS,1180 are even larger between θV = 60◦
and θV = 90◦. With increasing θV the differences in IVRTS,1180
increase up to a maximum of 43.5 % at θV = 78◦ betweendroxtals and plates with respect to the absolute value of33.8 mW m−2 nm−1 sr−1 for GHM.
The simulations show that the relative change in simu-lated IV
RTS,1180 due to ice crystal shape effects increases withθV. Therefore, for cirrus of low τ the interpretation of side-ward viewing observations relies even more strongly on acorrect assumption of ice crystal shape than nadir observa-tions. Multiangular observations covering the angular pat-tern (Fig. 6) may provide sufficient information to retrieveice crystal shape as proposed by Schäfer et al. (2013).
3 Airborne measurements
Simultaneous airborne measurements of I in nadir and side-ward viewing geometry were conducted during four cam-paigns using HALO. During NARVAL shallow convection inthe North Atlantic trade-wind region of the northern Atlantic(NARVAL South, December 2013) and cloud systems asso-
www.atmos-chem-phys.net/17/4283/2017/ Atmos. Chem. Phys., 17, 4283–4303, 2017

4290 K. Wolf et al.: Potential of remote sensing of cirrus optical thickness
Figure 7. (a) Optical inlets of mini-DOAS (b) and SMART (c)mounted at the lower aircraft fuselage.
ciated with the North Atlantic mid-latitude stormtrack (NAR-VAL North, January 2014) were probed (Klepp et al., 2014).During the ML-CIRRUS campaign natural and contrail cir-rus in the mid-latitudes were investigated in March and April2014 (Voigt et al., 2016). Deep convective clouds were ob-served during the Aerosol, Cloud, Precipitation, and Radi-ation Interactions and Dynamics of Convective Cloud Sys-tems (ACRIDICON-CHUVA) mission in September 2015(Wendisch et al., 2016).
During these missions, a suite of different active andpassive remote sensing instruments was operated on boardHALO, including passive solar radiance measurements bySMART (Wendisch et al., 2016; Ehrlich et al., 2008) andthe mini-DOAS (Hüneke, 2016). While SMART measuredradiometrically calibrated radiance IN
S in the nadir direction,the mini-DOAS instrument simultaneously measures in thenadir and varying sideward viewing directions in UV/VIS/IRwavelength ranges. The mini-DOAS measurements are tra-ditionally analyzed by applying the DOAS technique. DOASrelies on an analysis of intensity ratios of two spectroscopicobservations made under largely different atmospheric con-ditions. By exploiting ratios of I , DOAS measurements areinherently radiometrically calibrated in a relative but not ab-solute sense. Therefore no absolute radiometric calibrationfor I for the mini-DOAS is available. In addition to the twopassive sensors, active lidar measurements with the WaterVapor Lidar Experiment in Space (WALES) were performedduring NARVAL and ML-CIRRUS.
In Fig. 7a the position of the apertures at the aircraftfuselage is indicated. The optical inlets of mini-DOAS andSMART for upward radiation are shown in Fig. 7b and c,respectively.
3.1 The SMART instrument
Depending on the configuration, SMART measures spectralupward F↑S,λ and downward irradiance F↓S,λ, as well as spec-tral upward radiance IN
S . The system is extensively describedin Wendisch et al. (2001) and Ehrlich et al. (2008). In thispaper the focus is on IN
S measurements which are availablefor the four HALO missions introduced above.
Table 2. Individual sources of uncertainty and total uncertainties forthe upward radiance IN
S,1180 at a wavelength of λ= 1180 nm.
Source of uncertainty λ= 1180 nm
INS,1180 Spectral calibration < 1 %
Radiometric calibration 8.5 %Signal-to-noise ratio 11.6 %Transfer calibration < 1.1 %
Total 14.5 %
To cover almost the entire solar spectral range, SMARTmeasures IN
S with two separate spectrometers, one for theVIS range from λ= 300 nm to λ= 1000 nm and a sec-ond one for sampling the IR range from λ= 900 nm toλ= 2200 nm. By merging the spectra, about 97% of the so-lar spectrum is covered (Bierwirth et al., 2009, 2010). Thespectral resolution defined by the full width at half maximum(FWHM) is 8–10 nm for the IR spectrometer and 2–3 nm forthe VIS spectrometer.
The radiance optical inlet of SMART has an opening angleof 1= 2◦ and a sampling time of 0.5 s. Considering aircraftgroundspeed and the distance of 500 m between the cloudand the aircraft the resulting footprint is about 18× 110 m foran individual IN
S measurement. For a distance of 1000 m be-tween sensor and cloud the footprint increases to 35× 220 m.
Prior to each campaign SMART was radiometrically cali-brated in the laboratory using certified calibration standardstraceable to NIST and by secondary calibration using a trav-elling standard during the operation on HALO. The totalmeasurement uncertainty of IN
S is about 5.4 % for the VISand 14.5 % for the IR range which consist of individual er-rors due to the spectral calibration, the spectrometer noiseand dark current, the radiometric calibration and the transfercalibration (Brückner et al., 2014). In Table 2 the contribu-tions of each individual source of uncertainty is given formeasurements at λ= 1180 nm wavelength. The main uncer-tainty results from the signal-to-noise ratio (SNR) and thecalibration standard, while spectral and transfer calibrationerrors are almost negligible. Averaging a time series of mea-surements will reduce the contribution of sensor noise to thesignal.
3.2 The mini-DOAS instrument
The mini-DOAS is a passive airborne remote sensing systemoriginally designed to retrieve vertical profiles of trace gases,aerosol and cloud particles (Hüneke, 2016). The analysis isbased on the DOAS technique that applies least square re-trievals to the spectral shape of the observed upward radianceIV
mD by the mini-DOAS in sideward viewing channels (Plattand Stutz, 2008). Spectral absorption bands of moleculesand particles are measured at moderate spectral resolution(FWHM= 0.47, 1.2 and 10 nm for the UV, VIS and IR, re-
Atmos. Chem. Phys., 17, 4283–4303, 2017 www.atmos-chem-phys.net/17/4283/2017/

K. Wolf et al.: Potential of remote sensing of cirrus optical thickness 4291
spectively) to quantify the absorption of solar radiation bytrace gases along the light path. DOAS measurements areprimarily used to infer trace gas concentrations and associ-ated photochemistry in the atmosphere. Here, measured IV
mDare employed for the remote sensing of clouds.
The mini-DOAS is designed as a compact, lightweight androbust system to be operated aboard HALO. The instrumentconsists of six telescopes which are connected via fiber bun-dles to six optical spectrometers. One set of the optical in-lets is fixed in the nadir configuration, while the other tele-scopes can be tilted between θV = 0◦ and θV = 90◦. Twosets of three different spectrometers are applied to cover theUV spectral range from 310 to 440 nm (FWHM 0.5 nm), theVIS range from 420 to 650 nm (FWHM 1 nm) and the IRrange from 1100 to 1680 nm (FWHM 10 nm). In the UV andVIS range, charged–coupled device (CCD) sensors are usedas detectors. The detection in the IR range is performed byphoto diode arrays (PDAs).
The telescopes are mounted on an aperture plate at thelower side of the aircraft fuselage. The scanning telescopeshave rectangular fields-of-view of about 0.6◦ in vertical di-rection and 3◦ in horizontal direction. During scanning mea-surements the telescopes are directed to the starboard side ofthe aircraft. Changes in aircraft roll angles are compensatedwithin 0.2◦. The orientation of the nadir telescope is kept fixwith respect to the aircraft major axis. Therefore no compen-sation of the aircraft roll angle is performed.
The evacuated spectrometer housing is immersed into anisolated water/ice tank to ensure a constant temperature andpressure of the spectrometers independent of changing out-side conditions. Evacuation of the housing and temperaturestabilization is necessary to guarantee a stable optical imag-ing, which is indispensable for DOAS applications. A spec-tral calibration of the spectrometers ensures that wavelengthshifts are less than 0.05 nm.
3.3 The WALES instrument
The Water Vapor Lidar Experiment in Space Demonstra-tor (WALES) is an airborne Differential Absorption Lidar(DIAL) with additional aerosol and cloud detection capa-bilities operated on the German research aircraft Falcon andHALO (Wirth et al., 2009).
For particle detection WALES has two backscatter anddepolarization channels at λ= 532 nm and λ= 1064 nmwavelength and an additional high spectral resolution lidar(HSRL) channel at λ= 532 nm (Esselborn et al., 2008). TheHSRL channel allows the retrieval of the backscatter coeffi-cient of clouds at λ= 532 nm without assumptions about thephase function of the cloud particles. Unfortunately, largercirrus particles usually show a pronounced forward scatter-ing peak, which may contain a significant fraction of thescattered energy. This may lead to an underestimation of τcalculated from the individual particle extinction cross sec-tions (see, e.g., Platt, 1981). The optical thickness data pre-
sented in this paper are corrected for the forward scatteringeffect following the algorithm proposed by Eloranta (1998).To apply this correction scheme, an reff is assumed, whichdetermines the width of the forward scattering peak. Thebest compensation of the multiple scattering decay below thecloud is found for reff = 35± 5 µm, in good agreement withthe climatological values proposed by Bozzo et al. (2008).The mean correction factor for the data set shown in this pa-per was 7 %.
4 Cross-calibration
Since no radiometric calibration is available for mini-DOAS,simultaneous measurements of SMART and mini-DOASare used to cross-calibrate the mini-DOAS with SMART.The cross-calibration relies on the radiometric calibration ofSMART and allows us to derive calibrated ImD from mini-DOAS measurements. Flight sections with inhomogeneousα and various cloud conditions are selected to obtain a cali-bration valid for a wide range of different I . Such conditionswere present during the ML-CIRRUS flight on 26 March2014, including measurements over southern Germany, Bel-gium, the United Kingdom, Ireland and the northern AtlanticOcean west of Ireland. The cross-calibration is performedfor the nadir and sideward viewing scanning telescopes ofthe mini-DOAS when aligned to the same cloud area asSMART. The results are presented for two wavelengths atλ= 1180 nm and λ= 1600 nm which are frequently usedin cloud retrievals and show the best discrimination poten-tial for small τ as presented in the sensitivity study. Dif-ferent FWHMs of both spectrometer systems are consideredby convoluting the spectrally higher resolved measurementsof the mini-DOAS with the corresponding FWHM of theSMART spectrometer (8–19 nm).
4.1 Nadir radiance
The nadir sensors of the mini-DOAS operate in a fixed posi-tion, thus providing a large data set of simultaneous mea-surements with SMART. The time stamps of both instru-ments are corrected for temporal offsets in the data acquisi-tion. Scatter plots of IN
S,λ and mini-DOAS raw data are shownin Fig. 8a and c for both wavelengths. For each data pointa linear regression following Theil (1992) and Sen (1968)is performed. Using the method of Theil and Sen, the in-fluence of outliers on the regression is reduced and the lin-ear calibration equation IN
S,λ = a0 ·NNmD,λ+ a1 for the mini-
DOAS radiances is determined. INS,λ is the radiance mea-
sured by SMART, NNmD,λ the raw signal of mini-DOAS and
a0 and a1 the calibration coefficients. The linear regressionsare indicated by the gray lines in Fig. 8a and c. For the ML-CIRRUS flight on 26 March 2014 the nadir geometry calibra-tion coefficients are determined as a0 = 0.31 mW m−2 sr−1
and a1 = 0.55 mW m−2 sr−1 for λ= 1180 nm with an uncer-
www.atmos-chem-phys.net/17/4283/2017/ Atmos. Chem. Phys., 17, 4283–4303, 2017

4292 K. Wolf et al.: Potential of remote sensing of cirrus optical thickness
Figure 8. Panels (a) and (c) show comparisons of SMART radiance INS and mini-DOAS raw signal for nadir channels at λ= 1180 nm and
λ= 1600 nm wavelength. Panels (b) and (d) show time series of measured SMART radiance INS,λ and calibrated mini-DOAS radiance IN
mD,λfor the ML-CIRRUS flight on 26 March 2014. The shaded areas indicate the measurement uncertainties.
tainty of ±0.24 mW m−2 sr−1. Similar calibrations are per-formed for flights during the NARVAL and ACRIDICON-CHUVA campaigns. All calibration coefficients are summa-rized in Table 3. The coefficients depend on various environ-mental conditions where the temperature dependence of themini-DOAS spectrometers is the most influential parameter.
The uncertainty is mostly related to differences in the field-of-view (FOV) and the related difference in the observedscene and possible minor mismatches of the nadir orienta-tion of both sensors. This means that both sensors do not al-ways observe the exact same cloud area. For the λ= 1600 nmwavelength, a0 is higher compared to λ= 1180 nm in allanalyzed flights, indicating the different spectral sensitivi-ties of both sensors with SMART in comparison with mini-DOAS, being relatively more sensitive at λ= 1600 nm thanat λ= 1180 nm wavelength.
The derived cross-calibrations of mini-DOAS are appliedto all mini-DOAS measurements. A measurement exampleof a time series of calibrated mini-DOAS radiances IN
mD,λ isshown in Fig. 8b and d for an 18 min flight section measuredon 26 March 2014.
The radiance time series for λ= 1180 nm of both sensorsagree within the SMART error range for most data points, ex-cept for some radiance peaks. These differences likely resultfrom the different FOV of both instruments and the presenceof patches of low cumulus with high reflectivity. A similar re-sult is obtained for λ= 1600 nm. The differences in the meanradiance between both instruments for the time period pre-sented in Fig. 8 are 0.75 mW m−2 nm−1 sr−1 at λ= 1180 nmand 0.5 mW m−2 nm−1 sr−1 at λ= 1600 nm, which results
in relative differences of 5.4 % at λ= 1180 nm and 1.9 % atλ= 1600 nm compared to the SMART absolute values.
4.2 Sideward viewing radiance
The scanning telescopes of the mini-DOAS typically run ina sequential mode scanning different θV. During selectedflight segments the scanning sequences are configured to in-clude nadir measurements. Due to this sequential mode lessmeasurements from the sideward viewing channels are avail-able for cross-calibration with SMART because only mea-surements in nadir sensor orientation are applicable for thecross-calibration. To ensure a statistically sufficient numberof samples, the entire flight of 26 March 2014 is analyzedapplying the same methods used for the calibration of thenadir channels. Figure 9a and c show the cross-calibration ofSMART radiances IN
S,λ and mini-DOAS raw data NVmD,λ and
the linear fit (gray line) used for calibration.For the IR scanning channels the calibration coefficients
are determined as a0 = 0.31 mW m−2 sr−1 with no offset a1for λ= 1180 nm and an uncertainty of ±0.2 mW m−2 sr−1.Similar to the nadir channels, the calibration coefficients forthe the sideward viewing channel at λ= 1600 nm wavelengthwith a0 = 0.47 are higher compared to the λ= 1180 nmwavelength.
The calibration of the sideward viewing channels is re-peated for the NARVAL flights, while for all ACRIDICON-CHUVA flights no nadir observations of the sideward view-ing channels are available. Table 3 provides a summary ofall calibration coefficients derived for the sideward viewingchannels.
Atmos. Chem. Phys., 17, 4283–4303, 2017 www.atmos-chem-phys.net/17/4283/2017/

K. Wolf et al.: Potential of remote sensing of cirrus optical thickness 4293
Table 3. Calibration coefficients a0 and a1 in units of mW m−2 nm−1 sr−1 for mini-DOAS nadir and scanning channel radiance obtainedfor NARVAL (19 December 2013), ML-CIRRUS (26 March 2014) and ACRIDICON-CHUVA (9, 12 and 23 September 2014).
1180 nm 1600 nm
Nadir sideward viewing Nadir sideward viewing
(mW m−2 nm−1 sr−1)
a0 a1 a0 a1 a0 a1 a0 a1
NARVAL (19.12.) 0.26 5.40 0.23 0.90 0.28 1.32 0.26 0.10ML-CIRRUS (26.03.) 0.31 0.55 0.31 0.00 0.43 0.25 0.47 0.02ACRIDICON-CHUVA (09.09) 0.24 5.28 0.37 2.80ACRIDICON-CHUVA (12.09.) 0.34 0.94 0.51 0.77ACRIDICON-CHUVA (23.09.) 0.31 3.43 0.40 0.59
Figure 9. Panels (a) and (c) show a comparison of SMART radiance INS,λ and mini-DOAS raw signal NV
mD,λ for the scanning channels at
λ= 1180 nm and λ= 1600 nm wavelength. Panels (b) and (d) show time series of measured SMART radiance INS,λ and calibrated mini-
DOAS radiance IVmD,λ for the ML-CIRRUS flight on 26 March 2014. The shaded areas indicate the measurement errors.
Similarly to Fig. 8b and d, Fig. 9b and d show time seriesof SMART radiance IN
S,λ and calibrated mini-DOAS nadirobservations of IV
mD,λ with the sideward viewing channelsfor an 18 min flight segment of ML-CIRRUS on 26 March2014. In general, the radiance pattern observed by SMARTis represented by the calibrated mini-DOAS radiance. How-ever, individual data points differ due to differences in FOV,resulting in mean differences of 0.78 mW m−2 nm−1 sr−1
at 1180 nm and 0.38 mW m−2 nm−1 sr−1 at λ= 1600 nm,which results in relative differences of 3.7 % at λ= 1180 nmand 2.4 % at λ= 1600 nm compared to the SMART absolutevalues. This ranges below the uncertainty range of SMART.
4.3 Temporal stability of cross-calibration
The mini-DOAS instrument is not explicitly designed tomaintain a stable radiometric calibration but more for a sta-ble wavelength calibration. For DOAS measurements abso-lute values of I are not needed as only relative intensitiesare used. More important is the wavelength accuracy to de-termine absorption and emission bands of gasses precisely.As a result the radiometric calibration of the mini-DOAS canchange from campaign to campaign and even between sev-eral flights. Therefore, cross-calibration coefficients for dif-ferent campaigns and flights are derived to consider thesechanges in radiometric calibration and the optical setup, forexample when changing the optical fibers. Using differentcalibration factors for the mini-DOAS instrument as inferred
www.atmos-chem-phys.net/17/4283/2017/ Atmos. Chem. Phys., 17, 4283–4303, 2017

4294 K. Wolf et al.: Potential of remote sensing of cirrus optical thickness
Figure 10. Time series of the nadir radiance of SMART INS,1180
and of the mini-DOAS INmD,1180 nadir channel at λ= 1180 nm us-
ing different calibrations as indicated in the legend. The uncertaintyrange of SMART radiance is shaded gray.
for the different campaigns, Fig. 10 shows a comparison ofmeasured I at λ= 1180 nm wavelength from a 4 min longflight segment over the Amazon region on 12 September2014. The comparison clearly indicates that the measure-ments of I of both sensors are not systematically biased andagree within the errors of each sensor except when differ-ences at small spatial scales appear resulting from the differ-ent FOV.
The deviation of the different calibrations is below2.9 mW m−2 nm−1 sr−1 which is inside the measurement un-certainties of SMART and indicates a reasonable stability ofthe calibrations.
5 Retrieval of cirrus optical thickness
5.1 Iterative algorithm
By using all three calibrated radiance data sets obtained fromSMART IN
S , mini-DOAS nadir channels INmD, and sideward
viewing channels IVmD, an iterative retrieval algorithm of τ
is developed and applied. It is based on the bi-spectral re-flectance method described by Twomey and Seton (1980)and Nakajima and King (1990). Here, the retrieval is adaptedfor ice clouds with respect to ice crystal shape and usedwavelengths, e.g., by Ou et al. (1995) and Rolland et al.(2000). To retrieve τ , rough aggregates are assumed usingpre-calculated ice crystal parameterizations following Yanget al. (2013). The iterative algorithm utilizes the spectral re-flectivityRλ, which is defined as the ratio of spectral upwardIλ to spectral downward F↓λ ,
Rλ =Iλπ
F↓
λ
. (3)
For the ML-CIRRUS data, F↓λ is taken from the actualSMART measurements on HALO. Measured F↓λ allows us
to identify and eliminate any influence of the radiation fieldabove the aircraft, for example by cirrus. As an alternative topre-calculating look-up-tables (LUTs) by extensive forwardsimulations, an iterative algorithm is applied that runs RTSadjusted to each single measurement. This allows us to setup simulations by actual input parameters for each measure-ment, e.g., θ0, φ, longitude, latitude and flight altitude. In thatway, uncertainties caused by inaccurate assumptions in theRTS input are minimized. Additionally, the iterative methodis not limited to a specific pre-calculated grid of τ and reffas used in LUTs where a certain interval of preselected τ andreff is given. The iterative algorithm automatically adjusts therange of τ and reff without interpolation until it reaches thefinal result.
Figure 11 shows a scheme of the retrieval algorithm, whichstarts with an initial guess of τ0. Using the initial guess ofτ and of any other cloud parameters, the cloud reflectivityRsim is simulated and compared to the measurements Rmeasof SMART and mini-DOAS, respectively. The ratio betweenRsim,n and Rmeas derived for each iteration step n is used toscale the particular guess τn by
τn+1 = τn ·Rsim
Rmeas. (4)
The adjusted τn+1 is used in the RTS for the new iterationstep n+ 1. The iteration of τ is repeated until the change inτn between two iteration steps is smaller than 5 % or a limit ofn > 100 iteration steps is reached. These stop criteria deter-mine the accuracy of the iterative retrieval. If a lower relativestop criterion (change in τn smaller than 5 % between twoiteration steps or more then 100 iteration steps) is used, theiteration may come closer to the true searched value and theretrieval accuracy increases as well as the necessary iterationsteps and the computational time. To limit the computationaltime, the second stop criteria is used to limit the maximumnumber of iteration steps. For a typical cirrus observed dur-ing ML-CIRRUS with an average τ of 0.32, the cirrus opticalthickness can be retrieved with a accuracy of about τ ± 0.03.The retrieval of τ by SMART and mini-DOAS bases on themeasurements at λ= 1180nm and is scaled to λ= 532nmto consider the wavelength dependence of τ and to be able tocompare it with WALES measurement at λ= 532nm. There-fore, the retrieval considers RTS at both wavelengths. In theRTS τ is defined and changed at λ= 532nm while the mea-surements are compared to simulations at λ= 1180nm to de-termine the correct solution.
In case of measurements of optically thin cirrus, theretrieval can be applied for τ only. For these situationsIN
RTS,1600 at λ= 1600 nm wavelength (ice absorption band) istoo low and only measured with high uncertainty to retrievereff. For a cirrus cloud with τ = 0.03, the simulated upwardnadir radiance IN
RTS,1600 and the sideward viewing radianceIV
RTS,1600 in the range of 0.2 mW m−2 sr−1. Such low I are inthe range of the electronic noise of the spectrometers, leadingto a low signal-to-noise ratio and high retrieval uncertainties.
Atmos. Chem. Phys., 17, 4283–4303, 2017 www.atmos-chem-phys.net/17/4283/2017/

K. Wolf et al.: Potential of remote sensing of cirrus optical thickness 4295
Figure 11. Scheme of the iterative algorithm. For every single measurement i an iteration loop is started with an initial guess τ0 untilmeasuredRmeas and simulatedRsim reflectivity converge within 5 % difference or a maximum of 100 iteration steps is reached. At the endof the process the result is saved.
Especially for cirrus with low τ the variation of INRTS,1600 and
IVRTS,1600 with respect to changes in reff is low.
Simulations show that for τ = 0.5 the difference inIN
RTS,1600 in the nadir direction is only 0.1mW when chang-ing reff from 10 µm to 20 µm, indicating the low sensitiv-ity of reff retrievals at this wavelength. Therefore, a reli-able retrieval of reff with reasonable accuracy is not feasible.For IV
RTS,1600 the difference is 1.4 mW m−2 sr−1 and about amagnitude larger, indicating that a retrieval of reff might bereasonable. However, in order to be consistent between bothnadir and sideward viewing retrieval, reff has been fixed. Avalue of reff = 30 µm was chosen, a typical value of ice crys-tals observed by in situ measurements during ML-CIRRUS(Voigt et al., 2016). Therefore, the influence of an invalid as-sumption of reff on the iterative retrieval is analyzed. For thispurpose the retrieval is tested for a typical cirrus of τ = 0.3and is run with three different assumptions of reff of 20, 30and 40 µm, representing the uncertainty of reff. These simu-lations imply that the retrieved τ changes only by ±0.02 be-tween smallest and largest reff, resulting in a relative error inτ of 6.7 %. The uncertainty in measured IN
S,1600 and IVmD,1600
causes a retrieval uncertainty of less than τ ± 0.2. This justi-fies the fixed choice of reff in this specific cloud case.
However, the dependence of retrieved τ and the assump-tion of reff may vary with α, ice crystal size, τ and λ used inthe retrieval.
5.2 ML-CIRRUS case study
The iterative retrieval is applied for a selected leg of the ML-CIRRUS flight on 26 March 2014. For this day the TerraMODIS image (overpass time 10:40 UTC) indicates clouds,with a west to east gradient in τ ranging from 5.8 to 0.38(Fig. 12) including small cloud free regions. For large areas,cirrus with τ ≤ 1 is indicated by MODIS providing providesa well suited test case to compare sideward viewing and nadirobservations even when τ ranges above the SVC level. Asdiscussed in Sect. 2, for low τ ranging up to 1, ετ of sidewardviewing observations is higher than for nadir observations.
Figure 12. Investigated cloud field observed by MODIS-Terra on26 March 2014. The flight track of HALO is indicated by the blueline. The flight leg between 08:15 and 08:36 UTC for which thecirrus retrieval is performed is indicated by the red line.
An advantage of using a test case with τ higher than SVCis the insensitivity of the retrieval uncertainty with respectto the radiance measurement uncertainty. The reflected I isstill sufficiently large and exceeds the noise level of the nadirlooking instruments to make a comparison between nadir andsideward viewing instruments possible.
In Figure 12 the flight track of HALO is indicated by theblue line. The cloud retrieval is applied to the HALO flightsegment for the leg between 08:15 and 08:36 UTC (high-lighted in red) when HALO did fly above the cirrus. Duringthis period the aircraft flew constantly at 12.6 km height fromsouth to north along 14◦ W. Due to low horizontal advectionand hence slow cloud formation it can be expected that theTerra MODIS image (Fig. 12) will actually reflect the cloudcover investigated by HALO. The cirrus developed along awarm conveyor belt and contained embedded contrails as in-dicated by the lidar backscatter profiles at λ= 1064 nm andλ= 532 nm of WALES (see Fig. 13).
The time period for which τ is retrieved is marked by theblack frame. The selected flight segment is characterized bya constant cloud top height and a slightly increasing cloudbottom height towards northern flight direction. While theupper most cloud top is relatively homogeneous, there is sig-
www.atmos-chem-phys.net/17/4283/2017/ Atmos. Chem. Phys., 17, 4283–4303, 2017

4296 K. Wolf et al.: Potential of remote sensing of cirrus optical thickness
Figure 13. Vertical profiles of backscatter ratios at λ= 1064 nm (upper panel) and λ= 532 nm (lower panel) measured by WALES between07:50 and 08:50 UTC. The time period for which τ is retrieved is marked by the black rectangle.
Figure 14. Time slices of the investigated flight segment on 26March 2014 (a) and zoom (b) of τ at λ= 532 nm retrieved fromSMART (black line), WALES (gray line), mini-DOAS sidewardviewing (diamonds) and nadir spectrometers (crosses) along theflight track of ML-CIRRUS flight on 26 March 2014. Periods withthe second cloud layer are marked by the black lines at the top of (a).
nificant variability in the layer below which is visible in thebackscatter profile of WALES. The beginning of the blackmarked area shows high backscatter ratios of up to 500 indi-cating high reflectivity of a dense cirrus. At the end of the se-lected time period the backscatter decreases. The lower partof the cirrus shows small-scale variability mainly connectedto sedimentation of ice crystals.
5.2.1 Time series of cirrus optical thickness
Figure 14a shows a 20 min long flight segment of retrievedτ at λ= 532 nm calculated from SMART, mini-DOAS nadirand sideward viewing spectrometers. WALES measurementsare included for comparison. Along the analyzed cirrus, theretrieved τ ranges between 0.1 and 1.3, indicating the hor-izontal variability of the cirrus. The general decrease in τtowards higher latitudes (increasing time) matches with thecloud pattern observed by WALES. While SMART and mini-DOAS nadir channels resolve the cirrus variability observedby WALES, the sideward viewing channel retrieval does notcover these fluctuations due to the reduced time resolutionof the scanning mode and the large spatial scale (tens of kilo-meters) over which sideward viewing measurements average.At some locations, e.g., 08:21 UTC, τ retrieved by SMARTand mini-DOAS significantly exceed the measurements ofWALES. Most likely both instruments retrieve larger τ thanWALES since ice crystals were falling out of the cirrus ob-scured to the lidar measurements. A second segment withhigher retrieved τ is likely due to an underlying cirrus be-tween 8.5 and 9.5 km altitude that is also obscured to the de-tection by WALES. Therefore, a positive systematic offset ofthe retrieved τ occurs for SMART and mini-DOAS. Thesedata points are excluded from the following analysis. Nev-ertheless, there is a slight chance that a few cloud fragmentsof these second cloud layers are still affecting the SMARTand mini-DOAS retrievals. Both passive sensors have a largerFOV compared to WALES and, therefore, are more likelysensitive to cloud layers located below the cirrus.
Average τ are calculated for the filtered time period (in-dicated by the gray box in Fig. 14) for each instrument.
Atmos. Chem. Phys., 17, 4283–4303, 2017 www.atmos-chem-phys.net/17/4283/2017/

K. Wolf et al.: Potential of remote sensing of cirrus optical thickness 4297
Due to different sampling intervals, a different resolutionand number of observations are included in the averag-ing calculations. The retrieved averages of τ at 532 nm are0.54± 0.2 (SMART), 0.49± 0.2 (mini-DOAS nadir spec-trometer), 0.27± 0.2 (mini-DOAS sideward viewing spec-trometer) and 0.32± 0.02 (WALES). The results indicatea reasonable agreement of τ retrieved by SMART and themini-DOAS nadir channel, while lower τ are inferred frommini-DOAS sideward viewing and WALES measurements.Taking the WALES measurements as a reference, the mea-surements of SMART and mini-DOAS overestimate τ . How-ever, by estimating the uncertainty of the mini-DOAS andSMART based on RTS, the measurement error of IN
S,1180(14.5 %) by SMART results in an uncertainty range of re-trieved τ of ±0.2, which covers the values of τ obtained byWALES. The uncertainty range of τ is determined by run-ning the retrieval twice with a bias of measured IN
S,1180 with±14.5 % uncertainty at 1180 nm wavelength as the upperand lower borders. The resulting upper and lower retrievedτ represent the retrieval uncertainty. The mean τ inferredfrom the mini-DOAS sideward viewing observations is sig-nificantly lower than measured by SMART and mini-DOASnadir measurements. Differences in τ range up to ±0.73 be-tween SMART and mini-DOAS sideward viewing observa-tions. This may result from the different FOV of the side-ward viewing geometry that does not observe the exact sameclouds as SMART and nadir channels did. With the scan-ning sensors orientated to starboard, the sideward viewingretrieval corresponds to cirrus 8 km east of the flight track.As the MODIS satellite image in Fig. 12 indicates, the cir-rus becomes slightly thinner towards the east, which pos-sibly is due to the lower values of τ . Other potential rea-sons are the assumed ice crystal shapes for the RTS and dif-ferent fields-of-view of the passive and active remote sens-ing instruments. On the other hand, the agreement betweenmini-DOAS sideward observations and WALES is signifi-cantly better. The maximum difference in τ between mini-DOAS sideward channels and WALES is ±0.25, while thedifference between the mean values is ±0.05 (15.6 %). WithWALES and mini-DOAS measuring in different viewing ge-ometries but showing better agreement, the differences in τretrieved by SMART are most likely caused by uncertaintiesin α. As discussed in Sect. 2.3, nadir observations are morestrongly affected by α than by sideward observations. Thisis confirmed by the smaller differences between WALES andmini-DOAS sideward observations and indicates the advan-tage of the sideward viewing retrieval due to a reduced sur-face influence and lower retrieval uncertainty.
Figure 14b displays a zoom of the time series between08:20 to 08:24 UTC. During this flight segment, τ inferredby WALES is characterized by systematic oscillations vary-ing between 0.2 and 1.1 also visible in the backscatter profileof WALES in Fig. 13. The lag time between two maxima isapproximately between 20 and 25 s flight time, which corre-sponds to a horizontal distance between 4.4 and 5.5 km. This
pattern is present in the measurements of SMART, WALESand the mini-DOAS nadir channels even though partly ob-scured in the latter measurements due to its reduced time andspace resolution.
Figure 15a to d show scatter plots of retrieved τ for the dif-ferent instrument combinations. A linear regression throughthe origin is performed and displayed in all cases. Data wherea second cloud layer was present below the cirrus (graypoints) are excluded. The comparison between SMART andWALES in Fig. 15a shows that the majority of the data isbelow the 1 : 1 line (gray). The linear regression results inf (x)= 0.6621× x. The regression confirms that SMARTsystematically retrieves higher τ compared to WALES.
Compared to SMART, mini-DOAS nadir observations ofτ depart less from WALES (Fig. 15b. Similar to SMART, theslope of the linear fit f (x)= 0.6943× x indicates that mini-DOAS systematically overestimates τ compared to WALES.This similarity between SMART and mini-DOAS is obviousas SMART and mini-DOAS rely on the same radiometriccalibration and retrieval. As indicated in Fig. 14b retrievedτ from WALES and the mini-DOAS sideward viewing chan-nels agree well confirmed by the linear regression in Fig. 15cthat gives a slope of f (x)= 1.0328× x close to unity. Theoverestimation of retrieved τ by the mini-DOAS nadir chan-nels compared to the sideward channels is visible in Fig. 14dwhich results in a linear fit of f (x)= 1.642× x.
Overall the comparison provides evidence that the inferredτ agrees between the different sensors.
Having nadir and sideward viewing observations at thesame time allows us to select the appropriate measurementgeometry depending on the cloud situation, e.g., τ and α. Thesensitivity studies in Sect. 2.4 suggest that a combination ofnadir and sideward viewing measurements allows a retrievalof τ for a wide range of cirrus clouds depending on the ob-servation conditions. For thin clouds the sideward viewinggeometry would be preferred. In case the cloud becomes op-tically too thick, leading to high upward IV
S,1180 and a satura-tion of ετ , no retrievals of τ are possible. Then, switching tonadir observations of IN
S,1180 still enables us to determine theamount of reflected radiation and to retrieve τ .
5.2.2 Probability distribution of cirrus opticalthickness
For further comparison the probability density functions(PDFs) of τ retrieved by SMART, mini-DOAS nadir spec-trometers and WALES were investigated. A PDF of mini-DOAS sideward viewing spectrometers is not included be-cause of the limited number of data points, making a statis-tically meaningful PDF impossible. The PDFs are shown inFig. 16. Corresponding mean and median values of the distri-butions are given in Table 4. SMART (black solid line) andmini-DOAS (red solid line), which are based on the sameradiometric calibration and retrieval method, show a com-parable PDF, indicating that both instruments measured the
www.atmos-chem-phys.net/17/4283/2017/ Atmos. Chem. Phys., 17, 4283–4303, 2017

4298 K. Wolf et al.: Potential of remote sensing of cirrus optical thickness
Figure 15. (a) Comparison of the retrieved cirrus optical thickness τ by WALES and SMART at λ= 532 nm wavelength. (b) Comparisonof the retrieved cirrus optical thickness τ by WALES and the mini-DOAS nadir channel at λ= 532 nm wavelength. Measurements whena second cirrus layer was present are displayed in gray and are discarded in the regression. (c) Comparison of the retrieved cirrus opticalthickness τ by WALES and mini-DOAS sideward viewing channels at λ= 532 nm wavelength. No data are discarded. (d) Comparison ofthe retrieved cirrus optical thickness τ by mini-DOAS nadir and sideward viewing channels at λ= 532 nm wavelength.
same cloud area. In both cases observed τ range from 0.15to 1.25 for SMART and mini-DOAS and from 0.15 to 0.7 forWALES (black dashed line). The PDF maxima for SMARTand mini-DOAS are around τ = 0.4, and are slightly morepronounced for mini-DOAS. For SMART and mini-DOAS,the PDFs are skewed to small τ , with a median of 0.47 forSMART and 0.48 for mini-DOAS. This is slightly smallerthan the mean values of 0.5 for SMART and 0.51 for mini-DOAS. Both PDFs are long-tailed towards large τ , slowlydecreasing to higher values of τ . In contrast, τ measured byWALES (black dashed line) show a stronger shift to low τ ,as the mean value of τ is significantly lower. The most fre-quent τ is around 0.2. The WALES measurements do notshow τ larger than 0.7. This results in a stronger decreasein the WALES PDF to higher τ compared to SMART andmini-DOAS. The difference may be explained by a differentFOV and therefore measuring of different horizontal partsof the clouds. It is assumed that SMART and mini-DOAS,e.g., due to a similarly large FOV, average over larger areasand are influenced by 3-D radiative effects caused by clouds,atmosphere and surface, which are not considered in the pre-sented 1-D RTS and the iterative retrieval (Davis et al., 1997).In contrast, WALES has a more narrow FOV resulting from
Table 4. Mean and median of the PDFs of cirrus optical thicknessτ derived from WALES, SMART and mini-DOAS.
mean median
WALES 0.35 0.33SMART 0.56 0.52mini-DOAS 0.52 0.47
an opening angle of the telescope of 0.08◦. Because of thesmaller FOV of WALES, the spot of the laser at the cloud topcovers a smaller area compared to SMART and mini-DOAS,which have a spatial resolution in the range of tens of meters,depending on the distance between aircraft and cloud top.Therefore, WALES resolves finer cloud structures that mayexhibit lower τ (cloud gaps) or larger τ . In case of the mostunfortunate situation, WALES would measure a cloud freeregion but SMART and mini-DOAS would receive IN froma much larger area including clouds with various τ . This bet-ter spatial resolution of WALES to SMART and mini-DOASmay explain the shift of WALES to lower τ , but does not givereasons for the lower amount of high τ .
Atmos. Chem. Phys., 17, 4283–4303, 2017 www.atmos-chem-phys.net/17/4283/2017/

K. Wolf et al.: Potential of remote sensing of cirrus optical thickness 4299
Differences in the PDF of τ may also result from the mea-surement methodologies. While WALES uses a laser withsmall FOV for active remote sensing, SMART and mini-DOAS are passive remote instruments relaying on scatteredsunlight. Therefore, SMART and mini-DOAS are influencedby the RTS of the whole atmosphere, while WALES isonly sensitive to scattering within its narrow LOS. Addi-tionally, the different wavelengths of the measurements mayintroduce biases in the retrieved τ due to different pene-tration depth of the reflected radiation into the cloud (Plat-nick, 2000). Therefore, the wavelength selection defines thelayer in the cloud which is probed. While WALES usesbackscatter measurements at λ= 532 nm and λ= 1064 nmthe measurements of IS,1180 by SMART and mini-DOASare performed at λ= 1180 nm. Although the retrieval ac-counts for the wavelength dependence of scattering, absorp-tion and refraction on ice crystals (Takano and Liou, 1989;Yang et al., 2013) by scaling the retrieved τ at λ= 1180 nmto λ= 532 nm to make it comparable between the differentinstruments.
Referring to the sensitivity studies from Sect. 2 the influ-ence of α and the ice crystal shape effects on the upward Imeasured in nadir geometry is larger compared to the side-ward viewing measurements. While nadir observations, es-pecially of optical thin clouds, are strongly influenced byα, sideward viewing observations are less effected. This isdemonstrated in this case study where the sea surface albedomay vary due to different surface wind speeds (Cox andMunk, 1954) and indicates the advantage of sideward view-ing measurements. An other possible reason for the differ-ences in the PDF and the mean values between mini-DOASnadir and sideward retrievals of τ are the varying angulardependencies of measured I for different ice crystal shapes.For the RTS in the retrieval an assumption for the ice crys-tal shape has to be made which slightly influences the resultfor the nadir retrieval. This is more pronounced for the re-trieval using the sideward channels of the mini-DOAS whichis presented in the sensitivity study in Sect. 2.2. The WALESmeasurements are less effect by different ice crystal shapesbut more on the ice crystal size assumption which is a generaldifference between the active and remote sensing instrumentspresented here.
6 Conclusions
The potential of airborne spectral radiance measurementsin the sideward viewing direction for cirrus remote sensingis investigated. For this purpose radiative transfer simula-tions (RTS) are performed and airborne measurements of theSpectral Modular Airborne Radiation measurement sysTem(SMART) and the Differential Optical Absorption Spectrom-eter (mini-DOAS) are compared. A sensitivity study basedon RTS showed that sideward viewing measurements aregenerally more suited for detecting and investigating opti-
Figure 16. PDFs of cirrus optical thickness τ at λ= 532 nm re-trieved from SMART, mini-DOAS and WALES measurements. Thebin size is 0.05 units of τ .
cally thin cirrus than observations in the nadir direction. Us-ing sideward viewing observations, the sensitivity ετ of mea-sured radiance IV is larger than for nadir measurements up toa factor of 10, depending on the selected observation geom-etry and cloud properties. For cirrus optical thickness τ ≤ 1and all simulated sideward viewing geometries ετ is largercompared to nadir observations. This results in a higher re-trieval accuracy due to a reduced influence of measurementuncertainties. The RTS indicate that large observation anglesθV (close to the horizon) and small relative solar azimuth an-gles φ (observations in the direction of the Sun) result in thehighest ετ .
For retrievals of τ using sideward viewing measurements,the wavelength selection is crucial. Simulations indicate thatwavelengths larger than λ= 900 nm are best suited. Re-flected IV of smaller wavelengths is significantly contami-nated by scattering and absorption due to the reducing in-terference from Rayleigh scattering. Furthermore, the side-ward viewing orientation reduces the influence of the surfacealbedo α on reflected IV. As a result, a precise assumption ofα in the retrieval algorithm is less crucial. This substantiallyimproves the uncertainties of passive solar remote sensingespecially in locations of highly variable α, where an exactassumption of α is impossible.
Contrarily, for sideward observations, a reasonably goodassumption of the ice crystal shape used in the RTS is impor-tant. The RTS showed that in sideward viewing geometry theshape effects on reflected IV are more pronounced than fornadir measurements. An incorrect assumption would bias theretrieval of τ significantly. On the other hand, the sensitivityfor different ice crystal shapes may offer the possibility of re-trieving shape information when measuring at different view-ing angles. Nevertheless, smoothing of horizontal variabilityof optical thickness fields by sideward viewing observationshas to be taken into account.
www.atmos-chem-phys.net/17/4283/2017/ Atmos. Chem. Phys., 17, 4283–4303, 2017
4300 K. Wolf et al.: Potential of remote sensing of cirrus optical thickness
Using the SMART, mini-DOAS nadir and sideward mea-surements in conjunction with an iterative retrieval, τ isderived for a case study of ML-CIRRUS. The inferred τfrom SMART, mini-DOAS and the additional lidar mea-surement by the Water Vapour Lidar Experiment in Space(WALES) show a reasonable good agreement in τ for thenadir channels, with absolute differences of ±0.22 (66.6 %)between SMART and WALES and ±0.17 (52.3 %) betweenmini-DOAS and WALES observations, respectively. The re-trieval using mini-DOAS sideward channels is also success-ful demonstrated for a reduced set of observations limited toθV between 85 and 90◦. Differences in τ range up to ±0.73between SMART and mini-DOAS sideward viewing obser-vations and are partly caused by the different viewing geome-tries. First, the sideward telescopes view in the starboard di-rection, probing the cirrus cloud top at approximately 8000 maside the flight track. Second, the nadir observations may suf-fer from uncertainties in α while the sideward observationsare less effected by changes in α. Even for sea surfaces aspresented here, α may change due to different wind speeds.Other potential reasons are the assumed ice crystal shapesin the RTS and different fields-of-view of the passive andactive remote sensing instruments. This conclusion is appar-ent from different probability distributions. While SMARTand mini-DOAS show a median around τ = 0.4, the medianfor WALES is shifted to lower τ around 0.2, indicating thatWALES observed small τ more frequently. The differencein mean values of τ between mini-DOAS sideward channelsand WALES is smaller with ±0.05 (15.6 %). This shows theadvantage of the sideward viewing retrieval due to a reducedsurface influence and lower retrieval uncertainty, because ofhigh ετ compared to the nadir measurements. For future ded-icated cloud observations it is recommended to adjust θV tothe most sensitive direction between 60 and 90◦ to reducethe uncertainty in the sideward viewing retrieval. Additionalsideward viewing scans in homogeneous cloud conditionsmight be used to estimate the cirrus ice crystal shape andminimize the retrieval uncertainties. The case study showsthat cirrus retrievals using airborne sideward viewing obser-vations with mini-DOAS are possible and can increase thepotential of remote sensing on HALO significantly. There-fore, we suggest sideward viewing measurements for passiveremote sensing of optically thin cirrus clouds.
Data availability. The data products of the ML-CIRRUS, NAR-VAL and ACRIDICON campaigns are available at the HALOdatabase (https://halo-db.pa.op.dlr.de/mission/2). To get access tothe data and information, please contact the corresponding authoror the responsible co-authors.
Competing interests. The authors declare that they have no conflictof interest.
Acknowledgements. This research was funded by the GermanResearch Foundation (DFG, HALO-SPP 1294). The authorsacknowledge the support by the Deutsche Forschungsgemein-schaft (DFG) through grants PF 384/7-1/2, PF 384/16-1 and WE1900/35-1. The authors thank the pilots and appreciate the supportby the Flugbereitschaft of the German Aerospace Center (DLR).Additionally the authors thank enviscope GmbH for preparationand testing of SMART.
Edited by: D. BaumgardnerReviewed by: two anonymous referees
References
Abrams, M. C., Chang, A. Y., Gunson, M. R., Abbas, M. M., Gold-man, A., Irion, F. W., Michelson, H. A., Newchurch, M. J., Rins-land, C. P., Stiller, G. P., and Zander, R.: On the assessment anduncertainty of atmospheric trace gas burden measurements withhigh resolution infrared solar occultation spectra from space bythe ATMOS Experiment, Geophys. Res. Lett., 23, 2337–2340,doi:10.1029/96GL01794, 1996.
Baum, B. A., Heymsfield, A. J., Yang, P., and Bedka, S. T.: Bulkscattering properties for the remote sensing of ice clouds. PartI: Microphysical data and models, J. Appl. Meteorol., 44, 1885–1895, 2005.
Bierwirth, E., Wendisch, M., Ehrlich, A., Heese, B., Tesche, M.,Althausen, D., Schladitz, A., Müller, D., Otto, S., Trautmann,T., Dinter, T., von Hoyningen-Huene, W., and Kahn, R.: Spec-tral surface albedo over Morocco and its impact on the radiativeforcing of Saharan dust, Tellus, 61B, 252–269, 2009.
Bierwirth, E., Wendisch, M., Jakel, E., Ehrlich, A., Schmidt, K. S.,Stark, H., Pilewskie, P., Esselborn, M., Gobbi, G. P., Ferrare,R., Muller, T., and Clarke, A.: A new method to retrieve theaerosol layer absorption coefficient from airborne flux densityand actinic radiation measurements RID E-7433-2010, J. Geo-phys. Res., 115, D14211, doi:10.1029/2009JD013636, 2010.
Bourassa, A. E., Degenstein, D. A., and Llewellyn, E. J.: Climatol-ogy of the subvisual cirrus clouds as seen by OSIRIS on Odin,Adv. Space Res., 36, 807–812, doi:10.1016/j.asr.2005.05.045,2005.
Bozzo, A., Maestri, T., Rizzi, R., and Tosi, E.: Parameterization ofsingle scattering properties of mid-latitude cirrus clouds for fastradiative transfer models using particle mixtures, Geophys. Res.Lett., 35, L16809, doi:10.1029/2008GL034695, 2008.
Brückner, M., Pospichal, B., Macke, A., and Wendisch, M.: A newmultispectral cloud retrieval method for ship-based solar trans-missivity measurements, J. Geophys. Res.-Atmos., 119, 11338–11354, doi:10.1002/2014JD021775, 2014.
Chen, T., Rossow, W., and Zhang, Y.: Radiative effects of cloud-type variations, J. Climate, 13, 264–286, 2000.
Clark, R. N., Swayze, G. A., Wise, R., Livo, E., Hoefen, T., Kokaly,R., and Sutley, S. J.: USGS digital spectral library splib06a,Tech. rep., US Geological Survey, http://speclab.cr.usgs.gov/spectral-lib.html (last access: 16 April 2016), 2007.
Clerbaux, C., Hadji-Lazaro, J., Turquety, S., Mégie, G., and Coheur,P.-F.: Trace gas measurements from infrared satellite for chem-istry and climate applications, Atmos. Chem. Phys., 3, 1495–1508, doi:10.5194/acp-3-1495-2003, 2003.
Atmos. Chem. Phys., 17, 4283–4303, 2017 www.atmos-chem-phys.net/17/4283/2017/

K. Wolf et al.: Potential of remote sensing of cirrus optical thickness 4301
Comstock, J. M., Ackerman, T. P., and Mace, G. G.: Ground-basedlidar and radar remote sensing of tropical cirrus clouds at NauruIsland: Cloud statistics and radiative impacts, J. Geophys. Res.,107, 4714, doi:10.1029/2002JD002203, 2002.
Cox, C. and Munk, W.: Measurement of the roughness of the seasurface from photographs of the sun’s glitter, J. Opt. Soc. Am.A., 44, 838–850, 1954.
Cziczo, D. J., Froyd, K. D., Hoose, C., Jensen, E. J., Diao,M., Zondlo, M. A., Smith, J. B., Twohy, C. H., and Mur-phy, D. M.: Clarifying the Dominant Sources and Mecha-nisms of Cirrus Cloud Formation, Science, 340, 1320–1324,doi:10.1126/science.1234145, 2013.
Davis, A., Marshak, A., Cahalan, R., and Wiscombe, W.: The Land-sat scale break in stratocumulus as a three-dimensional radiativetransfer effect: Implications for cloud remote sensing, J. Atmos.Sci., 54, 241–260, 1997.
Davis, S., Hlavka, D., Jensen, E., Rosenlof, K., Yang, Q. O.,Schmidt, S., Borrmann, S., Frey, W., Lawson, P., Voemel, H.,and Bui, T. P.: In situ and lidar observations of tropopause sub-visible cirrus clouds during TC4, J. Geophys. Res., 115, D00J17,doi:10.1029/2009JD013093, 2010.
Delanoe, J., Protat, A., Jourdan, O., Pelon, J., Papazzoni, M.,Dupuy, R., Gayet, J.-F., and Jouan, C.: Comparison of Air-borne In Situ, Airborne Radar-Lidar, and Spaceborne Radar-Lidar Retrievals of Polar Ice Cloud Properties Sampled duringthe POLARCAT Campaign, J. Atmos. Ocean. Tech., 30, 57–73,doi:10.1175/JTECH-D-11-00200.1, 2013.
Ehret, G., Gross, S., Schäfler, A., Wirth, M., Fix, A., and Kiemle,C.: Characterization of Cirrus Cloud Properties by Airborne Dif-ferential Absorption and High Spectral Resolution Lidar Mea-surements, AGU Fall Meeting Abstracts, 2014.
Ehrlich, A., Bierwirth, E., Wendisch, M., Gayet, J.-F., Mioche, G.,Lampert, A., and Heintzenberg, J.: Cloud phase identification ofArctic boundary-layer clouds from airborne spectral reflectionmeasurements: test of three approaches, Atmos. Chem. Phys., 8,7493–7505, doi:10.5194/acp-8-7493-2008, 2008.
Eichler, H., Ehrlich, A., Wendisch, M., Mioche, G., Gayet, J.-F., Wirth, M., Emde, C., and Minikin, A.: Influence of icecrystal shape on retrieval of cirrus optical thickness and ef-fective radius: A case study, J. Geophys. Res., 114, D19203,doi:10.1029/2009JD012215, 2009.
Eloranta, E. W.: Practical model for the calculation of mul-tiply scattered lidar returns, Appl. Optics, 37, 2464–2472,doi:10.1364/AO.37.002464, 1998.
Esselborn, M., Wirth, M., Fix, A., Tesche, M., and Ehret, G.: Air-borne high spectral resolution lidar for measuring aerosol ex-tinction and backscatter coefficients, Appl. Optics, 47, 346–358,doi:10.1364/AO.47.000346, 2008.
Frey, W., Borrmann, S., Kunkel, D., Weigel, R., de Reus, M.,Schlager, H., Roiger, A., Voigt, C., Hoor, P., Curtius, J., Krämer,M., Schiller, C., Volk, C. M., Homan, C. D., Fierli, F., Di Don-francesco, G., Ulanovsky, A., Ravegnani, F., Sitnikov, N. M.,Viciani, S., D’Amato, F., Shur, G. N., Belyaev, G. V., Law, K.S., and Cairo, F.: In situ measurements of tropical cloud proper-ties in the West African Monsoon: upper tropospheric ice clouds,Mesoscale Convective System outflow, and subvisual cirrus, At-mos. Chem. Phys., 11, 5569–5590, doi:10.5194/acp-11-5569-2011, 2011.
Fricke, C., Ehrlich, A., Jäkel, E., Bohn, B., Wirth, M., andWendisch, M.: Influence of local surface albedo variability andice crystal shape on passive remote sensing of thin cirrus, At-mos. Chem. Phys., 14, 1943–1958, doi:10.5194/acp-14-1943-2014, 2014.
Froyd, K. D., Murphy, D. M., Lawson, P., Baumgardner, D., andHerman, R. L.: Aerosols that form subvisible cirrus at the tropicaltropopause, Atmos. Chem. Phys., 10, 209–218, doi:10.5194/acp-10-209-2010, 2010.
Fu, Q. and Liou, K.: Parameterization of the radiative properties ofcirrus clouds, J. Atmos. Sci., 50, 2008–2025, 1993.
Fu, Q., Hu, Y., and Yang, Q.: Identifying the top of the trop-ical tropopause layer from vertical mass flux analysis andCALIPSO lidar cloud observations, Geophys. Res. Lett., 34,l14813, doi:10.1029/2007GL030099, 2007.
Gross, S., Forster, L., Wirth, M., Schäfler, A., Freudenthaler, V.,Fix, A., and Mayer, B.: Characterization of mid-latitude cirruscloud with airborne and ground-based lidar measurements dur-ing ML-CIRRUS, in: EGU General Assembly Conference Ab-stracts, vol. 17 of EGU General Assembly Conference Abstracts,p. 10283, 2015.
Gueymard, C. A.: The sun’s total and spectral irradiance for solarenergy applications and solar radiation models, Sol. Energy, 76,423–453, 2004.
Hüneke, T.: The scaling method applied to HALO measurements:Inferring absolute trace gas concentrations from airborne limbspectroscopy under all sky conditions, PhD thesis, Ruperto-Carola University of Heidelberg, Germany, 2016.
IPCC: Climate Change 2013: The Physical Science Basis, Cam-bridge University Press, Cambridge, United Kingdom and NewYork, NY, USA, 2013.
Jensen, E. J., Pfister, L., Jordan, D. E., Bui, T. V., Ueyama, R.,Singh, H. B., Thornberry, T., Rollins, A. W., Gao, R.-S., Fa-hey, D. W., Rosenlof, K. H., Elkins, J. W., Diskin, G. S., Di-Gangi, J. P., Lawson, R. P., Woods, S., Atlas, E. L., Rodriguez,M. A. N., Wofsy, S. C., Pittman, J., Bardeen, C. G., Toon, O. B.,Kindel, B. C., Newman, P. A., McGill, M. J., Hlavka, D. L.,Lait, L. R., Schoeberl, M. R., Bergman, J. W., Selkirk, H. B.,Alexander, M. J., Kim, J.-E., Lim, B. H., Stutz, J., and Pfeil-sticker, K.: The NASA Airborne Tropical TRopopause EXper-iment (ATTREX): High-Altitude Aircraft Measurements in theTropical Western Pacific, B. Am. Meteorol. Soc., 98, 129–143,doi:10.1175/BAMS-D-14-00263.1, 2015.
Kärcher, B.: Properties of subvisible cirrus clouds formed byhomogeneous freezing, Atmos. Chem. Phys., 2, 161–170,doi:10.5194/acp-2-161-2002, 2002.
King, M. D., Platnick, S., Yang, P., Arnold, G. T., Gray, M. A.,Riedi, J. C., Ackerman, S. A., and Liou, K. N.: Remote sensing ofliquid water and ice cloud optical thickness and effective radiusin the Arctic: Application of airborne multispectral MAS data, J.Atmos. Ocean. Tech., 21, 857–875, 2004.
Klepp, C., Ament, S., Bakan, S., Hirsch, L., and Stevens, B.: NAR-VAL Campaign Report, vol. 164, Reports on Earth System Sci-ence, Max Planck Institute for Meteorology Hamburg, Germany,2014.
Lampert, A., Ehrlich, A., Dörnbrack, A., Jourdan, O., Gayet, J.-F., Mioche, G., Shcherbakov, V., Ritter, C., and Wendisch, M.:Microphysical and radiative characterization of a subvisible mi-dlevel Arctic ice cloud by airborne observations – a case study,
www.atmos-chem-phys.net/17/4283/2017/ Atmos. Chem. Phys., 17, 4283–4303, 2017

4302 K. Wolf et al.: Potential of remote sensing of cirrus optical thickness
Atmos. Chem. Phys., 9, 2647–2661, doi:10.5194/acp-9-2647-2009, 2009.
Lee, J., Yang, P., Dessler, A. E., Gao, B.-C., and Platnick, S.: Dis-tribution and radiative forcing of tropical thin cirrus clouds, J.Atmos. Sci., 66, 3721–3731, doi:10.1175/2009JAS3183.1, 2009.
Mayer, B. and Kylling, A.: Technical note: The libRadtran soft-ware package for radiative transfer calculations – descriptionand examples of use, Atmos. Chem. Phys., 5, 1855–1877,doi:10.5194/acp-5-1855-2005, 2005.
McFarquhar, G. M., Heymsfield, A. J., Spinhirne, J., and Hart,B.: Thin and subvisual tropopause tropical cirrus: Observa-tions and radiative impacts, J. Atmos. Sci., 57, 1841–1853,doi:10.1175/1520-0469(2000)057<1841:TASTTC>2.0.CO;2,2000.
Nakajima, T. and King, M.: Determination of the optical thicknessand effective particle radius of clouds from reflected solar radi-ation measurements. Part I: Theory, J. Atmos. Sci., 47, 1878–1893, 1990.
Oikarinen, L.: Effect of surface albedo variations on UV-visiblelimb-scattering measurements of the atmosphere, J. Geophys.Res., 107, ACH 13-1–ACH 13-15, doi:10.1029/2001JD001492,2002.
Ou, S., Liou, K., Gooch, W., and Takano, Y.: Remote sensing ofcirrus cloud parameters using advanced very-high-resolution ra-diometer 3.7- and 10.9-µm channels, Appl. Optics, 32, 2171–2180, 1993.
Ou, S., Liou, K.-N., Takano, Y., Rao, X., Fu, Q., Heymsfield, A.,Miloshevich, L., Baum, B., and Kinne, S.: Remote soundingof cirrus cloud optical depths and ice crystal structures fromAVHRR data: Verification using FIRE II IFO measurements, J.Atmos. Sci., 52, 4143–4158, 1995.
Pierluissi, J. and Peng, G.-S.: New molecular transmission bandmodels for LOWTRAN, Opt. Eng., 24, 541–547, 1985.
Platnick, S.: Vertical photon transport in cloud remote sensing prob-lems, J. Geophys. Res., 105, 22919–22935, 2000.
Platt, C.: Remote sounding of high clouds. III: Monte Carlo cal-culations of multiple-scattered lidar returns, J. Atmos. Sci., 38,156–167, 1981.
Platt, U. and Stutz, J.: Differential Optical Absorption Spec-troscopy: Principles and Applications, Series: Physics of Earthand Space Environments, Springer Verlag, ISBN 3540211934,2008.
Pruppacher, H. and Klett, J.: Microphysics of Clouds and Precipita-tion, Kluwer Academic, Dordrecht, Boston, 1997.
Rolland, P. and Liou, K.: Surface variability effects on the remotesensing of thin cirrus optical and microphysical properties, J.Geophys. Res., 106, 22965–22977, doi:10.1029/2001JD900160,2001.
Rolland, P., Liou, K., King, M., Tsay, S., and McFarquhar,G.: Remote sensing of optical and microphysical proper-ties of cirrus clouds using Moderate-Resolution ImagingSpectroradiometer channels: Methodology and sensitivity tophysical assumptions, J. Geophys. Res., 105, 11721–11738,doi:10.1029/2000JD900028, 2000.
Sassen, K., Wang, Z., and Liu, D.: Cirrus clouds and deepconvection in the tropics: Insights from CALIPSO andCloudSat, J. Geophys. Res.-Atmos., 114, 2156–2202,doi:10.1029/2009JD011916, 2009.
Sausen, R., Isaksen, I., Grewe, V., Hauglustaine, D., Lee, D., Myhre,G., Köhler, M., Pitari, G., Schumann, U., Stordal, F., and Zere-fos, C.: Aviation radiative forcing in 2000: An update on IPCC(1999), Meteor. Z., 14, 555–561, 2005.
Schäfer, M., Bierwirth, E., Ehrlich, A., Heyner, F., and Wendisch,M.: Retrieval of cirrus optical thickness and assessment ofice crystal shape from ground-based imaging spectrometry, At-mos. Meas. Tech., 6, 1855–1868, doi:10.5194/amt-6-1855-2013,2013.
Sen, P. K.: Estimates of the Regression Coefficient Basedon Kendall’s Tau, J. Am. Stat. Assoc., 63, 1379–1389,doi:10.1080/01621459.1968.10480934, 1968.
Shettle, E.: Models of aerosols, clouds and precipitation for atmo-spheric propagation studies, in: Atmospheric propagation in theuv, visible, ir and mm-region and related system aspects, no. 454in AGARD Conference Proceedings, 1989.
Stamnes, K., Tsay, S.-C., Wiscombe, W., and Laszlo, I.: DISORT, aGeneral-Purpose Fortran Program for Discrete-Ordinate-MethodRadiative Transfer in Scattering and Emitting Layered Media:Documentation of Methodology, Tech. rep., Dept. of Physics andEngineering Physics, Stevens Institute of Technology, Hoboken,NJ 07030, 2000.
Takano, Y. and Liou, K.-N.: Solar radiative transfer in cirrus clouds.Part I: Single-scattering and optical properties of hexagonal icecrystals, J. Atmos. Sci., 46, 1–19, 1989.
Theil, H.: A Rank–Invariant Method of Linear and Polynomial Re-gression Analysis, in: Henri Theils Contributions to Economicsand Econometrics, edited by: Raj, B. and Koerts, J., vol. 23 ofAdv. S. Theo. App. Eco., Springer, the Netherlands, 345–381,doi:10.1007/978-94-011-2546-8_20, 1992.
Toon, O. B., Starr, D. O., Jensen, E. J., Newman, P. A., Platnick,S., Schoeberl, M. R., Wennberg, P. O., Wofsy, S. C., Kurylo,M. J., Maring, H., Jucks, K. W., Craig, M. S., Vasques, M. F.,Pfister, L., Rosenlof, K. H., Selkirk, H. B., Colarco, P. R., Kawa,S. R., Mace, G. G., Minnis, P., and Pickering, K. E.: Planning,implementation, and first results of the Tropical Composition,Cloud and Climate Coupling Experiment (TC4), J. Geophys.Res.-Atmos., 115, D00J04, doi:10.1029/2009JD013073, 2010.
Twomey, S. and Seton, K. J.: Inferences of gross microphysicalproperties of clouds from spectral reflectance measurements, J.Atmos. Sci., 37, 1065–1069, 1980.
Voigt, C., Schumann, U., Jurkat, T., Schäuble, D., Schlager, H.,Petzold, A., Gayet, J.-F., Krämer, M., Schneider, J., Borrmann,S., Schmale, J., Jessberger, P., Hamburger, T., Lichtenstern, M.,Scheibe, M., Gourbeyre, C., Meyer, J., Kübbeler, M., Frey, W.,Kalesse, H., Butler, T., Lawrence, M. G., Holzäpfel, F., Arnold,F., Wendisch, M., Döpelheuer, A., Gottschaldt, K., Baumann, R.,Zöger, M., Sölch, I., Rautenhaus, M., and Dörnbrack, A.: In-situobservations of young contrails – overview and selected resultsfrom the CONCERT campaign, Atmos. Chem. Phys., 10, 9039–9056, doi:10.5194/acp-10-9039-2010, 2010.
Voigt, C., Schumann, U., Minikin, A., Abdelmonem, A., Afchine,A., Borrmann, S., Boettcher, M., Buchholz, B., Bugliaro, L.,Costa, A., Curtius, J., Dollner, M., Dörnbrack, A., Dreiling, V.,Ebert, V., Ehrlich, A., Fix, A., Forster, L., Frank, F., Fütterer, D.,Giez, A., Graf, K., Grooß, J.-U., Groß, S., Heimerl, K., Heinold,B., Hüneke, T., Järvinen, E., Jurkat, T., Kaufmann, S., Kenntner,M., Klingebiel, M., Klimach, T., Kohl, R., Krämer, M., Krisna,T. C., Luebke, A., Mayer, M., Mertes, S., Molleker, S., Pet-
Atmos. Chem. Phys., 17, 4283–4303, 2017 www.atmos-chem-phys.net/17/4283/2017/

K. Wolf et al.: Potential of remote sensing of cirrus optical thickness 4303
zold, A., Pfeilsticker, K., Port, M., Rapp, M., Reutter, P., Rolf,C., Rose, D., Sauer, D., Schäfler, A., Schlage, R., Schnaiter, M.,Schneider, J., Spelten, N., Spichtinger, P., Stock, P., Walser, A.,Weigel, R., Weinzierl, B., Wendisch, M., Werner, F., Wernli, H.,Wirth, M., Zahn, A., Ziereis, H., and Zöger, M.: ML-CIRRUS– The airborne experiment on natural cirrus and contrail cir-rus with the high-altitude long-range research aircraft HALO,B. Am. Meteorol. Soc., 98, 271–288, doi:10.1175/BAMS-D-15-00213.1, 2016.
Wang, P.-H., Minnis, P., McCormick, M. P., Kent, G. S., andSkeens, K. M.: A 6-year climatology of cloud occurrence fre-quency from Stratospheric Aerosol and Gas Experiment II ob-servations (1985–1990), J. Geophys. Res.-Atmos., 101, 29407–29429, doi:10.1029/96JD01780, 1996.
Wendisch, M., Müller, D., Schell, D., and Heintzenberg, J.: An air-borne spectral albedometer with active horizontal stabilization, J.Atmos. Ocean. Tech., 18, 1856–1866, 2001.
Wendisch, M., Pilewskie, P., Pommier, J., Howard, S., Yang, P.,Heymsfield, A. J., Schmitt, C. G., Baumgardner, D., and Mayer,B.: Impact of cirrus crystal shape on solar spectral irradiance: Acase study for subtropical cirrus, J. Geophys. Res., 110, D03202,doi:10.1029/2004JD005294, 2005.
Wendisch, M., Yang, P., and Pilewskie, P.: Effects of ice crystalhabit on thermal infrared radiative properties and forcing of cir-rus, J. Geophys. Res., 112, D03202, doi:10.1029/2006JD007899,2007.
Wendisch, M., Pöschl, U., Andreae, M. O., Machado, L. A. T.,Albrecht, R., Schlager, H., Rosenfeld, D., Martin, S. T., Abdel-monem, A., Afchine, A., Araujo, A., Artaxo, R., Aufmhoff, H.,Barbosa, H. M. J., Borrmann, S., Braga, R., Buchholz, B., Cec-chini, M. A., Costa, A., Curtius, J., Dollner, M., Dorf, M., Dreil-ing, V., Ebert, V., Ehrlich, A., Ewald, F., Fisch, G., Fix, A., Frank,F., Fütterer, D., Heckl, C., Heidelberg, F., Hüneke, T., Jäkel, E.,Järvinen, E., Jurkat, T., Kanter, S., Kästner, U., Kenntner, M.,Kesselmeier, J., Klimach, T., Knecht, M., Kohl, R., Kölling, T.,Krämer, M., Krüger, M., Krisna, T. C., Lavric, J. V., Longo, K.,Mahnke, C., Manzi, A. O., Mayer, B., Mertes, S., Minikin, A.,Molleker, S., Münch, S., Nillius, B., Pfeilsticker, K., Pöhlker, C.,Roiger, A. E., Rose, D., Rosenow, D., Sauer, D., Schnaiter, M.,Schneider, J., Schulz, C., de Souza, R. A. F., Spanu, A., Stock, P.,Vila, D., Voigt, C., Walser, A., Walter, D., Weigel, R., Weinzierl,B., Werner, R., Yamasoe, M. A., Ziereis, H., Zinner, T., andZöger, M.: The ACRIDICON-CHUVA campaign: Studying trop-ical deep convective clouds and precipitation over Amazonia us-ing the new German research aircraft HALO, B. Am. Meteorol.Soc., 97, 1885–1908, doi:10.1175/BAMS-D-14-00255.1, 2016.
Wiensz, J. T., Degenstein, D. A., Lloyd, N. D., and Bourassa, A.E.: Retrieval of subvisual cirrus cloud optical thickness fromlimb-scatter measurements, Atmos. Meas. Tech., 6, 105–119,doi:10.5194/amt-6-105-2013, 2013.
Winker, D. M. and Trepte, C. R.: Laminar cirrus observed nearthe tropical tropopause by LITE, Geophys. Res. Lett., 25, 3351–3354, 1998.
Wirth, M., Fix, A., Mahnke, P., Schwarzer, H., Schrandt, F., andEhret, G.: The airborne multi-wavelength water vapor differen-tial absorption lidar WALES: System design and performance,Appl. Phys. B-Lasers O., 96, 201–213, 2009.
Woodbury, G. E. and McCormick, M. P.: Zonal and geo-graphical distributions of cirrus clouds determined fromSAGE data, J. Geophys. Res.-Atmos., 91, 2775–2785,doi:10.1029/JD091iD02p02775, 1986.
Yang, H. Y., Dobbie, S., Herbert, R., Connolly, P., Gallagher, M.,Ghosh, S., Al-Jumur, S. M. R. K., and Clayton, J.: The effect ofoberserved vertical structure, habits, and size distribution on thesolar radiative properties and cloud evolution of cirrus clouds, Q.J. R. Meteor. Soc., 138, 1221–1232, 2012.
Yang, P., Bi, L., Baum, B. A., Liou, K. N., Kattawar, G. W.,Mishchenko, M. I., and Cole, B.: Spectrall consistent scatterin,absorption, and polarization properties of atmospheric ice crys-tals at wavelengths from 0.2 to 100 µm, J. Atmos. Sci., 70, 330–347, 2013.
Zhang, Y., Macke, A., and Albers, F.: Effect of crystal size spectrumand crystal shape on stratiform cirrus radiative forcing, Atmos.Res., 52, 59–75, 1999.
www.atmos-chem-phys.net/17/4283/2017/ Atmos. Chem. Phys., 17, 4283–4303, 2017