Potential of Economic Incentives to Reduce CO Emissions ...
20
Potential of Economic Incentives to Reduce CO 2 Emissions f G d T t from Goods Transport Professor Alan McKinnon Heriot-Watt University EDINBURGH, UK International Transport Forum Leipzig Leipzig 28 th May 2008
Transcript of Potential of Economic Incentives to Reduce CO Emissions ...
Potential of Economic Incentives to Reduce CO2 Emissionsf G d T tfrom Goods Transport
Professor Alan McKinnonHeriot-Watt University
EDINBURGH, UK
International Transport Forum LeipzigLeipzig
28th May 2008

Forecast Growth of Freight Transport Activity by Region 2000-2050
Source: World Business Council for Sustainable Development - Mobility 2030 report
CO emissions per tonne km also increasingCO2 emissions per tonne-km also increasing

Stabilisation Wedges
applied to freight transport operations
increased fuel efficiency
improved load consolidation
switch to lower carbon modes
ssio
ns
more localised sourcing
arbo
n em
isC
a
TimeTime
Adapted from Pacala and Socolow, 2004

Weight of goods
Decarbonisation Framework for Freight Transport (‘9-lever model’)
produced / consumed
Weight of goods transported by road
modal split
average handling factornumber of links
Similar analyses for other modes
supply chain structure
Road tonnes-lifted
Road tonne-kms
average length of haullength of links
vehicle carrying capacityby weight / volume
efficiency of vehicle routing
average load on laden trips
average % empty running
by weight / volume
vehicle utilisationon laden trips
level of backhaulageTotal vehicle-kms
distribution of vehicle-kms by vehicle size, weight and type
fuel efficiencyTraffic conditions timing of deliveries
level of backhaulage
other factors
carbon intensity of fuel
Fuel consumption
CO
deliveries
carbon intensity of fuelCO2
aggregate key parameter determinant

Freight Transport CO2 : Aspirational Scenarios for UK
B li 2004
Volume of freight movement (tonne-kms) + 7%
Baseline 2004
g ( )
Modal shares of tonne-kmsd 59 5 55 7%
Fuel efficiency:road: 59.5 → 55.7%rail: 8.6 → 10.4%water: 23.7 → 24.4%
Lorries +10%Vans + 5%Rail +10%
27% reduction in
CO2
Vehicle utilisationLorries + 10%Vans + 25%
Carbon intensity of fuelLorries -10%
Rail + 10%Water + 10%
Lorries -10%Vans -20%
Source: McKinnon / Commission for Integrated Transport 2007

Public Policy Levers on Key Freight Transport Variables
Government measureskey freight parameters
infrastructural investment in alternative modes
-land- use planning controlsSpatial structure of the supply chain
F i ht d l lit
modal transfer grants
-revenue-support for alternative modes
Freight modal split
Vehicle routing
road pricing
lorry routeing schemes
support for improved vehicle designVehicle utilisation
relaxation of vehicle size / weight regulations
promotion of road telematics
Exposure to congestion
F l ffi i
duty reductions for alternative fuels
regulations relating to vehicle emissions
relaxation of night delivery restrictionsFuel efficiency
CO2 intensity of energy sourceduty reductions for alternative fuels
Taxation policy and advice / exhortation affects all variables

Sensitivity of Truck Fuel Efficiency to Fuel Price Increases
average vehicle km/litre
Average fuel efficiency of trucks in the UK
1 05
1.1
1.15
0)
fuel duty escalatorrise in oil
prices an industry antogonised….
0.95
1
1.05
Inde
x (1
990=
100
0.85
0.9
1990
1991
1992
1993
1994
1995
1996
1997
1998
1999
2000
2001
2002
2003
2004
2005
Source: UK Dept for Transport
Fuel Duty Escalator: 35% in diesel prices over 6 years
Market price rise since Sept 2007: 30% in diesel prices over 8 months

UK Government ‘Freight Best Practice’ ProgrammeUK Government Freight Best Practice Programme
www.freightbestpractice.org.uk
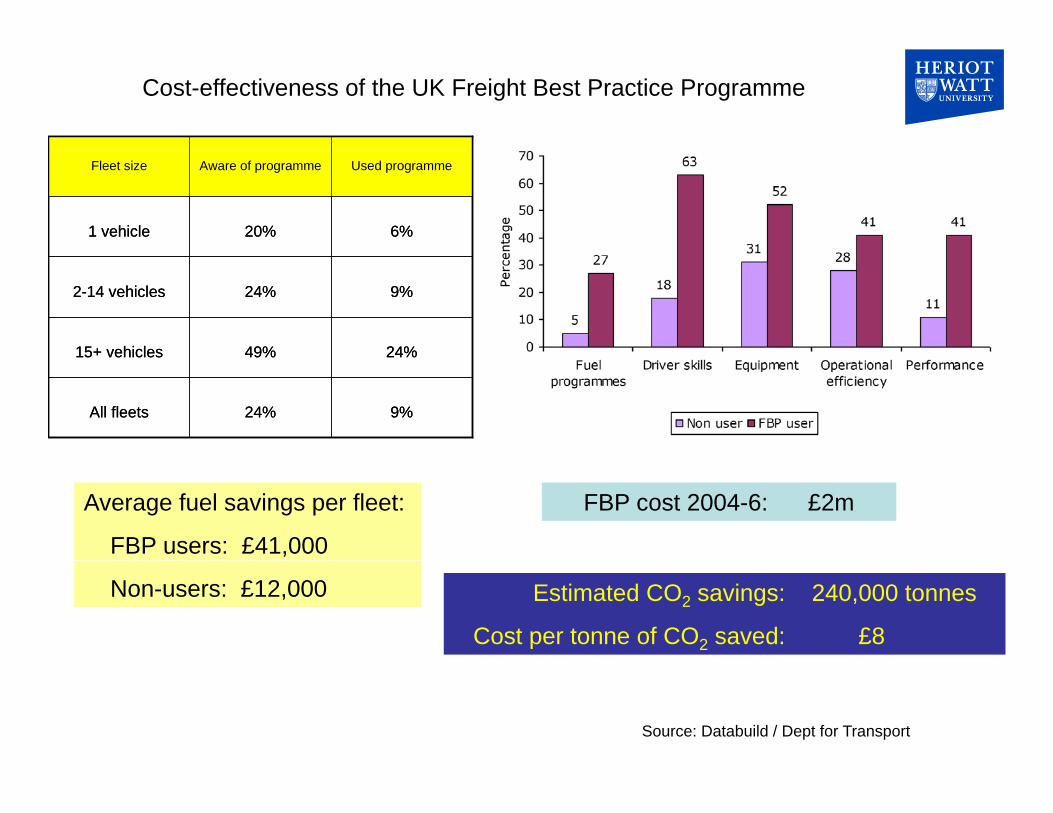
Cost-effectiveness of the UK Freight Best Practice Programme
6%20%1 vehicle
Used programmeAware of programmeFleet size
6%20%1 vehicle
Used programmeAware of programmeFleet size
24%49%15+ vehicles
9%24%2-14 vehicles
24%49%15+ vehicles
9%24%2-14 vehicles
9%24%All fleets
24%49%15 vehicles
9%24%All fleets
24%49%15 vehicles
Average fuel savings per fleet:
FBP users: £41,000
FBP cost 2004-6: £2m
Non-users: £12,000 Estimated CO2 savings: 240,000 tonnes
Cost per tonne of CO2 saved: £8
Source: Databuild / Dept for Transport

Economic Justification for Freight-related Carbon Abatement Measures
£ per tonne of CO2 saved0 10 20 30 40 50 60 70 80
European Emission Trading Scheme phase 2 £22
0 10 20 30 40 50 60 70 80
Measure 1
Measure 2Supplemented by other
environmental and economic benefitsMeasure 2
Measure 3
Measure 4
Measure 5
Measure 6
Measure 7
Stern social cost of carbon
£72 (2006)
UK government shadow price of carbon £26.50
Typical carbon offset
cost £15

freight-related

Reducing freight movement does not necessarily cut CO2 emissions
Life Cycle Analysis of Food Sourcing Options
Much food production is more energy efficient in New ZealandMuch food production is more energy efficient in New Zealand
New Zealand produce has lower carbon footprint than UK produce
kg of CO2 per tonne
0 1000 2000 3000 4000
Dairy produceI l d t t b
y p
Lamb
Includes transport by deep-sea container
18,000 kms
125 kg of CO per tonne
Apples
125 kg of CO2 per tonne
Onions New ZealandUK
Source: Saunders, Barber and Taylor, 2006

N d t l / CO t d ff b t t t i t d tNeed to analyse energy / CO2 trade-offs between transport, inventory and storage
ITT Flygt – manufacturer of submersible pumps and mixers
2 9 million2 2 millionTotal tonne-kms
2153 km1512 kmAverage length of haul
CentralisedDecentralised
2 9 million2 2 millionTotal tonne-kms
2153 km1512 kmAverage length of haul
CentralisedDecentralised
131.1 tonnes92.2 tonnesCO2 emissions
2.9 million2.2 millionTotal tonne-kms
131.1 tonnes92.2 tonnesCO2 emissions
2.9 million2.2 millionTotal tonne-kms
Source: Kohn 2005

Potential CO2 benefits from inventory centralisation:Lower inventory levels:Lower inventory levels:
less energy use in storage (heating, refrigeration, lighting etc.)
less wastage of productless wastage of product
Less warehouse space required:
less CO2 in construction, operation and maintenance2 p
Larger warehouses can be more energy efficient:
emit less CO2 per unit of throughput

Off-shoring of Manufacturing and the Upstream Supply Chain
Global redistribution of freight-related CO2 emissions
Off shoring of Manufacturing and the Upstream Supply Chain
retail distribution centremain assembly plant
component supplier
warehouseprocessing plant
Export of carbon-generating activities reducing UK’s ‘carbon footprint’
Embedded carbon in imported products
UK’s contribution to external GHG emissions
36% of total
Source: Helm, Smale and Phillips, 2007

Variations in CO2 Intensity by Freight Transport Mode
Assessing the carbon benefits of freight modal shift
Variations in CO2 Intensity by Freight Transport Mode
1600
1800
Assumptions about average load factors ?
1200
1400
e-km
Line-haul or door-to-door ?
Primary energy source of electricity ?
800
1000
gm p
er to
nne
Inclusion of infrastructure development / maintenance ?
Passenger / freight split (bellyhold air and ferries) ?
400
600
CO
2
Lack accurate modal cross-elasticity values
0
200
reigh
t
Vans
HGVs
rway
s
pping Rail
pelin
e
Airfre V HG
Inlan
d wate
rwCoa
stal s
hipp
Pipe
Source: McKinnon / Commission for Integrated Transport

Optimising environmental trade-offs in a low carbon economy
Longer and heavier vehicles Reduction in carbon intensity of road freight (CO2 gm / tkm)
Diversion of freight from
rail and water
Generation of additional freight
movement
Net change in CO2
CO2 versus other emissionsCO2 versus other emissions
Truck engineengine energy efficiency rating
Source: MAN AGMAN AG Sept 2007
Euro 6 standard for heavy duty vehicles will carry 2-3% CO2 penalty

Freight transport’s minor contribution to corporate carbon footprintsgm of CO2 per newspaper
182 gm
cocoapackaging Cadbury cocoa1% milk
1%
sugar10%
inhouse distribution4%
packaging2%
ySchweppes
CO2 emissions
Source: Carbon Trust
vegetable fat20% inhouse production
62%62%
http://www.cadburyschweppes.com/EN/EnvironmentSociety/Environment/Carbon_Footprint_CDM.htm
‘Every little counts…’

Conclusions
• Broad range of decarbonisation measures and incentives available
• Close correlation between CO2 and cost reductions
• On a life cycle basis, minimising freight movement need not minimise CO2
• Lack data on:
– relative cost effectiveness of carbon abatement measures in freight transport
– modal demand elasticities and cross-elasticities in the freight sectorg
• Economic incentives should be targeted on modal choice, vehicle utilisation and
fuel efficiency: limited financial leverage on logistics / supply chain structures andfuel efficiency: limited financial leverage on logistics / supply chain structures and
wider business trends
• Need to co-ordinate freight transport measures with wider decarbonisationNeed to co ordinate freight transport measures with wider decarbonisation
initiatives

Contact details
Logistics Research CentregHeriot-Watt University
EDINBURGH UK
A C M Ki @h [email protected]
http://www sml hw ac uk/logisticshttp://www.sml.hw.ac.uk/logistics
www.greenlogistics.org