Potential for Ethanol Production in Hawaii
44
A Scenario for Accelerated Use of Renewable Resources for Transportation Fuels in Hawaii Prepared for State of Hawaii Department of Business, Economic Development & Tourism by University of Hawaii Terrence Surles Michael Foley Scott Turn Milton Staackmann Hawaii Natural Energy Institute School of Ocean and Earth Science and Technology June 2007
Transcript of Potential for Ethanol Production in Hawaii

A Scenario for Accelerated
Use of Renewable Resources for Transportation Fuels
in Hawaii
Prepared for
State of Hawaii Department of
Business, Economic Development & Tourism
by
University of Hawaii
Terrence Surles Michael Foley
Scott Turn Milton Staackmann
Hawaii Natural Energy Institute
School of Ocean and Earth Science and Technology
June 2007

Table of Contents Section Number and Title Page Number List of Tables and Figures iii 1.0 Introduction 1 2.0 Potential for Ethanol Use in Hawaii 2
2.1 Background 2 2.2 Methodology 3 2.3 Feedstocks 4
2.3.1 Available Feedstocks 4 2.3.2 Potential Feedstocks 5
2.4 Land Analysis and Energy Crop Suitability 8 2.5 Potential Ethanol Production in Hawaii 9
2.5.1 Sugar 10 2.5.2 Woodland 17 2.5.3 Ethanol from Sugar Cane and Wood 19 2.5.4 Banagrass 22
2.6 Production Costs 22
3.0 The Potential for Biodiesel Production in Hawaii 27 3.1 Introduction 27 3.2 Technical Feasibility of Domestic Biodiesel Production 28
3.2.1 Waste Oil Feedstock 28 3.2.2 Oil Crop Feedstock 28 3.2.3 Oil Feedstock from Algae 30 3.2.4 Biodiesel Production Process 31 3.2.5 Buidiesel Production Facilities 32
3.3 Economic Feasibility 32 3.4 Summary Remarks on Biodiesel Development in Hawaii 33
4.0 References 34
ii

List of Tables and Figures Table or Figure Number and Title Page Number Table 1. 2002 summary of biomass resources and their degree of utilization in the State of Hawaii by county. 5 Table 2. Acreages of NRCS sugar soils by land designation and slope. 11 Table 3. Comparison of potential sugar cane acreage with historic use. 12 Table 4. Potential irrigate (<78”) and unirrigated (>78”) acreages of agriculturally-zoned NRCS sugar soils by land designation. 13 Table 5. Historic irrigation data and average yields for selected plantations in Hawaii from 1975 to 1992. 14 Table 6. Ethanol potential from fermentable sugar cane grown on irrigated and unirrigated acreages of agriculturally-zoned NRCS sugar soils by land designation. 15 Table 7. Ethanol potential from sugar cane fiber grown on irrigated and unirrigated acreages of agriculturally-zoned NRCS sugar soils by land designation. 15 Table 8. Ethanol potential from sugar cane grown on agriculturally zoned NRCS
sugar soils by land designation compared with actual usage. 16 Table 9. Acreages of NRCS woodland soils by land designation, slope, and rainfall. 18 Table 10. Potential leucaena (20” to 40”) and eucalyptus (>40”) acreages of agriculturally-zoned NRCS woodland soils by land designation. 20 Table 11. Potential ethanol production from lignocellulose from short rotation woody crops grown on agriculturally-zoned NRCS woodland soils
by land designation. 20 Table 12. Potential ethanol production from short rotation woody crops grown on
agriculturally-zoned NRCS woodland soils by land designation. 21 Table 13. Potential ethanol production from agriculturally-zoned NRCS sugar and
woodland soils by land designation. 21
iii

Table 14. Potential ethanol production from banagrass on agriculturally-zoned NRCS woodland soils by land designation. 23
Table 15. Estimated cost of production of molasses from a 6 million gal
per year plant. 24 Table 16. Summary table of statewide ethanol potential for four land groupings and four crop scenarios. 27 Table 17. Biodiesel production potential from oil-bearing crops in Hawaii by island. 29 Table 18. Potential biodiesel production compared to demand. 30 Table 19. Oil production potential of algae compared to other common crops. 31 Figure 1. Eighteen month price history of California gasoline blend stocks in
Los Angeles. 25 Figure 2. Hawaii’s biodiesel production potential compared to historic demand for highway and non-highway diesel. 30
iv

v
A Scenario for Accelerated Use of Renewable Resources for Transportation Fuels in Hawaii
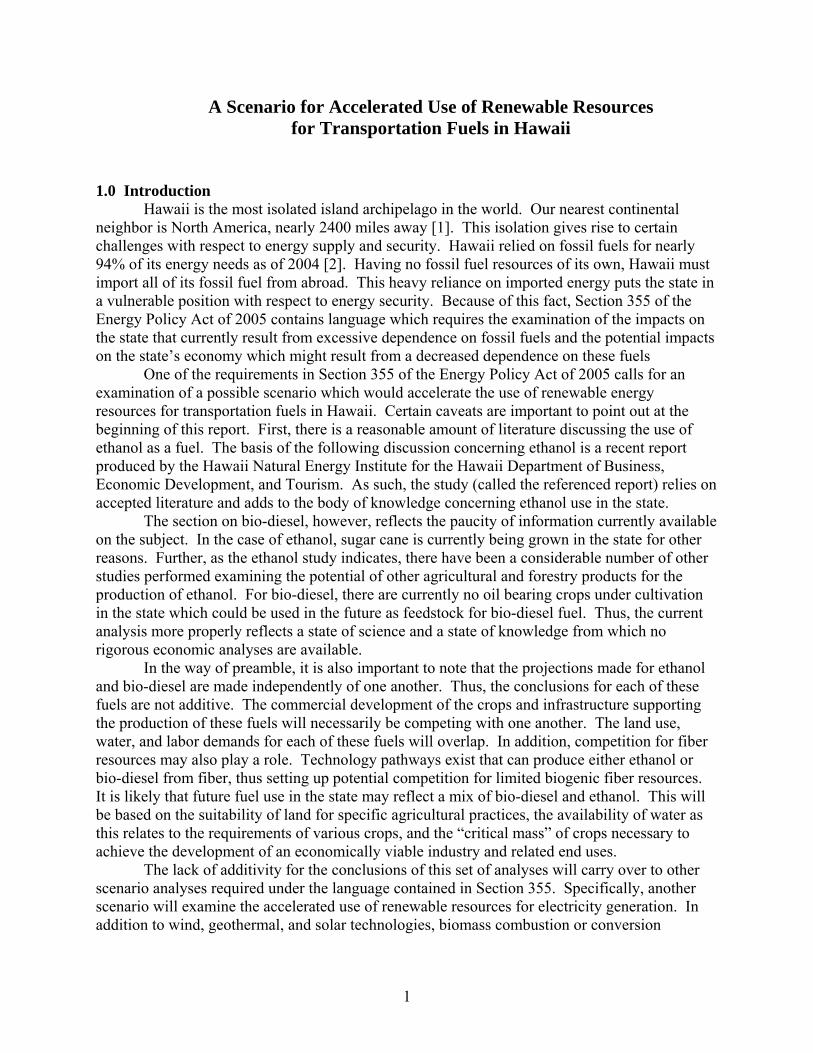
1.0 Introduction
Hawaii is the most isolated island archipelago in the world. Our nearest continental neighbor is North America, nearly 2400 miles away [1]. This isolation gives rise to certain challenges with respect to energy supply and security. Hawaii relied on fossil fuels for nearly 94% of its energy needs as of 2004 [2]. Having no fossil fuel resources of its own, Hawaii must import all of its fossil fuel from abroad. This heavy reliance on imported energy puts the state in a vulnerable position with respect to energy security. Because of this fact, Section 355 of the Energy Policy Act of 2005 contains language which requires the examination of the impacts on the state that currently result from excessive dependence on fossil fuels and the potential impacts on the state’s economy which might result from a decreased dependence on these fuels
One of the requirements in Section 355 of the Energy Policy Act of 2005 calls for an examination of a possible scenario which would accelerate the use of renewable energy resources for transportation fuels in Hawaii. Certain caveats are important to point out at the beginning of this report. First, there is a reasonable amount of literature discussing the use of ethanol as a fuel. The basis of the following discussion concerning ethanol is a recent report produced by the Hawaii Natural Energy Institute for the Hawaii Department of Business, Economic Development, and Tourism. As such, the study (called the referenced report) relies on accepted literature and adds to the body of knowledge concerning ethanol use in the state.
The section on bio-diesel, however, reflects the paucity of information currently available on the subject. In the case of ethanol, sugar cane is currently being grown in the state for other reasons. Further, as the ethanol study indicates, there have been a considerable number of other studies performed examining the potential of other agricultural and forestry products for the production of ethanol. For bio-diesel, there are currently no oil bearing crops under cultivation in the state which could be used in the future as feedstock for bio-diesel fuel. Thus, the current analysis more properly reflects a state of science and a state of knowledge from which no rigorous economic analyses are available.
In the way of preamble, it is also important to note that the projections made for ethanol and bio-diesel are made independently of one another. Thus, the conclusions for each of these fuels are not additive. The commercial development of the crops and infrastructure supporting the production of these fuels will necessarily be competing with one another. The land use, water, and labor demands for each of these fuels will overlap. In addition, competition for fiber resources may also play a role. Technology pathways exist that can produce either ethanol or bio-diesel from fiber, thus setting up potential competition for limited biogenic fiber resources. It is likely that future fuel use in the state may reflect a mix of bio-diesel and ethanol. This will be based on the suitability of land for specific agricultural practices, the availability of water as this relates to the requirements of various crops, and the “critical mass” of crops necessary to achieve the development of an economically viable industry and related end uses.
The lack of additivity for the conclusions of this set of analyses will carry over to other scenario analyses required under the language contained in Section 355. Specifically, another scenario will examine the accelerated use of renewable resources for electricity generation. In addition to wind, geothermal, and solar technologies, biomass combustion or conversion
1

technologies must be considered. Thus, the final overall report will also address the competition for land, labor, and water resources between the various technology futures.
The following material under section 2.0 of this report will contain a discussion of the potential for ethanol to be used as a transportation fuel. As mentioned above, this material is abstracted from a larger report recently prepared for DBEDT [3]. Section 3.0 of this report will discuss what is currently known about bio-diesel, its potential for use in the state, and some of the outstanding questions that need to be resolved.
2.0. Potential for Ethanol Use in Hawaii 2.1. Background
Three main areas must be addressed to estimate ethanol production potential in the State of Hawaii. First, land availability and suitability must be assessed to establish potential limits to feedstock cost and availability. Second, based on the results of the land survey and taking time frame into consideration, feedstock and conversion technology can be selected. Finally, the cost of production must be evaluated by estimating feedstock and conversion costs.
Biomass is a potential source of transportation fuel. For this reason a concerted effort was made to develop technology and resources in this area. Early work built on Hawaii’s agricultural history and extensive experience with sugar cane and pineapple production. Investigations and experimental trials were conducted to identify favorable plant species for dedicated energy crop production. Long-term field trials were initiated to study a variety of areas including cultivation, harvesting methods and yield characteristics [4, 5, 6, 7, 8, 9, 10, 11].
The rapid improvements in computing power beginning in the 1980s enabled work on crop suitability modeling to develop. A great deal of effort was spent developing a database with various important agronomic values, such as rainfall, insolation, wind conditions, slope, and soil series for the entire State. The Hawaii Natural Resource Information System (HNRIS), as the database was called, was used to match crops to suitable lands or vice versa [12].
Concurrently with the biomass feedstock production studies, work on converting biomass to liquid fuel was also conducted. In the late 1980s and early 1990s the Hawaii Integrated Biofuels Research Program (HIBRP) explored the feasibility of growing dedicated energy crops for conversion into liquid transportation fuels, primarily methanol and ethanol. The research areas included species selection and yield characteristics, harvesting and yield model development, and conversion technology development [13].
In 1994 a mandate requiring blending of ten percent ethanol in motor fuel was introduced through Act 199. The language included in Act 199 later became part of Chapter 486E of the Hawaii Revised Statutes. The lack of a local supply of ethanol and a system for enforcement, along with resistance from the petroleum supply chain, stalled the implementation of the mandate until the spring of 2006. The most recent version of the mandate is set forth in Title 15, Chapter 35 of the Hawaii Administrative Rules [14].
The absence of local supplies of ethanol was recognized as a hurdle to implementing the ethanol mandate and several studies on local ethanol production potential were commissioned [15, 16, 17]. These reports addressed technological, economic, and environmental constraints to local ethanol production. In a 1994 report, Ethanol Production in Hawaii, Dr. Robert Shleser investigated ethanol production potential from readily available feedstocks, including bagasse, molasses, cane trash, newspaper, and municipal solid waste, as well as experimental crops, Leucaena, Eucalyptus, sweet sorghum, and napier grass. The report describes seven integrated biomass to ethanol conversion technologies and briefly touches on the traditional fermentation of
2
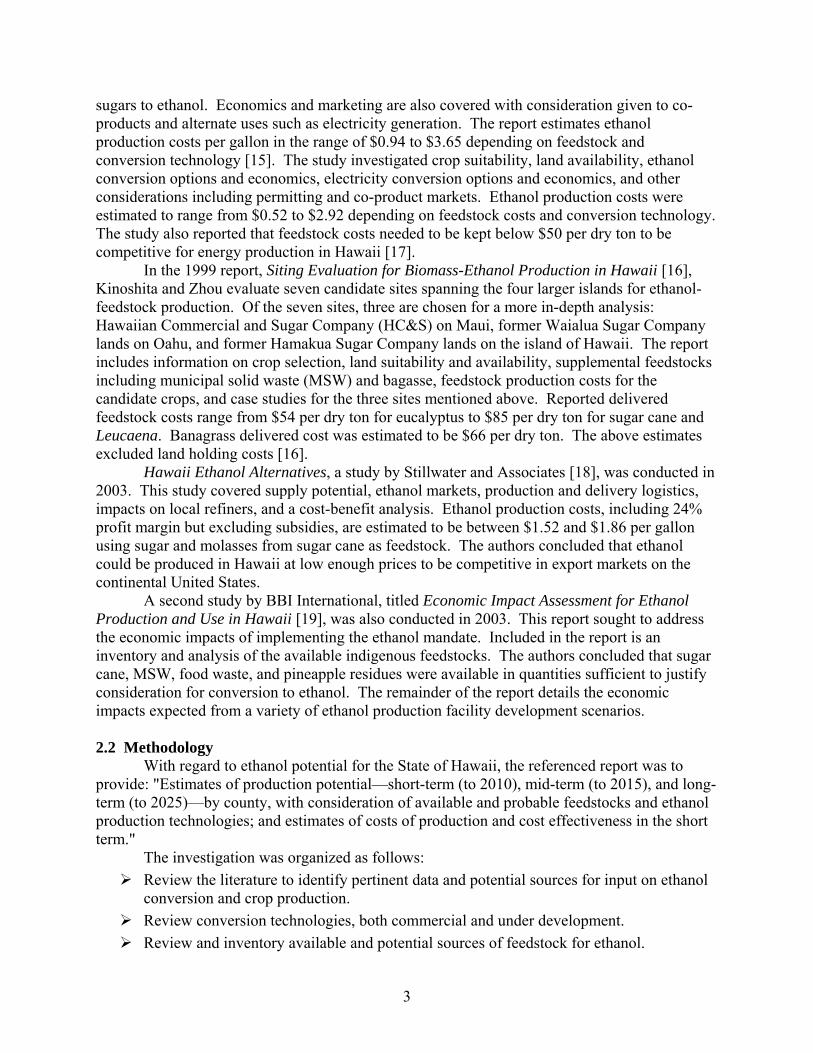
sugars to ethanol. Economics and marketing are also covered with consideration given to co-products and alternate uses such as electricity generation. The report estimates ethanol production costs per gallon in the range of $0.94 to $3.65 depending on feedstock and conversion technology [15]. The study investigated crop suitability, land availability, ethanol conversion options and economics, electricity conversion options and economics, and other considerations including permitting and co-product markets. Ethanol production costs were estimated to range from $0.52 to $2.92 depending on feedstock costs and conversion technology. The study also reported that feedstock costs needed to be kept below $50 per dry ton to be competitive for energy production in Hawaii [17].
In the 1999 report, Siting Evaluation for Biomass-Ethanol Production in Hawaii [16], Kinoshita and Zhou evaluate seven candidate sites spanning the four larger islands for ethanol-feedstock production. Of the seven sites, three are chosen for a more in-depth analysis: Hawaiian Commercial and Sugar Company (HC&S) on Maui, former Waialua Sugar Company lands on Oahu, and former Hamakua Sugar Company lands on the island of Hawaii. The report includes information on crop selection, land suitability and availability, supplemental feedstocks including municipal solid waste (MSW) and bagasse, feedstock production costs for the candidate crops, and case studies for the three sites mentioned above. Reported delivered feedstock costs range from $54 per dry ton for eucalyptus to $85 per dry ton for sugar cane and Leucaena. Banagrass delivered cost was estimated to be $66 per dry ton. The above estimates excluded land holding costs [16].
Hawaii Ethanol Alternatives, a study by Stillwater and Associates [18], was conducted in 2003. This study covered supply potential, ethanol markets, production and delivery logistics, impacts on local refiners, and a cost-benefit analysis. Ethanol production costs, including 24% profit margin but excluding subsidies, are estimated to be between $1.52 and $1.86 per gallon using sugar and molasses from sugar cane as feedstock. The authors concluded that ethanol could be produced in Hawaii at low enough prices to be competitive in export markets on the continental United States.
A second study by BBI International, titled Economic Impact Assessment for Ethanol Production and Use in Hawaii [19], was also conducted in 2003. This report sought to address the economic impacts of implementing the ethanol mandate. Included in the report is an inventory and analysis of the available indigenous feedstocks. The authors concluded that sugar cane, MSW, food waste, and pineapple residues were available in quantities sufficient to justify consideration for conversion to ethanol. The remainder of the report details the economic impacts expected from a variety of ethanol production facility development scenarios. 2.2 Methodology
With regard to ethanol potential for the State of Hawaii, the referenced report was to provide: "Estimates of production potential—short-term (to 2010), mid-term (to 2015), and long-term (to 2025)—by county, with consideration of available and probable feedstocks and ethanol production technologies; and estimates of costs of production and cost effectiveness in the short term."
The investigation was organized as follows: Review the literature to identify pertinent data and potential sources for input on ethanol
conversion and crop production. Review conversion technologies, both commercial and under development. Review and inventory available and potential sources of feedstock for ethanol.
3

Inventory agricultural lands and determine their suitability for energy crop production. Model/estimate yields for various crops based on available lands. Estimate ethanol conversion for identified feedstocks, based on conversion technology
for the short-, mid-, and long-term cases. Estimate cost of production for the near-term case.
A discussion of the conversion technologies is contained in the referenced report. 2.3. Feedstocks While the discussion of conversion technologies was not included in this report, the requirements contained in responding to Section 355 language necessitate the inclusion of the feedstock discussion, since this is central to future resource availability. 2.3.1 Available Feedstocks
Hawaii has a number of existing municipal and agricultural waste streams that might be suitable for ethanol conversion. This resource base has been well characterized by a number of studies [15, 18, 19, 20]. The biogenic fractions of waste streams (e.g., municipal solid waste, food waste, sewage sludge, and animal waste) can be excellent candidates for energy conversion because they often have low or negative cost. However, small, dispersed volumes, separation issues, and lack of collection infrastructure often make them uneconomical to harness. Thus, while it is important to consider potential energy conversion usages for waste streams, these resources are included in the resource discussion but are not considered in the remainder of the report.
Fiber-based (lignocellulosic) ethanol production involves large quantities of feedstock. The National Renewable Energy Laboratory ( NREL) uses a 2000 ton per day plant in its analysis which, at 85% capacity, would require ~620,000 dry tons per year [21]. The low energy content of biomass feedstocks makes gathering and delivery costs extremely important. For biomass to ethanol conversion to be economical, the feedstock must be available in large quantities at a low price and in a central location. Data taken from the state biomass and bioenergy resource assessment are shown below in Table 1.
The largest sources of biomass wastes are bagasse, cane trash and MSW. As Table 1 shows, in most cases the large biomass waste streams are already being utilized. The largest waste streams, MSW on Oahu and bagasse on Maui, are used for power production at the HPOWER waste-to-energy plant and the HC&S factory, respectively. Excess bagasse is produced at the Gay & Robinson (G&R) sugar factory on Kauai and until recently was sold to a third party for power generation.
At both the HC&S plantation on Maui and the G&R plantation on Kauai, cane trash is burned in the field before harvesting. The feasibility of harvesting and processing the cane trash to capture the large fiber resource represented by this waste stream continues to be evaluated. If an economical method to harvest cane trash is developed, this resource could be used to generate up to 10.5 million gallons per year, using a conversion factor of 75 gallons of ethanol per dry ton developed by Shleser [15].
A recent BBI report concluded that MSW exists in a large enough quantity to justify a stand-alone conversion plant on Oahu only. Production of 37 million gallons of ethanol per year was predicted under the assumption that the entire organic fraction was converted and that 1 dry ton of biomass would yield 60 gallons of ethanol [19]. In practice, the majority of this resource is presently being recycled, converted at HPOWER, or composted.
4
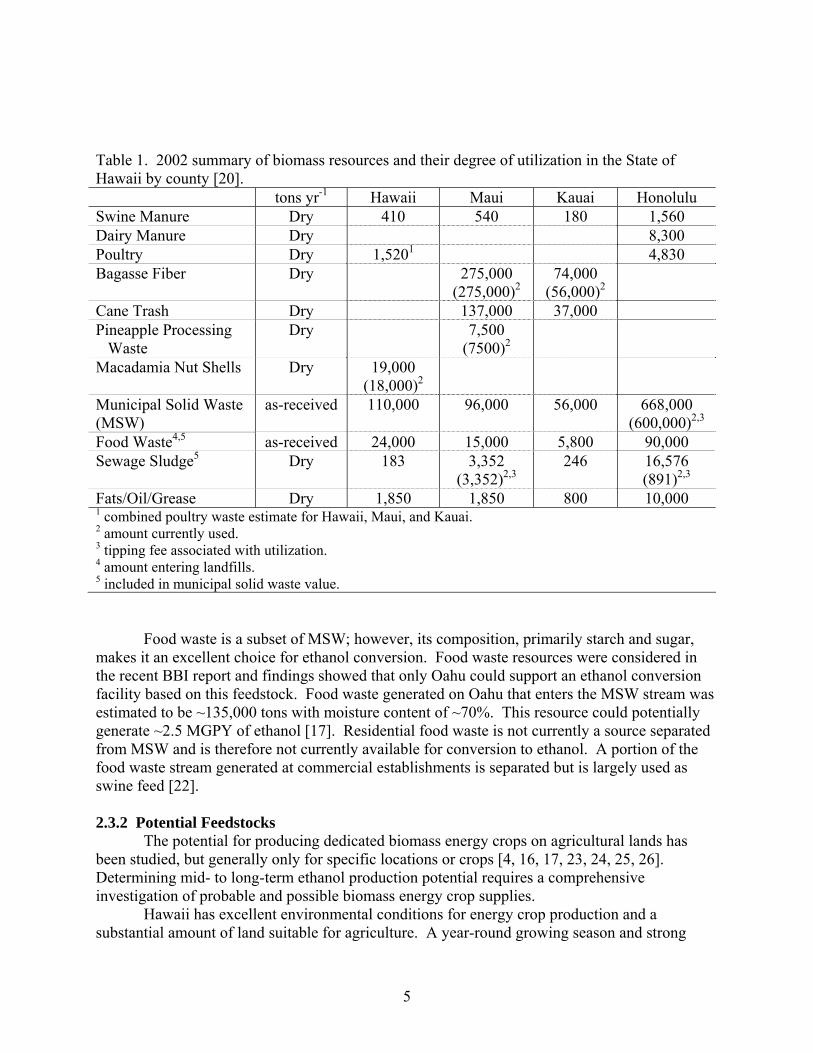
Table 1. 2002 summary of biomass resources and their degree of utilization in the State of Hawaii by county [20]. tons yr-1 Hawaii Maui Kauai Honolulu Swine Manure Dry 410 540 180 1,560 Dairy Manure Dry 8,300 Poultry Dry 1,5201 4,830 Bagasse Fiber Dry 275,000
(275,000)274,000
(56,000)2
Cane Trash Dry 137,000 37,000 Pineapple Processing
Waste Dry 7,500
(7500)2
Macadamia Nut Shells Dry 19,000 (18,000)2
Municipal Solid Waste (MSW)
as-received 110,000 96,000 56,000 668,000 (600,000)2,3
Food Waste4,5 as-received 24,000 15,000 5,800 90,000 Sewage Sludge5 Dry 183 3,352
(3,352)2,3246 16,576
(891)2,3
Fats/Oil/Grease Dry 1,850 1,850 800 10,000 1 combined poultry waste estimate for Hawaii, Maui, and Kauai. 2 amount currently used. 3 tipping fee associated with utilization. 4 amount entering landfills. 5 included in municipal solid waste value.
Food waste is a subset of MSW; however, its composition, primarily starch and sugar, makes it an excellent choice for ethanol conversion. Food waste resources were considered in the recent BBI report and findings showed that only Oahu could support an ethanol conversion facility based on this feedstock. Food waste generated on Oahu that enters the MSW stream was estimated to be ~135,000 tons with moisture content of ~70%. This resource could potentially generate ~2.5 MGPY of ethanol [17]. Residential food waste is not currently a source separated from MSW and is therefore not currently available for conversion to ethanol. A portion of the food waste stream generated at commercial establishments is separated but is largely used as swine feed [22]. 2.3.2 Potential Feedstocks
The potential for producing dedicated biomass energy crops on agricultural lands has been studied, but generally only for specific locations or crops [4, 16, 17, 23, 24, 25, 26]. Determining mid- to long-term ethanol production potential requires a comprehensive investigation of probable and possible biomass energy crop supplies.
Hawaii has excellent environmental conditions for energy crop production and a substantial amount of land suitable for agriculture. A year-round growing season and strong
5

solar insolation generate high yields from a variety of tree and grass crops. Identification and study of high yielding energy crops suitable for cultivation in Hawaii has been carried out over the last 20-30 years. The most promising crops for fiber production include grass crops: Saccharum officinarum (sugar cane) and Pennisetum purpureum (banagrass), and woody crops: Eucalyptus grandis, Eucalyptus saligna, and Leucaena leucocephala (giant Leucaena or haole koa). These are the most likely candidates for dedicated energy crops for sugar or fiber production and have been studied to the greatest extent. Other crops: sweet sorghum, albizia, guineagrass, etc, have been proposed but large scale trials to evaluate their suitability as energy crops have not been carried out in Hawaii. Sugar cane, banagrass, E. grandis, E. saligna and giant Leucaena were considered in the present study. Of the selected crops, only sugar cane and Eucalyptus are being grown commercially. Large acreages of eucalyptus have been planted but none have been harvested to date. 2.3.2.1 Sugar Cane
Sugar cane has a long history of cultivation in Hawaii dating back to the 1800’s. Historical data on yields, management practices, cost of production and planted acreage are available in the literature [27]. In Hawaii, sugar cane is grown to produce sugar and molasses and bagasse are generated as byproducts. Molasses is marketed as cattle feed supplement, but is being considered as a feedstock for ethanol conversion. Bagasse is used to fuel boiler systems that generate steam and electricity to run the factory – the latter may also be exported to the utility.
In Brazil, where ethanol production from sugar cane is common practice, factories are set up to process cane juice into sugar and molasses, or ethanol, or some mixture of the two products, depending on market prices. If sugar cane were to be grown as a dedicated energy crop in Hawaii, Brazilian production could be considered as a model.
A large portion of fiber generated during the growth cycle, commonly called cane trash, is burned off in the field prior to harvest. This could provide additional fiber for conversion to ethanol if it could be economically recovered and lignocellulosic conversion technologies become commercial.
The high yield and variety of products that can be generated using sugar cane make it an obvious candidate energy crop to be considered in this report. It also has the advantage of being an established crop in Hawaii with an infrastructure and labor force already in place. The modification and expansion of existing sugar operations to meet ethanol demands is one of the most likely avenues for commercial ethanol production in the state.
For all of its advantages, sugar cane as an energy crop is not without drawbacks. Chief among them are high irrigation requirements and cost competitive production of sugar and molasses elsewhere in the world. High costs of labor, land, fertilizer and water put added stress on the sugar industry in Hawaii. A suitable method for the disposal of vinasse, the liquid effluent from distillery operations, will also need to be identified. Nonetheless, as the only established crop of those selected, sugar cane deserves to be placed at the top of the list of potential dedicated energy crops. 2.3.2.2 Banagrass
Banagrass was introduced to Hawaii from Australia in the mid-1970s to be used as an indicator plant for ratoon stunting disease in sugar cane. Banagrass is a high yielding, upright
6

grass species recognized for its potential as a biomass energy crop. Banagrass rates well with a number of trials showing repeatedly high yields from successive crops.
Banagrass is considered to be very close to sugar cane in management and harvesting requirements, although its management as a energy crop would be different from that of today’s sugar operations in Hawaii. In our analysis, banagrass production is based on sugar cane cultural practices, but with fiber as the only product. Banagrass has higher dry biomass yields and is assumed to be grown on an eight month harvesting cycle. A number of trials have been conducted in Hawaii to estimate yield and to develop management techniques. Data from various trials can be found in the report entitled, Investigation of Biomass-for-Energy Production on Molokai [23]. This report also includes information on harvest methods and projected production costs. Banagrass was planted as a dedicated energy crop for power generation on former sugar lands at the Waialua Sugar Company plantation on Oahu but the project was abandoned before completion of the first crop cycle. Unfortunately, no production data are available from this effort. 2.3.2.3 Eucalyptus
Eucalyptus was introduced to Hawaii in the 1870s and planted to protect denuded watersheds. It was first commercially planted as a source of fuel for boilers in the sugar industry. While the trees flourished in the tropical environment, difficulties with harvesting and advances in bagasse handling and boiler technologies made it an uneconomic fuel. Other varieties were introduced over the following century and used for wind breaks, erosion mitigation, and in forestry experiments. In the last ten to fifteen years Eucalyptus plantations have been established on the island of Hawaii, with over 25,000 acres presently being managed intensively.
Extensive work on species selection and growth characterization was done in the 1980s by the BioEnergy Development Corporation, a subsidiary of C. Brewer [8]. Other trials were conducted at locations across the state by the Department of Land and Natural Resources, Hawaii Agriculture Research Center, and the University of Hawaii.
Unlike traditional forest plantings which try to maximize merchantable timber production, intensively-cultured, short-rotation plantations seek to maximize biomass production. Plantations are generally planned to operate on a 5-8 year rotation. Eucalyptus species that have been studied in Hawaii and have been recommended for this purpose include E. saligna, E. grandis, E. robusta, E. globulus, and E. urophylla. The two species chosen for consideration in this report are E. saligna and E. grandis, which both show excellent yields over a range of environments. The other varieties outperform only in certain niche environments, very high elevation, poorly drained soil, very low rainfall, etc.
The existence of commercial plantings of Eucalyptus will yield valuable experience and information to future developers of dedicated energy crops. These first commercial operations will also help to develop the skilled local labor force that will be required if larger plantings are to be successful. 2.3.2.4 Leucaena leucocephala (giant Leucaena)
Giant Leucaena was first brought to prominence and tested in Hawaii by Dr. James Brewbaker at the University of Hawaii during the 1970s. Since then the University of Hawaii has developed varieties and provided seeds to researchers throughout the world. Trials in Hawaii
7

were conducted on Oahu and Molokai. Information on harvesting methods and yield projections can be found in a report titled, Giant Leucaena Energy Tree Farm [24]. 2.4. Land Analysis and Energy Crop Suitability
Hawaii has a long agricultural history, with sugar and pineapple plantations dating back into the 1800s. While times have changed, and many agricultural lands have been taken out of production, nearly half of the land in the state, 1,928,034 acres, is zoned for agriculture [28]. Land use and zoning in Hawaii follow strict guidelines set forth in the State Land Use Law enacted in 1961. There are four zoning designations in the State of Hawaii: Agriculture, Rural, Urban and Conservation. In an earlier analysis of land availability conducted in 1992, Urban and Rural lands were considered unavailable, conservation lands were considered probably available, and agricultural lands were considered available for energy crop production [29]. In this analysis only lands zoned for agriculture will be considered. Out of the total lands zoned for agriculture, about half, 977,043 acres, are categorized as agricultural lands important to the State of Hawaii (ALISH). The State of Hawaii (SOH) owned lands zoned for agriculture account for about 430,000 acres or 22% of the total agriculturally-zoned lands. Of the 1.93 million acres zoned for agriculture, 1.30 million are considered to be in farming with the majority of these lands fallow or used for grazing. Only 104,000 acres of the 1.30 million acres of farmland were actually in crops during 2004 [30]. An understanding of statewide land suitability for growing energy crops and the types of crops that can be grown on any given parcel is useful information for biofuels production planning. Data on soil types, slopes, and rainfall are available and can be used in screening strategies to determine whether lands are potentially suitable for energy crop production. Using geographic information systems (GIS) software [31], different screening criteria were overlaid to assess the suitability and potential availability of lands for dedicated energy crop production.
Soil series maps available through the United States Department of Agriculture (USDA) Natural Resources Conservation Service (NRCS) were used in the land analysis. These maps include soil type names and descriptions and information on slope, irrigated or unirrigated use, and suitability for sugar cane, pineapple, pasture, and woodland uses. Unirrigated refers to lands and crops that are wholly rainfed (naturally irrigated) and irrigated refers to lands and crops that receive some form of mechanically applied water to supplement rainfall. Other GIS data including annual rainfall, land use zoning, land ownership including a category for large land owners (LLO), and agricultural lands of importance to the State of Hawaii (ALISH) are available through the Hawaii statewide GIS program website (see http://www.hawaii.gov/dbedt/gis/).
The soil series maps from NRCS are accompanied by several informative guides. The Guide to Mapping Units includes tables of soil series designators and their suitability for sugar cane, pineapple, pasture and woodland uses [32]. Another such guide titled, Use and Management of the Soils, provides details on limitations and management needs of the soil groups described in the series maps [33].
Based on the energy crops identified in potential feedstock analysis, the soil types that were suitable for sugar cane and woodland production were selected and mapped using GIS software. This provided an island by island breakdown of acreage suitable for sugar cane and woody biomass crops based on soil types. This screening process does not provide a high degree of specificity but allows potential production scenarios to be evaluated relatively easily.
Because slope is an important factor in harvesting and management regimes, as well as erosion considerations, the suitable soils were further divided into three slope ranges: ≤ 10%,
8

10% to 20%, and >20%. The slope ranges provided for the NRCS soil series vary widely, so the midpoint of the range was used to place them in these slope categories. For example, the soil mapping unit EaC(Ewa silty clay loam), has a slope range of 6 to 12% and a midpoint of 9, which puts it in the slope ≤10% category.
Following the soil and slope analyses, water available through rainfall was evaluated. The selected crops have varying water requirements. Sugar cane and banagrass require abundant water to reach maximum yields, while Eucalyptus and Leucaena can be grown with lesser amounts. Water resources are limited in many areas due to increased urban and residential demand and the need to maintain stream flows to preserve environmental quality. The quantity of water available to developers of dedicated energy crops remains undetermined. For this reason, an analysis of potential rain-fed areas was conducted. Historically, many of the sugar plantations on Hawaii and some on Kauai were unirrigated. Using data from the Hawaii Sugar Manual and the GIS annual rainfall layer, a minimum level of approximately 70 inches per year was established for unirrigated sugar production [27]. The GIS annual rainfall data included an isopleth at 78 inches and this was used in the analysis as the minimum rainfall required for unirrigated sugar cane production.
It was assumed that Eucalyptus and Leucaena would be grown without irrigation but that minimum levels of rainfall would be required. Eucalyptus was chosen for areas with soil types suitable for woodland species and rainfall levels of 40 inches or more. This level of rainfall is close to the lowest level reported for trials in Hawaii carried out by the BioEnergy Development Corporation [8]. While certain Eucalyptus cultivars might grow well even at lower rainfall levels, they have not been tested extensively in Hawaii.
In the NRCS Use and Management of the Soils guide, Leucaena is reported as growing well in areas with 25-60 inches of rainfall [33]. Since Eucalyptus has seen greater study and has an established base of uses other than as fuel, it was given priority over Leucaena in areas where both could be grown. For this reason, Leucaena was selected for regions with woodland soil types and annual rainfall of 20 to 40 inches. The GIS annual rainfall data included an isopleth at 20 inches and this was used as the minimum rainfall required for Leucaena production.
Combining the soil, slope and rainfall evaluations completed the energy crop suitability portion of the land analysis. The resulting maps and tables identify all the lands suitable for growing the four energy crops selected in the potential feedstock analysis. While land areas identified in this analysis are suitable for growing energy crops according to the screening criteria described above, the analysis does not address issues of economics or preferred use for any particular parcel of land. Determining the economic feasibility of energy crop production in a specific location would involve more extensive analysis. The current work is a preliminary effort that will help identify potential locations for energy crop production. The remainder of the analysis is focused on potential land availability. 2.5 Potential Ethanol Production in Hawaii
Four crop scenarios are presented: 1) sugar cane grown on all soils suitable for sugar, 2) Eucalyptus and Leucaena grown on all soils suitable for trees, 3) sugar cane given first priority, grown on all soils suitable for sugar, and Eucalyptus and Leucaena given second priority, grown on remaining soils suitable for trees, and 4) banagrass grown on all soils suitable for sugar. Results of each for each crop scenario are presented below.
9
2.5.1 Sugar
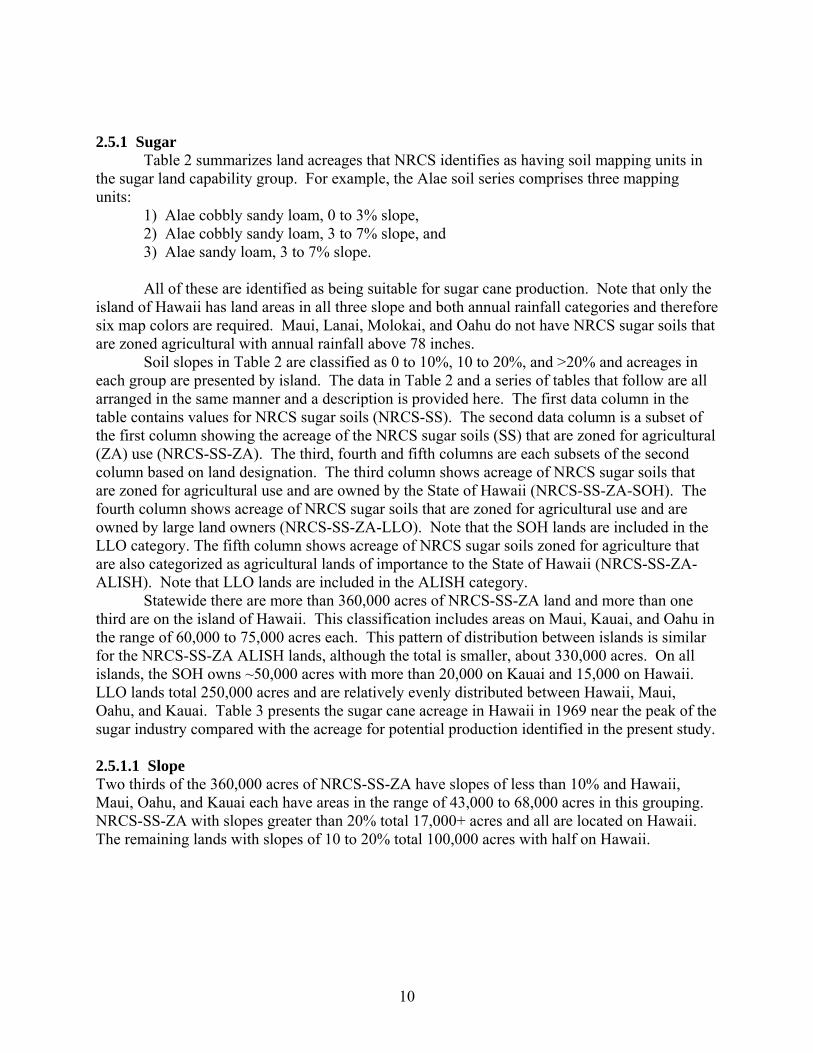
Table 2 summarizes land acreages that NRCS identifies as having soil mapping units in the sugar land capability group. For example, the Alae soil series comprises three mapping units:
1) Alae cobbly sandy loam, 0 to 3% slope, 2) Alae cobbly sandy loam, 3 to 7% slope, and 3) Alae sandy loam, 3 to 7% slope.
All of these are identified as being suitable for sugar cane production. Note that only the
island of Hawaii has land areas in all three slope and both annual rainfall categories and therefore six map colors are required. Maui, Lanai, Molokai, and Oahu do not have NRCS sugar soils that are zoned agricultural with annual rainfall above 78 inches.
Soil slopes in Table 2 are classified as 0 to 10%, 10 to 20%, and >20% and acreages in each group are presented by island. The data in Table 2 and a series of tables that follow are all arranged in the same manner and a description is provided here. The first data column in the table contains values for NRCS sugar soils (NRCS-SS). The second data column is a subset of the first column showing the acreage of the NRCS sugar soils (SS) that are zoned for agricultural (ZA) use (NRCS-SS-ZA). The third, fourth and fifth columns are each subsets of the second column based on land designation. The third column shows acreage of NRCS sugar soils that are zoned for agricultural use and are owned by the State of Hawaii (NRCS-SS-ZA-SOH). The fourth column shows acreage of NRCS sugar soils that are zoned for agricultural use and are owned by large land owners (NRCS-SS-ZA-LLO). Note that the SOH lands are included in the LLO category. The fifth column shows acreage of NRCS sugar soils zoned for agriculture that are also categorized as agricultural lands of importance to the State of Hawaii (NRCS-SS-ZA-ALISH). Note that LLO lands are included in the ALISH category.
Statewide there are more than 360,000 acres of NRCS-SS-ZA land and more than one third are on the island of Hawaii. This classification includes areas on Maui, Kauai, and Oahu in the range of 60,000 to 75,000 acres each. This pattern of distribution between islands is similar for the NRCS-SS-ZA ALISH lands, although the total is smaller, about 330,000 acres. On all islands, the SOH owns ~50,000 acres with more than 20,000 on Kauai and 15,000 on Hawaii. LLO lands total 250,000 acres and are relatively evenly distributed between Hawaii, Maui, Oahu, and Kauai. Table 3 presents the sugar cane acreage in Hawaii in 1969 near the peak of the sugar industry compared with the acreage for potential production identified in the present study.
2.5.1.1 Slope Two thirds of the 360,000 acres of NRCS-SS-ZA have slopes of less than 10% and Hawaii, Maui, Oahu, and Kauai each have areas in the range of 43,000 to 68,000 acres in this grouping. NRCS-SS-ZA with slopes greater than 20% total 17,000+ acres and all are located on Hawaii. The remaining lands with slopes of 10 to 20% total 100,000 acres with half on Hawaii.
10

Table 2. Acreages of NRCS sugar soils by land designation and slope. Natural Resources Conservation Service, Sugar Soils
Total Zoned Ag Zoned Ag,
State Owned Zoned Ag,
Large Land Owners Zoned Ag,
ALISH Island acres Acres acres acres acres Hawaii 163,066 135,283 15,104 66,801 124,877 0-10% slope 86,640 68,612 7,136 28,648 64,356 10-20% slope 57,801 49,222 6,209 28,453 44,832 20%+ slope 18,624 17,448 1,759 9,700 15,689 Maui 69,707 59,108 3,191 50,547 57,564 0-10% slope 50,654 43,179 2,311 39,369 42,177 10-20% slope 19,053 15,928 880 11,178 15,388 20%+ slope 0 0 0 0 0 Lanai 12,142 9,894 10 9,884 8,961 0-10% slope 10,022 8,128 10 8,120 7,691 10-20% slope 2,120 1,766 0 1,764 1,270 20%+ slope 0 0 0 0 0 Molokai 21,573 19,455 7,242 18,005 16,527 0-10% slope 15,429 13,396 6,004 12,145 11,245 10-20% slope 6,144 6,059 1,238 5,860 5,283 20%+ slope 0 0 0 0 0 Oahu 117,233 62,509 4,022 51,112 54,734 0-10% slope 101,540 54,003 3,322 43,561 47,099 10-20% slope 15,693 8,506 700 7,551 7,635 20%+ slope 0 0 0 0 0 Kauai 95,208 74,077 21,258 55,795 66,856 0-10% slope 68,893 53,729 15,367 40,483 49,687 10-20% slope 26,316 20,348 5,891 15,312 17,169 20%+ slope 0 0 0 0 0 State Total 478,929 360,324 50,828 252,145 329,520 0-10% slope 333,178 241,048 34,150 172,327 222,254 10-20% slope 127,127 101,829 14,918 70,118 91,576 20%+ slope 18,624 17,448 1,759 9,700 15,689
11
12
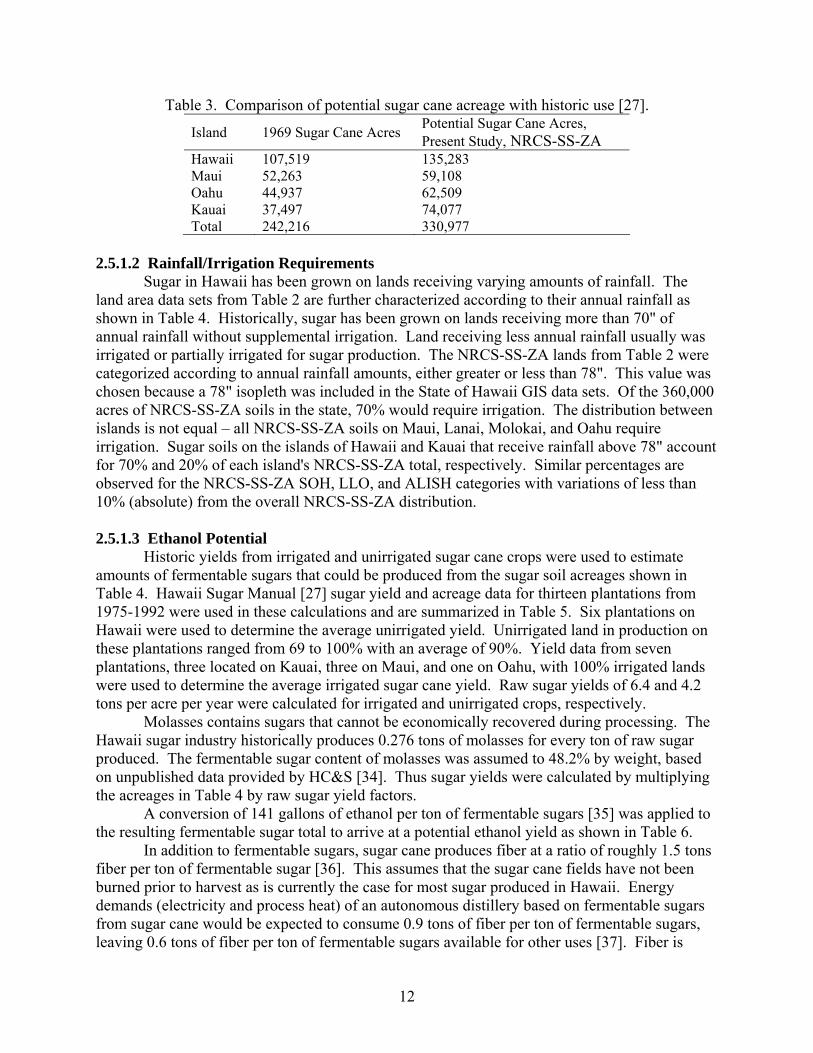
Table 3. Comparison of potential sugar cane acreage with historic use [27].
Island 1969 Sugar Cane Acres Potential Sugar Cane Acres, Present Study, NRCS-SS-ZA
Hawaii 107,519 135,283 Maui 52,263 59,108 Oahu 44,937 62,509 Kauai 37,497 74,077 Total 242,216 330,977
2.5.1.2 Rainfall/Irrigation Requirements
Sugar in Hawaii has been grown on lands receiving varying amounts of rainfall. The land area data sets from Table 2 are further characterized according to their annual rainfall as shown in Table 4. Historically, sugar has been grown on lands receiving more than 70" of annual rainfall without supplemental irrigation. Land receiving less annual rainfall usually was irrigated or partially irrigated for sugar production. The NRCS-SS-ZA lands from Table 2 were categorized according to annual rainfall amounts, either greater or less than 78". This value was chosen because a 78" isopleth was included in the State of Hawaii GIS data sets. Of the 360,000 acres of NRCS-SS-ZA soils in the state, 70% would require irrigation. The distribution between islands is not equal – all NRCS-SS-ZA soils on Maui, Lanai, Molokai, and Oahu require irrigation. Sugar soils on the islands of Hawaii and Kauai that receive rainfall above 78" account for 70% and 20% of each island's NRCS-SS-ZA total, respectively. Similar percentages are observed for the NRCS-SS-ZA SOH, LLO, and ALISH categories with variations of less than 10% (absolute) from the overall NRCS-SS-ZA distribution. 2.5.1.3 Ethanol Potential
Historic yields from irrigated and unirrigated sugar cane crops were used to estimate amounts of fermentable sugars that could be produced from the sugar soil acreages shown in Table 4. Hawaii Sugar Manual [27] sugar yield and acreage data for thirteen plantations from 1975-1992 were used in these calculations and are summarized in Table 5. Six plantations on Hawaii were used to determine the average unirrigated yield. Unirrigated land in production on these plantations ranged from 69 to 100% with an average of 90%. Yield data from seven plantations, three located on Kauai, three on Maui, and one on Oahu, with 100% irrigated lands were used to determine the average irrigated sugar cane yield. Raw sugar yields of 6.4 and 4.2 tons per acre per year were calculated for irrigated and unirrigated crops, respectively.
Molasses contains sugars that cannot be economically recovered during processing. The Hawaii sugar industry historically produces 0.276 tons of molasses for every ton of raw sugar produced. The fermentable sugar content of molasses was assumed to 48.2% by weight, based on unpublished data provided by HC&S [34]. Thus sugar yields were calculated by multiplying the acreages in Table 4 by raw sugar yield factors.
A conversion of 141 gallons of ethanol per ton of fermentable sugars [35] was applied to the resulting fermentable sugar total to arrive at a potential ethanol yield as shown in Table 6.
In addition to fermentable sugars, sugar cane produces fiber at a ratio of roughly 1.5 tons fiber per ton of fermentable sugar [36]. This assumes that the sugar cane fields have not been burned prior to harvest as is currently the case for most sugar produced in Hawaii. Energy demands (electricity and process heat) of an autonomous distillery based on fermentable sugars from sugar cane would be expected to consume 0.9 tons of fiber per ton of fermentable sugars, leaving 0.6 tons of fiber per ton of fermentable sugars available for other uses [37]. Fiber is

13
\ Table 4. Potential irrigated (<78") and unirrigated (>78") acreages of agriculturally-zoned NRCS sugar soils by land designation.
Zoned Ag Zoned Ag, State Owned Zoned Ag,
Large Land Owners Zoned Ag, ALISH
Annual Rainfall <78" >78" <78" >78" <78" >78" <78" >78"
Island Acres acres acres Acres acres acres acres acres Hawaii 40,393 94,890 4,044 11,060 25,442 41,358 38,698 86,179 Maui 59,108 0 3,191 0 50,547 0 57,564 0 Lanai 9,894 0 10 0 9,884 0 8,961 0 Molokai 19,455 0 7,242 0 18,005 0 16,527 0 Oahu 62,509 0 4,022 0 51,112 0 54,734 0 Kauai 60,574 13,503 18,831 2,427 47,269 8,526 55,532 11,324 State Total 251,932 108,393 37,340 13,487 202,260 49,885 232,016 97,504

14
Table 5. Historic irrigation data and average yields for selected plantations in Hawaii from 1975 to 1992 [27].
Plantation % Unirrigated Raw Sugar Yield1 tons/acre
Raw Sugar Yield2 tons/acre/year
Davies Hamakua Sugar Co 80 10.2 4.1 Honokaa Sugar 69 10.1 4.3 Hawaiian Agriculture (Ka'u) 100 11.2 4.0 Laupahoehoe Sugar 93 10.3 4.2 Mauna Kea Sugar 100 10.5 4.9 Puna Sugar 100 8.8 3.9 Gay & Robinson 0 14.2 7.1 Kekaha Sugar 0 13.0 6.3 Olokele Sugar 0 13.0 6.5 Hawaiian Commercial & Sugar 0 12.7 6.0 Pioneer Mill 0 12.0 6.2 Wailuku Sugar 0 12.0 6.2 Oahu Sugar 0 12.4 6.6 1 raw sugar yield based on raw sugar produced divided by acres harvested 2 annualized raw sugar yield based on raw sugar produced divided by acres harvested divided by age of crop in years composed of cellulose, hemicellulose, and lignin. Both cellulose and hemicellulose can be hydrolyzed into simple sugars that can be fermented to produce ethanol. This technology has been demonstrated at the pilot scale and, although not yet commercial, is expected to be brought to the market in the near future. An estimate of 70 gallons of ethanol per ton of fiber based on best available production data and estimates of reasonable yield improvements was used to project potential ethanol production from surplus fiber [21, 38].
The results of this calculation are shown in Table 7 and the total potential ethanol production from sugar cane (fermentable sugars and fiber) is presented in Table 8.
NCRS-SS-ZA lands have the potential to produce 428 million gallons of ethanol per year using sugar and fiber from sugarcane. Subsets of this land area will produce accordingly lesser amounts of both products. SOH, LLO, and ALISH lands have the potential to produce 61, 311, and 392 million gallons of ethanol, respectively.
Table 8 also includes electricity sales and gasoline sales as ethanol equivalent by island for 2005 [39]. Ethanol has two thirds the energy of gasoline on a volume basis and this factor was used to convert gallons of gasoline to gallon of ethanol equivalent. The data show that utilizing all of the NRCS-SS-ZA lands would not have the potential to produce enough ethanol to completely displace current gasoline use statewide; however, Hawaii, Maui, and Kauai counties collectively could potentially produce enough to match their current gasoline energy demand using NRCS-SS-ZA or NRCS-SS-ZA ALISH lands. Maui and Kauai counties could also potentially meet gasoline demand with ethanol produced from sugar cane on NRCS-SS-ZA LLO lands and Kauai would have a surplus of 28 million gallons. Total potential ethanol production from NRCS-SS-ZA LLO lands would equal 45% of the 2005 state usage. Total potential production from NRCS-SS-ZA SOH lands equal 8.8% of the 2005 gasoline demand.

Table 6. Ethanol potential from fermentable sugars from sugar cane grown on irrigated and unirrigated acreages of agriculturally- zoned NRCS sugar soils by land designation.
Annual Zoned Ag Zoned Ag,
State Owned Zoned Ag, Large Land Owners Zoned Ag,
ALISHRainfall <78" >78" <78" >78" <78" >78" <78" >78" Irr. Unirr. Total Irr. Unirr. Total Irr. Unirr. Total Irr. Unirr. Total
Island million gal/yr
million gal/yr
million gal/yr
million gal/yr
million gal/yr
million gal/yr
million gal/yr
million gal/yr
million gal/yr
million gal/yr
million gal/yr
million gal/yr
Hawaii 41.3 63.7 105.0 4.1 7.4 11.6 26.0 27.7 53.8 39.6 57.8 97.4 Maui 60.4 0.0 60.4 3.3 0.0 3.3 51.7 0.0 51.7 58.9 0.0 58.9 Lanai 10.1 0.0 10.1 0.01 0.0 0.0 10.1 0.0 10.1 9.2 0.0 9.2 Molokai 19.9 0.0 19.9 7.4 0.0 7.4 18.4 0.0 18.4 16.9 0.0 16.9 Oahu 63.9 0.0 63.9 4.1 0.0 4.1 52.3 0.0 52.3 56.0 0.0 56.0 Kauai 61.9 9.1 71.0 19.3 1.6 20.9 48.3 5.7 54.0 56.8 7.6 64.4 State Total 257.6 72.7 330.3 38.2 9.0 47.2 206.8 33.5 240.3 237.2 65.4 302.6
Table 7. Ethanol potential from sugar cane fiber grown on irrigated and unirrigated acreages of agriculturally-zoned NRCS sugar soils by land designation.
Zoned Ag Zoned Ag, State Owned Zoned Ag,
Large Land Owners Zoned Ag, ALISH
Annual Rainfall <78" >78" <78" >78" <78" >78" <78" >78"
Irr. Unirr. Total Irr. Unirr. Total Irr. Unirr. Total Irr. Unirr. Total
Island million gal/yr
million gal/yr
million gal/yr million
gal/yr million gal/yr
million gal/yr million
gal/yr million gal/yr
million gal/yr million
gal/yr million gal/yr
million gal/yr
Hawaii 12.3 19.0 31.3 1.2 2.2 3.4 7.7 8.3 16.0 11.8 17.2 29.0 Maui 18.0 0.0 18.0 1.0 0.0 1.0 15.4 0.0 15.4 17.5 0.0 17.5 Lanai 3.0 0.0 3.0 0.003 0.0 0.003 3.0 0.0 3.0 2.7 0.0 2.7 Molokai 5.9 0.0 5.9 2.2 0.0 2.2 5.5 0.0 5.5 5.0 0.0 5.0 Oahu 19.0 0.0 19.0 1.2 0.0 1.2 15.6 0.0 15.6 16.7 0.0 16.7 Kauai 18.4 2.7 21.1 5.7 0.5 6.2 14.4 1.7 16.1 16.9 2.3 19.2 State Total 76.7 21.7 98.4 11.4 2.7 14.1 61.6 10.0 71.6 70.7 19.5 90.1
15

16
Table 8. Ethanol potential from sugar cane grown on agriculturally-zoned NRCS sugar soils by land designation compared with actual usage.
Zoned Ag Zoned Ag, State Owned
Zoned Ag, Large Land Owners
Zoned Ag, ALISH
Actual Usage in 20051
Island million gal/yr million
gal/yr million gal/yr million
gal/yr Gasoline million gal/yr as ethanol equivalent2
Hawaii 136.2 15.0 69.8 126.4 112 Maui 78.4 4.2 67.1 76.4 94 Lanai 13.1 0.0 13.1 11.9 - Molokai 25.8 9.6 23.9 21.9 - Oahu 82.9 5.3 67.8 72.6 440 Kauai 92.1 27.1 70.1 83.5 42 State Total 428.7 61.3 311.8 392.8 688 1 Data from Hawaii Energy Data Book, http://www.hawaii.gov/dbedt/info/economic/databook/db2005/ 2 Gasoline sales by county converted to ethanol equivalent; 1 gal ethanol = 0.66 gal gasoline

2.5.2 Woodland Table 9 summarizes land acreages that NRCS identifies as having soil mapping units in
the woodland land capability group. The NRCS soil mapping units land capabilities designations identify some mapping units as being suitable for sugar, pineapple, or woodland. These designations were assigned by NRCS when a hierarchical approach to land use was based on sugar and pineapple being more valued crops than wood. Thus land deemed suitable for sugar or pineapple was not always designated as appropriate for woodlands although nothing about the soils or slopes precluded wood production. In the current study, the approach to identifying mapping units for wood production was to include all soil mapping units that were identified as suitable for sugar, pineapple, or wood. Thus, the sugar soils identified in the previous section are included in the acreage shown in Table 9. Later analysis will address the hierarchical use of lands. The current section explores the ethanol potential from wood production on all soils deemed suitable for wood, including NRCS soils identified for sugar and pineapple.
Soil slopes in Table 9 are classified as 0 to 10%, 10 to 20%, and >20% and acreages in each group are presented by island. The data in Table 9 and the series of tables that follow are all arranged in the same manner and a description is provided here. The first data column in the table contains values for NRCS woodland soils (WS) that are zoned for agricultural use (NRCS-WS-ZA). The second and third data columns divide the acreage in the first column into categories according to annual rainfall. The second data column indicates the number of acres that have less than 20" and the third data column shows the acreage with greater than 20 inches (NRCS-SS-ZA>20"). Wood production is envisioned to be rainfed and land with less than 20" of annual rainfall is deemed unsuitable for this purpose. The fourth, fifth, and last data columns are each subsets of the third column based on land designation. The fourth column shows acreage of NRCS woodland soils that are zoned for agricultural use, have annual rainfall greater than 20", and are owned by the State of Hawaii (SOH). The fifth column shows acreage of NRCS woodland soils that are zoned for agricultural use, have annual rainfall greater than 20", and are owned by large land owners (LLO), including SOH. Agricultural lands of importance to the State of Hawaii (ALISH) that are zoned for agricultural use and have annual rainfall greater than 20" are presented in data column six.
Statewide there are almost 700,000 acres of NRCS-WS-ZA that have annual rainfall greater than 20" and 388,000 acres are on the island of Hawaii. This classification includes areas on Maui, Kauai, and Oahu in the range of 87,000 to 100,000 acres each. A comparison shows that more than 80% of the statewide total NRCS-WS-ZA land with annual rainfall greater than 20" is ALISH lands and 70% is in the hands of LLO. The SOH holds 160,000 acres. More than half of the acres included in any of the land designations are on the island of Hawaii. 2.5.2.1 Slope
43% of the 698,000 acres of statewide NRCS-WS-ZA with annual rainfall >20" have slopes of less than 10%, 46% have slopes between 10 and 20%, and the remainder, 11%, have slopes greater than 20%. These high slope soils are spread fairly evenly between the larger islands with each having in the range of 14,000 to 25,000 acres.
17

Table 9. Acreages of NRCS woodland soils by land designation, slope, and rainfall. NRCS Woodland Soils
Total Zoned Ag
Zoned Ag
Zoned Ag State Owned
Lands
Zoned Ag Large Land Owners
Zoned Ag ALISH
Annual Rainfall >0" <20" >20" >20" >20" >20" Island acres acres acres acres acres acres Hawaii 553,814 45,494 388,492 114,112 277,125 330,742 0-10% slope 232,349 27,157 152,870 35,243 98,107 128,815 10-20% slope 302,822 18,337 218,156 77,109 169,318 186,220 20%+ slope 18,642 0 17,466 1,759 9,700 15,707 Maui 167,709 32,533 100,748 7,623 43,077 84,425 0-10% slope 60,546 26,325 24,157 832 19,666 22,626 10-20% slope 81,747 6,208 58,729 5,679 34,697 47,707 20%+ slope 25,416 0 17,862 1,112 16,004 14,093 Lanai 24,904 10,841 9,890 47 9,871 9,272 0-10% slope 21,283 9,446 8,993 47 8,976 8,459 10-20% slope 3,622 1,395 897 0 895 813 20%+ slope 0 0 0 0 0 0 Molokai 50,889 22,353 19,585 6,411 17,040 13,775 0-10% slope 34,515 18,296 10,188 3,797 8,916 8,138 10-20% slope 13,526 4,049 7,087 2,216 6,438 4,802 20%+ slope 2,849 7 2,309 397 1,686 835 Oahu 205,862 7,313 87,278 6,387 74,504 57,348 0-10% slope 108,467 6,481 50,286 3,420 42,374 43,033 10-20% slope 27,406 745 12,762 1,418 10,374 8,929 20%+ slope 69,988 87 24,231 1,549 21,756 5,386 Kauai 150,391 460 92,640 25,780 69,423 75,498 0-10% slope 74,785 460 54,603 15,154 40,860 49,398 10-20% slope 36,394 0 23,991 7,714 18,452 19,102 20%+ slope 39,212 0 14,046 2,912 10,111 6,998 State Total 1,153,570 118,993 698,632 160,360 491,040 571,060 0-10% slope 531,945 88,166 301,098 58,495 218,901 260,468 10-20% slope 465,517 30,733 321,621 94,136 240,173 267,573 20%+ slope 156,107 94 75,913 7,729 59,256 43,019
2.5.2.2 Rainfall
Silviculture in Hawaii has been conducted on lands where annual rainfall is sufficient to support tree growth. While many species have been considered for commercial forestry, two, Leucaena leucocephala and Eucalyptus, were chosen for this study based on their ability to be productive in lower (20" to 40") and higher (>40") rainfall areas, respectively. The land area data sets from Table 9 were further characterized according to their annual rainfall using the
18

19
State of Hawaii GIS layer, as shown in Table 10. Of the nearly 700,000 acres of NRCS-WS-ZA soils in the state, almost 70% could be used for Eucalyptus production according to this simple classification. Eucalyptus lands account for between 50 and 80% of the NRCS-WS-ZA lands on Hawaii, Maui, Oahu, and Kauai. Molokai and Lanai differ in that Leucaena accounts for more than 75% of the NRCS-WS-ZA lands. NRCS-WS-ZA SOH, LLO, and ALISH categories are split along similar percentages on all islands. 2.5.2.3 Ethanol Potential
Yields for Leucaena and Eucalyptus vary depending on location and cultural practices. A study that managed Eucalyptus as a short rotation woody crop on the island of Hawaii found yields of 11 tons per acre per year was possible for harvest ages of 5, 6, and 7 years [40]. Similar yields were recorded from giant Leucaena trials grown in Hawaii [24]. Based on these studies, yields of 10 tons of dry matter per acre per year were used in the present study to estimate wood production potential from Leucaena and Eucalyptus on the NRCS-WS-ZA lands.
Projections of ethanol production potential from plantation grown wood using lignocellulosic conversion technology are presented in Tables 11 and 12. The volumes of ethanol that could be produced from wood on the larger acreages available as NRCS-WS-ZA lands are very similar to the totals predicted from sugar production on the NRCS-SS-ZA soils in the previous subsection. For example, the 428 million gal ethanol/yr potential (Table 8) from sugar cane grown on 360,000 acres (Table 2) statewide is very comparable to the 489 million gal ethanol/yr potential (Table 11) from short rotation woody crops grown on 698,000 acres (Table 10). Potential ethanol production volumes are also similar for LLO and ALISH land designations. 2.5.3 Ethanol from Sugar Cane and Wood
The two previous scenarios considered either sugar or wood production on suitable soils according to NRCS classifications. The current scenario considers potential ethanol production based on giving first priority to sugar cane and planting the remaining acreage to short rotation woody crops, i.e., the total area to be planted would be the union of NRCS-SS-ZA and NRCS-WS-ZA lands with sugar planted on NRCS-SS-ZA lands and short-rotation woody crops planted on the remainder. Estimated potential ethanol production under this scenario is summarized in Table 13. As expected, the combination resulted in greater ethanol production than either sugar or short rotation woody species as stand-alone crops.
Statewide potential ethanol production on NRCS-ZA lands totaled 705 million gallon per year, exceeding 2005 sales of gasoline as ethanol equivalent of 688 million gallons. Under this scenario and for LLO and ALISH land designations, the counties of Hawaii, Maui, and Kauai could produce enough ethanol to exceed their 2005 demand.

Table 10. Potential leucaena (20" to 40") and eucalyptus (>40") acreages of agriculturally-zoned NRCS woodland soils by land designation. NRCS Woodland Soils
Zoned Ag Zoned Ag Zoned Ag State Lands
Zoned Ag State Lands
Zoned Ag Large Land
Owners
Zoned Ag Large Land
Owners
Zoned Ag ALISH
Zoned Ag ALISH
Annual Rainfall 20" to 40" >40" 20" to 40" >40" 20"to 40" >40" 20" to 40" >40"
Crop Leucaena Eucalyptus Leucaena Eucalyptus Leucaena Eucalyptus Leucaena Eucalyptus Island acres acres acres acres acres acres acres acres Hawaii 76,335 312,156 26,655 87,457 70,217 206,908 68,868 261,874 Maui 47,041 53,708 3,918 3,705 36,467 6,610 42,739 41,686 Lanai 9,890 0 47 0 9,871 0 9,272 0 Molokai 15,485 4,100 5,788 623 14,012 3,028 11,765 2,010 Oahu 34,973 52,305 2,183 4,204 30,240 44,263 25,000 32,347 Kauai 28,598 64,042 15,924 9,856 27,551 41,872 23,281 52,218 State Total 212,322 486,310 54,514 105,845 188,359 302,680 180,925 390,135
Table 11. Potential ethanol production from lignocellulose from short rotation woody crops grown on agriculturally-zoned NRCS woodland soils by land designation. NRCS Woodland Soils Zoned Ag
Zoned Ag Zoned Ag State Lands Zoned Ag
Large Land Owners Zoned Ag ALISH
Crop Leuc. Euc. Total Leuc. Euc. Total Leuc. Euc. Total Leuc. Euc. Total Island million gal/yr million gal/yr million gal/yr million gal/yr Hawaii 53.4 218.5 271.9 18.7 61.2 79.9 49.2 144.8 194.0 48.2 183.3 231.5 Maui 32.9 37.6 70.5 2.7 2.6 5.3 25.5 4.6 30.2 29.9 29.2 59.1 Lanai 6.9 0.0 6.9 0.0 0.0 0.0 6.9 0.0 6.9 6.5 0.0 6.5 Molokai 10.8 2.9 13.7 4.1 0.4 4.5 9.8 2.1 11.9 8.2 1.4 9.6 Oahu 24.5 36.6 61.1 1.5 2.9 4.5 21.2 31.0 52.2 17.5 22.6 40.1 Kauai 20.0 44.8 64.8 11.1 6.9 18.0 19.3 29.3 48.6 16.3 36.6 52.8 State Total 148.6 340.4 489.0 38.2 74.1 112.3 131.9 211.9 343.7 126.6 273.1 399.7
20

21
Table 12. Potential ethanol production from short rotation woody crops on agriculturally-zoned NRCS woodland soils by land designation.
Zoned Ag Zoned Ag, State Owned
Zoned Ag, Large Land Owners Zoned Ag,
ALISHActual
Usage in 20051
Island million gal/yr million
gal/yr million gal/yr million
gal/yr Gasoline million gal/yr as ethanol equivalent2
Hawaii 271.9 79.9 194.0 231.5 112 Maui 70.5 5.3 30.2 59.1 94 Lanai 6.9 0.0 6.9 6.5 Molokai 13.7 4.5 11.9 9.6 Oahu 61.1 4.5 52.2 40.1 440 Kauai 64.8 18.0 48.6 52.8 42 State Total 489.0 112.3 343.7 399.7 688 1 Data from Hawaii Energy Data Book, http://www.hawaii.gov/dbedt/info/economic/databook/db2005/ 2 Gasoline sales by county converted to ethanol equivalent; 1 gal ethanol = 0.66 gal gasoline
Table 13. Potential ethanol production from agriculturally-zoned NRCS sugar and woodland soils by land designation with first priority given to sugar cane and second priority given to short rotation woody crops. Zoned Ag Zoned Ag,
State OwnedZoned Ag,
Large Land OwnersZoned Ag,
ALISHActual
Usage in 20051
Island million gal/yr
million gal/yr
million gal/yr
million gal/yr
Gasoline million gal/yr as Eequivalent2
Hawaii 313.5 84.3 217.0 270.5 112 Maui 130.3 8.7 82.5 117.4 94 Lanai 17.0 0.0 16.9 15.5 Molokai 33.9 11.4 30.6 26.9 Oahu 104.1 7.1 86.1 78.4 440 Kauai 105.8 30.6 80.3 90.2 42 State Total 704.6 142.1 513.5 599.0 688 1 Data from Hawaii Energy Data Book, http://www.hawaii.gov/dbedt/info/economic/databook/db2005/ 2 Gasoline sales by county converted to ethanol equivalent; 1 gal EtOH = 0.66 gal gasoline

22
2.5.4 Banagrass
A fourth crop scenario was investigated – planting NRCS-SS-ZA lands in banagrass (Pennisetum purpureum) to produce fiber for subsequent conversion to ethanol. Yields of irrigated and unirrigated banagrass on soils suitable for sugar production are estimated to be 22 and 18 tons of dry fiber per acre per year, respectively [41]. Using these fiber production values and lignocellulose to ethanol conversion factors, and ethanol production were estimated for the land areas designated in Table 5 results are presented in Table 14.
This scenario results in potential production of 524 million gallons of ethanol per year on NRCS-SS-ZA lands. This is roughly 100 million and 35 million gallons per year greater than the annual ethanol production projected for the "all sugar" and "all wood" scenarios, respectively. The earlier scenario giving first priority to sugar cane with remaining acreage devoted to wood resulted in greater potential production, 705 million gallons per year. Although not considered here, a scenario of first priority to banagrass with remaining acreage devoted to wood could be expected to exceed this value. State totals for NRCS-SS-ZA SOH, LLO, and ALISH lands were 74, 374, and 480 million gallons per year, respectively. Note that under this scenario, SOH lands could be expected to provide more than 10% of the 668 million gallons of gasoline as ethanol equivalent consumed in 2005. 2.6 Production Costs
Ethanol production costs are primarily a function of feedstock cost. In the two largest ethanol producing countries in the world, Brazil and the United States, feedstock costs account for approximately 70% of the gross production cost for ethanol manufacture [42]. The most common feedstocks for ethanol are sugar cane molasses and juice, corn, and sugar beet molasses and juice. Fuel ethanol production has resulted in increased pricing pressure on all of these primary feedstocks. Molasses prices have seen extreme volatility over the last year with prices ranging from $50 to over $100 per ton.
In this study, near-term is defined as the time period through 2010. Given the status of development of the Hawaii ethanol industry and current production technology, the most likely indigenous feedstock for ethanol production in Hawaii in this time frame, is molasses produced at existing sugar factories. Midterm for the purposes of this study is defined as the period 2011 through 2015 and producing ethanol from sugar cane (juice/fermentable sugar based) could be in place in this time horizon. Should lignocellulosic ethanol (either biochemical or thermochemical) become commercial technology during the next nine years, it too could be employed. Certainly in the long term (2016 through 2025), biochemical and thermochemical lignocellulosic ethanol production are expected to be fully commercial and ready for deployment. Biorefineries may be based on a combination of sugar and lignocellulosic conversion technologies in order to achieve flexibility in the product mix, e.g., ethanol, sugar, power, etc. Although assessments of biochemical plants utilizing corn stover at a rate of 2,000 dry tonne per day (2,200 tons per day) have been conducted [21], analysis based on an integrated platform of sugar and lignocellulosic feedstocks with multiple products should be done for conditions representative of Hawaii.

23
Table 14. Potential ethanol production from banagrass on agriculturally-zoned NRCS sugar soils by land designation. Zoned Ag Zoned Ag,
State OwnedZoned Ag,
Large Land Owners Zoned Ag, ALISH
Actual Usage in 20051
Island million gal/yr million
gal/yr million gal/yr million
gal/yr Gasoline million gal/yr as EtOH equivalent2
Hawaii 181.8 20.2 91.3 168.2 112.3 Maui 91.0 4.9 77.8 88.6 93.9 Lanai 15.2 0.0 15.2 13.8 Molokai 30.0 11.2 27.7 25.5 Oahu 96.3 6.2 78.7 84.3 439.9 Kauai 110.3 32.1 83.5 99.8 41.9 State Total 524.5 74.5 374.3 480.2 688.1 1 Data from Hawaii Energy Data Book, http://www.hawaii.gov/dbedt/info/economic/databook/db2005/ 2 Gasoline sales by county converted to ethanol equivalent; 1 gal EtOH = 0.66 gal gasoline

The near-term (through 2010) scenario of using molasses to produce ethanol would be based on the roughly 80,000 tons of molasses annually produced in the state. This could yield 5.6 million gallons of ethanol based on a conversion rate of 70 gallons ethanol per ton molasses. Costs of production for ethanol from molasses in a 6 million gallon per year facility can be estimated as shown in Table 15. Feedstock costs are calculated directly from the molasses cost and ethanol yield. Estimated operating costs of $0.36 and $0.49 per gallon of ethanol produced from molasses are presented in the BBI [19] and USDA [35] reports, respectively. BBI also reports a capital cost of $0.23 per gallon of ethanol. The USDA report identifies capital costs of $41 million for a molasses-based ethanol plant with capacity of 32 million gallon [35]. These data were used to scale capital costs for a 6 million gallon per year ethanol plant according to the equation:
6.0
2
1
2
1⎟⎟⎠
⎞⎜⎜⎝
⎛=⎟⎟
⎠
⎞⎜⎜⎝
CC
where C is plant capital cost and Q is production volume.
The scaling exponent of 0.6 is commonly used for chemical plant applications [43]. This calculation yields an estimated capital cost for a 6 million gallon per year plant of $15 million. Assuming zero equity in the project and $15 million amortized over a 20 year period with a 7% interest rate and annual payments, a simple calculation yields annual payments of $1.4 million. Dividing the annual payment by the annual capacity yields an estimate of capital costs of $0.23 per gallon, which agrees with the estimate from the BBI report. As shown in the table, total estimated cost of production for ethanol from molasses in a 6 million gallon per year plant ranges from $1.45 to $1.58 per gallon of ethanol.
Table 15. Estimated cost of production of molasses from a 6 million gal per year plant. Cost Item Basis $/gal EtOH Feedstock $60 per ton molasses
70 gal EtOH per ton molasses 0.86
Operating BBI & USDA Report [19, 35] 0.36 to 0.49 Capital BBI & USDA Report [19, 35] 0.23 Total1 1.45 to 1.58 1 does not include tax credits or other government incentives
Cost effectiveness of producing ethanol in Hawaii can be assessed by comparing cost of production against prices of imported ethanol, recognizing that this does not internalize benefits that local production might accrue related to improved energy security, increased energy diversity, stimulation of the state economy, etc. Figure 1 shows an 18 month price history of gasoline blend stocks in Los Angeles including ethanol, alkylate (high octane component used in premium grades), and California reformulated gasoline blendstock for oxygenate blending (CARBOB) [44]. Note that the ethanol price is $0.51 per gallon lower than the actual cost, reflecting the inclusion of a federal tax credit, and Spot Alkylate Gulf includes a $0.20 per gallon transportation and distribution cost from the Gulf Coast. According to the figure, in the past 18 months, ethanol prices have ranged from $1.20 to $3.75 per gallon and removing the $0.51 per
24

gallon tax credit would increase to $1.71 to $4.26 per gallon. Transportation costs from the west coast to Hawaii are estimated to add $0.29 per gallon [45]. This would increase the total cost of imported ethanol to $2.00 to $4.54 per gallon. It is prudent to note that sales of commodities such as fuel ethanol are often based on long-term contracts rather than spot prices and these estimates are expected to be higher as a result. The cost of ethanol produced from molasses in Hawaii was estimated to range from $1.45 to $1.58 per gallon, suggesting that local production can compete against imports.
Another indicator of cost competitiveness is the comparison of the price of ethanol versus gasoline. Ethanol has 66% of the energy content of gasoline on a volumetric basis. Ethanol priced at $1.50 per gallon would be competitive with a wholesale gasoline price of $2.25 per gallon on an energy equivalent basis. The average retail price for regular unleaded gasoline blended with 10% ethanol in Hawaii on December 1, 2006, was $2.86 per gallon [46] and included taxes of $0.509 per gallon [47], yielding a pretax retail value of $2.35 per gallon. This value would necessarily include dealer profits and other charges, however it serves to show that ethanol produced for $1.50 per gallon could be competitively priced with gasoline on an energy equivalent basis.
Figure 1. Eighteen month price history of California gasoline blend stocks in Los Angeles. Note that the ethanol price is shown after deducting a $0.51 per gallon federal tax credit and Spot Alkylate Gulf includes a $0.20 per gallon transportation and distribution cost from the Gulf
Coast [44]. 2.7. Summary and Conclusions
An assessment of biomass-based ethanol production potential was conducted for the State of Hawaii considering lands, crops, and conversion technologies. Evaluation of the spatial distribution of soil types, zoning, and annual rainfall was conducted using geographic
25

information system technology. The Natural Resources Conservation Service (NRCS) designation for soil types suitable for specific crops – sugar cane and wood species – was used as a first identifier of land suitability. These lands were reduced by restricting consideration to the subset zoned for agricultural use. Within the agriculturally-zoned land in the state suitable for sugar and wood production, lands owned by the State of Hawaii, those owned by large land owners, and agricultural lands of importance to the state of Hawaii, were considered as sub-groups. Acreage for each is summarized in Table 16. Values range from 50,000 acres for NRCS sugar soils that are zoned for agriculture and owned by the State of Hawaii to nearly 700,000 acres for NRCS woodland soils that are zoned agricultural. Note that NRCS designations of soils suitable for sugar and wood are not mutually exclusive, i.e., some areas are suitable for either crop, and this is reflected in the acreages in the table.
Sugar cane, banagrass, Leucaena, and Eucalyptus were selected as potential ethanol feedstock crops based on historical crop production in Hawaii or extensive energy crop research trials and demonstrations conducted over the past 30 years. Sugar cane provides fermentable sugars and fiber, whereas the latter three crops are grown for fiber only. Crop water requirements were compared with annual rainfall for the selected land areas. It was assumed that sugar and banagrass would at least require 78 inches of irrigation annually, via rainfall or mechanical application; thus, lands receiving less than 78 inches of rainfall would need some applied irrigation to supplement rainfall. It was assumed that Leucaena and Eucalyptus would be grown without applied irrigation, that Leucaena was suitable for drier locations (20 to 40 inches), and that Eucalyptus was suitable for the areas receiving more than 40 inches of annual rainfall.
Historic production data for unirrigated (rainfed) and irrigated sugar cane in Hawaii were used to calculate average raw sugar yields of 4.2 and 6.4 tons per acre per year, respectively. Based on these values and molasses and fiber data, associated total fermentable sugar and fiber yields were calculated to be 4.6 and 7.1 tons per acre per year for unirrigated sugar cane and 7.0 and 10.9 tons per acre per year for irrigated sugar cane. Unirrigated banagrass and irrigated banagrass fiber yields were assumed to be 18 and 22 tons per acre per year, respectively. Fiber yields from Leucaena and Eucalyptus were estimated to be 10 tons per acre per year based on field trials and demonstration plantings.
Yields of ethanol from sugar and fiber were assumed to be 141 gallons per ton of fermentable sugars and 70 gallons per ton of fiber, respectively. These were used to calculate total potential statewide ethanol production as shown in Table 16. Four crop scenarios were investigated: 1) sugar cane grown on all soils suitable for sugar, 2) Leucaena and Eucalyptus grown on all soils suitable for trees, 3) sugar cane given first priority, grown on all soils suitable for sugar, and Leucaena and Eucalyptus given second priority, grown on remaining soils suitable for trees, and 4) banagrass grown on all soils suitable for sugar. The third crop scenario produced the most ethanol for each of the land subgroups with a maximum value slightly greater than 700 million gallons of ethanol per year. For comparison, the total motor gasoline sales in Hawaii in 2005 totaled 454 million gallons or 668 million gallons of ethanol on an energy equivalent basis. A renewable fuels target of 20% of motor gasoline, 134 million gallons of ethanol equivalent, could be produced under all crop scenarios with the exception of state owned lands under scenarios 1, 2, and 4.
26

Table 16. Summary table of statewide ethanol potential for four land groupings and four crop scenarios.
Zoned Ag Zoned Ag, State Owned
Zoned Ag, Large Land Owners
Zoned Ag, ALISH
1) Sugar cane Acres 360,324 50,828 252,145 329,520 Ethanol (mil gal/yr) 429 61 312 393 2) Trees Acres 698,632 160,360 491,040 571,060 Ethanol (mil gal/yr) 489 112 344 400 3) Sugar cane first priority, trees second priority Sugar Acres 360,324 50,828 252,145 329,520 Wood Acres 394,136 115,488 288,105 294,564 Ethanol (mil gal/yr) 705 142 513 599 4) Banagrass Acres 360,324 50,828 252,145 329,520 Ethanol (mil gal/yr) 525 74 374 480
The crop scenarios of the summary table do not reflect near-term potential ethanol
production. For the purposes of this study, 2010 production of ethanol from molasses from existing sugar factories using readily available conversion technology was considered near term. Production costs were estimated to be $1.45 to $1.58. Comparison of estimated ethanol import costs based on west coast spot market prices and shipping costs ranged from $2.00 to $4.54 per gallon landed in Hawaii excluding incentives, suggesting that ethanol produced from local feedstock could be cost competitive. Similarly, $1.50 per gallon ethanol from molasses would translate to $2.25 per gallon of gasoline on an energy equivalent basis. Average retail gasoline prices without taxes were $2.35 per gallon on December 1, 2006, indicating that ethanol could be cost competitive with gasoline under favorable market conditions.
The scope of this analysis explored the potential for producing ethanol in Hawaii from indigenous feedstocks. This has been accomplished at a level that does not address many of the implementation issues that will be critical to such an endeavor: water availability and cost, land availability, land use priorities, impacts on environmental quality, economic impacts, and costs of production for ethanol conversion technologies that are currently in the development stage. Each of these merits additional study whether for guiding future government policy making or investing in ethanol production ventures. 3. The Potential for Biodiesel Production in Hawaii 3.1 Introduction
This section presents the technical and economic feasibility of the domestic production of biodiesel in Hawaii by the years 2010 and 2025. In order to assess the technical feasibility of biodiesel production, an estimate was made of the volume of feedstock oil potentially available for these two time horizons. The two major sources of oil for biodiesel production, recycled waste oil and oil produced from crops, were considered in the analysis. By evaluating how much oil will potentially be available from each of these sources in the future, a prediction was made on Hawaii’s technical biodiesel production potential. Other factors influencing the technical potential for biodiesel production, such as biodiesel manufacturing technology and facilities,
27

were considered. The economic feasibility of biodiesel production was also considered by analyzing the cost of production and the current global prices of biodiesel production. 3.2 Technical Feasibility of Domestic Biodiesel Production 3.2.1 Waste Oil Feedstock
All of the biodiesel currently produced in Hawaii is from waste oil feedstock. Pacific Biodiesel production facilities on Maui and Oahu currently produce about 700,000 gallons of biodiesel per year using recycled waste cooking oil [48]. It is assumed that the amount of biodiesel made from waste oil will remain relatively unchanged by the year 2010.
By 2025, it is likely that most of the waste oil resources in Hawaii could be utilized for biodiesel production. According to a Rocky Mountain Institute estimate, there is enough waste cooking oil in Hawaii to produce 2 to 2.5 million gallons of biodiesel per year [48]. Assuming that the volume of the waste oil in Hawaii remains relatively constant over the 15 year time frame, the feasible amount of biodiesel produced from waste oil by 2025 may be as high as 2.5 million gallons. 3.2.2 Oil Crop Feedstock
Major growth in the amount of biodiesel produced in Hawaii will only occur with the cultivation of dedicated oil crops or with the importation of agricultural feedstocks. A Hawaii Department of Agriculture report prepared by the Hawaii Agriculture Research Center examined the potential for oil crop cultivation in Hawaii [49]. The amount of available agricultural land was analyzed on an island by island basis. Factors such as the availability of irrigation water, land slope, and the climatic conditions of the area were taken into account to determine the oil crop best suited for each particular plot of available land. Production schemes deemed feasible for each island and the theoretical oil yield of each scheme is summarized in Table 17. The biodiesel yields are based on the assumption that one gallon of feedstock oil will produce one gallon of biodiesel.
In total, over 160 million gallons of biodiesel can potentially be produced from oil crops cultivated in Hawaii each year [49]. This figure is contingent on each island developing its agricultural lands as detailed in the Hawaii Agriculture Research Center’s report and on the oil crops producing theoretical yields. None of the crops considered in the study are currently produced on a large agricultural scale in Hawaii, so a number of assumptions were necessary for this quantitative analysis. The potential for feedstock oil production can be altered if any of these assumptions become invalid. For instance, the area of agricultural land considered available for oil crop cultivation could be reduced if other demands for this resource end up occupying the land. If more of Hawaii’s agricultural lands become available in the future due to a reduction in current agricultural land use, however, the potential for oil production could increase. The oil yields assumed for the crops in the study could be much different when the crops are grown in the Hawaiian climate. Innovative agricultural techniques, such as layering several oil producing species on a plot of land, could increase the oil potential of each acre. Developing appropriate harvesting methods for candidate oil crops will be critical to the technical and economical feasibility of large-scale production. Taking all these factors into account, the annual production of 160 million gallons of oil feedstock potential should be considered a rough estimate.
28

Table 17: Biodiesel production potential from oil-bearing crops in Hawaii by island [49].
Island Land Area
(acres) Crop Grown
Oil Yield per Crop (gal/acre)
Yearly Cropping
Cycles
Biodiesel Potential
(gallons/year) Niihau 25 Jatropha (J. curcas) 300 1 7,500 Kauai 5,500 Jatropha 300 2 3,300,000 1,400 African Oil Palm 760 1 1,064,000 1,800 African Oil Palm 760 1 1,368,000 Oahu 25,000 Jatropha 300 2 15,000,000 10,000 Jatropha 300 2 6,000,000 4,000 Castor Bean 278 1 1,112,000 6,500 African Oil Palm 760 1 4,940,000 Molokai 15,000 Jatropha 300 1 4,500,000 Lanai 12,000 Jatropha 300 1 3,600,000 Maui 4,000 Jatropha 300 2 2,400,000 10,000 Jatropha 300 2 6,000,000 10,000 Kukui 380 2 7,600,000 Hawaii 50,000 African Oil Palm 760 1 38,000,000 70,000 African Oil Palm 760 1 53,200,000 12,500 Kukui 380 1 4,750,000 12,500 African Oil Palm 760 1 9,500,000 TOTAL 250,225 162,341,500
The Hawaii Department of Agriculture report does not give an estimate on the time frame needed to implement a statewide agricultural production system capable of supplying 160 million gallons of oil per year. The report does state that it will take five to ten years for researchers to determine the best crops and locations for oil production. All of the crops considered in the report take less than ten years to reach production [49], so it is reasonable to conclude that by 2025, 160 million gallons of oil could be produced per year. Given the proximity of 2010, it is assumed that unless major efforts in oil crop cultivation begin immediately, there will be no biodiesel production from locally grown oil crops by that year.
Table 18 compares biodiesel production potential from oil crops for each island by 2025 to recent petroleum diesel consumption. This information is also shown in Figure 2. The total biodiesel production potential is found to be nearly 165 million gallons when the potential for 2.5 million gallons of biodiesel from waste cooking oil is added to the potential for biodiesel production from cultivated oil. If the potential level of biodiesel production is obtained, and if diesel demand remains consistent, Hawaii could be able to replace the majority of the highway and non-highway diesel used in the State, with domestically produced biodiesel.
29

Table 18: Potential biodiesel production compared to demand [49, 50].
Island Biodiesel Potential
2005 Non-Hwy and Hwy Diesel Consumption
2004 Non-Hwy and Hwy
Diesel Consumption
(gallons/year) (gallons/year) (gallons/year) Niihau 7,500 - - Kauai 5,732,000 20,744,971 19,052,090 Oahu 27,052,000 134,970,862 182,976,139 Molokai 4,500,000 - - Lanai 3,600,000 - - Maui 16,000,000 13,862,210 22,200,874 Hawaii 105,450,000 20,784,576 39,525,478 Total 164,841,500 190,362,618 263,754,581
0
20
40
60
80
100
120
140
160
180
200
Kauai Oahu Molokai Lanai Maui Hawaii
mill
ion
gallo
ns/y
ear
Biodiesel Potential 2005 Non-Hwy and Hwy Diesel Use 2004 Non-Hwy and Hwy Diesel Use
Figure 2. Hawaii’s biodiesel production potential compared to historic demand for highway and non-highway diesel [49, 50]. 3.2.3 Oil Feedstock from Algae
The Hawaii Agriculture Research Center report considers oil from algae as a future possibility for biodiesel feedstock oil. Hawaii’s climate is nearly perfect for algal cultivation and, of all the crops considered in the report, algae have the greatest oil content. Table 19 shows the potential oil yield from algae compared to traditional oil crops. Algae to oil technology is still under development, but if algae become feasible as a source of oil feedstock by 2025, the
30

biodiesel production potential in Hawaii will be orders of magnitude larger than the current 165 million gallon estimate. Table 19: Oil production potential of algae compared to other common crops [49].
Crop Oil content US gallons acre-1 yr-1 Years to
Production Algae 10-85% 40,000 <1 Euphorbia lathyris 40-48% 315 <1 Castor bean 40-50% 278 <1 Rape 37-50% 127 0.33 Peanut 40-55% 113 0.40 Sunflower 25-45% 102 0.40 Flax 35-40% 51 0.30 Soybean 18-20% 48 0.35
3.2.4 Biodiesel Production Process
Biodiesel is currently produced from oil and alcohol with a process known as transesterification. This process removes the fatty acid chains to produce biodiesel liquids. All commercial biodiesel made today is produced using the transesterification process, which will likely be used for biodiesel production in Hawaii in 2010. European oil companies such as BP and Neste are researching other methods to improve the production and chemistry of biofuels. These companies believe that a biodiesel fuel with superior chemical and physical properties can be produced by hydrotreating vegetable oil rather than using transesterification [48]. Ongoing research could provide a more efficient way to produce biodiesel by 2025.
Transesterification uses either methanol or ethanol in the biodiesel production process. A catalyst, commonly sodium hydroxide, is also used. If Hawaii is to produce entirely domestic biodiesel, these chemicals will need to be manufactured in state. Ethanol can be produced from agriculture. Note the inherent problem of competition for limited resources. The requirement for state produced ethanol as part of the production process will further decrease the acreage available for tropical oil production. Innovation in the transesterification process may reduce the quantities of these chemicals required for each unit of biodiesel production. Note that the need for ethanol sets up land and water use conflicts discussed in Section 1.0.
A second process for bio-diesel production is the based on thermochemical gasification of biogenic fiber. This process uses high temperature, oxygen limited conditions to produce a synthesis gas containing hydrogen and carbon monoxide. These two species are reacted over a Fischer Tropsch catalyst to produce bio-diesel directly or over an alternative catalyst to produce methanol that can subsequently be catalytically converted to dimethyl ether (DME), a diesel substitute. These fiber to bio-diesel or DME pathways could compete for fiber resources that have been identified as potential cellulosic ethanol feedstocks in the Section 2 but the impacts of this scenario have not been fully explored. Like biochemical production of ethanol from cellulose, Fischer-Tropsch diesel and DME production technologies can be characterized as emerging and information required to fully evaluate them is limited at present.
31

3.2.5 Biodiesel Production Facilities All domestic biodiesel is currently produced at Pacific Biodiesel plants on Maui and
Oahu. More manufacturing capacity will be needed if biodiesel production is to expand to 165 million gallons by 2025. Hawaiian Electric Co. and Blue Earth Biofuels LLC are planning to build a 40 million gallon per year biodiesel refining plant on the island of Maui. The plant is scheduled to begin production in 2009. By 2011, annual production is expected to reach 120 million gallons per year. The plant could increase the potential for biodiesel production in Hawaii by providing a market for locally produced oil from crops, algae, or other sources [51]. The Blue Earth biodiesel plant has recently come under strong public opposition. Those who oppose the plant are concerned that there will not be enough locally produced feedstock available to supply the plant by 2011. There is also concern over the environmental impacts of foreign production of feedstock oils, and the possible impact of oil production in Hawaii, especially from possibly invasive species [52].
Another biodiesel plant is being considered for construction on Oahu. The 100 million gallon per year plant is currently not an official plan, but Imperium Renewables is considering the idea [53]. If both the Imperium and the Blue Earth Biofuels biodiesel production plants are built, Hawaii will have the technical feasibility to produce 220 million gallons of biodiesel per year, but, given our current analysis, only 165 million gallons could be produced with locally produced feedstocks. 3.3 Economic Feasibility
The feasibility of domestic biodiesel production depends on the manufacturing costs of biodiesel. If local biodiesel cannot be produced for a price that is competitive with diesel fuel, its production will be limited. The economics of biodiesel production depends on the costs associated with waste oil recovery, oil crop cultivation, oil extraction and refining, and transesterification.
Waste oil is usually given away for free or the collector may receive a tipping fee for oil disposal. The net cost of waste oil thus depends on transportation and labor costs and tipping fee revenue. Pacific Biodiesel’s commercial operations are examples of the current economical feasibility of domestic biodiesel production in Hawaii from waste oil feedstock. Assuming that in 2010, waste oil is the only domestic biodiesel feedstock, biodiesel production in Hawaii will remain economically feasible. By 2025, the demand for biodiesel is expected to exceed the supply of waste oil. The economic feasibility of domestic biodiesel production in 2025 will therefore depend on the cost of oil from either imported or locally produced feedstock. A detailed economic analysis on the cost of oil crop cultivation in Hawaii has yet to be performed. No information is available on the cost of large-scale production of any oil crops in Hawaii [54]. Production costs of oil from jatropha, oil palm, castor bean, kukui, algae etc. need to be determined. This information will be necessary for the success of any biodiesel production plant planning to use locally produced oil feedstocks.
It is extremely difficult to predict future prices for crops currently not under cultivation in Hawaii. However, some inferences can be made on the future costs of feedstock oil production in Hawaii using current pricing practices. Malaysian palm oil is considered the primary feedstock for the planned biodiesel production facility on Maui [51]. The average price of Malaysian palm oil in April 2007 was 2,400 Malaysian Ringit per metric tonne [55]. Based on this price, the cost of palm oil would be $2.38 per gallon based on a conversion rate of 1 Ringit to $0.291. Assuming transportation and storage costs of $0.19/gallon [48], the landed cost of
32

palm oil feedstock in Hawaii is estimated to be $2.57 per gallon. It would be expected that locally produced palm oil will have lower transportation and storage costs than oil imported from Malaysia, but it is not clear whether this advantage would be sufficient to offset reduced feedstock costs. Domestic production of feedstock oil creates multiple benefits in other areas of Hawaii’s economy. Jobs will be created to grow, harvest, transport, and process the crops, and possible byproducts of oil production, such as high protein animal feed, will help fuel other sectors of the local economy [48]. However, if oil cannot be locally produced for a price of $2.57 per gallon or less, biodiesel producers will likely obtain feedstock from cheaper foreign sources. The feasibility of producing domestic biodiesel for this price in 2025 will ultimately depend on future economic conditions.
The cost of locally produced biodiesel in 2025 will also depend on the cost of converting feedstock oil to biodiesel. The current cost of the conversion process is between $0.32 and $0.58 per gallon [56]. The cost depends on factors such as the cost of energy, labor, and methanol or ethanol. Research on improving the chemical process of biodiesel production may lead to cheaper conversion costs by 2025. Assuming that conversion costs remain the same, however, and assuming a local feedstock cost of $2.57 per gallon (import parity), the price of locally produced biodiesel in 2025 will be between $2.89 and $3.15 per gallon.
The economic analysis of local biodiesel manufacturing should take into account the economic benefits of biodiesel production. Construction costs for the planned biodiesel manufacturing plant on Maui are expected to total $61 million dollars [51]. The construction of the refinery is expected to employ 100 workers and will also provide 40 permanent jobs upon reaching full operating capacity [53]. The Imperium plant on Oahu is expected to cost $90 million to build [53], and will also provide new jobs if constructed and operated. The production of biodiesel also creates a market for locally produced ethanol, methanol and sodium hydroxide, and will produce crude glycerin as a byproduct that can in turn be used to manufacture other products. The expansion in the market for each of these products may cause other economic benefits in Hawaii. 3.4 Summary Remarks on Biodiesel Development in Hawaii
The technical and economic feasibilities for domestic biodiesel production in Hawaii by 2010 and 2025 were evaluated and found to depend on the volume of feedstock oil, the biodiesel production technologies, and the availability of manufacturing facilities. The domestic biodiesel production potential in 2010 was found to remain the same as current levels, which is about 700,000 gallons per year. The estimated production assumes the use of current biodiesel manufacturing technology and facilities and use of recycled waste oil as feedstock. The planned 40 million gallon per year biodiesel plant on Maui was not anticipated to affect the domestic biodiesel production potential by 2010 because it is unlikely that domestically produced oil feedstock will be available to supply the plant by that year.
By 2025, biodiesel production from recycled waste oil and cultivated oil feedstocks was deemed technically feasible with statewide production potential totaling about 165 million gallons annually. This estimate depends on specific oil crop cultivation on seven Hawaiian Islands. The 2025 biodiesel potential could be increased if higher yielding oil crops were developed and if more agricultural land becomes available. Large biodiesel production facilities will be needed to create this volume of fuel. Two facilities are currently being considered for construction in the state.
33

The economic feasibility of domestic biodiesel depends on the costs of production. If the overall cost of producing biodiesel is competitive with other fuels, domestic production will be feasible. The cost of waste oil collection, oil crop cultivation, oil processing, and biodiesel manufacturing affect the overall biodiesel cost. Currently, biodiesel production using waste oil feedstock is economically feasible, as indicated by Pacific Biodiesel’s commercial operations. In 2010, the same economic conditions are expected to apply. By 2025, however, larger-scale domestic biodiesel production is expected to depend on oil crop production. With feedstock costs accounting for more than 60% of biodiesel production costs, the economic feasibility of biodiesel production is heavily dependent on competitively produced oil crops.
Very limited information is available on the costs of oil crop production in Hawaii due to the reasons discussed previously. Domestic oil production will only be feasible if the costs are competitive with global prices of feedstock oil. Since the current price of imported Malaysian palm oil is $2.57 per gallon, domestic crop oil should target a similar price. If feedstock is available for $2.57 per gallon, locally produced biodiesel will cost between $2.89 and $3.15 per gallon based on current oil to biodiesel conversion costs. Oil production and biodiesel conversion costs could be reduced by 2025 due to improvements in technology. The multiplication of economic benefits associated with domestic oil crop and biodiesel production should also be considered as part of the analysis. Finally, current biofuels development efforts and markets are in a state of flux and this is anticipated to continue amid the current uncertainty regarding peak petroleum, global warming, and the regulatory environment. 4.0 References 1. Macdonald, G. A., A. T. Abbott, and F. L. Peterson., 1984. Volcanoes in the Sea. The Geology of Hawaii, 2nd edition. University of Hawaii Press, Honolulu. 2. State of Hawaii Energy Resources Coordinator Annual Report, 2005. State of Hawaii Department of Business, Economic Development and Tourism. Viewed at (http://www.hawaii.gov/dbedt/info/energy/publications/erc05.pdf) 3. Keffer, V., D. Evans, S.Q. Turn, and C. Kinoshita, 2006. Potential for Ethanol Production in Hawaii. Hawaii Natural Energy Institute and College of Tropical Agriculture and Human Resources, Honolulu, HI. 4. Yang, C., et al., ed., 1977. Biomass Energy for Hawaii Volume IV, Terrestrial and Marine Plantations. Institute for Energy Studies Stanford University, Stanford, CA. 5. Brewbaker, J., ed., 1980 Giant Leucaena Energy Tree farm. Hawaii Natural Energy Institute, Honolulu, HI. 6. Brewbaker, J., 1975. “Hawaiian Giant” Koa Haole. Hawaii College of Tropical Agriculture, Honolulu, HI. 7. Forestry Potentials for Hawaii. 1976. Hawaii Department of Land and Natural Resources, Honolulu, HI.
34

8. Eucalyptus Plantations for Energy Production in Hawaii annual report. 1979-1986. BioEnergy Development Corp. 9. Forest Plantation Survey –Biomass Energy Tree Farm Program, State of Hawaii. 1979. Department of Land and Natural Resources, Division of Forestry. 10. Seki, A., 1982. Biomass Resource Potential for Selected Crops in Hawaii. Hawaii Natural Energy Institute, Honolulu, HI. 11. Schubert, T. H., and Whitesell, C.D., 1985. Species Trials for Biomass Plantations in Hawaii: a first appraisal. 12. Liang, T. and Khan, M.A., 1986. A Natural Resource Information System for Agriculture. Hawaii Institute of Tropical Agriculture and Human Resources. 13. Hawaii Integrated Biofuels Research Program Phase 1-4, Hawaii Natural Energy Institute, University of Hawaii. 1989-1994 14. Anon. 2006. Hawaii Administrative Rules, Title 15, Chapter 35, Ethanol content in gasoline. Viewed at (www.hawaii.gov/dbedt/main/about/admin-rules/15-35.pdf) 15. Shleser, Robert. Ethanol Production in Hawaii. Department of Business, Economic Development, and Tourism, Honolulu, HI. 16. Kinoshita, C., Zhou, J., 1999. Siting Evaluation for Biomass-Ethanol Production in Hawaii. National Renewable Energy Laboratory, Oak Ridge, TN. 17. Anon. 1994. Sustainable Biomass Energy Program Hamakua Project. Prepared by The Pacific International Center For High Technology Research, Honolulu, HI. 18. Gieskes, T.E. and Hackett, D.J., 2003. Hawaii Ethanol Alternatives. Stillwater and Associates for Department of Business, Economic Development, and Tourism, Honolulu, HI. 19. BBI International, 2003. Economic Impact Assessment for Ethanol Production and Use in Hawaii. Department of Business, Economic Development, and Tourism, Honolulu, HI. 20. Turn, S.Q., Keffer, V. and Staackmann, M., 2002. Biomass and Bioenergy Resource Assessment State of Hawaii. Hawaii Natural Energy Institute, Honolulu, HI. 21. Aden, A., M. Ruth, K. Ibsen, J. Jechura, K. Neeves, J. Sheehan, B. Wallace, L. Montague, A. Slayton, and J. Lukas. 2002. Lignocellulosic biomass to ethanol process design and economics utilizing co-current dilute acid prehydrolysis and enzymatic hydrolysis for corn stover. National Renewable Energy Laboratory. NREL/TP-510-32438.
35

22. Okazaki, W. 2006. Identification and assessment of food waste generators in Hawaii. Master of Science Thesis. Department of Urban and Regional Planning, University of Hawaii. Honolulu, HI. 23. Hubbard H.M. and Kinoshita, C.M., 1993. Investigation of Biomass-for-Energy Production on Molokai. Hawaii Natural Energy Institute, Honolulu, HI. 24. Brewbaker, J. 1980. Giant Leucaena (koa haole) energy tree farm, an economic feasibility analysis for the island of Molokai, Hawaii. Hawaii Natural Energy Institute. Report No. HNEI -80-06. Honolulu, HI. 25. Phillips, V.D., et al., 1993. Biomass System Model Estimates of Short-Rotation Hardwood Production in Hawaii. Biomass and Bioenergy Vol.5, No. 6, Elsevier Science Ltd., Great Britain. 26. Phillips, V.D., et al., 1995. Biomass Energy Opportunities on Former Sugarcane Plantations in Hawaii. Proceedings, Second Biomass Conference of the Americas: Energy, Environment, Agriculture, and Industry. National Renewable Energy Laboratory, Golden, Co. 27. Anon. 1968-1994. Hawaiian Sugar Manual. Hawaii Sugar Planters' Association, Aiea, HI. 28. Hawaii State Office of Planning, 2006. Report on Urban Lands in the State of Hawaii. Department of Business Economic Development and Tourism, Honolulu, HI. (http://www.state.hi.us/dbedt/op/projects/urban_lands_study/Urban-Lands-Project_Part1_Final.pdf) 29. Phillips, V. D. et al., 1992. Land Available for Biomass Crop Production in Hawaii. In Hawaii Integrated Biofuels Research Program, Phase III. Hawaii Natural Energy Institute, Honolulu, HI. 30. Anon. 2005. State of Hawaii Data Book. State of Hawaii Department of Business, Economic Development, & Tourism. Available at (http://www.hawaii.gov/dbedt/info/economic/databook/db2005/) 31. Anon. 2004. ArcGIS software package. ESRI. Redlands, CA. 32. Anon. 2007. Natural Resources Conservation Service: Hawaii Soils. Viewed at (http://www.ctahr.hawaii.edu/soilsurvey/soils.htm) 33. Anon. 2007. Natural Resources Conservation Service: Use and Management of the Soils. Viewed at (http://www.ctahr.hawaii.edu/soilsurvey/5is/usemanagesoil.htm) 34. Jakeway, L. 2006. Unpublished analysis of sugars in molasses from Hawaiian Commercial & Sugar. Puunene, HI.
36

35. Shappouri, H. and M. Salassi. 2006. The economic feasibility of ethanol production from sugar in the United States. United States Department of Agriculture, Washington DC. 36. Kinoshita, C. 1988. Composition and processing of burned and unburned cane in Hawaii. International Sugar Journal, (90) 1070, pp. 34-37. 37. Macedo, I., M. Leal, J. Silva. 2004. Assessment of greenhouse gas emissions in the production and use of fuel ethanol in Brazil. Secretariat of the Environment, Government of the State of Sao Paulo, Brazil. 38. Sheehan J., A. Aden, K. Paustian, K.. Killian, J. Brenner, M. Walsh, and R. Nelson. 2004. Energy and environmental aspects of using corn stover for fuel ethanol. Journal of Industrial Ecology. Volume 7, No. 3-4, pp. 117-146 39. Anon. 2005. 2005 State of Hawaii Data Book, Section 17: Energy and Science. State of Hawaii, Department of Business, Economic Development & Tourism. Viewed December 27, 2006 at (http://www.hawaii.gov/dbedt/info/economic/databook/db2005/) 40. Whitesell, C., D. DeBell, T. Schubert, R. Strand, and T. Crabb. 1992. Short-rotation management of Eucalyptus: Guidelines for plantations in Hawaii. U.S. Department of Agriculture, General Technical Report PSW-GTR-137. 41. Kinoshita, C., D. Ishimura, L. Jakeway, and R. Osgood. 1995. Production of biomass for electricity generation on the island of Oahu. Hawaii Natural Energy Institute, Honolulu, HI. 42. Anon. 2004. Ethanol Production Costs, A World Wide Survey. F.O. Lichts, Agra Informa Ltd., United Kingdom. 43. Thuesen, H.G., W.J. Fabrycky, and G.J. Thuesen. 1977. Engineering Economy. 5th edition. Prentice-Hall, Inc., Englewood Cliffs, New Jersey. 44. Anon. 2006. Recent California reformulated gasoline blendstock prices. California Energy Commission. Viewed at (http://www.energy.ca.gov/gasoline/graphs/component_prices.html) 45. Maloney, W. 2006. Ethanol from sugarcane: A Hawaiian perspective & comparative analysis. Presented at the American Sugar Alliance, 23rd International Sweetener Symposium, August 4-9, 2006. 46. Anon. 2006. AAA's media site for retail gasoline prices. American Automobile Association website. (http://www.fuelgaugereport.com/sbsavg.asp) 47. Hao, S. 2006. Gas tax rising 11¢. Honolulu Advertiser. December 20, 2006. Honolulu, HI. 48. Anon. 2006. Hawaii Biofuels Summit Briefing Book. Prepared by the Rocky Mountain Institute for the State of Hawaii Department of Business, Economic Development, & Tourism.
37

Available at: http://www.hawaii.gov/dbedt/info/energy/publications/BiofuelBriefingBook2006.pdf 49. Poteet, Michael D. 2006. Biodiesel Crop Implementation in Hawaii. Prepared by the Hawaii Agriculture Research Center. Aiea, HI for State of Hawaii Department of Agriculture. 50. Anon. 2007. Liquid Fuel Tax Base & Tax Collections, Calendar Year Ending December 31, 2005. Prepared by the Hawaii State Department of Taxation, Tax Research & Planning. Available at: http://www.hawaii.gov/tax/a5_3txcolrptarchive.htm 51. Wilson, Christie. 2007. “$61M Biodiesel Plant Outlined.” Honolulu Advertiser. February 18, 2007. 52. Chun, Karen. 2007. “Support for Biodiesel turns to Opposition after Research.” The Maui News. April 13, 2007. 53. Eagar, Harry. 2007. “$61 Million Project a Start to Ending Use of Petroleum.” The Maui News. February 18, 2007. “Energy Company Exploring Oahu for Biodiesel Plant.” The Maui News. April 07, 2007. 54. Poteet, Michael D. 2006. Personal communication with S. Turn. 55. Malaysian Palm Oil Board. 2007. Daily Palm Oil Market Price on 03/04/2007. Available at: http://econ.mpob.gov.my/upk/daily/20070403latest.htm. 56. Radich, Anthony. 2004. “Biodiesel Performance, Costs, and Use.” Energy Information Administration. http://www.eia.doe.gov/oiaf/analysispaper/biodiesel/.
38