Potential energy savings and benefits to thermal comfort ...
83
Purdue University Purdue e-Pubs Open Access eses eses and Dissertations 4-2016 Potential energy savings and benefits to thermal comfort from the effective use of window blinds Saurabh Sudhakaran Purdue University Follow this and additional works at: hps://docs.lib.purdue.edu/open_access_theses Part of the Architecture Commons is document has been made available through Purdue e-Pubs, a service of the Purdue University Libraries. Please contact [email protected] for additional information. Recommended Citation Sudhakaran, Saurabh, "Potential energy savings and benefits to thermal comfort from the effective use of window blinds" (2016). Open Access eses. 818. hps://docs.lib.purdue.edu/open_access_theses/818
Transcript of Potential energy savings and benefits to thermal comfort ...

Purdue UniversityPurdue e-Pubs
Open Access Theses Theses and Dissertations
4-2016
Potential energy savings and benefits to thermalcomfort from the effective use of window blindsSaurabh SudhakaranPurdue University
Follow this and additional works at: https://docs.lib.purdue.edu/open_access_theses
Part of the Architecture Commons
This document has been made available through Purdue e-Pubs, a service of the Purdue University Libraries. Please contact [email protected] foradditional information.
Recommended CitationSudhakaran, Saurabh, "Potential energy savings and benefits to thermal comfort from the effective use of window blinds" (2016). OpenAccess Theses. 818.https://docs.lib.purdue.edu/open_access_theses/818

Graduate School Form30 Updated
PURDUE UNIVERSITYGRADUATE SCHOOL
Thesis/Dissertation Acceptance
This is to certify that the thesis/dissertation prepared
By
Entitled
For the degree of
Is approved by the final examining committee:
To the best of my knowledge and as understood by the student in the Thesis/Dissertation Agreement, Publication Delay, and Certification Disclaimer (Graduate School Form 32), this thesis/dissertation adheres to the provisions of Purdue University’s “Policy of Integrity in Research” and the use of copyright material.
Approved by Major Professor(s):
Approved by:Head of the Departmental Graduate Program Date
Saurabh Sudhakaran
POTENTIAL ENERGY SAVINGS AND BENEFITS TO THERMAL COMFORT FROM THE EFFECTIVE USE OFWINDOW BLINDS
Master of Science in Building Construction Management
Mark ShauretteChair
Hazar Dib
Travis Horton
Mark Shaurette
Randy Rapp 4/20/2016


POTENTIAL ENERGY SAVINGS AND BENEFITS TO THERMAL COMFORT
FROM THE EFFECTIVE USE OF WINDOW BLINDS
A Thesis
Submitted to the Faculty
of
Purdue University by
Saurabh Sudhakaran
In Partial Fulfillment of the
Requirements for the Degree
of
Master of Science in Building Construction Management
May 2016
Purdue University
West Lafayette, Indiana

2
ii
Page
TABLE OF CONTENTS
ABSTRACT .......................................................................................................................... 4
CHAPTER 1. INTRODUCTION ........................................................................................ 1
Statement of Purpose .............................................................................................. 1
Research Questions ................................................................................................ 3
Scope ...................................................................................................................... 3
Significance ............................................................................................................ 4
Assumptions ........................................................................................................... 6
Limitations ............................................................................................................. 6
Delimitations .......................................................................................................... 7
Definitions .............................................................................................................. 8
Summary ................................................................................................................ 9
CHAPTER 2. LITERATURE REVIEW ........................................................................... 10
Perception of Comfort .......................................................................................... 10
Development of controlled environments for physical comfort .......................... 11
Adaptive Controls ................................................................................................ 12
Venetian Blinds .................................................................................................... 16
Physical Properties ............................................................................................... 17
Optical Properties ................................................................................................. 18
Thermal Properties ............................................................................................... 19
Control Studies on Window Blinds ...................................................................... 21
Subjective Surveys ............................................................................................... 24
Stimulus for Adjusting Window Blinds ............................................................... 25
Gaps in the Literature ........................................................................................... 26
Summary .............................................................................................................. 29
CHAPTER 3. METHODOLOGY ..................................................................................... 30

iii
Page
Introduction .......................................................................................................... 30
Research Questions .............................................................................................. 31
Research Framework ............................................................................................ 31
Pilot Study ............................................................................................................ 32
Study Variables .................................................................................................... 33
Dependent Variables ............................................................................................ 33
Independent Variables .......................................................................................... 34
Data Recorded ...................................................................................................... 37
Time Lapse Photography ..................................................................................... 37
Survey................................................................................................................... 39
Procedure .............................................................................................................. 40
The Energy Model ................................................................................................ 40
Population and Sample ......................................................................................... 41
Summary .............................................................................................................. 41
CHAPTER 4. DATA ANALYSIS AND RESULTS ......................................................... 42
Data Collection ..................................................................................................... 42
Window Blind Positions and Usage Patterns ....................................................... 45
Occlusion and Slat Angle Values ......................................................................... 46
Sub-Sets ................................................................................................................ 48
Individual Window Blind Usage .......................................................................... 51
Statistical Analysis ............................................................................................... 55
Spearman Correlation Test ................................................................................... 56
The Survey Results............................................................................................... 60
The Energy Model ................................................................................................ 61
CHAPTER 5. DISCUSSION CONCLUSION AND RESULTS ....................................... 65
Discussion ............................................................................................................ 66
Conclusions from analysis of data ....................................................................... 68
Recommendations for Future Study ..................................................................... 69
LIST OF REFERENCES .................................................................................................... 71

4iv
ABSTRACT
Sudhakaran, Saurabh. M.S.,B.C.M. Purdue University, May 2016. Potential Energy
Savings and Benefits to Thermal Comfort from the Effective Usage of Venetian
Window Blinds. Major Professor: Mark Shaurette.
This research work involves the study of usage patterns of window blinds by the
occupants of a multi-story apartment buildings in Lafayette, IN. The goal of this study is
to understand the processes of enhancing comfort by changing window blind positioning
through various times of the day. To achieve this the researcher studied the actual
window blind usage pattern of the building under consideration. The researcher also
surveyed the occupants of the building to record comfort preferences and its effect on
window blind usage. The window pattern is simulated into an energy model and its
predicted energy consumption is compared with the predicted energy consumption under
optimum window blind usage to maximize energy savings. To conclude the study, the
researcher will quantify the energy that can be saved by proper positioning of window
blinds.

1
CHAPTER 1. INTRODUCTION
In this study the researcher talks about the need for a research in the area of
window blinds and comfort. Since there is a severe need for reduction of energy
consumption in buildings the researcher would be studying the window blinds and
how Venetian window blinds can help reduce energy consumption of buildings in
the U.S.
Statement of Purpose
EIA (U.S. Energy Information Administration) is an organization that has
collected and analyzes energy associated data for several decades. EIA’s 2014
annual energy review talks about the energy consumption for the year 2014 and the
energy consumption figures are shocking. EIA has broken down the total
consumption into four major sectors. These sectors are transportation, industrial
processes, commercial buildings and residential buildings. (Figure 1.1) shows
residential, and commercial buildings are responsible for consumption of almost
40% of all the energy produced in the US. (Figure 1.1) also indicates that overtime
there is a huge increase in the amount of energy that our buildings are using. This
increase in consumption of energy is massive and the numbers are quite disturbing

2
(Figure 1.2) shows a steady increase in the energy consumption during the winter
months. This is because of the increase in heating energy consumption.
Recent technological advances in the area of building energy performance
offers promising solutions to the problem of ever-increasing energy consumption of
buildings. Increasing the energy retaining capacity of the building envelope, use of
more efficient electrical equipment, and energy education are some of the obvious
solutions to this problem.
Figure 1.1 Consumption by End Use, Sector (Quadrillion Btu)
Figure 1.2 Consumption by End Use, Monthly (Quadrillion Btu)

3
Research Questions
What is the Venetian window blind usage pattern of occupants of a multi-
story residential apartment building in Lafayette, IN during the heating season?
What is the effect of façade orientation, cloud cover and exterior temperature
on window blind usage?
What are the possible energy savings from keeping the window blinds
completely open from 8AM to 5PM and completely closed during the heating
season, for a multi- family residential building?
Scope
For this research the researcher will study the effect of window blinds on the
heat loss and heat gain through windows in multi-story apartment buildings. The
research will analyze the effect of various positions of window blinds and the angle
of slats on energy gain or loss of buildings. The anticipated target of this research
project is to study the usage patterns of window blinds by the occupants of multi-
story apartment buildings and to develop recommendations that will reduce heating
or cooling requirement of these buildings hence reducing energy consumption.
Finally, the researcher will study the changes in the window blind usage pattern and
related energy and comfort benefits to the occupants after the recommendations are
made.
4
Significance
Reducing the energy consumption of buildings is of utmost importance. The
buildings in United States consume almost 40% of all the energy produced. Also the
annual increase in the energy consumption by buildings is massive and the numbers
are quite disturbing. There are several driving factors that contribute to this trend of
increase in energy consumption. Lack of awareness is one of the primary reasons
behind this increased energy consumption.
The requirement for reducing energy consumption in buildings is accentuated
by the increasing cost of energy in the United States and the detrimental effect of
greenhouse gas emissions during energy production. In the residential sector, the
cost of retail electricity has increased by a factor of 1.5 over the last 20 years. The
cost of energy prior to 20 years was even less. Based on these trends, it can be
predicted that the cost of energy will continue to increase. This increase in the cost
of energy is because of our dependence on fossil fuels for energy production. The
market forces of demand and supply are effecting the cost energy production.
Demand is increasing as populations grow and the supply of fossil fuels used as
energy sources are finite (U.S. Energy Information Administration, 2011a). Because
40% of US energy consumption is invested in the operation of buildings, large
savings in energy use and greenhouse gas emissions can be realized through
implementing building efficiency measures (Wierzba, Morgenstern, Meyer,
Ruggles, & Himmelreich, 2011). There is significant development in building
technology, application of these technologies can reduce the energy consumption of

5
new and upcoming buildings. However, discontinuing the use of existing buildings
in order to reduce energy consumption is not a practical alternative. On the other
hand, upgrading the energy performance of existing buildings is a practical
technique to decrease their energy consumption.
The building envelop is responsible for maintaining a comfortable
atmosphere within a building. Even though windows are an essential part of any
building, they act as cavity in the overall building envelope. There are several
researchers that identify windows as the crucial source of heat loss and heat gain in
buildings. The removal and sealing of window in order to increase energy
performance is a theoretical but not a practical solution. Windows can be used for
ventilative cooling of the building structure and, also help in the attainment of
comfort (Brager, Paliaga and de Dear, 2004). Some other advantages associated with
windows are increase in productivity of occupants and serving as a source of natural
light (Leaman and Bordass, 1994).
Researchers of energy efficient buildings have come up with several critical
techniques that will assist in the reduction of unwanted heat loss and heat gain
through windows. By some estimates the combined heating, cooling and lighting
energy can be reduced by over 30% by employing an optimal controller for shading
systems (Lee, DiBartolomeo, & Selkowitz, 1998; Tzempelikos & Athienitis, 2007).
However, the reality of the situation is different. In the real-world, the conditions in
which the windows operate are not always ideal. What make matters worse is that
there are numerous extraneous human factors that affect the overall energy

6
efficiency of the windows. These human factors have an unfavorable influence on
the energy efficiency of the windows and building operations.
Assumptions
Assumptions are items that researcher is not able to verify or monitor due to
time and other constraints:
The researcher is not able to collect data on the inside temperatures and the
artificial lighting arrangements of the apartment units
All the window blinds installed in all the apartment units under consideration
are similar
All the windows are perfectly air sealed
The size and shape of all the windows under consideration are similar
The glass installed in all the windows is double paneled
The angle at which sunlight hits the apartment building is constant throughout
the week when the blind usage data is being collected
Residents of the apartment units are same throughout the time period when
the data is being collected
Limitations
As will be seen in the literature review, there are several factors that impact
the control pattern of window blinds. These factors include:
Interaction of heat, light, and ventilation between interior and exterior

7
environment
Regulation of view and privacy, and the individual aesthetic preferences
Individual preferences of lighting and temperature
Ability of an individual to adapt to a change in the physical environment
Occupants of different age and gender have different preferences
Contextual factors such as orientation of seating, orientation of the façade
under consideration, lighting requirement of the task being performed by the
occupants
It is not possible to examine all factors at once. From the literature review, the
most promising variables are mainly related to the visual and thermal environment.
Therefore, this study focuses on just the transfer of heat and light to and from
the apartment units under consideration.
Delimitations
The purpose of delimitations presented in this research is to narrow the scope
and identify items that were not analyzed:
Since this study focuses on a residential setting, the researcher will not
include any data on window blind usage pattern by occupants in a
commercial, industrial or institutional buildings
The research will not include study of window blinds in individual detached
housing

8
The research focuses on traditional venetian blinds and does not include any
data on other types of window blinds
The researcher will not include the effect of objects with high thermal mass
inside the apartment on the comfort of occupants
For this study the researcher will be neglecting the temperature differential
between different apartment within the building
The researched will not model the effect of angle of slat of window blinds.
Definitions
The purpose of providing definitions was to educate the audience regarding
certain terms used in this research that may not be part of a normal lexicon.
Definitions used in this research included:
ASHRAE – American Society of Heating, Refrigerating, and Air-
Conditioning Engineers (ASHRAE, 2010)
building envelope – exterior walls and roof of a building; all parts of a
building through which air can pass to the outdoors (Gadgil, Price, Shehabi, &
Chan, 2006)
CFM – cubic feet per minute
conditioned space – the part of a building that is capable of being thermally
conditioned for the comfort of occupants (ASHRAE, 2010)
HVAC system – heating, ventilating, and air conditioning system (Gadgil,
Price, Shehabi,

9
& Chan, 2006)
infiltration – uncontrolled inward leakage of air through cracks and
interstices in any building element and around windows and doors of a building
(ASHRAE, 2010)
natural ventilation – ventilation occurring as a result of only natural forces,
such as wind pressure or differences in air density, through intentional openings
such as open windows and doors (ASHRAE, 2010)
ventilation – process of supplying outdoor air to or removing indoor air from
a dwelling by natural or mechanical means (ASHRAE, 2010)
slat – a thin, narrow piece of wood, plastic, or metal, especially one of a
series that overlap or fit into each other, as in a fence or a venetian blind
Summary
This chapter outlines the statement of purpose of the study. It also talks about
the scope, significance and research question. The assumptions, limitations and
delimitations identified by the researcher arte also mentioned in this chapter. In the
end this chapter provides definitions in order to educate audience regarding certain
terms.
10
CHAPTER 2. LITERATURE REVIEW
Window blinds have been used to cover windows for several years. In
addition to their intended use of controlling visibility, the window blind serves
several purposes.
Window blinds are available in different shapes, materials and types. They
can be located inside, outside or within the building envelope.
Perception of Comfort
Previous studies have identified that the productivity of the occupants of any
building is largely dependent on how comfortable the indoor environment is. This
makes comfort or discomfort of the occupants a major concern when designing an
interior environment. It is logical to say that the interior environment should be
designed in order to achieve maximum productivity of its occupants while
moderating the energy requirements of the building. But, the question “what is
comfort?” does not have one correct answer. Comfort can be defined in more than
one way. While all the major definitions of comfort are precise, it is almost
impossible to generalize the single- dimensional concept of comfort for every built
environment. Using an onion with overlapping layers as a metaphor, the notion of
comfort can be seen as evolving through time in which new meanings, shaped by

11
culture, add additional layers to the previous ones (Rybczynski, 1986).
Development of controlled environments for physical comfort
Studies on human comfort and improvement of interior environment have led
to the development of interior environment control systems. These control systems
have several advantages they tend to improve the comfort levels of the occupants of
the buildings and at the same time they are effective in reducing the energy
consumed in maintaining such environments. In the eighteenth and the nineteenth
century prior to the development of mechanical systems, the interior environments
were maintained passively by elements of the building envelope. Industrial
development in the past centuries has brought along electricity. This is the major
reason behind the development of other systems such as electric lighting, air
conditioning and mechanical ventilation systems. Heating/cooling devices freed
architects from the constraints of climate and the restriction of passive methods
(Baird, 2001).
Olgyay (1963) worked towards understanding the relationship between
“climatology” and “biology”. He concluded that the relation between these factors
was intermediated by the mutual processes of “architecture” and the new element
“technology”. Figure 1 illustrates Olgyay’s model of environmental processes.

12
Figure 2.1 Model of environmental processes (Olgay, 1963).
Today, almost all the buildings constructed in the United States make use of
active interior environment control systems. The occupants of these buildings
heavily rely on numerous electrical and mechanical systems such as lighting, air-
conditioning, heating and ventilation to retain an optimal indoor environment. As a
result of advancements in control and automation of interior environment control,
occupants of most of the buildings in United States are capable of fine tuning their
immediate environment. Window blinds are one such system that can be found on
most of the commercial, institutional and residential buildings.
Adaptive Controls
The general perception of indoor comfort is always related to physical factors
of the built environment. Most people consider physical factors such as lighting,
heating, ventilation, air quality etc. to be the only aspects that govern the perception

13
of comfort. Using thermal comfort as an example, the American Society of Heating,
Refrigerating, and Air-Conditioning Engineers (ASHRAE) defines comfort as the
condition of mind that expresses satisfaction with the thermal environment
(ASHRAE, 1992). This definition of comfort, however, does not convey the
complexity of comfort and all of its contextual and cultural influences (Brager & De
Dear, 2003).
Building science researchers are increasingly researching on adaptive
building controls, especially in the areas of thermal comfort and illumination
control. This trend has led to the development of several automatic indoor climate
control systems. The algorithms of some of these contemporary adaptive controls
are not only based on the indoor climate but also the expectation and usage patterns.
In the automation of interior window shading devices, a control system that relies on
a prediction of environmental conditions and a building’s thermal response can
provide savings to space-conditioning loads beyond what can be achieved using a
reactive approach (Huchuk et al., 2015).
Review of window blind usage literature suggests that a window blind acts
like a system that the building occupants interact with in order to attain a more
comfortable indoor environment. Therefore, in this research, the researcher will
study the window blind usage pattern of occupants of residential buildings. This will
be followed by a subjective survey that will ask participants about the stimulus that
leads to the act of change of blind position. Finally, a building energy simulation
will be used to compare the actual energy consumption of a residential apartment

14
building with the reduced energy consumption as a result of optimal window blind
usage. There is very limited research on window blind usage pattern of residential
buildings in order to develop a relation between the window blind usage patterns
and the perception of comfort.
The review of literature has helped in the identification of comfort as a
complex sensation. There are several identified and unidentified factors that
stimulate the perception of comfort. Inkarojrit’s 2005 study of window blinds has
acknowledged that occupant comfort within a built environment is effected by
several factors other than the physical elements of the building. Growing evidence
shows that there is an association between perceived productivity and factors such as
comfort, health, and satisfaction of staff in office organizations (Leaman & Bordass,
1999). Comfort is a complex perception that reflects the interaction between
objective stimuli and cognitive/emotional processes in which the general perception
of comfort is a result of the overall comfort appraisal through human senses
(Elzeyadi, 2002). Figure 2.2 shows an example model of this complex interactions.
Figure 2.1 The relationship of environmental parameters of indoor comfort
(Elzeyadi, 2002)

15
Unfortunately, previous studies in the area of the window blind usage and
comfort like Rea’s, 1984 study Window blind occlusion: a pilot study, Reinhart’s,
2001 Daylight availability and manual lighting control in office buildings:
Simulation studies and analysis of measurement and Rubin, et al’s 1978 study
Window blinds as a potential energy saver - A case study are mostly one-
dimensional. Even though the researchers have identified that the window blind
usage depends on several factors, the studies are usually focused on a one sub-
system (i.e., visual comfort or thermal comfort). These studies have successfully
established that in indoor environment is effected by various attributes of having a
window. The presence of a window effects the indoor air temperature, radiant
temperature, quality of view, may add outdoor noise and a sense of spatial comfort
by letting the occupant being connected by the outdoor environment. It is the
researcher’s opinion that all the above mentioned factors that were established by
these one-dimensional studies may have either constructive or destructive effect on
the comfort of the occupants. These previous studies have also established that
change in some of the parameters related to window or window blinds may result in
a weighty reduction on the energy consumed for maintaining comfortable
temperatures inside of the building, but fail to study the effect of these changes on
comfort of the occupant. There are limited studies that have attempted a cross-
examination of data from two or more sub-systems of comfort within the built
environment.

16
Venetian Blinds
Most windows in commercial buildings have some type of internal shading to
give varying degrees of sun control and to provide privacy and aesthetic effects
(ASHRAE, 1997; Littlefair, 1999; Ozisik & Schutrum, 1960). Window attachments
represent a wide range of products that are commonly attached to windows in a
house as an “add-on” device. The most common and widely used types of
attachments are window coverings and fashions that are typically used to control
glare, to provide privacy, and for aesthetic purposes (Curcija et al., 2013). In a study
conducted by Bader, 2011 it was established that in the United States, overhangs are
the most common type of external shading devises and Venetian blinds have evolved
to be the most common form of internal shading devices for windows. The
availability of window blinds in a wide range of materials, colors and patterns, along
with its ease of installation and usage, make it the most preferred interior shading
systems. Also, due to their low cost compared to other types of interior shading
devices, manually controlled Venetian blinds are perhaps the most common type of
interior shading devices in contemporary office buildings (Inkarojrit, 2005). The
Venetian blinds have two degrees of motion. They can be closed, opened or adjusted
such that a part of the window is open and the rest is covered. Also, the slats in the
Venetian blinds can be adjusted (i.e., they can be rotated in their axis), which allows
the occupants to further customize the occlusion from the system. When the
occupants of a building want an outside view, they can bring the window blind to a

17
fully open position. Just like a fabric roller in this position there is absolutely no
occlusion caused by the system. But the advantage of using a Venetian blind is that
when the window blind is in a completely or partially closed position, the occlusion
can be controlled by adjusting the angle of the slats. The use of fabric rollers, or
other internal shading systems does not provide the occupants with so much
flexibility over the control of the shading system.
If properly used, the Venetian blinds are capable of blocking the entry of
sunlight and reflecting the direct solar radiation towards the ceiling, hence providing
a glare free illumination and an outside view all at the same time. Utilization of
daylight in buildings may result in significant savings in electricity consumption for
lighting while creating a higher quality indoor environment. The benefits of using
natural light within office buildings results in higher productivity and reduced
absenteeism of office workers and may result in considerable energy savings
(Athienitis & Tzempelikos, 2002).
Physical Properties
In order to understand the energy savings from the use of the window blind
system, it is crucial to understand its performance in the regulation of thermal
radiation and visible light.

18
Optical Properties
A dynamic building envelope increases the quality of built environment in
commercial, residential and institutional buildings. Innovative daylighting systems
aim to increase daylight levels and improve the daylight uniformity within a space,
while controlling sunlight and reducing glare and discomfort for the occupants
(Lorenz, 2000). Energy usage for interior illumination of a building can be
significantly reduced if both the lighting system and the conventional components of
building envelope are used simultaneously (Athienitis & Tzempelikos, 2002).
There are several advantages of using natural light for illumination, but it is
also very important to control the glare and contrast caused by direct sunlight.
Achieving visual comfort refers primarily to the elimination of visual discomfort
(Boyce, 2014). The phenomenon of glare is one of the primary causes of visual
discomfort. After several decades of continuous research on this topic, researchers
have identified four factors that cause the perception of discomfort or glare:
Luminance of the glare source, size of the glare source, position of the source in
the field of view and luminance of the background (DiLaura, Houser, Mistrick, &
Steffy, 2010).
Venetian window blinds can be multi-purpose. They can effectively block
the direct solar radiation thus reducing the solar gains in the cooling season. They
can be used to maximize daylighting and heat gain during the heating season.
Positive angle of slats (slats point upwards) can allow the deflection of maximum

19
amount of sunlight towards the ceiling, which diffuses it and reduces the glare. Also,
on an overcast day, they are capable of letting in most of the daylight available
through windows.
In order to keep the window blind system performing at its maximum
efficiency, the position of the window blinds and the angle of the slats have to be
constantly adjusted throughout the day. If the position of blinds and angle of slats are
not adjusted to adapt to the external lighting conditions, the shading system can
cause constant disruption of visual comfort. Optimum performance from the system
requires constant manual control.
Thermal Properties
In order to calculate the building energy performance, architects, engineers
and designers make use of the tables provided in the ASHRAE Handbook of
Fundamentals (ASHRAE, 1997). The Solar Heat Gain Coefficient (SHGC)
describes the solar heat blocking capacity of any material (its value is between 0 and
1). This fractional number represents the percentage of solar radiation that entered
the window. It should be noted that the SHGC for Venetian blinds are listed in the
ASHRAE tables; the values were limited to only one blind type and a few blind slat
angles as shown in table 2.1.

20
Table 2.1 SHGC for window blinds
Blind
Positio
n/Color
Solar
Reflect
Solar
Absorb
.
Solar
Trans.
Summer
(Default)
Solar
Trans.
Winter
Optical
Trans.
Diffuse
(Cloudy)
Optical
Trans.
(Sunny)
Stephenson
(1964) +
0 - - - - 0.3 -
22.5 - - - - 0.14 -
45 - - - - 0.08 -
ASHRAE
(1997)++
Light 0.55 0.40 (0.05) - - -
Mediu
m
0.35 0.60 (0.05) - - -
Littlefair
(1999)*
Shut - - 0.57 0.58 0.03 -
Open - - - - 0.32 -
Athienitis
(2002)**
-60 - - - - (0.14) 0.1
-30 - - - - (0.38) 0,35
-15 - - - - (0.33) 0.48
-0 - - - - (0.25) 0.42
-30 - - - - (0.11) 0.15
60 - - - - (0.03) 0.03
+ A typical lighted-color Venetian blind
++ Ratio of slat width to slat spacing 1.2, slay angle 45, normal incidence
* Venetian blind
** 35mm wide mid-plane highly reflective Venetian blind between double glazed low-E
coating.
For a more complex building energy performance calculation, previous
research (Lee & Selkowitz, 1995) used the thermal performance derived from a
mathematical model created for a between-pane louver system with diffused blind

21
surface reflectance. Alternatively, one may consider using the interpolation of blind
properties based on small sets of characteristic SHGCs that was proposed by Klems
and Warner (1997).
Control Studies on Window Blinds
Researchers in the past have collected and studied data on the window blind
usage patterns. The method of collection of data has been simple observation,
photography and video recordings. The studies have successfully identified patterns
of blind usage between window orientation, position of sun in the sky and condition
of sky. The researchers have come up with simple predictors that have been used to
accurately develop rules for window blind automation.
Inkarojrit (2005) observed that the blind positions are the result of actions of
the office occupants. The occupants come to a conclusion about the optimum
window blind position after analyzing all the positive and negative stimulus of
natural illumination. Once the window blind is brought to this position, no more
changes are done to its position or angles.
Rea (1984) studied the occupant blind behavior on three facades of a 16-story
office building in Ottawa, Canada. He studied the patterns and interaction of external
factors such as orientation of façade, angle of solar radiation, sky conditions on the
window blind usage pattern. Just like Rubin, Collins and Tibbott (1978), Rea took
photographs that were analyzed for collection of data on window blind usage
patterns of the three building façade. These photographs were taken at three times

22
during a day, first at 9:30 then at 12:00 and finally at 14:00. These photos were
taken on one cloudy day and a clear day in April and May, 1982. A total of 3,330
windows were observed for their blind position. The angle of slats was not
considered in this study. The proportion of the window opening covered by blinds
was given a value from 0-10 for the purpose of the study.
Inoue, Kawase, Ibamoto, Takakusa, and Matsuo (1988) studied window
blind usage, analyzed photographs of four buildings in Tokyo, Japan. They also
collected the direct and diffused values of solar radiation for the purpose of their
study. Inoue et al. identified that the change in the rate of blind operation was
dependent on the orientation of the buildings and weather conditions. They also
reported that the pattern of control of the window blind was particularly crucial in
the determining the rate of blind modifications. On the eastern façade, the window
blinds were closed by the occupants on their entry into the office, but gradually
through the day, these blinds were opened fully or partially to allow the entry of
natural light, as there was no incident direct sunlight. On the west façade the window
blinds were completely opened during the morning times when there was no direct
solar radiation, but during the afternoon as the amount and intensity of radiation
increased these blinds were closed gradually. They also reported that in both the
above mentioned conditions the position of the blinds were not changed throughout
an overcast day, when the values of solar radiation were low.
Foster and Oreszczyn (2001) recorded a video capturing the window blind
movement of three offices in London, England. In this study, the average sunshine

23
index and the average occlusion index were plotted for regression analysis. The
occlusion index included the angle of the slats of the window blinds. The positions
of each window blind was given a value that ranged from zero to five, zero being
fully open and five being fully closed. The angle of slats were also give a value,
which ranged from one to three, one being horizontal, two represented everything
between horizontal and three being vertical. To obtain the proportion of occlusion,
both the values were divided by their maximum.
The occlusion index was obtained by multiplying blind position values with
the respective slat angle values. The sunshine index was obtained by multiplication
of the factor for weather. These factors were one for overcast, two for slightly
cloudy and three for sunny. Also, a time code was added to the study, which was
one for early morning or late afternoon, two for midafternoon and three for midday.
Foster and Oreszczyn (2001) reported that there was a very small influence of
solar availability on the window blind usage pattern. Hence, there is a very weak
relation between the occlusion index and degree of sunshine. However, they found
that the orientation of the façade had huge influence on the blind usage pattern.
Facades that had south orientation had the highest occlusion value. The study also
reported that the western façade had lower occlusion value than the northern façade.
The authors acknowledged that the proximity of the northern façade of the building
under consideration to another building may have caused privacy issues, which
resulted in higher occlusion values of this façade.
A prominent function of any shading device is to cut off the direct solar heat

24
entering the building in warm or hot weather. Raja, Nicol, McCartney, and
Humphreys (2001) found that the usage of shading devices was proportional to
indoor temperature. They reported that there was an increase in the blind use pattern
whenever there was an increase in indoor temperature, outdoor air temperature, and
thermal comfort sensation vote. They acknowledged that the increase of window
blind usage was prominent but the rate of change was small. Raja et al. speculated
that this change in the rate of blind usage might have been because of glare caused
by direct solar radiation.
To summarize, all the previously conducted studies point out that the primary
usage of window blind by occupants of office buildings was to regulate the
penetration of direct sunlight into workspace. The studies show that reduction of
glare was the major driving factor behind the window blind usage behavior. Heat
gain was a relatively less evident factor in modification of window blind control
pattern. Similarly, orientation of façade played an important role in determining the
occlusion of the shading system. It was noted that, in general the occlusion values on
the northern façades were lower than the occlusion values on the southern façades.
Subjective Surveys
After conducting the literature review the researcher has identified that not
many surveys and interviews study the subjective reasons for window blind control
have been conducted. A subjective survey is important because it allows the
researcher to understand the stimulus that causes the occupants to change the
position of blinds.

25
For their study of automated blinds, Inoue et al. (1988) conducted 336
questionnaire asking “how do you control your nearest blind?” They reported that 60-
70% of the population did not alter the position of the blind as long as possible if it
was open. Only 20- 30 of the sample was found to adjust the blind position to adjust
to the changes in external factors. Furthermore, they reported that the awareness
among the population of the use of window blinds in modification natural
illumination was 90 %, but the awareness of its effect on the thermal environment
accounted for 50-80%. Eighty percent of the sample preferred a location near
windows as it offered better illumination. Between70% and 80% were inclined
towards being closer to windows because of views, and 50% - 60% because of the
visual range. Inoue et al. concluded that the stimulus for changing the occlusion of
window blinds are the negative factors. These are the factors that were identified
near most of the window seats. The major negative factors reported by them were
heat and glare caused by direct solar radiation.
Stimulus for Adjusting Window Blinds
There are many other physical, physiological, psychological, and social
factors that influence window blind control behavior. Inkarojrit (2005) identified
several independent variables that directly influenced the frequency of the window
blind adjustment. These variables were identified as visual comfort, luminance
ratios, thermal comfort, interior luminance, vertical solar radiation at the window
and subjective factors. He identified, direct solar penetration, orientation of façade,

26
sky condition, age and gender of occupants as the major confounding factors that
affects the window blind usage pattern. For occupant productivity luminance ratios
are used in most lighting standards, the "1:3:10" is one of the commonly used
luminance ratios. The principle is based on the idea that the luminance in the visual
field of someone who's doing a static task, must remain in reasonable ratios in order
to prevent glaring situations caused by a heavy contrast, hence impairing visual
performances. The recommended luminance ratios are:
3:1 or 1:3 between paper and computer/laptop screen,
3:1 or 1:3 between the visual task (paper or screen) and the adjacent surfaces,
10:1 or 1:10 between the visual task and the non-adjacent surfaces.
The adjacent and non-adjacent surfaces can be delimited by two cones of 60
and 120 degrees respectively. It has been found that a strong correlation exists
between the preferred luminance ratios and the visual interest of a scene [Loe, 1994]
Gaps in the Literature
The review of literature has helped in identification of several gaps in the
research conducted on window blind control:
1. Previous research identifies the significant effect of physical factors, such as
visual and thermal comfort on the control patterns of window blinds (Lindsay &
Littlefair, 1993; Newsham, 1994; Rea, 1984; Reinhart, 2001; Rubin et al., 1978).
The review of literature shows that, in addition to these physical factors, social
factors, physiological factors and psychological factors are also responsible for

27
altering the general perception of comfort, eventually effecting the window blind
control. The effect of one or a combination of these factors on window blind
control is not fully understood. Therefore, in order to entirely understand the
effect of these factors on window blind control, a qualitative study of the window
blind usage patterns has to be conducted alongside subjective surveys that studies
cause and effect of these factors.
2. The previous studies on window blind usage patterns do not have conclusions.
The studies are focused on a single façade of buildings. There is no research that
examines all the façade orientations in a single study. This makes it difficult to
quantify the heat gained or heat lost by the building through fenestrations.
3. Even though several researchers have acknowledged the effects that the angle of
slats have on the occlusion of window blinds, the studies conducted in the past
have either ignored the angle of slats completely, or identified them as closed or
open for the sake of convenience. Different window blind slat angles can
drastically increase or decrease workplace illuminance for workspaces near the
window opening (Christoffersen, 1995).
4. Several previous studies have used visual examination to record the window blind
usage pattern. In recent studies, researchers have made use of high resolution
photographs, and videos to collect data. In both these cases the angle of
observation makes it difficult to accurately determine the position of slats in the
window blind. Furthermore, the angles of the blind slats are usually ignored
because of the different relative camera angles on different floors of tall buildings

28
(Rea, 1984). In order to accurately determine the angle of slats and the position of
window blind, studies have yet to come up with a more reliable method of
measurement.
5. All the previous research on window blind control has commercial, educational
and institutional buildings as a sample; no study on the window blind usage
pattern of residential buildings has been conducted.
6. Only few window blind control models were based on actual field studies. The
studies have made use of models that have been constructed theoretically. While
these models moderate the variables, their application to real life settings are
limited.
7. Studies on the window blind usage pattern, perception of comfort and productivity
in workspace are conducted to support the development of automated shading
systems which will reduce the energy consumption of buildings without decreasing
the quality of indoor environment, comfort, and productivity of occupants. There
is a need for research on automated external blinds or shading systems, as these
have a tremendous potential for reducing heat gain in warmer climates. These
external systems can work either independently or in combination with the
automated interior blinds. Further research is needed about the potential energy
and peak demand reductions from external automated blinds (Wymelenberg,
2012).
8. The quality of view is a confounding variable in the study of the window blind
usage patterns. There are no known techniques for quantifying the outside view

29
quality from a window. Development of a view quality rating system would
support researchers since there is a correlation between the window blind usage
and the quality of view from the window.
Summary
This chapter outlines research studies in the field of venetian blinds and
provides context and background details associated with this paper. It also uses the
evidence from scholarly reviews and field data to support the methodology of this
paper. Several key topics are identified as being relevant to this research. These
topics include: residential building energy consumption trend, perception of
comfort, window blind usage patterns and adaptive settings for window blinds.

30
CHAPTER 3. METHODOLOGY
Introduction
Traditionally, human comfort studies within a built environment focus on
only one domain of the physical environment: the lighting domain or the thermal
domain. The literature review establishes that window blind control behaviors are
influenced by many factors, including physical, physiological, psychological and
social variables. A variety of methods have been used by researchers to collect data
about the physical environment, and the window blind usage pattern in the past.
Photography, video recording and sensors attached to the window blinds are all
techniques that have been used successfully by, Foster and Oreszczyn (2001) and
Rea (1988) to record the changes made to window blinds. Inoue et al. (1984) and
Inkarojrit (2005) used interviews of occupants of buildings to understand their
window blind usage patterns and preferences. In order to assess the performance of
Venetian window blinds in a residential setting, the researcher will integrate the
physical environment data (window blind usage) with subjective opinion on
window blind usage and preferences. This will project a better picture of Venetian
window blind usage and their effect on occupant comfort.

31
This chapter can be broken into three sections, the first section describes
the process used to conduct investigation, the study variables, equipment used and
the process of collection of window blind usage data. The second section describes
how occupants of the building would be interviewed. The last section covers all the
data analysis techniques used in the study.
Research Questions
What is the Venetian window blind usage pattern of occupants of a multi-
story residential apartment building in Lafayette, IN during the heating season?
What is the effect of façade orientation, cloud cover and exterior
temperature on window blind usage?
What are the possible energy savings from keeping the window blinds
completely open between 8AM to 5PM and completely closed every time else
during heating season(12/21-3/20), completely closed all the time during summer
season (6/21 – 9/20) and 50 percent open between 8AM and 5PM and completely
closed every other time during fall and spring season?
Research Framework
The principle research in this project is aimed at collecting and analyzing
the window blind usage patterns of occupants living in a residential apartment
building in Lafayette, IN. The rate of change of window blind position primarily
depends on occupant’s comfort preferences, interior & exterior temperature but

32
lighting or glare is reported to be the major reason behind changes made to the
window blind position. There are several models that predict visual discomfort,
like American Visual Comfort Probability (The Illuminating Engineering Society
of North America, 2000), and the Unified Glare Rating (Eindhorn, 1969, 1979,
1998; CIE, 1995). These models have presented glare as the primary reason for
visual discomfort. Hence it is important to design a research method which can
integrate personal preferences and exterior conditions with actual window blind
occlusion data to answer the research questions.
To begin the study, the researcher will take high resolution photographs of
all the four façades of the residential building to study the rate of change in the
window blind position. After calculating the usage pattern the occupants of the
building who are willing to participate in this study will be interviewed for
subjective responses.
Pilot Study
Prior to the main experiment a pilot study was conducted in which
photographs of all four façades of the multi-story building were captured at an
interval of 2 hours starting 7AM ending 3PM on 12/05/2015. These photographs
helped in validation of research methods as the researcher was able to identify the
position of window blinds and the angle of slats. These photographs also helped in
testing of the preliminary research hypothesis- “What is the effect of cloud cover
on window blind occlusion?” The pilot study also helped the researcher understand

33
the frequency of changes made to window blinds and occlusion values between
façade orientations.
Study Variables
Table 3.1 provides a list of all the variables that the study will measure. The
dependent variables in the study are related to window blind movements and the
independent variables are selected based on their effect on thermal or visual
comfort. In this study, the independent variables are classified into three types,
stimulus factors, personal preferences and confounding factors. Stimulus factors
are the variables that cause a direct sensation of discomfort to the occupant that
results in the event of closure of window blinds. Confounding variables on the other
hand are factors that affect both dependent and independent variables but may or
may not be the reason behind the changes made to the position of window blinds.
Dependent Variables
Changes made to the position of window blinds is the primary variable
analyzed by this study. This change is identified as a dependent variable since it is
caused by the occupant’s response to the independent variables. This study defines
three dependent variables 1. A change made to the position of the Venetian
window blind itself. 2. A change made to the position of angle of slats of window
blinds. 3. The frequency with which changes are made to the system of window
blinds.
The researcher will collect data in the form of photographs of all the four
34
facades of the building under consideration and the changes to the position of
window blind will be analyzed in steps of 0 to 10 (0 = completely open, 10 =
completely closed). High resolution images enable the researcher to detect the
angle of slats of the window blinds. These images provide the researcher,
opportunity to categorize the angle of slats in blinds into three categories 1) facing
up 2) horizontal and 3) Facing down. For the purpose of this study the angle of
slats have been distinctly classified as completely open (horizontal) and closed
(facing down or facing up). The frequency with which changes are made to the
system of window blinds is the third dependent variable identified by the study.
For the purpose of this study this variable has been identified into 4 distinct sets, 1)
More than once a day, 2) once every day, 3) more than once but less than seven
times every week 4) less than once every week.
Independent Variables
Independent variables in this study are the factors that cause the dependent
variables. These variables have been identified by previous researchers as the
factors that cause the occupants to make changes to the position of window blinds
and the angle of slats. For the purpose of this study the independent factors have
been categorized into four types, 1) solar radiation 2) external thermal conditions
3) subjective opinion and 4) confounding factors.
Previous research conducted by Inkarojrit, Inoue et al and Rea in the area
of window blind usage have established several visual and thermal stimulus that

35
effect the rate of usage of window blinds. Some prominent visual stimuli are
average window luminance, background luminance, daylight glare index,
maximum window luminance, luminance ratio’s, vertical solar radiation at
window, etc. Similarly some thermal stimuli that effect window blind usage which
have been established by previous studies are air temperature, mean radiant
temperature, relative humidity, predicted mean vote, predicted percentage
dissatisfied etc. This study will be focusing on stimuli that the researcher can
measure with available equipment. Table 3.1 provides a list of all the variables,
measured by the study.

36
Table 3.1. List of variables in the study
Type of variables List
Dependent variables
1. Window blind position change
2. Slat angle change
3. Frequency of window blind/slat adjustment
Independent variables 1. Solar Radiation (stimulus factors)
1.1. Cloud cover
2. Exterior Thermal Condition (stimulus factors)
2.1. Air temperature
3. Subjective opinion
3.1. Brightness Preference
3.2. Thermal Preference
3.3. Self-reported sensitivity to brightness
3.4. Self-reported sensitivity to temperature
4. Confounding factors
4.1. Privacy
4.2. Direct solar penetration
4.3. Façade Orientation
4.4. Sky condition
4.5. Age
4.6. Gender
Subjective opinion, as mentioned in Table 3.1 is an independent variable
that will not remain constant for all occupants participating in this study. This
study aims to analyze how occupant comfort is effected by window blind usage.
Hence it is important to account for personal preferences for occupant’s comfort in
the study. To achieve this the researcher will be conducting interviews with
occupants of the building under consideration to record subjective opinion of
occupant comfort.

37
In a residential setting the occupants of apartment can control interior air
temperatures and lighting levels which is used for modifying the interior
environment. In a preliminary survey conducted, it was observed that the interior
temperatures, relative humidity, lighting levels (brightness) and window blind
occlusion levels in various apartment units were different. That these
dissimilarities in the interior environments are a result of occupant preferences,
lack of awareness about energy efficient task lighting and comfortable
temperature/humidity levels as defined by ASHRAE. To study the effect of
personal preferences on the rate of change of window blind position the occupant’s
will be interviewed, their personal preferences and opinion on interior comfort will
be recorded in the survey. These subjective responses collected during the
interview will be later compared with actual window blind usage data and
observations will be presented.
Data Recorded
This section explains in detail all the form of data that will be recorded by
researcher in the course of this study.
Time Lapse Photography
During the pilot study period, window blind movements were monitored
from outside the building through photography. Pictures were manually taken with
a digital camera to study the percentage occlusion of window blinds. The angle of
38
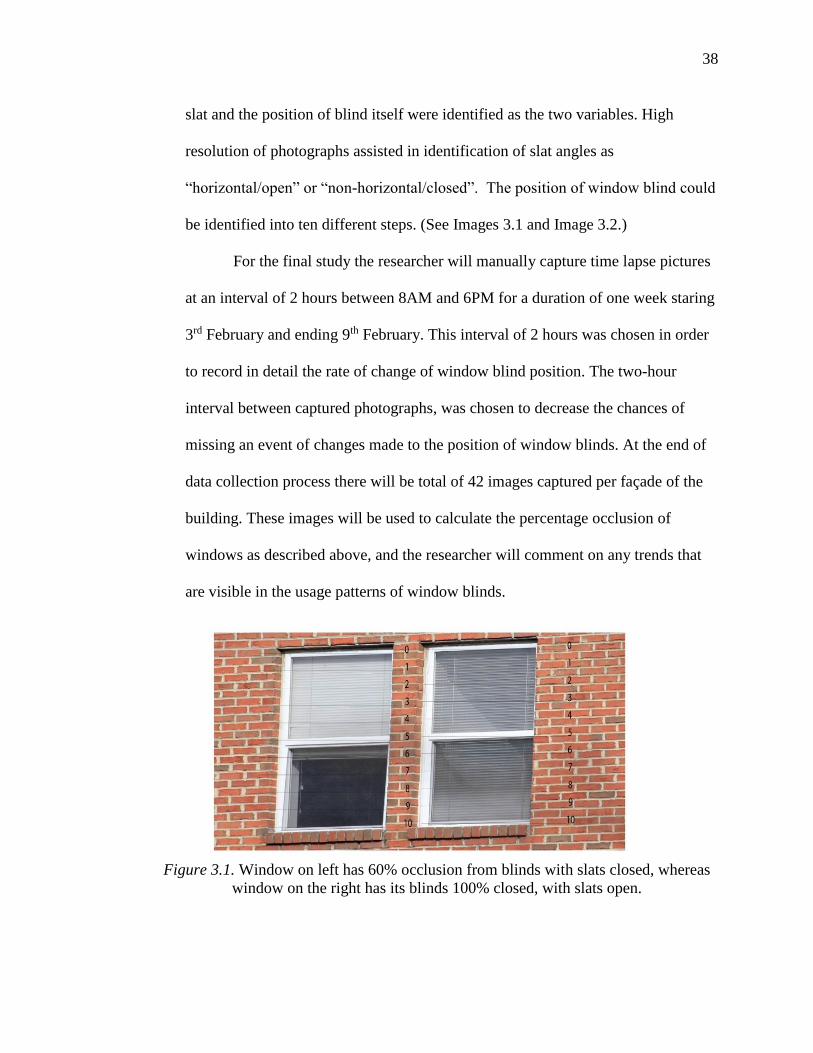
slat and the position of blind itself were identified as the two variables. High
resolution of photographs assisted in identification of slat angles as
“horizontal/open” or “non-horizontal/closed”. The position of window blind could
be identified into ten different steps. (See Images 3.1 and Image 3.2.)
For the final study the researcher will manually capture time lapse pictures
at an interval of 2 hours between 8AM and 6PM for a duration of one week staring
3rd February and ending 9th February. This interval of 2 hours was chosen in order
to record in detail the rate of change of window blind position. The two-hour
interval between captured photographs, was chosen to decrease the chances of
missing an event of changes made to the position of window blinds. At the end of
data collection process there will be total of 42 images captured per façade of the
building. These images will be used to calculate the percentage occlusion of
windows as described above, and the researcher will comment on any trends that
are visible in the usage patterns of window blinds.
Figure 3.1. Window on left has 60% occlusion from blinds with slats closed, whereas
window on the right has its blinds 100% closed, with slats open.

39
Figure 3.2. Left side window has 100% occlusion whereas window on the right has
20% occlusion.
Survey
The survey will ask participants to rate their satisfaction with the
environmental quality of their residence. Majority of the questions will be
multiple-choice, with a few open-ended questions. The questions will be divided
into three major sections. 1) Background Information: This section will measure
characteristics of participant’s apartment such as occupancy of apartment (number
of people), orientation of windows, type of internal shading device used, etc. 2)
Window Blind Usage: This section will measure the frequency of window blind
usage and the reasons for operating window blinds. 3) Personal Preference: This
section will enquire about personal preferences and sensitivity to temperature and
brightness.
40
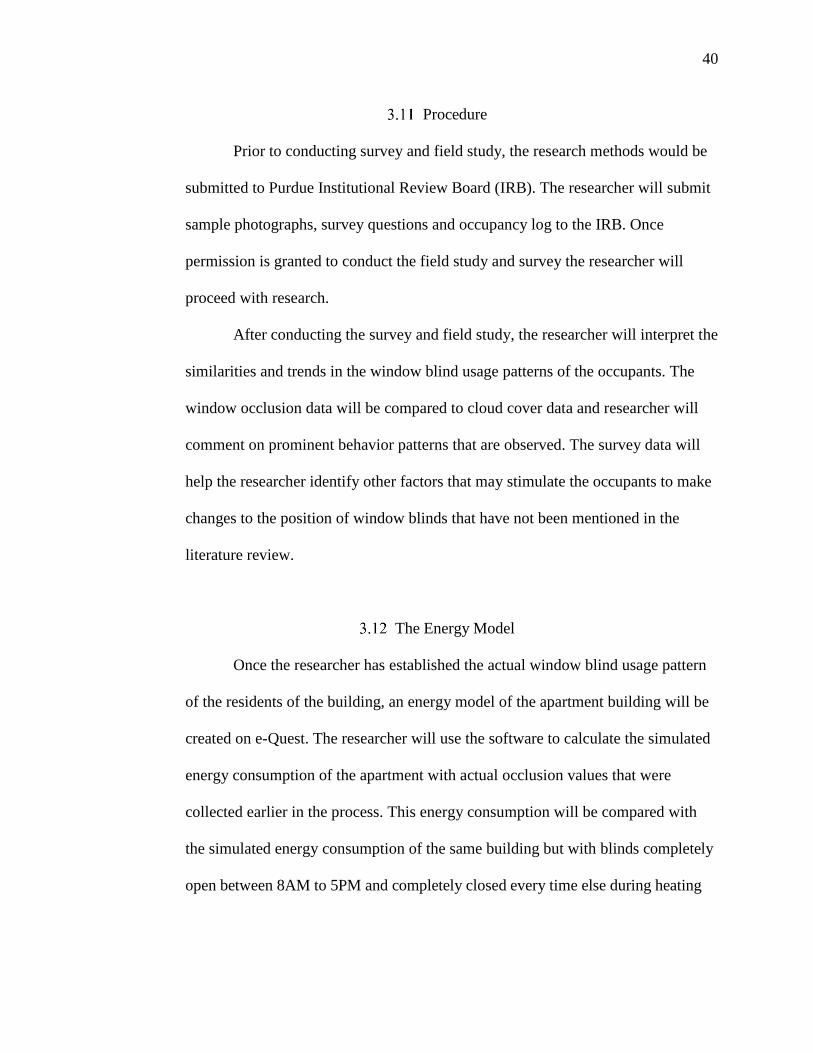
Procedure
Prior to conducting survey and field study, the research methods would be
submitted to Purdue Institutional Review Board (IRB). The researcher will submit
sample photographs, survey questions and occupancy log to the IRB. Once
permission is granted to conduct the field study and survey the researcher will
proceed with research.
After conducting the survey and field study, the researcher will interpret the
similarities and trends in the window blind usage patterns of the occupants. The
window occlusion data will be compared to cloud cover data and researcher will
comment on prominent behavior patterns that are observed. The survey data will
help the researcher identify other factors that may stimulate the occupants to make
changes to the position of window blinds that have not been mentioned in the
literature review.
The Energy Model
Once the researcher has established the actual window blind usage pattern
of the residents of the building, an energy model of the apartment building will be
created on e-Quest. The researcher will use the software to calculate the simulated
energy consumption of the apartment with actual occlusion values that were
collected earlier in the process. This energy consumption will be compared with
the simulated energy consumption of the same building but with blinds completely
open between 8AM to 5PM and completely closed every time else during heating

41
season (12/21-3/20). During the summer season the building will be modeled to
have all windows closed all the time (6/21 – 9/20). Also, 50 percent open between
8AM and 5PM and completely closed every other time during fall and spring
season. The difference in energy consumption of both the models will quantify the
possible energy that can be saved with suggested usage of window blinds.
Population and Sample
The population of this research are occupants of multi-story residential
apartment buildings. The sample for this research are the occupants of The Bluffs
Apartments in Lafayette, IN. The Bluffs is a three story residential building, with
over 60 apartments.
Summary
This chapter outlines the method and procedure that will be used to conduct
this study. It gave details of how the research was designed, the population and
sample was selected, and the sampling approach. It also outlined the study of
variables that will be used in the research.

42
CHAPTER 4. DATA ANALYSIS AND RESULTS
This chapter presents the data that was collected for the purpose of this
study. The chapter also discusses the details of the analysis of the collected data.
Data Collection
Since the study involved human subjects, the collection of data was started
only after the study was categorized as an exempt research by IRB. For this study,
the data was collected primarily in five forms. The first form of data was high
resolution images captured from a distance of 50 feet from each façade of the
building. Six such images were captured every day per façade of the building,
allowing the author to study changes made to the position of the window blinds.
Figure 4.1 is one of the images captured for the purpose of this study.
Figure 4.1. South-West façade of the building under consideration
43
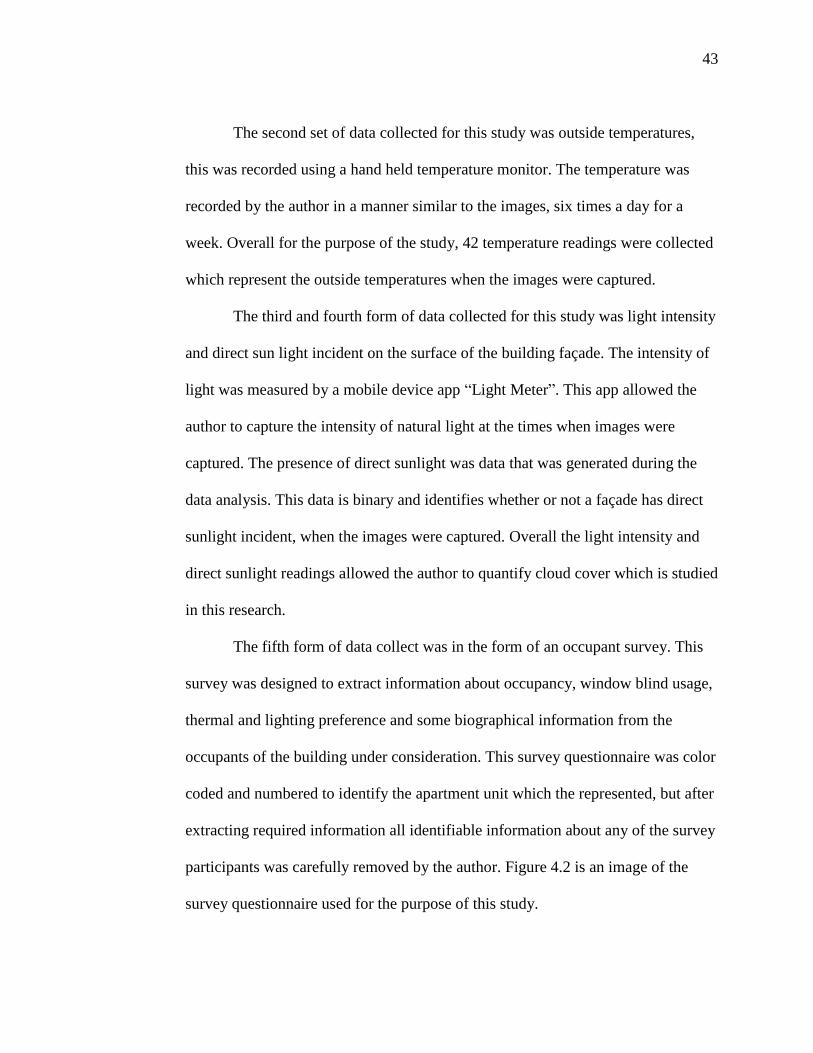
The second set of data collected for this study was outside temperatures,
this was recorded using a hand held temperature monitor. The temperature was
recorded by the author in a manner similar to the images, six times a day for a
week. Overall for the purpose of the study, 42 temperature readings were collected
which represent the outside temperatures when the images were captured.
The third and fourth form of data collected for this study was light intensity
and direct sun light incident on the surface of the building façade. The intensity of
light was measured by a mobile device app “Light Meter”. This app allowed the
author to capture the intensity of natural light at the times when images were
captured. The presence of direct sunlight was data that was generated during the
data analysis. This data is binary and identifies whether or not a façade has direct
sunlight incident, when the images were captured. Overall the light intensity and
direct sunlight readings allowed the author to quantify cloud cover which is studied
in this research.
The fifth form of data collect was in the form of an occupant survey. This
survey was designed to extract information about occupancy, window blind usage,
thermal and lighting preference and some biographical information from the
occupants of the building under consideration. This survey questionnaire was color
coded and numbered to identify the apartment unit which the represented, but after
extracting required information all identifiable information about any of the survey
participants was carefully removed by the author. Figure 4.2 is an image of the
survey questionnaire used for the purpose of this study.

44
Figure 4.2. Survey Questionnaire

45
Window Blind Positions and Usage Patterns
A total of 42 pictures were captured for the purpose of this study. The
author extracted the required information from these pictures which was made into
an excel worksheet. Details of the conversion process has been discussed in
chapter 3. The building under consideration has a total of 62 apartment units and
each apartment has two windows and an additional 2 windows for storage and
lobby. Hence a total of 126 windows that were monitored for the study. Figure 4.3
shows a segment of the excel file that was created for the study.
The North façade of the building had a total of 34 windows, 12 on the third
floor, 12 on the second and 10 on the first floor. The South façade of the building
had a total of 24 windows, 8 on the third floor, 8 on the second and 8 on the first
floor. The East façade of the building had a total of 36 windows, 12 on the third
floor, 12 on the second and 12 on the first floor. The West façade of the building
had a total of 30 windows, 10 on the third floor, 10 on the second and 10 on the
first floor. There were a total of 42 readings for each window mentioned in the
study, which gave the researcher a total of 5292 data points. Each data point had 9
variables, which were:
1. Façade Orientation
2. Window Level
3. Day of The Week
4. Time of Image Capture
5. Occlusion Value (10-Closed to 1-Open)

46
6. Angle of Slats (Open / Closed)
7. Outside Temperature (Fahrenheit °F)
8. Outside Light Intensity (LUX)
9. Incident Direct Sunlight (Yes / No)
Figure 4.3. Survey Questionnaire
Occlusion and Slat Angle Values
Figure 4.4 is a bar graph that shows the frequency of window blind
position. This graph shows all the data points with the respective window blind
occlusion values. Of the 5292 window readings, 3796 readings had an occlusion
value of 10 (completely closed). The second most common occlusion value was 0,
a total of 561 readings had occlusion value as 0 (completely open).

47
Figure 4.4. Occlusion Values
In the literature review section of this research the angle of slats was identified
as one of the important factors that was not captured by studies conducted in the past.
This study was successful in capturing the angle of slats of all the window blinds. Table
4.1 shows the frequency of the readings measured as open or closed.
Table 4.1. List of variables in the study
Angle of Slat Frequency
Closed 4892
Open 400
This research only identifies angle of slats as open or closed, of the 5292
readings that were analyzed only 400 readings showed that the angle of slats was
partially or completely open. Four thousand eight hundred and ninety-two
windows were recorded with their slat angle closed. Overall less than 10 percent of
the windows in the study showed open slat positions, and the total number of
561
165
108
38
124
194
56
81
97
72
3796
0 500 1000 1500 2000 2500 3000 3500 4000
Completely Open
10 % closed
20 % closed
30 % closed
40 % closed
50 % closed
60 % closed
70 % closed
80 % closed
90 % closed
100 % closed
NUMBER OF OBSERVATION
PER
CEN
TAG
E O
CC
LUSI
ON
FR
OM
W
IND
OW
BLI
ND
S
OCCLUSION VALUES

48
changes made to the angle of slats in the study was just 17 times in all of the 5292
readings. It was noted that the occupants of the building under consideration, did
not make a significant number of changes to the position of slats of the window
blinds, and the author has not used the angle of slats in any further analysis for the
same reason.
Sub-Sets
As mentioned earlier, this study has 5292 data points, with each point
having 9 variables. In order to understand the window blind usage pattern, it was
important to classify the data into subsets. For the purpose of this study, the
researcher has broken down the data into 12 subsets. Each of these 12 subsets
represent a specific floor on a specific façade of the building. Table 4.2 shows the
number of windows and readings on each of these sub-sets.
Table 4.2. Number of windows and Readings per subset
Number of
Windows
Number of
Observations
North 3rd Floor 9 378
North 2nd Floor 9 378
North 1st Floor 8 336
South 3rd Floor 10 420
South 2nd Floor 10 420
South 1st Floor 10 420
East 3rd Floor 12 504
East 2nd Floor 12 504
East 1st Floor 12 504
West 3rd Floor 12 504
West 2nd Floor 12 504
West 1st Floor 10 420

49
After the window blind position was coded onto excel, the researcher was
able to calculate the number of times the position of window blinds changed
during the week. As mentioned in chapter 3, this study captured changes that were
made to the position of window blinds in intervals of 10 percent. Hence even a
slight change in blind position has been recorded and presented categorically in
Table 4.2. Table 4.2. presents the total number of changes that were observed
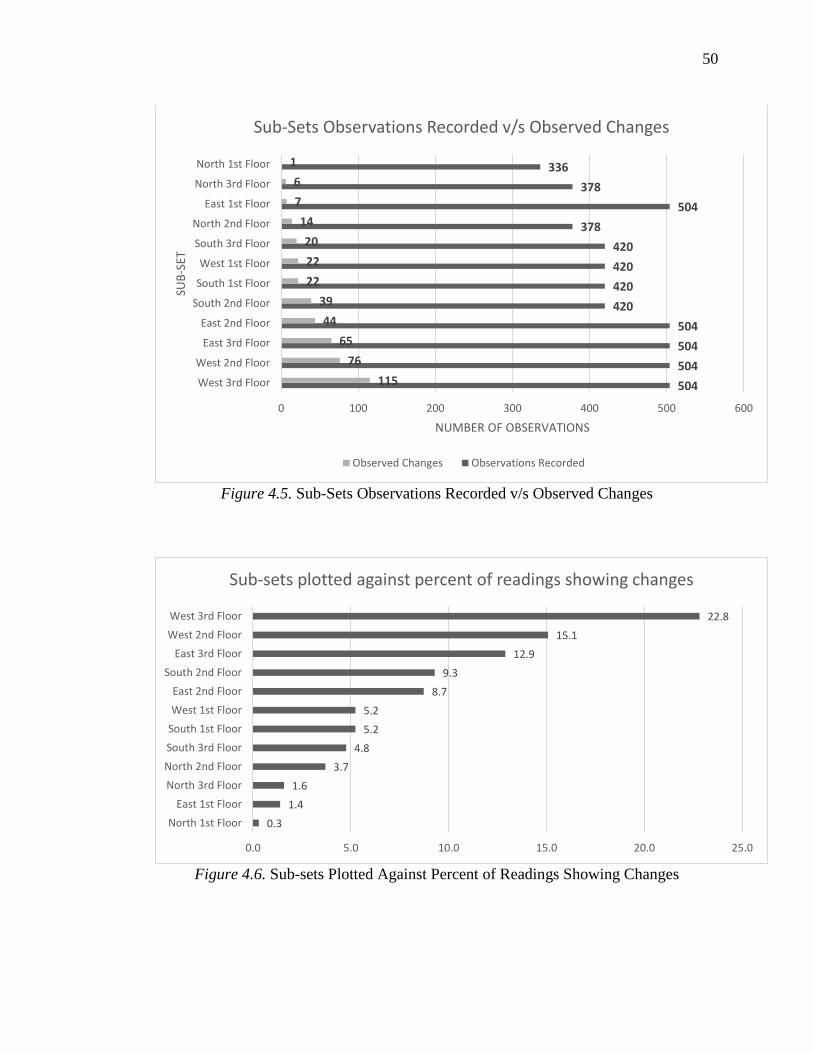
within various subsets, various floors and various facades. Figure 4.5 is a bar graph
that categorizes sub-sets in increasing order of changes observed during the study.
Figure 4.6 is a bar graph categorizing sub-sets in increasing order of percentage of
windows that showed changes made to the position of window blinds.
Table 4.3. Number of changes in occlusion values observed per subset
North South East West Total/Floor
2nd Floor 6 20 65 115 206
1st Floor 14 39 44 76 173
Main 1 22 7 22 52
Total/Facade 21 81 116 213
50
Figure 4.5. Sub-Sets Observations Recorded v/s Observed Changes
Figure 4.6. Sub-sets Plotted Against Percent of Readings Showing Changes
504
504
504
504
420
420
420
420
378
504
378
336
115
76
65
44
39
22
22
20
14
7
6
1
0 100 200 300 400 500 600
West 3rd Floor
West 2nd Floor
East 3rd Floor
East 2nd Floor
South 2nd Floor
South 1st Floor
West 1st Floor
South 3rd Floor
North 2nd Floor
East 1st Floor
North 3rd Floor
North 1st Floor
NUMBER OF OBSERVATIONS
SUB
-SET
Sub-Sets Observations Recorded v/s Observed Changes
Observed Changes Observations Recorded
0.3
1.4
1.6
3.7
4.8
5.2
5.2
8.7
9.3
12.9
15.1
22.8
0.0 5.0 10.0 15.0 20.0 25.0
North 1st Floor
East 1st Floor
North 3rd Floor
North 2nd Floor
South 3rd Floor
South 1st Floor
West 1st Floor
East 2nd Floor
South 2nd Floor
East 3rd Floor
West 2nd Floor
West 3rd Floor
Sub-sets plotted against percent of readings showing changes

51
Table 4.3 and Figure 4.6 shows how windows on the western and eastern
façade of the building under consideration show much higher window blind
changes during the week. It also shows how window on the 3rd and 2nd floor show
more changes than the first floor.
Even though the data shows significant differences in the window blind
usage for all the different sub-sets, percent of windows that show changes on each
sub-set cannot be used to represent the window blind usage of the whole building.
For instance, windows on the 2nd floor of the western façade show 22.8% changes
over the week. This means that 77.2% windows do not show any change in the
window blind position throughout the week. Windows on other sub-sets show even
less usage of window blinds. Occupants are typically very inactive at changing
shading positions and rarely make a shade movement to mitigate thermal
discomfort (O’Brien, Kapsis, & Athienitis, 2013).
Individual Window Blind Usage
The use of sub sets allowed the author to understand window blind usage
pattern for changing parameters, but to study window blind usage of individual
windows, the author has segregated the windows into categories based on changes
made per week. To further understand window blind usage patterns of the building
under consideration the author has broken down the total 126 windows under
consideration into 5 groups. Unlike the subsets mentioned in the previous section,
these groups have been formed based on the number of changes that were observed

52
per window during the week, when the data was recorded.
The first group, GROUP A has the highest percentage of windows in it.
GROUP A contains all the windows that did not show any change, 56 of the total
126 windows under consideration fall in this group. Of these 56 windows, 24
windows are on the northern façade, 16 on the southern façade, 8 on the eastern
façade and 8 on the western façade. Also, 21 of these windows were on the second
floor, 17 on the first floor and 18 on the main floor.
Table 4.4. Summary of Group A
GROUP A (No Changes)
Façade Frequency Level Frequency
West 8 3rd Floor 21
East 8 2nd Floor 17
South 16 First Floor 18
North 24
Total 56 Total 56
GROUP B contains all the windows that showed 1 to 5 changes during the
week, 41 of the total 126 windows under consideration fall in this group. Of these
41 windows, 8 windows are on the northern façade, 12 on the southern façade, 12
on the eastern façade and 9 on the western façade. Also, 18 of these windows were
on the second floor, 17 on the first floor and 6 on the main floor.

53
Table 4.5. Summary of Group B
GROUP B (1-5 changes)
Façade Frequency Level Frequency
West 9 3rd Floor 18
East 12 2nd Floor 17
South 12 1st Floor 6
North 8
Total 41 Total 41
GROUP C contains all the windows that show 6 to 10 changes during the
week, 17 of the total 126 windows under consideration fall in this group. Of these
17 windows, this group has no windows from the northern façade, 4 from the
southern façade, 5 from the eastern façade and 8 from the western façade. Also, 7
of these windows were on the second floor, 5 on the first floor and 5 on the main
floor.
Table 4.6. Summary of Group C
GROUP C (6-10 Changes)
Façade Frequency Level Frequency
West 8 3rd Floor 7
East 5 2nd Floor 5
South 4 1st Floor 5
North 0
Total 17 Total 17
GROUP D contains all the windows that show 11 to 15 changes during the
week, just 6 of the total 126 windows under consideration fall in this group. Of
these 6 windows, this group has no windows from the northern and southern
façade, 2 from the eastern façade and 4 from the western façade. Also, 2 of these

54
windows were on the second floor, 4 on the first floor and none on the main floor.
Table 4.7. Summary of Group D
GROUP D (11-15 Changes)
Façade Frequency Level Frequency
West 4 3rd Floor 2
East 2 2nd Floor 4
South 0 1st Floor 0
North 0
Total 6 Total 6
GROUP E contains all the windows that show 16 to 20 changes during the
week, just 6 of the total 126 windows under consideration fall in this group. Of
these 6 windows, this group has no windows from the northern façade, one from
the southern façade, 1 from the eastern façade and 4 from the western façade. Also,
2 of these windows were on the second floor, 4 on the first floor and none on the
main floor.
Table 4.8. Summary of Group E
GROUP D (11-15 Changes)
Façade Frequency Level Frequency
West 4 3rd Floor 2
East 2 2nd Floor 4
South 0 1st Floor 0
North 0
Total 6 Total 6

55
Overall looking at individual window blind usage of windows, it can be
said that a significant percent of windows does not show any change what so ever.
Over 76 percent of the windows show less than 6 changes during the week, that is
less than one change per day.
Statistical Analysis
One of the primary objectives of this study was to identify if there is any
correlation between any parameters that the study mentions earlier, and window
blind usage pattern by the occupants of the building under consideration.
The author tried linear regression model and Chi Square test to find any
relation between change in occlusion values, and changing environmental factors.
The author also used the Spearman Test to find any correlation between changing
conditions and window blind occlusion. These tests did not find any relation
between the changes in occlusion and changes in various variables like outdoor
temperatures, lighting intensity, direct sunlight, etc. because 76 percent of the
windows in the data set did not show even one change in occlusion per day.
The author used the statistical consultation service, from Purdue University
to understand why the tests were not able to prove any statistically significant
correlation between the variables and window blind usage. The statistical
consultants after examination of the data reported that since most of the
observations did not show any change in occlusion level, a linear or multiple
regression model will fail to identify a relation between occlusion and related

56
variables. Also, consultants from the statistics department recommended Spearman
Correlation Test as it did not require any linear relationship between the data sets
to test correlation.
Spearman Correlation Test
To perform this test, the author selected only those windows that showed
some change during the week. To accomplish this the occlusion values of all the
windows on one façade was averaged to get one value. This process was repeated
to get 42 averaged occlusion values for each of the 42 readings throughout the
week. This process was also repeated for all of the 4 facades of the building.
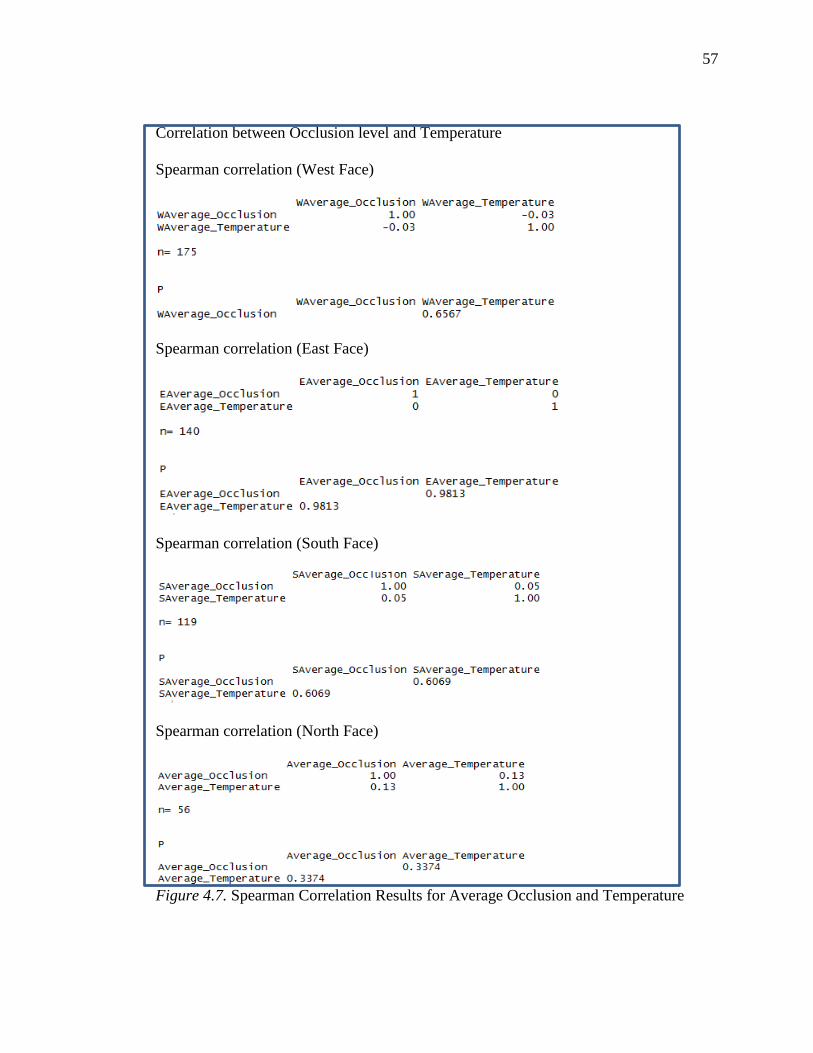
57
Correlation between Occlusion level and Temperature
Spearman correlation (West Face)
Spearman correlation (East Face)
Spearman correlation (South Face)
Spearman correlation (North Face)
Figure 4.7. Spearman Correlation Results for Average Occlusion and Temperature

58
Correlation between Occlusion level and Light reading
Spearman correlation (West Face)
Spearman correlation (East Face)
Spearman correlation (South Face)
Spearman correlation (North Face)
Figure 4.8. Spearman Correlation Results for Average Occlusion and Lighting Level

59
Once the average occlusion value was generated per façade, their
correlation with temperature changes and changes in lighting levels were tested
using the Spearman Correlation Test. The test results for occlusion and
temperature are presented in Figure 4.7
The test results show a very small correlation between change in occlusion
and temperature on the northern western and southern façade of the building. The
eastern façade shows no correlation between occlusion and temperature. The P
value of these tests represents that these correlations are not statistically
significant.
The Spearman tests failed to find any correlation because the frequency of
change of window blinds were very low. An explanation for this is, when with
every different set of reading, the values of temperature and light intensity
changed, the relative value for window blind occlusion did not show any change.
Previous research in regions with an arid climate, with high luminance contrasts
and great thermal amplitude between winter and summer have shown a low
correlation between glare indices and the subjective perception of glare (Yamin,
Pattini, & Rodriguez, 2014). Overall the above correlation tests, performed on each
of the building facades, failed to recognize any statistically significant correlation
between average occlusion values, and outdoor temperatures or lighting intensity.

60
The Survey Results
The survey questionnaire was handed out to all the occupant of the building
under consideration. A total of 62 survey questionnaires were distributed by the
author. A total of 19 residents responded to the survey for a 30.6% response rate.
These 19 respondents represent 38 windows which is almost 30 percent of the
windows under consideration.
The primary purpose of conducting the survey was to identify the
subjective reasons for window blind position changes. One of the questions asked
the occupants of the building to reveal their self-reported temperature preference.
Table 4.9 shows the response from the occupants on temperature preference. This
response shows that 74 percent of all the occupants prefer temperatures between 66
°F and 75°F.
Table 4.9. Self-Reported Temperature Preference
Temperature Preference Frequency
56 °F - 60 °F 0
61 °F - 65 °F 0
66 °F - 70 °F 8
71 °F - 75 °F 6
None of the above 5
The survey results revealed that 15 of the 19 respondents prefer preferred
Natural Light over Artificial Light and just 4 of the 19 preferred Artificial Lighting
over Natural Lighting. The survey also asked the participants to report their
brightness preference, Figure 4.9 presents the distribution of self-reported

61
preferences.
Figure 4.9. Self-Reported Brightness Preference
Seventy-five percent of first floor survey respondents reported privacy as a
concern and a reason behind them keeping their window blinds closed all the time.
Some other prominent reasons mentioned by survey respondents, that changed
their window blind usage were quality of view, distracting light at night, plants and
pet animals. Details on this is presented in the discussion section of chapter 5.
The Energy Model
The author modeled the building under consideration in E-Quest to
simulate the energy consumption under the current window blind usage pattern.
This predicted energy consumption was compared to the predicted energy
consumption under optimum window blind usage.
4
10
5
Self-Reported Brightness Preference
Low Brightness Moderate Brightness High Brightness

62
Under present condition, the occupants of the building keep the window
blinds 20 percent closed between 8AM to 5PM and 90 percent closed every other
time. For the optimum condition the author divided the year into 3 seasons and the
windows were simulated to be completely open between 8AM to 5PM and
completely closed every time else during heating season(12/21-3/20). During the
summer season the building was modeled to have all windows closed all the time
(6/21 – 9/20). Also, 50 percent open between 8AM and 5PM and completely
closed every other time during fall and spring season. Figure 4.10. Figure 4.11
presents a screen shot of the model created for the building under consideration.
Figure 4.12 and 4.13 are the energy simulation results generated by E-Quest for the
two conditions described above.
Figure 4.10. Optimum Window Blind Usage

63
Figure 4.11. 3-D view of the E-Quest Model
Figure 4.12. Simulation Results Under Present Window Blind Usage

64
Figure 4.13. Simulation Results under Optimum Usage
The shading device control model are a representation of possible energy
savings. Often these models are difficult to implement as they are based on high-
order models that require detailed and accurate as-built construction information in
order to be effective (Sˇiroky´ et al., 2011). Overall, for a full year of energy
consumption the author noted that there could be a savings of 58,000 KWh, which
would be a saving of 2.6 percent by optimum usage of window blinds.

65
CHAPTER 5. DISCUSSION CONCLUSION AND RESULTS
This chapter discusses the conclusion that were drawn from the results
obtained in the previous chapter. Also, recommendations for other similar studies
and future work to build upon this study is discussed in the chapter.
There were three areas that this study primarily focused on
Understanding the window blind usage pattern of occupants of a multi-
family residential building in Lafayette Indiana.
To calculate the correlation between outdoor temperatures, outdoor
lighting intensities and occlusion values of window blinds.
To model the building under consideration in an energy modeling
software, and compute energy savings under present usage of window
blinds and suggested optimum usage of window blinds as discussed in
chapter 4.
Throughout the course of data collection and pilot study, the author
identified some interesting trends in the window blind usage patterns of occupants
of the building under consideration. The author was also able to answer some
questions that were not a part of the research initially, but are still important in

66
window blind usage pattern research. These points have been mentioned in the
discussion section.
Discussion
During the pilot study it was noted that most of the windows on the first floor
of the building under consideration do not show any change in their position. It
was noted that almost all the windows had 100 percent occlusion from window
blinds during the pilot survey. After completion of final data collection,
comparing the survey results with window blind usage patterns reveals that
privacy concern is the major reason behind this behavior. It was noted that the
window blinds on North, East and West facades of the building have walk-
ways along the windows and show the highest value of occlusion. Also,
seventy-five percent of the survey respondents living on the main floor of these
facades mentioned privacy as a primary concern for having the window blinds
closed all year round. To add to this hypothesis, the Southern façade of the
building showed significantly higher window blind changes and lesser
percentage of window blind occlusion. The southern façade of the building
under consideration does not have a walkway along these window openings, as
other facades of the building, hence reducing privacy issues. Unfortunately, the
author did not receive any survey responses from occupants of first floor of the
southern façade hence no subjective opinions from occupants is available.
Prior to final data collection the author conducted several pilot tests to study

67
occupant behavior and window blind usage patterns. It was observed by the
author, that during Christmas time all the windows that displayed a Christmas
tree, also displayed a decrease in occlusion from window blinds, throughout
the holiday season.
Several windows on various different facades of the building under
consideration, had the window-sill lined with decorative plants. The author
observed that even though these windows did not show a statistically
significantly different window blind usage pattern, these window openings
were almost never completely covered by the window blinds. On certain
occasions when these windows were covered completely, they were again
reopened to match previous positions of being partially or completely open.
Windows on the 2nd floor and 1st floor of the western façade of the building
under consideration showed the maximum percentage change in occlusion
values when compared to other facades. Explanation for this behavior is that
the western façade of the building does not have any privacy issues. On the
other hand, this facade, has a good view of the woods, and no direct sunlight in
the morning, which is a perfect scenario for occupants to open window blinds
in the morning. However, when this façade starts getting direct sunlight in the
evening hours, the occupants encountered glare causing them to close the
window blinds. Even though the survey results do not conclusively reveal the
reasons behind the increased window blind changes, the substantially higher
occlusion change rate of these windows can be a subject of study for further

68
research.
Modeling the building and simulating its energy consumption predicted that
the total energy savings from recommended usage of window blinds will save
around 58,000KWh of energy during an entire year. The present market cost of
a programmable automatic motor for an existing window blind is around $98
per window. Installation of one such piece was estimated to require 20 minutes
per window, if electric outlets are available in close proximity. The total
estimated cost of installation and equipment for automatic window blinds for
the building under consideration would be $13,600 considering labor cost for
installation as $30 per hour. The resulting annual energy savings from 12 cents
per KWh sums up to $6,960 every year. According to this calculation, the
simple payback period of this retrofit comes to around 2 years.
Conclusions From Analysis of Data
The study did reveals that more than 50 percent of all the windows under
observation showed no change in occlusion values and over 70 percent showed
less than one change per day in the window blind position. This study was aimed at
collecting data on correlation between the environmental factors like temperature
and lighting on the occupant’s usage of window blinds. After completion of data
collection and analysis, the author did not find any statistically significant
correlation, as a huge percent of windows just did not show any change in
occlusion values even when the environmental factors changed significantly.

69
The simulation results predicted energy savings, from suggested usage of
window blinds when compared to the usage pattern observed. The author also
estimated the cost of retrofitting all the window blinds in the building by installing
programmable motor control for the blinds. Since the building is owned and leased
by an apartment management, the investment for the project should typically
involve the management company. Since, the occupants are responsible for their
energy bills, the savings from this project will go to the occupants, which does not
make it a profitable business case for the management.
Overall, this study analyzed and presented window blind usage patterns of
a multi-story, multi-family apartment building in Lafayette, IN.
Recommendations for Future Study
The act of making changes to the position of window blinds in a residential
setting is a subjective decision. Some occupants prefer frequently adjusting
blind position to fit their needs, while others make few or no changes to the
position of window blinds. Quantitative data on blind usage pattern is not
sufficient for understanding occupant behavior or identifying the reasons that
stimulate the occupants to make changes to window blinds. Qualitative data
collected by surveying every occupant in the of the building, and their inputs on
stimuli, factors that make them change the window blind position will produce
better results, in identifying trends and correlation.
Informing the occupants about possible energy savings, and monitoring the

70
change in real time energy consumption can be a significant next step in this
area as this study can lead to conclusive results.
This study recorded the window blind usage pattern during the peak of heating
season. A similar study conducted in other seasons will reveal important data
that can be used to improve the modelling assumption and the results of the
energy simulations can be made more accurate.
The literature review conducted for this study helped the author to recognize
that not many prior studies on window blind usage have been conducted on
residential buildings, the framework used for this research and the data
generated during the study can be used to conduct more studies that build on
previous research.

71
LIST OF REFERENCES
Leaman, A., & Bordass, B. (1999). Productivity in buildings: The ‘killer’ variables.
Building Research & Information, 27(1), 4-19. doi:10.1080/096132199369615
Athienitis A.K., & Tzempelikos, A. (2002). A methodology for simulation of daylight
room illuminance distribution and light dimming for a room with a controlled
shading device. Solar Energy, 72(4), 271-281.
Bader, S. High Performance Facades for Commercial Buildings. Master Thesis,
University of Texas at Austin, Austin, TX, USA, May 2010
Baird, G. (2001). The architectural expression of environmental control systems.
London, UK: Spon Press.
Boyce, P. (2014). Human factors in lighting (3rd ed.). Boca Raton, FL: Taylor &
Francis/CRC Press
Brager, G., & De Dear, R.J. (2003). Historical and cultural influences on comfort
expectations in Cole, R.J., & Lorce, R. (Eds.). Buildings, culture and
environment: Informing local and global practices (pp. 177-201). Oxford, UK:
Blackwell.
Brager, G., G. Paliaga, and R. de Dear, 2004. Operable Windows, Personal Control and
Occupant Comfort. ASHRAE Transactions, 110 (2),

72
Christoffersen, J. (1995). Daylight utilization in office buildings. Ph.D. Dissertation,
Technical University of Denmark, Hørsholm, Denmark.
Curcija, D., Yazdanian, M., Kohler, C., Hart, R., Mitchell, R., & Vidanovic, S. (2013,
October). Energy Savings from Window Attachments.
DiLaura, D. L., Houser, K. W., Mistrick, R. G., & Steffy, G. R. (2010). The lighting
handbook: Reference and application. New York, NY: Illuminating
Engineering Society of North America
Eindhorn, H.D. (1969). A new method for the assessment of discomfort glare. Lighting
Research and Technology, 1(4), 235-247.
Einhorn, H.D. (1979). Discomfort glare: A formula to bridge differences. Lighting
Research and Technology, 11(2), 90-94.
Einhorn, H. D. (1998). Unified Glare Rating (UGR): Merits and application to multiple
sources. Lighting Research and Technology, 30(2), 89-93.
Elzeyadi, I. (2002). Designing for indoor comfort: A systematic model for assessing
occupant comfort in sustainable office buildings. Proceedings of the Solar
2002/31st ASES Annual Conference. 485-497.
Foster, M., & Oreszczyn, T. (2001). Occupant control of passive systems: The use of
Venetian blinds. Building and Environment 36, 149-155.

73
Garretón, J. Y., Rodriguez, R., & Pattini, A. (2015). Effects of perceived indoor
temperature on daylight glare perception. Building Research & Information, 1-
14.
Huchuk, B., Gunay, H. B., O'brien, W., & Cruickshank, C. A. (2015). Model-based
predictive control of office window shades. Building Research & Information,
44(4), 445-455 .
Inkarojrit V. (2005). Balancing comfort: occupants’ control of window blinds in private
offices. Ph.D. Dissertation, University of California, Berkeley.
Inoue T., Kawase, T., Ibamoto, T., Takakusa, S., & Matsuo, Y. (1988). The
development of an optimal control system for window shading devices based on
investigations in office building. ASHRAE Transactions, 104, 1034-1049.
Illuminating Engineering Society of North America. (2000). IESNA Lighting Handbook
(9th Edition). New York, NY: IESNA.
Klems, J.H., & Warner, J.L. (1997). Solar Heat Gain Coefficient of complex
fenestrations with a venetian blind for differing slat tilt angles. ASHRAE
Transaction, 103(1), 1026-1034.
Leaman, A., & Bordass, B. (1999). Productivity in buildings: The 'killer' variables.
Building Research and Information, 27(1), 4-19.
Lee, E. S., DiBartolomeo, D. L., & Selkowitz, S. E. (1998). Thermaland daylighting
performance of an automatedvenetian blind and lighting system in a full-scale
private office. Energy and Buildings, 29(1), 47–63.

74
Lee, E.S., & Selkowitz, S.E. (1995). The design and evaluation of integrated envelope
and lighting control strategies for commercial buildings. ASHRAE Transactions,
101(1), 326-341.
Lindsay, C.R.T., & Littlefair, P.J. (1993). Occupant use of Venetian blinds in offices
(PD 233/92). Watford: Building Research Establishment.
Littlefair, P.J. (1999). Solar shading of buildings. London: Construction Research
Communications by permission of Building Research Establishment.
Loe, L., Mansfield, K., & Rowlands, E. (1994). Appearance of lit environment and its
relevance in lighting design: Experimental study. Lighting Research and
Technology, 119-133.
O’Brien, W., Kapsis, K., &, Athienitis, A. K. (2013). Manuallyoperated window shade
patterns in office buildings: A critical review. Building and Environment, 60,
319–338.
Olgyay, V. (1963). Design with climate: Bioclimatic approach to architectural
regionalism. Princeton, NJ: Princeton University Press.
Raja, I. A., Nicol, F., McCartney, K.J., & Humphreys, M.A. (2001). Thermal comfort:
Use of controls in naturally ventilated buildings. Energy and Buildings, 33, 235-
244.
Rea, M. (1984). Window blind occlusion: a pilot study. Building and Environment,
19(2), 133-137.

75
Reinhart, C.F. (2001). Daylight availability and manual lighting control in office
buildings: Simulation studies and analysis of measurement. Ph.D. Dissertation,
Technical University of Karlsruhe, Germany.
Rubin, A. I., Collins, B.L. & Tibbott, R.L. (1978). Window blinds as a potential energy
saver - A case study (NBS Building Science Series 112). Washington, DC: U.S.
Department of Commerce, National Bureau of Standards.
Rybczynski, W. (1986). Home: A short history of an idea. Harmondsworth: Penguin
Books.
Sˇiroky´, J., Oldewurtel, F., Cigler, J., & Prı´vara, S. (2011). Experimental analysis of
model predictive control for an energy efficient building heating system.
Applied Energy, 88(9), 3079–3087.
Stevens, S. (2001). Intelligent façades: Occupant control and satisfaction. International
Journal of Solar Energy, 21, 147-160.
Tzempelikos, A., & Athienitis, A. K. (2007). The impact of shading design and control
on building cooling and lighting demand. Solar Energy, 81(3), 369–382.
Ullah, M. B., & Lefebvre, G. (2000). Estimation of annual energy-saving contribution
of an automated blind system. ASHRAE Transactions, 106(2): 408-418.
Wagner, A., Gossauer, E., Moosmann, C., Gropp, T., & Leonhart, R. (n.d.). Thermal
comfort and workplace occupant satisfaction—Results of field studies in
German low energy office buildings. Energy and Buildings, 758-769.
Wymelenberg, K. (n.d.). Patterns of occupant interaction with window blinds: A
literature review. Energy and Buildings, 165-176.

76
Yamin, J., Pattini, A., & Rodriguez, R. (2014). Glare indicators: An analysis of ocular
behaviour in an office equipped with venetian blinds. Indoor and Built
Environment.
Yamin, J., Rodriguez, R. G., Ruiz, A., & Pattini, A. E. (2014). Degree of eye opening:
A new discomfort glare indicator. Building and Environment, 88, 142–150