Potential Effect Of Peach, Red Grape Fruits And Their ...
26
Journal of Home Economics Volume 30, Number (1), 2020 Journal of Home Economics http://homeEcon.menofia.edu.eg ISSN 1110-2578 Potential Effect Of Peach, Red Grape Fruits And Their Mixture As Powder On Hypercholestrolestrolemic Rats Amal, N. Zaki, Emad, M. El-Kholie, Hanaa, M. El-Ariny Dept. of Nutrition & Food Science, Faculty of Home Economics, Menoufia University, Egypt. Abstract This study was conducted to investigate the effect of different levels (2.5% and 5%) of peach (Prunus persica) and red grape (Vitis vinfera, L.) fruits as powder on hypercholesterolemia male albino rats. Forty male albino rats , weighing between (140±10g B.Wt), ) were divided into 8 equal group, one was kept as a control (-ve) was fed on basal diet and, while, the other 7 groups were induced hypercholesterolemia by Triton-x-100 (100mg/kg of the weight of the rat) one of them kept as control (+ve) was feed on basal diet only without any addition ,and another groups fed basal diet additionally the powder of investigated fruits for 28 days . Determined the biological parameters as ( BWG, FER, and FI), total cholesterol, triglycerides, lipoprotein fraction (HDL-c, LDL-c, VLDL-c, AI), glucose, kidney functions (urea, uric acid and creatinine), liver functions (ALT and AST), have been determined. The obtained results indicated that peach, red grape fruits and their mixture contains enhancement of phenolic compounds, its use as antioxidant. Data also of peach, red grape fruits and their mixture showed significant enhancement in weight gain, food intake, food efficiency ratio, albumin level, TC, TG, HDL-c, LDL-c, VLDL-c, and all other parameters including internal organs weights. In conclusion: peach, red grape and mixture of them could be considered powerful nutraceutical therapeutic means for the treatment of hypercholesterolemia rats. Kcey words: Hypercholesterolemia, Peach, Red grape, Rats, Biochemical analysis.
Transcript of Potential Effect Of Peach, Red Grape Fruits And Their ...

Journal of Home Economics Volume 30, Number (1), 2020
Journal of Home
Economics
http://homeEcon.menofia.edu.eg ISSN 1110-2578 Potential Effect Of Peach, Red Grape Fruits And Their
Mixture As Powder On Hypercholestrolestrolemic Rats
Amal, N. Zaki, Emad, M. El-Kholie, Hanaa, M. El-Ariny Dept. of Nutrition & Food Science, Faculty of Home Economics, Menoufia
University, Egypt.
Abstract
This study was conducted to investigate the effect of different
levels (2.5% and 5%) of peach (Prunus persica) and red grape (Vitis
vinfera, L.) fruits as powder on hypercholesterolemia male albino rats.
Forty male albino rats , weighing between (140±10g B.Wt), ) were
divided into 8 equal group, one was kept as a control (-ve) was fed on
basal diet and, while, the other 7 groups were induced
hypercholesterolemia by Triton-x-100 (100mg/kg of the weight of the
rat) one of them kept as control (+ve) was feed on basal diet only
without any addition ,and another groups fed basal diet additionally the
powder of investigated fruits for 28 days . Determined the biological
parameters as ( BWG, FER, and FI), total cholesterol, triglycerides,
lipoprotein fraction (HDL-c, LDL-c, VLDL-c, AI), glucose, kidney
functions (urea, uric acid and creatinine), liver functions (ALT and
AST), have been determined. The obtained results indicated that peach,
red grape fruits and their mixture contains enhancement of phenolic
compounds, its use as antioxidant. Data also of peach, red grape fruits
and their mixture showed significant enhancement in weight gain, food
intake, food efficiency ratio, albumin level, TC, TG, HDL-c, LDL-c,
VLDL-c, and all other parameters including internal organs weights. In
conclusion: peach, red grape and mixture of them could be considered
powerful nutraceutical therapeutic means for the treatment of
hypercholesterolemia rats.
Kcey words: Hypercholesterolemia, Peach, Red grape, Rats,
Biochemical analysis.

Journal of Home Economics, Volume 30, Number (1), 2020
230
Introduction Familial Hypercholesterolemia (FH) is a genetic disorder
characterized by high LDL-c cholesterol (LDL-c) plasma concentrations that leads to accelerate arteriosclerotic cardiovascular disease (ASCVD). The prevalence of the heterozygous FH form is about 1/250 individuals (Roman, and Ramos, 2017) and (Zamora et al., 2017).
Hyperlipidemia has been ranked as one of the greatest risk factors contributing to prevalence of atherosclerosis, it is a condition characterized by very high levels of cholesterol in the blood. ( Kaushik and Saini 2014).
Hyperlipidemia is a heterogeneous group of disorders characterized by elevation of plasma concentrations of the various lipids and lipoprotein fractions, which is the key risk factor for cardiovascular disorders (CVD) ( Reiner et al ., 2010). These lipids include cholesterol, cholesterol esters, phospholipids, and triglycerides. Lipids are transported in the blood as large 'lipoproteins' and has been reported as the most common cause of death in developed as well as developing nations ( Simons,2002 and Yokozawa et al .,2003). Hyperlipidemia associated lipid disorders are considered to cause the atherosclerotic cardiovascular disease ( Sundarrajan et al .,2010).
Hypercholesterolemia is defined as excessively high plasma cholesterol levels, and is a strong risk factor for many negative cardiovascular events. Total cholesterol levels above 200 mg/dl have repeatedly been correlated as an independent risk factor for development of peripheral vascular (PVD) and coronary artery disease (CAD), and considerable attention has been directed toward evaluating mechanisms by which hypercholesterolemia may impact vascular outcomes; these include both results of direct cholesterol lowering therapies and alternative interventions for improving vascular function ( Stapleton et al.,2010).
Hypercholesterolemia became the most frequently encountered medical problem worldwide. Among its causes are the bad dietary habits and increased dependence on fast food (Bipasha, and Goon, 2014). The peach is a climateric fruit which has its ripening process controlled by the production of ethylene, a hormone with a series of specific genes which produce changes in the chemical composition and the physical characteristics of the fruit (Grierson, 1987).
The peach (Prunus persica L.) is a deciduous tree that is native to South Asia and cultivated worldwide. The world production is about ten million tons per year. Peach is one of the most widely consumed fruits in several European countries, especially those with the Mediterranean diet (Konopacka et al., 2010).

Journal of Home Economics, Volume 30, Number (1), 2020
231
Prunus persica is an orchard tree native to China that bears a juicy edible peach. It belongs to the Rosaceae family. It is highly useful in treating inflammatory disorders (Lokesh Deb et al .,2011).
The peach tree, Prunus persica (L.) Batsch, which belongsto the family Rosaceae and the genus Amygdalus L., is widely cultivated in China and has been commonly used for centuriesto treat different diseases. It has been reported that the seeds have anti-inflammatory (Shin et al.,2010) and antitumor activity (Fukuda et al .,2003) and that the nucleus in the seeds can improve blood circulation (Liu et al .,2012). In high fat diet induce model, oral administration of methanolic extract of leaves of Prunus persica(MEPP) ( 100mg/kg,200 mg/kg and 400mg/kg, p.o.) significantly reduced the serum total cholesterol (TC), triglyceride (TG), low density lipoprotein-cholesterol (LDL-C), VLDL cholesterol levels but significantly increased serum HDL-cholesterol level as compared with positive control group. This study shows serum lipid parameters in animals were significantly reduced (p<0.001,) by fourteen days treatment with MEPP at dose levels 100, 200 mg/kg and 400 mg/kg, when compared with control group. 400 mg/kg of MEPP group animals has shown very significant (p<0.001) compared with control group (Chatragadda et al., 2014).
Grapes (genus Vitis) are one of the most widely cultivated fruit crops in the world, with uses in the food industry that range from juice, wine, jam, jelly, raisins, and vinegar production to oil extraction from grape seeds. It is estimated that about 80% of the grape harvest is used in the winemaking industry (Yi et al .,2009), grapes (Vitis vinfera L.) are considered the world’s most prevalent fruit crop. Their large amounts of phenolic compounds have made them the focus of extensive studies (Bozan et al., 2008).
Grapes (Vitis sp.) are one of the most cultivated fruit crops in the world, with more than 60 million tons produced annually. Winemaking is an important agricultural activity in several countries of southern Europe, such as Spain, Italy and France, and it produces huge amounts of grape pomace; this by-product mainly consists of skin, seeds and some stalks (Rondeau et al., 2013).
Red grapes are one of the richest sources of flavonoids. Research suggests that pigments called polyphenols are responsible for explaining the French paradox. Polyphenols, found in red grape skins, are believed to act as antioxidants, control blood pressure, and reduce blood clots ( Stoclet et al .,2004).
The grape was one of the first fruits to be cultivated by man. Since the dawn of civilization, the fermented product of grapes, wine, has probably been an important way of consuming grapes (Cheng et al.,2012),grape was known for its high nutritional value and was
Journal of Home Economics, Volume 30, Number (1), 2020
232
mentioned in AL-Quran AL-Kariem many times (Badwilan, and Ben Salem, 2005.) Al Ansary et al ., (2017), said that red grapes juices exerted effective reduction of lipid profile in rat model of hypercholesteremia which seemed to have impact on the protection of the aorta and coronaries against high cholesterol induced atherosclerosis.
Del Bas, et al.,( 2005) found that Resveratrol's antioxidant activity may play an important role in its possible cardio protective action, Above, was mentioned its ability to inhibit the oxidation of LDL, Resveratrol also has been found to exert a strong inhibitory effect on superoxide anion and hydrogen peroxide production by macrophages stimulated by lipopolysaccharides or phorbol esters. It also has been demonstrated to decrease arachidonic acid release induced by lipopolysaccharides or phorbol esters, or by exposure to superoxide or hydrogen peroxide. It has hydroxyl-radical scavenging activity and has recently been found to possess glutathione sparing activity.
This study was conducted to investigate the effect of different levels (2.5% and 5%) of peach and red grape fruits as powder and their mix on hypercholesterolemia male albino rats. Material and Methods Materials Fresh fruits samples of peach (Prunus persica) and red grape (Vitis
vinfera, L.) fruits were purchased from a local market, Shebin El-Kom City, Menoufia Governorate, Egypt.
Triton- X-100 The chemical Triton X-100 used to induce the hypercholesterolemia
obtained from SIGMA Chemical Co. Casein, cellulose, choline, chloride, and DL Methionine: Casein, cellulose, choline chloride powder, and DL methionine
powder, were obtained from Morgan Co. Cairo, Egypt. Experimental animals
A total of 40 adult normal male albino rats strain weighing 140± 10g were obtained from Vaccine and Immunity Organization, Ministry of Health, Helwan Farm, Cairo, Egypt. Methods Preparations of fruits Fresh fruits samples of peach and red grape were washed with running water, then cut into small slices. Slices were dried by Solar Dreier (Drying Vazl) to save the phenol compounds as they are until constant moisture level as described by the method of AOAC, (1995). The dried samples were pounded using electric stainless still mill, and kept in polyethylene bags at freezing temperature until using. Basal diet (Standard diet):

Journal of Home Economics, Volume 30, Number (1), 2020
233
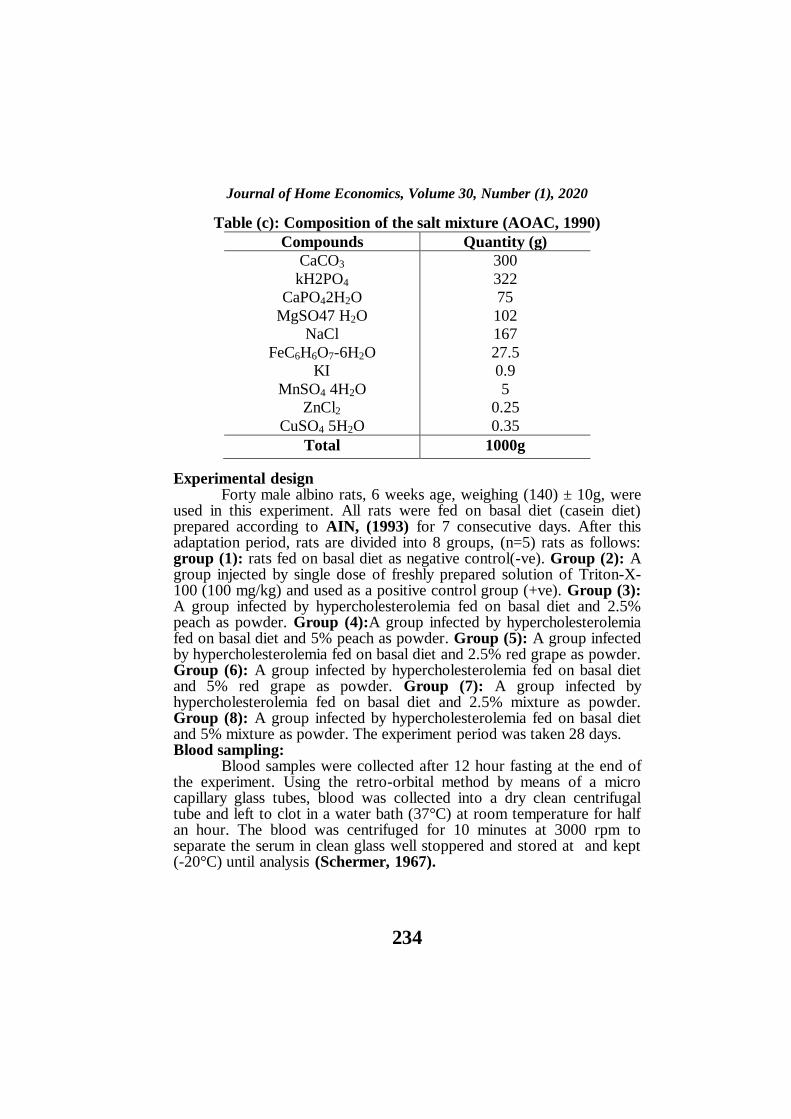
The basal diet was prepared according to AIN, (1993) as illustrated in table (a). The compositions of salt and vitamin mixtures are shown in tables (b&c).
Table (a): The ingredients of the basal diet (g/100 g diet).
Ingredients g/100 g
*Casein
Sunflower oil
Mineral mixture
Vitamins mixture
Fibers (cellulose)
Sugar (sucrose)
DL- methionin
Choline chloride
Corn starch
12
10.0
4
1
4
10
0.3
0.2
56.55
Total 100 (g)
* 12 g casein yielded 10.32 g protein.
Table (b): Composition of vitamin mixture (AOAC, 1990).
Compounds Quantity
Vitamin A
Vitamin D
Vitamin K
Inositol
Niacin
Ca-Pantothenate
Riboflavin (B2)
Thiamine (B1)
Pyridoxine
Folic acid
Biotin
Cyanocobalamin (B12)
Choline chloride
P-amino benzoic acid
2000UL
200 UL
10 UL
10 UL
4 mg
4 mg
0.08 mg
0.5 mg
0.5 mg
0.2 mg
0.04 mg
0.03 mg
200 mg
10 mg
Journal of Home Economics, Volume 30, Number (1), 2020
234
Table (c): Composition of the salt mixture (AOAC, 1990)
Compounds Quantity (g)
CaCO3
kH2PO4
CaPO42H2O
MgSO47 H2O
NaCl
FeC6H6O7-6H2O
KI
MnSO4 4H2O
ZnCl2
CuSO4 5H2O
300
322
75
102
167
27.5
0.9
5
0.25
0.35
Total 1000g
Experimental design Forty male albino rats, 6 weeks age, weighing (140) ± 10g, were used in this experiment. All rats were fed on basal diet (casein diet) prepared according to AIN, (1993) for 7 consecutive days. After this adaptation period, rats are divided into 8 groups, (n=5) rats as follows: group (1): rats fed on basal diet as negative control(-ve). Group (2): A group injected by single dose of freshly prepared solution of Triton-X-100 (100 mg/kg) and used as a positive control group (+ve). Group (3): A group infected by hypercholesterolemia fed on basal diet and 2.5% peach as powder. Group (4):A group infected by hypercholesterolemia fed on basal diet and 5% peach as powder. Group (5): A group infected by hypercholesterolemia fed on basal diet and 2.5% red grape as powder. Group (6): A group infected by hypercholesterolemia fed on basal diet and 5% red grape as powder. Group (7): A group infected by hypercholesterolemia fed on basal diet and 2.5% mixture as powder. Group (8): A group infected by hypercholesterolemia fed on basal diet and 5% mixture as powder. The experiment period was taken 28 days. Blood sampling: Blood samples were collected after 12 hour fasting at the end of the experiment. Using the retro-orbital method by means of a micro capillary glass tubes, blood was collected into a dry clean centrifugal tube and left to clot in a water bath (37°C) at room temperature for half an hour. The blood was centrifuged for 10 minutes at 3000 rpm to separate the serum in clean glass well stoppered and stored at and kept (-20°C) until analysis (Schermer, 1967).

Journal of Home Economics, Volume 30, Number (1), 2020
235
Body weight gain (BWG), feed intake (FI), and feed efficiency ratio(FER):
During the experimental period (28 days) the net feed intake was daily recorded, while body weight was weekly recorded. The net feed intake and gained body weight were used for the calculation of feed efficiency ratios (FER) according to Chapman et al., (1959) as follow:
B.W.G. =
(Final weight - Initial
weight)
Initial weight
Biochemical analysis Lipids profile Determination of total cholesterol Colorimetric method for cholesterol was determined according to Richmond, (1973). Determination of serum triglycerides Serum triglyceride was determined by enzymatic colorimetric method used to determine triglycerides according to Young and Pestaner, (1975). Determination of high density lipoprotein (HDL-c):
HDL-c was determined according to the method described byFriedewaid (1972) and Grodon and Amer (1977). Calculation of very low density lipoproteincholesterol (VLDL-c)
VLDL-c was calculated in mg/dl according to Lee and Nieman (1996) using the following equation: VLDL-c (mg/dl) = Triglycerides / 5 Calculation of low density lipoprotein cholesterol (LDL-c)
LDL-c was calculated in mg/dl according to Lee and Nieman (1996) as follows: LDL-c (mg/dl) = Total cholesterol – HDL-c – VLDL-c. Calculation of atherogenic index (AI): Calculation of atherogenic index = (VLDL-c+ LDL-c) / HDL-c This index was calculated as the (VLDL-c+ LDL-c/HDL-c ratio according to the formula of Kikuchi-Hayakawa et al., (1998). Liver functions: Determination of serum alanine amino transferase (ALT), serum asparatate amino transferase (AST), according to the method of Chawla (2003) and Srivastava et al., (2002).

Journal of Home Economics, Volume 30, Number (1), 2020
236
Kidney functions: 1. Determination of serum urea:
Urea was determination by enzymatic method according to Patton and Crouch (1977). 2. Determination of serum creatinine:
Serum creatinine was determined according to the method described by Henry (1974). 3. Determination of serum uric acid:
Serum uric acid was determined calorimetrically according to the method of Barham and trinder (1972). 4. Determination of blood glucose:
Enzymatic determination of plasma glucose was carried out calorimetrically according to the method of Tinder (1969). Statistical analysis: Data were analyzed using a completely randomized design (SPSS, 2010) when a significant main effect was detected, the means were separated with the student-Newman-Keuls test. Differences between treatments of (P≤0.05) were considered significant Wolfinger and Chang,(1995).
Results And Discussion Effect of Peach, red grape and their mixtures as powder on serum total cholesterol and triglycerides of hypercholesterolemic rats Data tabulated in Table (1) showed that the mean value of serum triglycerides and total cholesterol of hypercholestrolemic rats fed on various diets. It could be observed that the TG value of control (+) group was Significantly higher than control (-) group, being 183.66 and 94 mg/dl, respectively. All hypercholestrolemic rats fed on different diets revealed significant decrease in TG mean values as compared to control (+) group .The values were 134.33,126.7,118.32,110.67,101.3 and 96 mg/dl for 3,4,5,6,7, and 8, respectively . Numerically, the best serum Triglycerides was observed for group 8 (5% mixture powder, 96 mg/dl) when compared to (control positive group, 183.66 mg/dl).
On the other hand, the mean value of serum total cholesterol of hypercholestrolemic rats fed on various diets. It could be observed that the mean value of control (+) group was higher than control (-) group, being 246.65 and 99.66 mg/dl, respectively, showing significant difference as compared to control (+) group. All hypercholestrolemic rats fed on different diets revealed significant decrease in mean values as compared to control (+) group .The values were 164.35,134.31,142.33,119.33,133.66 and 107.66 mg/dl for 3,4,5,6,7, and 8, respectively. Numerically, the best serum

Journal of Home Economics, Volume 30, Number (1), 2020
237
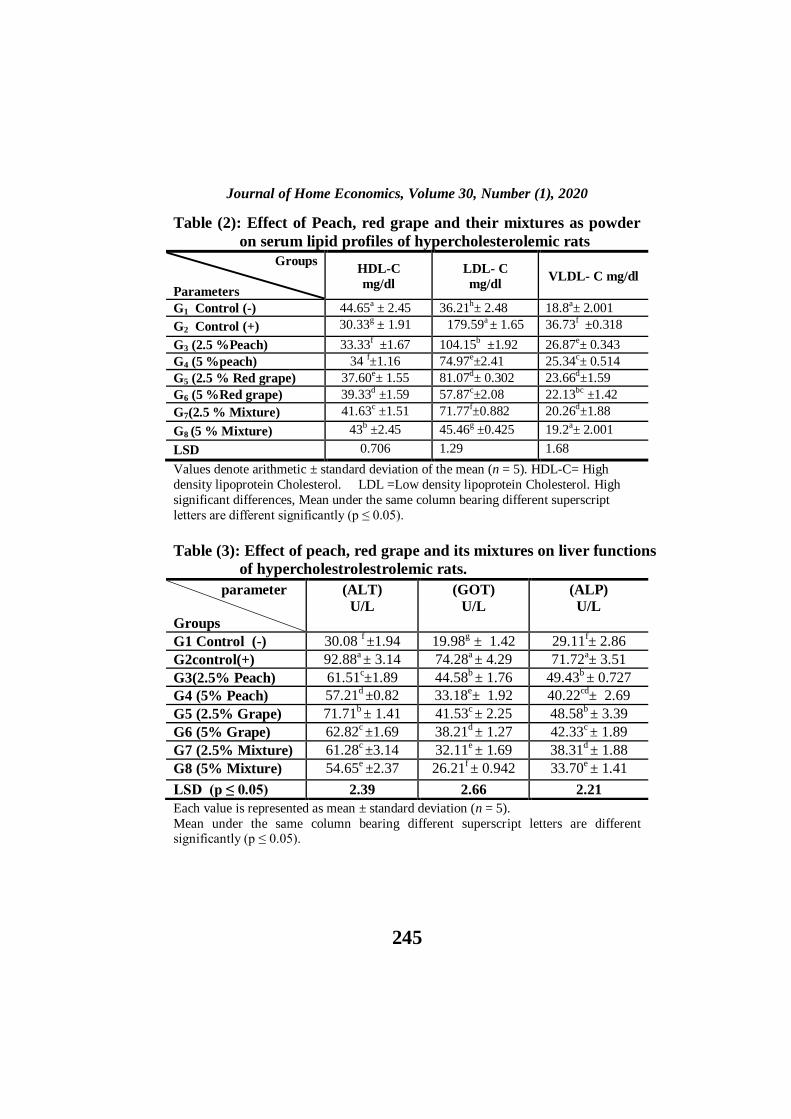
total cholesterol was observed for group 8 (5% mixture powder, 107.66 mg/dl) when compared to (control positive group, 246.65 mg/dl). These result are in agreement with the study by Song et al., (2014) they reported that 28 days of administration of grape seed powder was found to be capable of reducing the levels of serum lipids (TC, TG and LDL-c) and preventing occurrences of fatty liver among rats. In confirmation of this study, by Song et al., (2014) demonstrated that Red Grape Seed Extract (RGSE) had the capacity to significantly increase the concentration of HDL-c apo-AI and lead to decreased TC, TG and LDL-c levels, in relation to the pre-treatment values. Effect of Peach, red grape and their mixtures as powder on serum lipid profiles of hypercholesterolemic rats Data presented in Table (2) showed that the mean value of serum high density lipoprotein of hypercholestrolemic rats fed on various diets. It could be concluded that the mean value of control (+) group was lower than control (-) group, being 30.33 and 44.65 mg/dl, respectively, showing a significant difference as compared to control (+) group.
All hypercholestrolemic rats fed on different diets revealed a significant increase in mean values as compared to control (+) group. The values were 33.33, 34,37.6,39.33, 41.63 and 43 mg/dl for 3,4,5,6,7, and 8, ,respectively . Rats fed on groups 2,3,4,5,6,7 and 8 showed very high significant differences (p ≤ 0.005). Rats fed on group 2 showed very high significant difference (p ≤ 0.005). Finally, the best serum high density lipoprotein was observed for group 8 (5% mixture powder, 43 mg/dl) when compared to (control negative group, 44.65 mg/dl
On the other hand, the mean value of serum low density lipoprotein of hypercholestrolemic rats fed on various diets. It could be indicated that the mean value of control (+) group was higher than control (-) group, being 179.53 and 36.21 mg/dl, respectively, showing significant difference as compared to control (+) group.
All hypercholestrolemic rats fed on different diets revealed significant decrease in mean values as compared to control (+) group. The values were 104.15, 74.97, 81.07, 57.87, 71.77 ,and45.46 mg/dl for 3, 4, 5, 6, 7, and 8, respectively. Rats fed on group 8 (5 % mixture powder, 45.42 mg/dl) recorded the best serum low density lipoprotein was observed for group 8 (5% mixture powder, 44.65 mg/dl) (LDL-c) when compared to (control negative group, 36.21 mg/dl).
In case of VLDL-c, the mean value of serum very low density lipoprotein of hypercholestrolemic rats fed on various diets. It could be observed that the mean value of control (+) group was higher than
Journal of Home Economics, Volume 30, Number (1), 2020
238
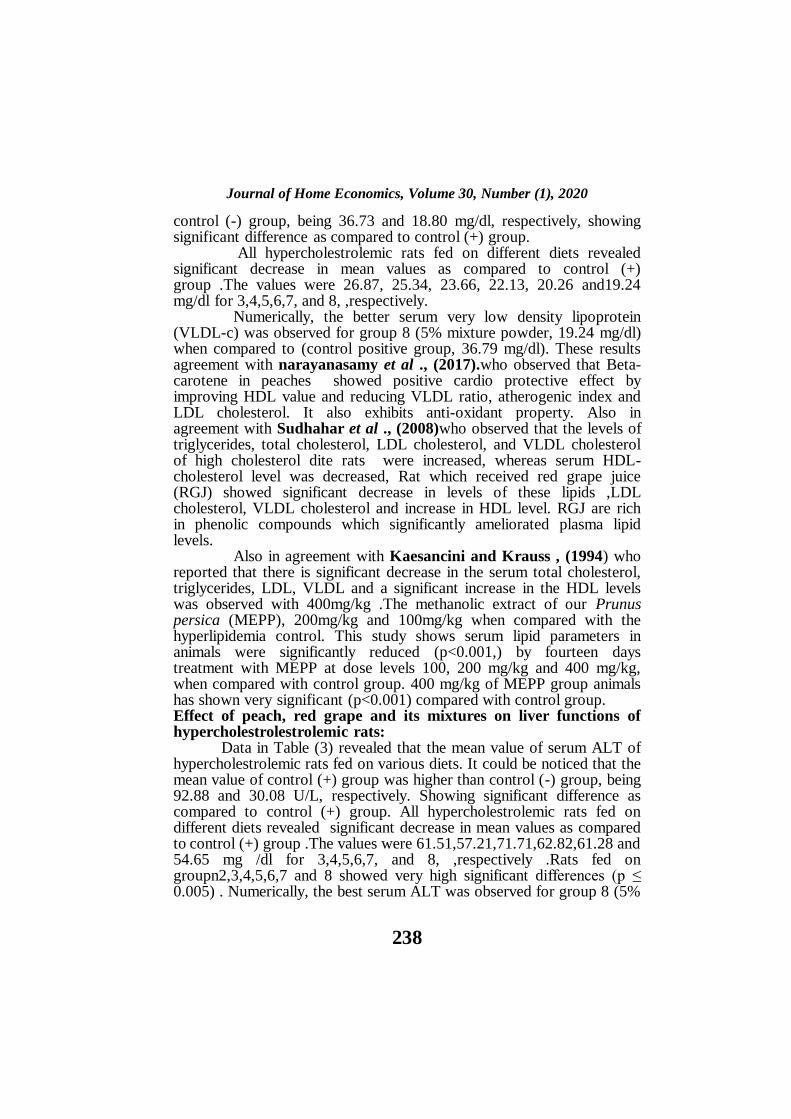
control (-) group, being 36.73 and 18.80 mg/dl, respectively, showing significant difference as compared to control (+) group.
All hypercholestrolemic rats fed on different diets revealed significant decrease in mean values as compared to control (+) group .The values were 26.87, 25.34, 23.66, 22.13, 20.26 and19.24 mg/dl for 3,4,5,6,7, and 8, ,respectively.
Numerically, the better serum very low density lipoprotein (VLDL-c) was observed for group 8 (5% mixture powder, 19.24 mg/dl) when compared to (control positive group, 36.79 mg/dl). These results agreement with narayanasamy et al ., (2017).who observed that Beta-carotene in peaches showed positive cardio protective effect by improving HDL value and reducing VLDL ratio, atherogenic index and LDL cholesterol. It also exhibits anti-oxidant property. Also in agreement with Sudhahar et al ., (2008)who observed that the levels of triglycerides, total cholesterol, LDL cholesterol, and VLDL cholesterol of high cholesterol dite rats were increased, whereas serum HDL-cholesterol level was decreased, Rat which received red grape juice (RGJ) showed significant decrease in levels of these lipids ,LDL cholesterol, VLDL cholesterol and increase in HDL level. RGJ are rich in phenolic compounds which significantly ameliorated plasma lipid levels.
Also in agreement with Kaesancini and Krauss , (1994) who reported that there is significant decrease in the serum total cholesterol, triglycerides, LDL, VLDL and a significant increase in the HDL levels was observed with 400mg/kg .The methanolic extract of our Prunus persica (MEPP), 200mg/kg and 100mg/kg when compared with the hyperlipidemia control. This study shows serum lipid parameters in animals were significantly reduced (p<0.001,) by fourteen days treatment with MEPP at dose levels 100, 200 mg/kg and 400 mg/kg, when compared with control group. 400 mg/kg of MEPP group animals has shown very significant (p<0.001) compared with control group. Effect of peach, red grape and its mixtures on liver functions of hypercholestrolestrolemic rats: Data in Table (3) revealed that the mean value of serum ALT of hypercholestrolemic rats fed on various diets. It could be noticed that the mean value of control (+) group was higher than control (-) group, being 92.88 and 30.08 U/L, respectively. Showing significant difference as compared to control (+) group. All hypercholestrolemic rats fed on different diets revealed significant decrease in mean values as compared to control (+) group .The values were 61.51,57.21,71.71,62.82,61.28 and 54.65 mg /dl for 3,4,5,6,7, and 8, ,respectively .Rats fed on groupn2,3,4,5,6,7 and 8 showed very high significant differences (p ≤ 0.005) . Numerically, the best serum ALT was observed for group 8 (5%
Journal of Home Economics, Volume 30, Number (1), 2020
239
mixture powder, 54.65 U/L) when compared to (control positive group, 92.88 U/L).
Data in Table (3) revealed that the mean value of serum GOT of hypercholestrolemic rats fed on various diets. It could be noticed that the mean value of control (+) group was higher than control (-) group, being 74.28 and 19.98 U/L, respectively. Showing significant difference as compared to control (+) group. All hypercholestrolemic rats fed on different diets revealed significant decrease in mean values as compared to control (+) group .The values were 44.58,33.18,41.53,38.21,32.11 and 26.21 U/L for 3,4,5,6,7, and 8, ,respectively .Rats fed on groupn2,3,4,5,6,7 and 8 showed very high significant differences (p ≤ 0.005) . Numerically, the best serum GOT was observed for group 8 (5% mixture powder, 26.21U/L) when compared to (control positive group, 74.28 U/L).
Data given in Table (3) showed that the mean value of serum ALP of hypercholestrolemic rats fed on various diets.
It could be noticed that the mean value of control (+) group was higher than control (-) group, being 71.72 and 29.11 mg/dl, respectively, showing significant difference as compared to control (+) group.
All hypercholestrolemic rats fed on different diets revealed significant decrease in mean values as compared to control (+) group. The values were 49.43,40.22,48.58,42.33,38.31 and 33.70 mg/dl, for 3,4,5,6,7, and 8, ,respectively .Rats fed on groupn2,3,4,5,6,7 and 8 showed very high significant differences (p ≤ 0.005) . Numerically, the best serum ALP was observed for group 8 (5% mixture powder, 33.70 mg/dl,) when compared to (control positive group, 71.72 mg/dl,).
These result are in agreement with Al Zunaidy et al.,( 2015) who reported that feeding syrup of pears and peaches (pulp & peel) and green tea increased the antioxidant capacity and can scavenge reactive oxygen species which resulted+ in reduced Hypercholesterolemia, hypertriglyceridemia, lipid peroxidation (MDA), i-mproved the activities of antioxidant enzymes (SOD, GSH-Px) and Catalase and blood reduced glutathione and plasma aminotransferases (ALT, AST) and plasma urea. Moreover, histopathological examination of the heart tissue showed signs of recovery from separation of cardiac muscle fibers, diffuse haemorrhage and congestion. Thus it can be concluded that administration of pears, peaches and green tea can protect from oxidative stress generated by feeding high sucrose diet and in this respect green tea produced the higher improvement followed by peels of pears and peaches.
Also in agreement with Dulundu et al .,( 2009) who indicated that the antioxidant effect has been described for grap seed extract (GSE) proanthocyanidins in diabetic rats and has been shown to lead to a

Journal of Home Economics, Volume 30, Number (1), 2020
240
decrease in the oxidant generation and lipid peroxidation. Also, a protective effect of GSE has been reported on reperfusion-induced injury in rats. GSE could reverse ALT, AST and histological alterations induced by the injury. The therapeutic effect of GSE was established against bile duct ligation-induced hepatic fibrosis, where oxidative stress takes place; while a 28-day administration of 50 mg/day of GSE successfully decreased ALT and AST after the damage. Effect of peach, red grape fruit and their mixtures as powder on kidney functions of hypercholestrolestrolemic rats
The mean value of serum creatinine of hypercholestrolemic rats fed on various diets as shown in Table (4). It could be observed that the mean value of creatinine of control (+) group was higher than control (-) group, being 1.42 and 0.72 mg/dl, respectively, showing significant difference as compared to control (+) group.
All hypercholestrolemic rats fed on different diets revealed significant decrease in mean values as compared to control (+) group .The values were 1.15,1.02,1.11,0.95,0.99 and 0.84 mg/dl for 3,4,5,6,7, and 8, ,respectively.
Rats fed on groups 3, 4, 5, 6, 7 showed no significant difference. The best treatment of serum creatinine was recorded for group 8 (5% mixture powder, 0.84 mg/dl) when compared to (control positive group, 1.42 mg/dl).
On the other hand, the mean value of serum uric acid of hypercholestrolemic rats fed on various diets. It could be noticed that the mean value of control (+) group was higher than control (-) group, being 9.9 and 6 mg/dl, respectively, showing significant difference as compared to control (+) group.
All hypercholestrolemic rats fed on different diets indicated significant decrease in mean values as compared to control (+) group .The values were 8.8,7.88,7.5,7.2,7.8 and 6.7 mg/dl for 3,4,5,6,7, and 8 ,respectively .
Rats fed on groups 2, 3, 4, 5, 6, 7 and 8 showed very high significant differences (p ≤ 0.05). While, the highest uric acid level of treated group 3 recorded for group fed on 2.5 % peach but, the lowest value recorded for group fed on 5% plant mixture with significant difference (P≤0.05). The mean values were 8.8 and 6.7 mg/dl, respectively.
In case of serum urea, data revealed that the mean value of serum urea of hypercholestrolemic rats fed on various diets. It could be noticed that the mean value of control (+) group was higher than control (-) group, being 32.6 and 20.4 mg/dl, respectively, showing significant difference as compared to control (+) group.

Journal of Home Economics, Volume 30, Number (1), 2020
241
All hypercholestrolemic rats fed on different diets indicated significant decrease in mean values as compared to control (+) group .The values were 28.4,24.7,30.4,28.2,27.68 and 25.2 mg/dl for 3,4,5,6,7, and 8, ,respectively .Rats fed on groupn2,3,4,5,6,7 and 8 showed very high significant differences (P ≤0.05). While, the highest uric acid level of treated group 5 recorded for group fed on 2.5% grape but, the lowest value recorded for group fed on 5% plant mixture with significant difference (P≤0.05). The mean values were 30.4 and 25.2 mg/dl, respectively.
These results in agreement with Abdelbaky et al., (2016) who revealed that, significant decreased in urea were found for rats fed on hypercholesterolemic diet supplemented with NGS 2% &4% and non-significant decreased for rats fed on hypercholesterolemic diet supplemented with grape seeds powder (GSP) 5%&10%, when compared with positive control group. Moreover, it could be observed that, significant decreased was found in uric acid for rats fed on hypercholesterolemic diet supplemented with Nanoparticles of grape seeds NGS and its powder GSP by different levels compared with control positive. Also, significant decreased was found in creatinine for rats fed on hypercholesterolemic diet supplemented with GSP 5%and 10% compared with control positive .On the other hand , it could be observed that markedly and significant increase in creatinine were recorded for rats fed on hypercholesterolemic diet supplemented with NGS 2% and 4% compared with control positive.
Effect of peach, red grape fruit and their mixture on atherogenic index of hypercholestrolestrolemic rats:
Data given in table (5) revealed that the mean value of atherogenic index ratio of hypercholestrolemic rats fed on various diets.
It could be observed that the mean value of control (+) group was higher than control (-) group, being 6.99 and 1.79 mg/dl, respectively, showing significant difference as compared to control (+) group.
All hypercholestrolemic rats fed on different diets revealed significant decrease in mean values as compared to control (+) group .The values were 3.93,2.93,3.55,2.93,2.28 and 2.28 (mg/dl) for 3,4,5,6,7, and 8, respectively .Rats fed on groupn2,3,4,5,6,7 and 8 showed very high significant differences (p ≤ 0.05). The better serum (AI) ratio was observed for group 8 (5% mixture powder, 2.28 mg/dl) when compared to (control negative group, 1.79 (mg/dl)
These results agreement with Mulvihill et al., (2009) who reported that Atherosclerotic index (A.I) is believed to be an important risk factor for diagnosis of atherosclerosis. The metabolic extract of our Prunus persica reduced atherogenic index which is one of the most

Journal of Home Economics, Volume 30, Number (1), 2020
242
important risk factors of atherosclerotic plaques, naringenin ability to inhibit the secretion of very-low density lipoprotein by the cells.
Also in agreement with Lim, (2013) who reported that proanthocyanidins as one of the many phenols available in grape led to a significant decrease in cholesterol, atherogenic index and triglycerides in the blood serum of rats that dealt with meals high in cholesterol content has added 100 mg Proanthocyanidins grape seed / kg body weight compared to mice that dealt with meals high in cholesterol content. Effect of peach and red grape and their mixture as powder on glucose level of hypercholestrolestrolemic rats
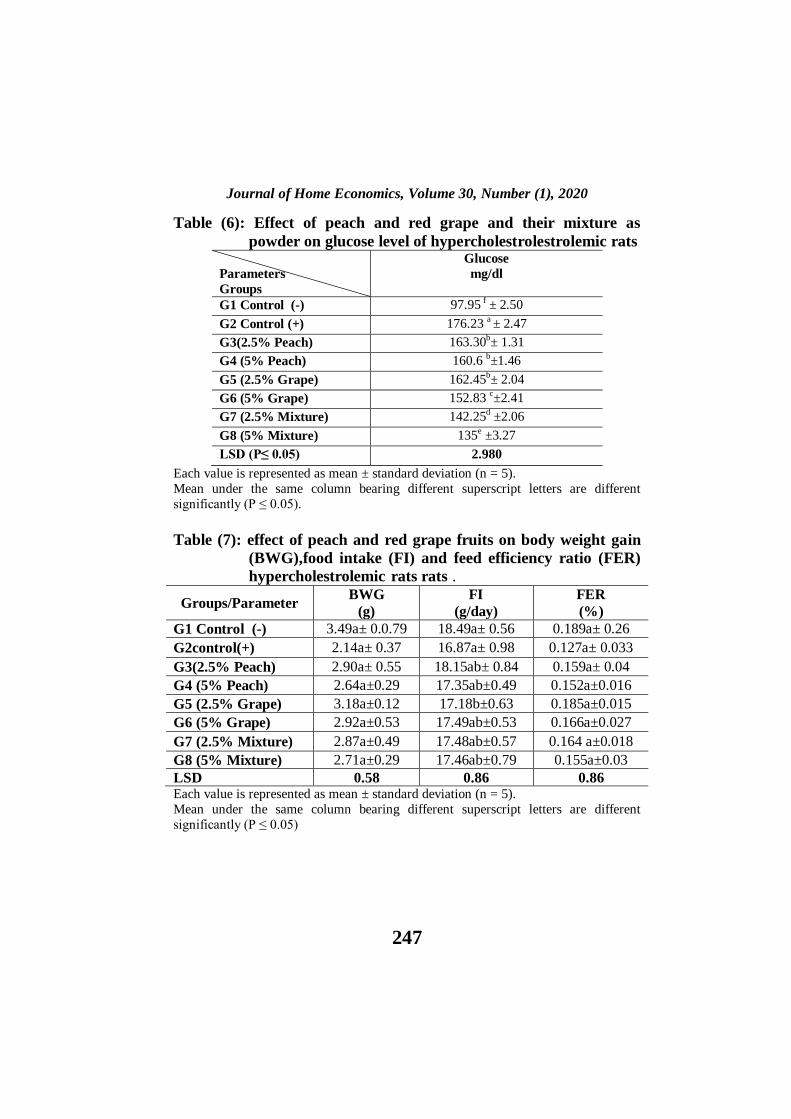
Data presented in Table (6) showed that the mean value of serum glucose of hypercholestrolemic rats fed on various diets. It could be observed that the mean value of control (+) group was higher than control (-) group, being 176.23 and 97.95 mg /dl, respectively, showing a significant difference as compared to control (+) group.
All hypercholestrolemic rats fed on different diets revealed a significant decrease in mean values as compared to control (+) group. The mean values were 163.3,160.6,162.45,152.83,142.25 and 135 mg /dl for 3,4,5,6,7, and 8, respectively .
Rats fed on groups 2, 3, 4, 5, 6, 7 and 8 showed very high significant differences (p ≤ 0.05). Numerically, the best serum glucose was observed for group 8 (5% mixture powder, 135 mg /dl) when compared to (control positive group, 179.23 mg/dl). These result are in agreement with Zuanazzi et al., (2019) who reported that the ingestion on 7 ml/Kg/d for 30 d. does not alter blood glucose or insulin levels but decreases(body mass index) and waist and abdominal circumference. No differences were observed in NO levels or markers of oxidative damage.
Also Yugarani et al., (1992) who observed that the blood glucose and insulin levels of high cholesterol diet (HCD)-fed rats at the end of the experiment were significantly increased. RGJ significantly decreased them at the end of the experiment compared to those received HCD alone.
Similarly, previous study, found that of RGJ had hypoglycemic effect on HCD-fed rats. This due to flavonoids content and these constituents can preserve the insulin-secreting capacity and viability of pancreatic β cells. Therefore, the presence of these constituents in RGJ may explain the hypoglycemic activity. In agreement to our observations a previous study, reported increase level of glucose and insulin in hamsters received HCD which decreased by grape seed at the end of the study.
Also in agreement with Sharma et al., (2018) who reported that Prunus persica ethylacetate fraction (PP-EtOA) possesses potent free radical scavenging property. It’s antihyperglycemic and anti-
Journal of Home Economics, Volume 30, Number (1), 2020
243
adipogenic activities may be due to quercetin (flavonoid) and may prove to be effective in the treatment of diabetes mellitus and diabetes driven dyslipidemic conditions. Although the present findings suggest the presence of hypoglycemic and insulinogenic compounds in the fraction, the precise mechanism of its hypoglycaemic action is still speculative and requires further studies for appropriate elucidation. P. persica and the pure compound(s) there in could be further explored to reveal a natural drug candidate to be useful in diabetes mellitus treatment. Effect of peach and red grape fruits on body weight gain (BWG),food intake (FI) and feed efficiency ratio (FER) hypercholestrolemic rats rats .
Data presented in Table (7) show the effect of peach and red grape fruits on body weight gain (BWG),food intake (FI) and feed efficiency ratio (FER) hypercholestrolemic rats. It could be indicated that the mean value of control (+) group was lower than control(-) group, being 2.14 and 3.49 g, respectively. Showing no significant difference as compared to control (-) group. All hypercholestrolemic rats fed on different diets revealed significant increase in mean values as compared to control (+) group .The values were 2.90,2.64,3.18,2.92,2.87, and 2.71 g for 3,4,5,6,7, and 8, ,respectively . Rats fed on group1,2, 3,4,5,6,7 and 8 showed no significant differences . Finally the highest level of (BWG)g was observed for group 5 (2.5% grape ,3.18 %) while the lowest level of (BWG)g was observed for group 4 (5% grape ,2.64 g) when compared to (control negative group ,3.49%).
In case of feed intake (FI), It could be indicated that feed intake of control (+) group was lower than control (-) group, being 16.87 and 18.49 %, respectively. Showing no significant difference as compared to control (-) group. All hypercholestrolemic rats fed on different diets revealed significant increase in mean values as compared to control (+) group .The values were 18.15,17.35,17.18,17.49,17.88, and 17.46 % for 3,4,5,6,7, and 8, ,respectively . Rats fed on group3, 4, 6,7 and 8 showed no significant differences. Finally the highest level of (FI)% was observed for group 3 (2.5% peach, 18.15 %) while the lowest level of (FI)% was observed for group 5 (2.5% grape ,17.18 %) when compared to (control positive group , 16.87 %).
The obtained results indicated feed efficiency ratio (FER), It could be indicated that feed intake of control (+) group was lower than control (-) group, being 0.186and 0.127 %, respectively. Showing no significant difference as compared to control (-) group. All hypercholestrolemic rats fed on different diets revealed significant increase in mean values as compared to control (+) group .The values were 0.159,0.152,0.185,0.166,0.164, and 0.153 % for 3,4,5,6,7, and 8, ,respectively . Rats fed on group2,3, 4,5, 6,7 and 8 showed no

Journal of Home Economics, Volume 30, Number (1), 2020
244
significant differences. Finally the highest level of (FER)% was observed for group 5 (2.5% grape, 0.185 %) while the lowest level of (FER)% was observed for group 4 (5%peach ,0.152 %) when compared to (control positive group , 0.127 %).
These results are agreement with Thiruchenduran et al., (2011) who reported that high cholesterol diet (HCD ) induced significant increase in the weight of the rats. Supplementation HCD with red grape juice (RGJ) could significantly reduce this weight gain. It was observed that the relative weight of kidney in HCD-fed rats was significantly lowered compared to both control and HCD-fed rats plus RGJ.
Also in agreement with results Abdelbaky et al., (2014) revealed that, rats fed on experimental diet containing 10% grape seeds powder had reduced food intake compared to the positive control group. In addition rats fed on experimental diet containing 2% , 4% nanoparticles of grape seeds,and 5% grape seeds powder had reduced food intake compared to the positive control . Regarding body weight gain (BWG), it was significantly lowered (P≤ 0.05) for the positive control group when compared with the negative control group. . In conclusion: peach, red grape and mixture of them could be considered powerful nutraceutical therapeutic means for the treatment of hypercholesterolemia rats. Table (1): Effect of Peach, red grape and their mixtures as powder on serum
total cholesterol and triglycerides of hypercholesterolemic rats
Groups
Parameters
TG (mg/dl)
TC (mg/dl)
G1Control (-) 94 h±1.88 99.66 h±1.58
G2Control (+) 183.66 a ± 1.01 246.65 a ± 2.45
G3(2.5 %peach) 134.33b±1.59 164.35 b±1.41
G4 (5 %peach) 126.7 c ±1.69 134.31 d ±1.37
G5 (2.5 % Red grape) 118.32 d ± 2.91 142.33 c ± 1.41
G6 (5 %Red grape) 110.67 e±0.656 119.33 e±0.939
G7(2.5 % Mixture) 101.3 f ±1.09 133.66 f ±2.65
G8 (5 % Mixture) 96 g ±0.589 107.66 g ±1.42
LSD 1.006 2.25
Values denote arithmetic ± standard deviation of the mean (n = 5).TC= Total
Cholesterol. TG= Triglyceride.
Mean under the same column bearing different superscript letters are different
significantly (p ≤ 0.05).
Journal of Home Economics, Volume 30, Number (1), 2020
245
Table (2): Effect of Peach, red grape and their mixtures as powder
on serum lipid profiles of hypercholesterolemic rats
Groups
Parameters
HDL-C
mg/dl
LDL- C
mg/dl VLDL- C mg/dl
G1 Control (-) 44.65a ± 2.45 36.21h± 2.48 18.8a± 2.001
G2 Control (+) 30.33g ± 1.91 179.59a ± 1.65 36.73f ±0.318
G3 (2.5 %Peach) 33.33f ±1.67 104.15b ±1.92 26.87e± 0.343
G4 (5 %peach) 34 f±1.16 74.97e±2.41 25.34c± 0.514
G5 (2.5 % Red grape) 37.60e± 1.55 81.07d± 0.302 23.66d±1.59
G6 (5 %Red grape) 39.33d ±1.59 57.87c±2.08 22.13bc ±1.42
G7(2.5 % Mixture) 41.63c ±1.51 71.77
f±0.882 20.26
d±1.88
G8 (5 % Mixture) 43b ±2.45 45.46g ±0.425 19.2a± 2.001
LSD 0.706 1.29 1.68
Values denote arithmetic ± standard deviation of the mean (n = 5). HDL-C= High
density lipoprotein Cholesterol. LDL =Low density lipoprotein Cholesterol. High
significant differences, Mean under the same column bearing different superscript
letters are different significantly (p ≤ 0.05).
Table (3): Effect of peach, red grape and its mixtures on liver functions
of hypercholestrolestrolemic rats.
Each value is represented as mean ± standard deviation (n = 5).
Mean under the same column bearing different superscript letters are different significantly (p ≤ 0.05).
parameter
Groups
(ALT)
U/L
(GOT)
U/L
(ALP)
U/L
G1 Control (-) 30.08 f ±1.94 19.98
g ± 1.42 29.11
f± 2.86
G2control(+) 92.88a ± 3.14 74.28
a ± 4.29 71.72
a± 3.51
G3(2.5% Peach) 61.51c±1.89 44.58
b ± 1.76 49.43
b ± 0.727
G4 (5% Peach) 57.21d ±0.82 33.18
e± 1.92 40.22
cd± 2.69
G5 (2.5% Grape) 71.71b ± 1.41
41.53
c ± 2.25 48.58
b ± 3.39
G6 (5% Grape) 62.82c ±1.69 38.21
d ± 1.27 42.33
c ± 1.89
G7 (2.5% Mixture) 61.28c ±3.14 32.11
e ± 1.69 38.31
d ± 1.88
G8 (5% Mixture) 54.65e ±2.37 26.21
f ± 0.942 33.70
e ± 1.41
LSD (p ≤ 0.05) 2.39 2.66 2.21

Journal of Home Economics, Volume 30, Number (1), 2020
246
Table (4): Effect of peach, red grape fruit and their mixtures as
powder on kidney functions of hypercholestrolestrolemic
rats
Parameter
Groups Creatinine
Uric acid
mg/dl
Urea
mg/dl
G1 Control (-) 0.72b ± 0.065 6.0f ± 0.81 20.4f ± 0.77
G2control(+) 1.42a± 0.727 9.9a± 0.78 32.6 a± 1.18
G3(2.5% Peach) 1.15ab±0.057 8.8b±0.098 28.4c±1.62
G4 (5% Peach) 1.02ab± 0.082 7.88c± 0.088 24.7e± 0.91
G5 (2.5% Grape) 1.11ab± 0.03 7.5cd± 0.29 30.4b± 1.87
G6 (5% Grape) 0.95ab± 0.049 7.2cd± 0.81 28.2c± 1.06
G7 (2.5% Mixture) 0.99ab± 0.201 7.8c± 0.229 27.68d± 1.10
G8 (5% Mixture) 0.84b± 0.008 6.7e± 0.016 25.2e± 0.81
LSD 0.355 0.590 0.591
Each value is represented as mean ± standard deviation (n = 5).
Mean under the same column bearing different superscript letters are different
significantly (p ≤ 0.05).
Table (5): Effect of peach, red grape fruit and their mixture on
atherogenic index of hypercholestrolestrolemic rats
Parameters
Groups
Atherogenic index
(mg/dl)
G1 Control (-) 1.79c ± 0.049
G2control(+) 6.99a± 1.27
G3(2.5% Peach) 3.93b±0.817
G4 (5% Peach) 2.93bc± 1.43
G5 (2.5% Grape) 3.55bc± 1.43
G6 (5% Grape) 2.93bc± 0.089
G7 (2.5% Mixture) 2.88bc± 1.27
G8 (5% Mixture) 2.28bc± 2.28
LSD (P ≤ 0.05) 1.25
Each value is represented as mean ± standard deviation (n = 5).
Mean under the same column bearing different superscript letters are different
significantly (p ≤ 0.05).
Journal of Home Economics, Volume 30, Number (1), 2020
247
Table (6): Effect of peach and red grape and their mixture as
powder on glucose level of hypercholestrolestrolemic rats
Parameters
Groups
Glucose
mg/dl
G1 Control (-) 97.95 f ± 2.50
G2 Control (+) 176.23 a ± 2.47
G3(2.5% Peach) 163.30b± 1.31
G4 (5% Peach) 160.6 b±1.46
G5 (2.5% Grape) 162.45b± 2.04
G6 (5% Grape) 152.83 c±2.41
G7 (2.5% Mixture) 142.25d ±2.06
G8 (5% Mixture) 135e ±3.27
LSD (P≤ 0.05) 2.980
Each value is represented as mean ± standard deviation (n = 5).
Mean under the same column bearing different superscript letters are different
significantly (P ≤ 0.05).
Table (7): effect of peach and red grape fruits on body weight gain
(BWG),food intake (FI) and feed efficiency ratio (FER)
hypercholestrolemic rats rats .
Groups/Parameter BWG
(g)
FI
(g/day)
FER
(%)
G1 Control (-) 3.49a± 0.0.79 18.49a± 0.56 0.189a± 0.26
G2control(+) 2.14a± 0.37 16.87a± 0.98 0.127a± 0.033
G3(2.5% Peach) 2.90a± 0.55 18.15ab± 0.84 0.159a± 0.04
G4 (5% Peach) 2.64a±0.29 17.35ab±0.49 0.152a±0.016
G5 (2.5% Grape) 3.18a±0.12 17.18b±0.63 0.185a±0.015
G6 (5% Grape) 2.92a±0.53 17.49ab±0.53 0.166a±0.027
G7 (2.5% Mixture) 2.87a±0.49 17.48ab±0.57 0.164 a±0.018
G8 (5% Mixture) 2.71a±0.29 17.46ab±0.79 0.155a±0.03
LSD 0.58 0.86 0.86 Each value is represented as mean ± standard deviation (n = 5).
Mean under the same column bearing different superscript letters are different
significantly (P ≤ 0.05)
Journal of Home Economics, Volume 30, Number (1), 2020
248
References
A.O.A.C.(1995):Official Methods of Analysis. Association of Official Analytical Chemists, 16 th. Ed.,Washington , D.C.USA.
Abdelbaky ,S.M.E.; Ibrahim ,H.S.; Hassan ,M.L.; and Zahraa E. Sayed,Z.A. (2016): Nanoparticles Effects of Red Grape (Vitis vinifera) Seeds and Grape Seeds Powder on Obese Hyperlipidemia Rats . ARC Journal of Nutrition and Growth. 2, (2), PP 1-15 ISSN 2455-2550.
AIN,(1993): AMRICAN Inst-te of Nutration Purified for Laboratory Rodent. J nutration 123:1939-1951 and O. compactum oil benth , J.Esseential Res.,(8):657-664.
Al Ansary,A.K.; El-Hendy,H.; Alama,M.N.; Ali,S.; and Karrouf,G.;. (2017): Ameliorative Role of Red Grape Juice on Hypercholesteremia - Induced changes in Aorta and Coronaries in Rats, -Global Journal of Pharmacology 11 (1): 01-08.
Al Zunaidy, N .A.; Al-Sowayan,N.S.; and Mousa, H.M.;(2015): Effect of Peaches, Pears and Green Tea on Plasma Lipids Profile and Antioxidant Content in Rats Fed High Sucrose Diet. Food and Nutrition
Badwilan, Salah Ben Salem, (2005). Therapeutics grapes. Third Edition. House civilization Lynch and distribution. Ariyad. almofh Saudi Arabia. Journal of Clinical. Lipidology 11, 1013–1022.
Bipasha M, Goon S.(2014): Fast food preferences and food habits among students of private universities in Bangladesh South East Asia Journal of Public Health. ; 3(1): 61–64 doi: 10.3329/seajph.v3i1.17713.
Bozan, B., G. Tosun and D. Ozcan, 2008. Study of polyphenol content in the seeds of red grape (Vitis vinifera L.) varieties ultivated in Turkey and their antiradical activity. Food Chem., 109: 426-430.
Chalfoun, A.; Mounayar, R.; Nemr, P.; Yared, S.and Chahine, R.(2012): Antioxidant and Weight Loss Effects of Pomegranate Molasses. Journal of Applied Pharmaceutical Science 02 (06): 45-50.
Chapman ,D.G.; Castilla,R. and Campbell,J.A.(1959):Evaluation of proten in food .I.A.method for the determiniatin of protein efficiency ratio-can J.Biochem. Phesiol.,37:679-686.
Chatragadda, U.; Gindi, S.; and Bowjanku, V.; (2014): evaluation of antihyperlipidemic activity of methanolic extract of leaves of prunus persic world journal of pharmacy and pharmaceutical sciences. world journal of pharmacy and pharmaceutical sciences. 3( 8), 1915-1924.
Journal of Home Economics, Volume 30, Number (1), 2020
249
Chawla , R . (2003) :Practical Clinical Biochemistery. Third Edition . Jaypee Brothers Medical puplichers (p) LTD,New Delhi. Journal of Clinical. Lipidology 11, 1013–1022.
Cheng, V.J.; Bekhit, A.E.-D.A.; McConnell, M.; Mros, S.; Zhao, J. (2012):Effect of extraction solvent, waste fraction and grape variety on the antimicrobial and antioxidant activities of extracts from wine residue from cool climate. Food Chem. 2012, 134, 474–482. [CrossRef].
Del Bas JM, Fernández-Larrea J, Blay M, et al.(2005): Grape seed procyanidins improve atherosclerotic risk index and induce liver CYP7A1 and SHP expression in healthy rats. FASEB J. ;19(3):479-81.
Dulundu, E.; Avci, A.;and Kesik, V .(2009):Cardioprotective roles of aged garlic extract, grape seed proanthocyanidin, and hazelnut on doxorubicin-induced cardiotoxicity. Can J Physiol Pharmacol. ;87(8):633-40.
Friedewaid,W.T.(1972): Determination of HDL. Clin. Chem ., 18:499. Fukuda, T.; Ito, H.; Mukainaka, T.; Tokuda, H.; Nishino,H.; and
Yoshida, T.(2003): “Anti-tumor promoting effect of Glycosides from Prunus persica seeds,” Biological and Pharmaceutical Bulletin, 26( 2), pp. 271–273.
Gordon ,T . and Amer ,M.(1977): Determination of HDL.J.Med., 62:707-708.
Grierson D. (1987). Senescence in fruits. HortScience 22: 859–862. . Kaesancini AY and Krauss RM. (1994) :Cardiovascular disease and
hyperlipidemia: Current topics of lipid dynamics; 5:249-251. Kaushik Vand Saini V.(2014): Hyperlipidemia: its management and
induction. International Journal of Pharmaceutical Sciences and Research. Aug 1;5(8):3152.
Konopacka, D., Jesionkowska, K., Kruczyn´ ska, D., Stehr, R., Schoorl, F., Buehler, A., ... Bonany, J. (2010). Apple and peach consumption habits across European countries. Appetite, 55(3), 478–483.
Lee,R.D. and Nieman , D.C.(1996): Nutritional Assessment .2nd
Ed. Mosby,Missouri,USA. Journal of Clinical. Lipidology 11, 1013–1022.
Lim, Y.( 2013). The polyphenolic constituents of grape pomace. Food Chem. 65: 1–8.
Liu,L.; Duan, J.; Tang,Y.P. et al., (2012):“Taoren-Honghua herb pair and its main components promoting blood circulation through

Journal of Home Economics, Volume 30, Number (1), 2020
250
influencing on hemorheology, plasma coagulation and platelet aggregation,” Journal of Ethnopharmacology, 139( 2),. 381:387.
Lokesh Deb, Ravi Gupta, Debjit Bhowmik, A.S. Dutta, K.P.(2011): Sampath Kumar Protective Effect of Aqueous Fraction of Prunus Persica L Aqueous Extracton Acute Inflammation in Rats, The Pharma Review jan-feb . J. Am . Sci. ;13(1):62-70.
Miguel,M.G.; Neves,M.A.and Antunes,M.D.(2010): Pomegranate (Punica granatum L.): A medicinal plant with myriad biological properties - A short review. Journal of Medicinal Plants Research Vol. 4(25), pp. 2836-2847.
Mulvihill EE, Allister EM, Sutherland BG, Telford DE, Sawyez CG, Edwards JY, Markle JM, Hegele RA, Huff MW October 2009). "Naringenin prevents dyslipidemia, apolipoprotein B verproduction, and hyperinsulinemia in LDL receptor-null mice with diet-induced insulin resistance". Diabetes 58 (10): 2198–210. doi:10.2337/db09- 0634. PMC 2750228.PMID 19592617.
Narayanasamy, S.; Padmavathi, S.; Sabari Selvan,M.R. .; and Somasundaram ,G.;(2017): effect of beta-carotene on lipid levels in diet induced hyperlipidemic rats. int j pharma bio sci. 8(3): (p) 267-272.
Reiner, Z.; Sonicki, Z.; Tedeschi-Reiner,E.;(2010): Public perceptions ofcardiovascular risk factors in croatia: the percro survey Preventive Medicine 51(6), Pages 494–496.
Richmond, W. (1973): Determniation of cholesterol. Bicon Diagnostics. Made in Germany . Chem .19: 1350-1356.
Roman, I.; Ramos, R(2017): Rrepresenting the XULA and ISV-Girona groups. Familial hypercholesterolemia in a European Mediterranean population-Prevalence and clinical data from 2.5 million primary care patients Journal of Clinical. Lipidology 11, 1013–1022. [CrossRef] [PubMed].
Rondeau, P., Gambier, F., Jolibert, F. and Brosse, N. (2013). Compositions and chemical variability of grape pomaces from French vineyard. Industrial Crops and Products 43: 251-254 .
Schermer, S.(1967):The Blood Morphology Of Laboratory Animal .langmams printed in great britain , green and co ltd,p.350.
Shah,M.;Shah,S.and Patei,M.(2011): Review On: “The Aspects of Punica Granatum” . JPSBR: 1(3):154-159.
Sharma, G.; Kumar, S.; Sharma, M.; Upadhyay, N.; and Ahmed, Z. (2018) : Anti-Diabetic, Anti-Oxidant and Anti-Adipogenic Potential of Quercetin Rich Ethyl Acetate Fraction of Prunus persica Pharmacogn J. 2018; 10(3):463-469.

Journal of Home Economics, Volume 30, Number (1), 2020
251
Sharma,P. ; McClees, S.F.and Afaq,F.(2017): Pomegranate for Prevention and Treatment of Cancer: An Update. Molecules, 22, 177.
Shin, T.-Y.;Park, . S.-B. ; and.Yoo, J.-S et al.,(2010): “Anti-allergic inflammatory activity of the fruit of Prunus persica: role of calcium and NF- 𝜅B,” Food and Chemical Toxicology, 48( 10), pp. 2797–2802.
Simons L A.(2002): Additive effect of plant sterol-ester margarine and cerivastatin in lowering low density lipoprotein cholesterol in primary hypercholesterolemia. Am J Cardiol 90, 737 .
Song C, Zhong X, Ge H, and Liu M(2014) : [Research of grape seed powder on serum lipids and hepatic protection effects in high-fat diet rats]. Wei Sheng Yan Jiu.;42(6):991-4.
SPSS,(2010):Argyrous,G. Statistics for Research : With a Guide to SPSS. London : SAGE. ISBN 1-4129-1948-7.
Srivastava, L.M.;Das, N. and Sinha, S.(2002):Essentials of Pratical Biochemistry .CBC Puplishers and Distributors. Journal of American Physicians and Surgeons.10(3):83-89.
Stapleton,E. M.; Singer, A. M.; Kirakosyan, A.; Urcuyo, L. D. E.;Kaufman, P. B. and Bolling, S. F. (2010): Altered hyperlipidemia, hepatic steatosis, and hepatic peroxisome proliferator-activated receptors in rats with intake of tartcherry. Journal of Medicinal Food., 11 (2): 252-259.
Stoclet, J., Chataigneau, T. Ndiaye, M., Oak, M., El-Bedoui, J., Chataigneau, M. and Schini-Kerth, V. B.( 2004): Vascular protection by dietary polyphenols. European Journal of Pharmacology, 500(1- 3):299-313.
Stowe,C.B. (2011): The Effect of Pomegranate Juice Consumption on Blood Pressure and Cardiovascular. Complementary Therapies in Clinical Practice 17.,113:115.
Sudhahar V, Ashok Kumar S, Varalakshmi P, Sujatha V. (2008). Protective effect of lupeol and lupeol linoleate in hypercholesterolemia associated renal damage. Mol Cell Biochem.; 317:11–20.
Sundarrajan, T.; Raj kumar, T.;Udhayakumar ,E.;and Arunachalam, G.;(2010): Hypolipidemic activity of Pithecellobium Dulce Bench. in Triton Wr-1339 Induced Hyperlipidemic Rats International Journal of Chemical and Pharmaceutical Sciences ISSN: 0976-9390,1 (2). 22-35.
Thiruchenduran, M. ; Vijayan, N. ; Sawaminathan, J. and Devaraj, S.(2011). Protective effect of grape seed proanthocyanidins against cholesterol cholic acid diet-induced hypercholesterolemia in rats.
Journal of Home Economics, Volume 30, Number (1), 2020
252
Vicente,A.B.; Uribe,K.B.; Jebari,S.and Garcia, H. (2018): Familial Hypercholesterolemia: The Most Frequent Cholesterol Metabolism Disorder Caused Disease . International Journal o f Molecular Sciences . 4(1):111-117.
Wolfinger,R.D.and Chang ,M.(1995):Comparing the SAS GLM and mixed procedures for Repeated Measures,
,, proceedings of the
Twentieth Annual SAS Users Group Conference,SAS Institute Inc., Cary,NC. Journal of American Physicians and Surgeons.10(3):83-89.
Yi, C.; Shi, J.; Kramer, J.; Xue, S.; Jiang, Y.; Zhang, M.; Ma, Y.; Pohorly, J.(2009): Fatty acid composition and phenolic antioxidants of winemaking pomace powder. Food Chem. 114, 570–576.
Yokozawa T, Ishida A, Cho E Jand Nakagawa T.(2003): The effects of Coptidis rhizoma extract on hypercholesterolemic animal model. Phytomedicine 10( 1), Pages 17–22.
Young,D. and Pestaner, L. (1975):Determination of triglycerides. Bicon diagnostics.Made in Germany. Clin. Chem,21-50.
Yugarani C, Arola L, Salvadó MJ.(1992): Hypolipidemic effects of proanthocyanidins and their underlying biochemical and molecular mechanisms. Mol Nutr Food Res. 54(1): 37–59, doi: 10.1002/mnfr.200900476, indexed in Pubmed: 19960459.
Zamora, A.; Masana, L.; Comas-Cufi, M.; Vila, A.; Plana, N.; García-Gil, M.; Alves-Cabratosa, L.; Marrugat, J.; Roman, I.; Ramos, R(2017): Rrepresenting the XULA and ISV-Girona groups. Familial hypercholesterolemia in a European Mediterranean population-Prevalence and clinical data from 2.5 million primary care patients Journal of Clinical. Lipidology 11, 1013–1022. [CrossRef] [PubMed].
Zuanazzi ,M,Sc.; Maccaria,P.A.; Beninca,S.C.; Branco,C.S.; Theodorom,H.; Regina,V.; and Salvador,M.; (2019): Whitegrapejuiceincreaseshigh-densitylipoproteincholesterollevelsandreducesbodymassindexandabdomin alandwaistcircumferenceinwomen. nutritional investigation, 57(20)109_114.

Journal of Home Economics, Volume 30, Number (1), 2020
253
انتأثير انمحتمم نثمبر انخوخ وانعنب الأحمر عهي انفئران انمصببة بإرتفبع
انكونيسترول
عمبد محمد انخونى ــ هنبء مصطفى انعرينى -أمم نبصف زكى
لأطعتــ كهت الأقخصبد انضن ـ جبيعت انفتعهو اقسى انخغزت
انمهخص انعربي
شج ز انذساس نعشف حأثشيسحق ثبس فبك انخخ انعب الاحش ببنخشكضاثاج
فمأس يم انمع 04% عه انفئشا انصبب ببسحفبع انكنسخشل . حمى اسمخخذاو 2-5.2انخخهف
يجعممبث اعخبممشث احممذ 8جممى حممى حيسممى انمم 04 -+004الانبمم حخممشاز اصاممى بمم
(044حشخ إكس يجبيع الاخش حى حيى ببد 7بط سبنب سه . ال يى يجع ضب
كجى ي ص انجسمى رنمل ندحمذاد الاهمبب ببسحفمبع انكنسمخشل احمذ يمى /يجى 044
حغمزث عهمم انغممزاي انيبسم د ا اضممبفبث ع انجعمم انجمببط انجبمم بيمم انجممبيع
حغزث عه انغزاي الاسبس يجبف ن انخشكضاث انخخهف يم يسمحق ثمبس انفبكم خهطمب
ممو حممى ح ممشر انفئممشا حجممع عممبث انممذو حممى عممم 58يممذ انخجشبمم عاجممب . بعممذ اخممبي
كمممزنل حمممى حيمممذش دممم انمممذو BWG-FER-FIانخحبنمممم ااندصيممم يممم ححبنمممم بنجممم ع
اضبث انكبذ انسب انكشبح يسخ انجهكص أشبسث انخبئج انخحصمم عهمب إنم
ممب حخممب عهمم كممبث يخخهفممت يمم انشكبممبث انفنممت أ انخممخ انعممب الأحممش يخهط
اسخخذايب كجبداث نلأكسذة. أظمشث ببمبث انخمخ م ثمبس انعمب الأحمش خهطمب ححسم
م HDL-cم TGم TCيعب ف صبدة انص م حبل انطعبو م سبت كفمبية انغمزاي
LDL-c مVLDL-c خش.م جع انعبيدث الأ
ف انخخبو: ك اعخببس انخخ انعمب الأحمش يمضجى يم انسمبئم انعدجمت انيمت نهخغزمت
ف عدج انفئشا انصببت ببسحفبع كنسخشل انذو.
: انخوخ ، انعنب الاحمر ، انكونيسترول انكهي ، ارتفبع دهون انذو ، انتحبنيم انكهمبت انكبشفة
.انبيوكيميبئيه

Journal of Home Economics, Volume 30, Number (1), 2020
253