
Potential Alternative CANSLIM Indicators - afta-dfw.com CANSLIM Indicators.pdf · Potential...
21
Potential Alternative CANSLIM Indicators AFTA‐DFW At Baylor Dental College March 20, 2013 Jim Gunn [email protected] Etal, James Pujals [email protected]
Transcript of Potential Alternative CANSLIM Indicators - afta-dfw.com CANSLIM Indicators.pdf · Potential...

Potential Alternative CANSLIM Indicators
AFTA‐DFW At Baylor Dental CollegeMarch 20, 2013
Etal,James Pujals

Disclaimer
No Representations are made that the investment strategies presented herein or discussed by the presenter are complete, without error, or will produce desired investment results. This presentation is made for information sharing purposes only. Nor are any representations made that the investment strategies discussed have been employed to achieve successful investment results. Many of the results are based on back testing with historical data and simulated investing. Future investing results may significantly differ. You should perform your own independent research and “Due Diligence” prior to making any investment decisions, and invest accordingly.
4/20/2013 2

Presentation Topics
• Overview of the CANSLIM methodology and indicators• Potential Alternative CANSLIM indicators• Focus: Alternative Relative Strength (RS) indicator(s),
4/20/2013 3

Investors Business Daily(IBD), Investor’s Corner Article, 3/22/2013“Some Stocks May Have A Flaw, Yet Still Produce Terrific Runs”
Extracts:“The more characteristics of high quality a stock has, the better its chance of being a market winner.” Of course, the more you demand from a stock, the fewer that maybe suitable for purchase. We recently ran a screen of stocks that match IBD’s 20 Rules For Your Investment Success. The results were more than limited: Not one stock met the grade.”
“That doesn’t mean you should forget about stock investing and seek returns elsewhere. The truth is, stocks can fall short in one or two areas but still become successful investments. They must be purchased and sold properly and when the market is strong. The key point: It’s the degree of drawbacks that come up in a stock’s analysis that has to be weighed. While there may be no such thing as a perfect stock, investors are always better off going with the stocks with the fewest blemishes.”
“As the research process goes deeper, more imperfections come up. Ultimately, an investor must decide which flaws are acceptable.”
“Don’t expect a computer screen to make all those decisions for you. Critical thinking, knowledge and experience are key.”
4/20/2013 4

CANSLIM Overview*
• C – Current Big or Accelerating Quarterly Earning and Sales per Share
• A – Annual Earnings Increases: Look for Big Growth• N – New Companies, New Products, New Management, New Highs Off Properly Formed Bases
• S – Supply and Demand: Big Volume Demand at Key Points.
• L – Leader or Laggard: Which is Your Stock?• I – Institutional Sponsorship• M – Market Direction: How Can You Determine it
4/20/2013 5
* How to Make Money in Stocks: Complete Investing System, William J. O’Neal, McGraw Hill, 2011, Chapters 3 - 9
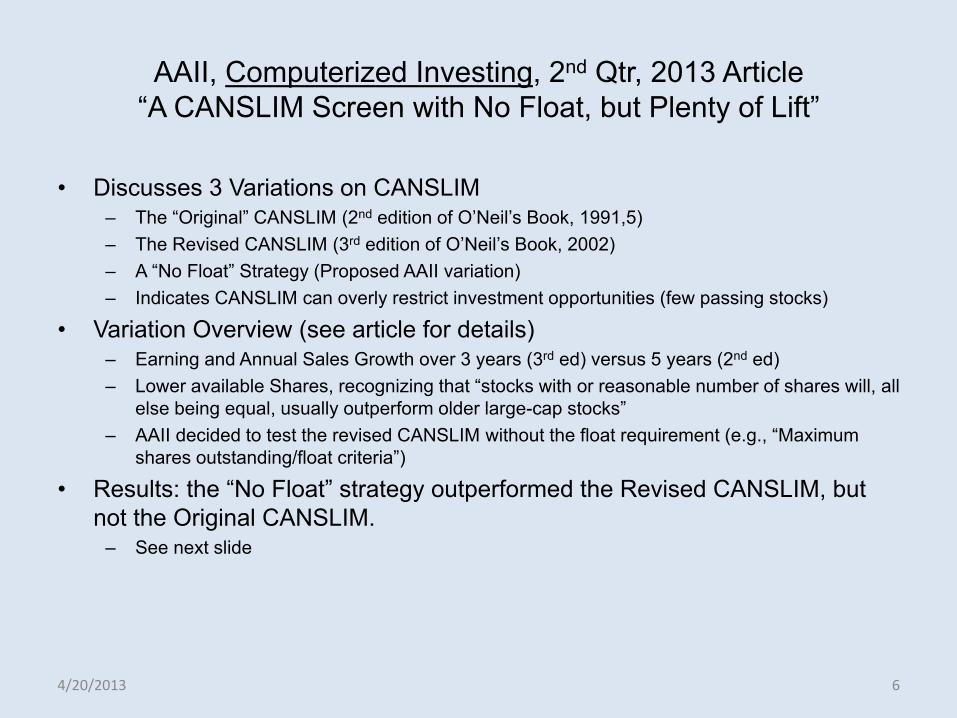
AAII, Computerized Investing, 2nd Qtr, 2013 Article“A CANSLIM Screen with No Float, but Plenty of Lift”
• Discusses 3 Variations on CANSLIM– The “Original” CANSLIM (2nd edition of O’Neil’s Book, 1991,5)– The Revised CANSLIM (3rd edition of O’Neil’s Book, 2002)– A “No Float” Strategy (Proposed AAII variation)– Indicates CANSLIM can overly restrict investment opportunities (few passing stocks)
• Variation Overview (see article for details)– Earning and Annual Sales Growth over 3 years (3rd ed) versus 5 years (2nd ed)– Lower available Shares, recognizing that “stocks with or reasonable number of shares will, all
else being equal, usually outperform older large-cap stocks”– AAII decided to test the revised CANSLIM without the float requirement (e.g., “Maximum
shares outstanding/float criteria”)
• Results: the “No Float” strategy outperformed the Revised CANSLIM, but not the Original CANSLIM.
– See next slide
4/20/2013 6
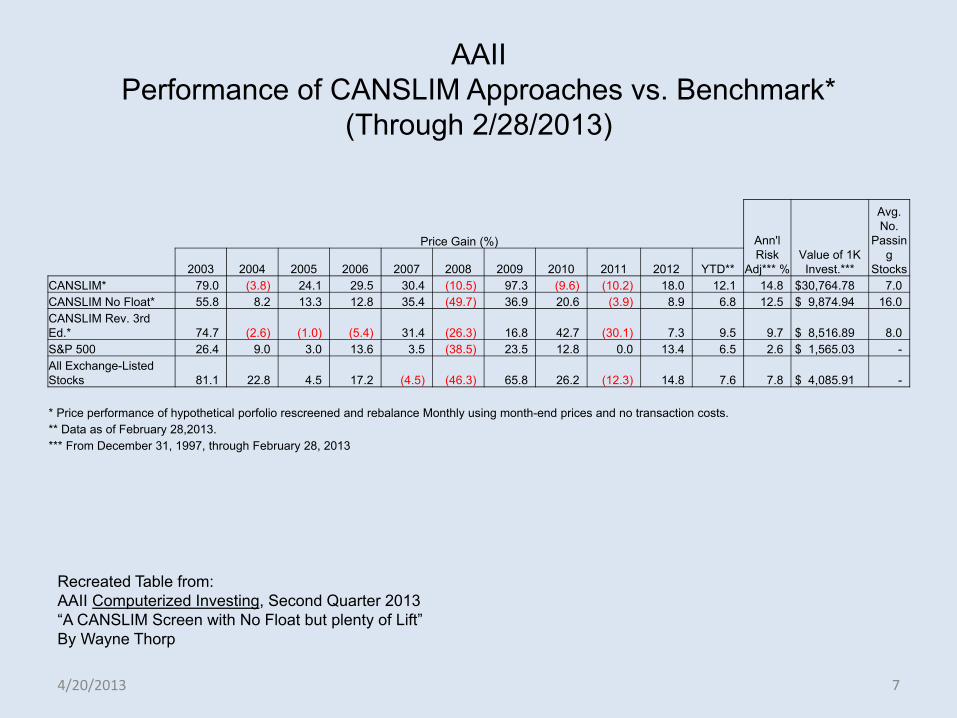
AAIIPerformance of CANSLIM Approaches vs. Benchmark*
(Through 2/28/2013)
4/20/2013 7
Ann'l Risk
Adj*** %Value of 1K Invest.***
Avg. No.
Passing
Stocks
Price Gain (%)
2003 2004 2005 2006 2007 2008 2009 2010 2011 2012 YTD**CANSLIM* 79.0 (3.8) 24.1 29.5 30.4 (10.5) 97.3 (9.6) (10.2) 18.0 12.1 14.8 $30,764.78 7.0 CANSLIM No Float* 55.8 8.2 13.3 12.8 35.4 (49.7) 36.9 20.6 (3.9) 8.9 6.8 12.5 $ 9,874.94 16.0 CANSLIM Rev. 3rd Ed.* 74.7 (2.6) (1.0) (5.4) 31.4 (26.3) 16.8 42.7 (30.1) 7.3 9.5 9.7 $ 8,516.89 8.0 S&P 500 26.4 9.0 3.0 13.6 3.5 (38.5) 23.5 12.8 0.0 13.4 6.5 2.6 $ 1,565.03 -All Exchange-Listed Stocks 81.1 22.8 4.5 17.2 (4.5) (46.3) 65.8 26.2 (12.3) 14.8 7.6 7.8 $ 4,085.91 -
* Price performance of hypothetical porfolio rescreened and rebalance Monthly using month-end prices and no transaction costs.** Data as of February 28,2013.*** From December 31, 1997, through February 28, 2013
Recreated Table from:AAII Computerized Investing, Second Quarter 2013“A CANSLIM Screen with No Float but plenty of Lift”By Wayne Thorp

IBD’s 20 Rules To Finding Winning Stocks
4/20/2013 9
Source: IBD Daily, 4/19/2013

Alternative CANSLIM Indicators
4/20/2013 10
CANSLIM Indicator Potential Alternative IndicatorRelative Strength ROC, RelSt per this presentationMarket Direction (Distribution, Accumulation Days)
Weekly MAs, MACDsVZO, PZO Indicators1 (volume based like IBD’s methods)
Fundamental IndicatorsQuarterly, Yearly
Earnings;Sales, ROE, etc
AAII Stock Investor Pro~$200 per year
Stock Chart Reading Read IBD Daily explanationsMany technical Indicators:
MAs, MACDs, RSI, ADX, etcStocks & Commodities Magazine2
1. Volume Zone Oscillator (VZO) and companion Price Zone Oscillator (PZO) are discussed in Stocks & Commodities Magazine, by Walid Khalil and David Steckler, May, June 2011.
2. Stocks & Commodities Magazine has monthly articles on many technical indicators and software/firmware sources for many charting tools.

AAII’s Stock Investor Pro Tool• Windows-based (including Windows 7, 32- & 64-bit)• Powerful fundamental screening system providing 60+ preinstalled screening
strategies• Ability to create your own screens• NYSE (2,658), Amex (363), NASDAQ Capital, Global and Global Select markets
(2,613) and NASDAQ Bulletin Board • stocks (4,403)�• ADRs (503), REITs (257) and closed-end funds (830)�• Industry data: 12 broad sectors and 102 industries (Reuters)• Fundamental data supplied by Thomson Reuters and earnings estimates supplied by
I/B/E/S• Covers over 10,000 companies (as of 9/30/2011)• Depth of company data 2,200+ Fields per company• Company financials latest 7 years & 8 quarters of detailed income & cash flow
statements and balance sheets• Earnings estimates quarterly & annual EPS estimates and long-term grow estimates
along with recent surprise data • Pricing Date: 10 years of monthly h/l/c/v
4/20/2013 11
Source: AAII web site, 4/18/2013

Excel Block Diagram: Data, Storage, and Calculation
Access/2010~1000 Symbols:
Price: Open, High, Low, Close, Volume, Relative St.
Data Storage
YahooWeb
Stock Prices & Volumedownload
Excel/2010/VBACharting
Indicator Calculations (MA, MACD)RelSt indicators calculated in Excel on
Price/Volume Download
4/20/2013 12
ADOto
Access Data
Workbooks.Open("http://ichart.finance.yahoo.com/table.csv?s=QQQ")
VBA Statement to download QQQ
Relative Strength Ranking & Percentile Calculated after Price Data Download
SQL used to sort as required

Stock Price/Volume Data
Yahoo Data Source• www.finance.yahoo.com• End of Day (EOD) Data• EOD data typically fully available by ~9 – 10 pm on trading days• Data Downloaded: Date, open, High, Low, Close, Volume, and Adjusted Close• Only Adjusted Close accounts for splits and dividends• Initial download of all historical data for a Symbol requires a special setup in
automation• ROC by Symbol & Date efficiently calculated on Download• Rank and Percentile by date and ROC must be calculated later• Subsequent daily updates via automation• Mutual Funds, indices, sectors, etc.
• ~1200 Symbols in current data base(s)• 8000+ Symbols can be accommodated in Access, but download time
would be long• Stock Symbols in following Relative Strength Studies (~970 Symbols) as of
March 2013• S&P 500• NASDAQ with Market Cap greater than $1.1B• IBD50
4/20/2013 13

References
• Charles K. Kirkpatrick & Julie R. Dahlquist, Technical Analysis, 2007, FT Press• Charles K. Kirkpatrick, Invest by Knowing What Stocks to Buy and What to Sell,
2008, FT Press• How to Make Money in Stocks, William J. O’Neil, 2011, McGray Hill• Gil Morales & Dr. Chris Kacher, Trade Like and O’Neil Disciple, 2010, Wiley• Investors Business Daily (IBD) various issues in recent years• American Association of Individual Investors (AAII): AAII Journal, Computerized
Investing Quarterly, Web Site, etc.
4/20/2013 14

Relative Strength Indicator Goals
4/20/2013 15
Current Date
Time
Previous Date - i Future Date + j
Known Current RS Ind.ROCi
Unknown Future RS Ind.ROCi
Claimed by Many: Relative Strength Percentile Rank in top 10% Decile (or some upper percentage) will often identify stocks in upper 10% Decile at later dates.This will be demonstrated.
Relative Strength Requires:1. Relative Strength Indicator, ROCi or Alternative;
Sorted by Symbol and Date2. Relative Strength Rank and Rank Percentile: Sorted
by Date and Relative Strength3. 2 proved more difficult than 1
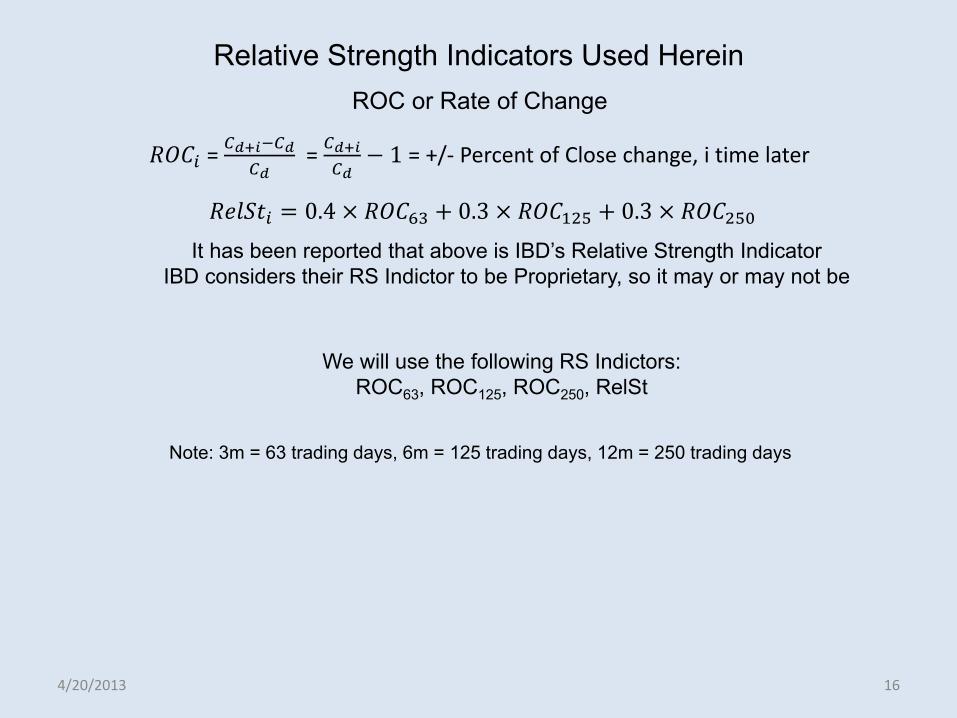
Relative Strength Indicators Used Herein
4/20/2013 16
= = 1 = +/‐ Percent of Close change, i time later
ROC or Rate of Change
Note: 3m = 63 trading days, 6m = 125 trading days, 12m = 250 trading days
0.4 0.3 0.3It has been reported that above is IBD’s Relative Strength Indicator
IBD considers their RS Indictor to be Proprietary, so it may or may not be
We will use the following RS Indictors: ROC63, ROC125, ROC250, RelSt

Comparison Study RS Indicators with IBD RS Indicator
4/20/2013 17
ROC-3Month with IBD RS Ind. ROC-6Month with IBD RS Ind.
ROC-12Month with IBD RS Ind. ROC-RelSt with IBD RS Ind.
Count = Number of (Study_RS – IBD_RS) in Histogram
Source: James Pujals, based on IBD_RS indicators from IBD Daily, 2007 ‐ Present and our calculated Study_RSIndicators

Relative Strength Histogram (26,26)
4/20/2013 18
10%20%30%40%50%60%70%80%90%100%
0%10%20%30%
40%
50%
60%
70%
10% 20% 30% 40% 50% 60% 70% 80% 90% 100%
63.95%
Future RelSt Decile
Percen
tage
in Decile
Bins
Current RelSt Decile
Histogram: Decile RelSt Current, Decile RelSt Future
Future Relst Decile0% 10% 20% 30% 40% 50% 60% 70% 80% 90% 100%
Curren
t Relst Decile 10% 41.67% 11.98% 8.20% 6.79% 5.76% 5.32% 5.01% 5.06% 5.37% 4.84%20% 10.98% 19.19% 16.54% 13.24% 10.87% 8.79% 7.07% 6.33% 5.11% 1.90%30% 7.27% 15.92% 17.25% 15.27% 13.46% 10.96% 8.23% 6.15% 4.13% 1.36%40% 5.17% 13.20% 15.27% 16.04% 15.10% 13.31% 9.98% 6.79% 4.01% 1.12%50% 4.42% 10.70% 12.73% 15.14% 16.39% 15.42% 11.81% 7.87% 4.42% 1.08%60% 4.02% 8.61% 9.99% 12.31% 14.75% 16.93% 15.62% 10.79% 5.62% 1.35%70% 3.66% 7.64% 7.91% 9.10% 10.64% 14.31% 18.83% 16.53% 9.25% 2.13%80% 3.59% 6.73% 6.48% 6.62% 7.26% 8.94% 14.12% 22.66% 19.07% 4.53%90% 4.09% 5.23% 4.96% 4.96% 5.01% 5.45% 8.03% 14.02% 29.28% 18.97%100% 2.18% 2.18% 2.17% 1.98% 1.97% 2.24% 2.82% 5.24% 15.28% 63.95%
Current ROC26Future ROC26Time: 2000 - 2011
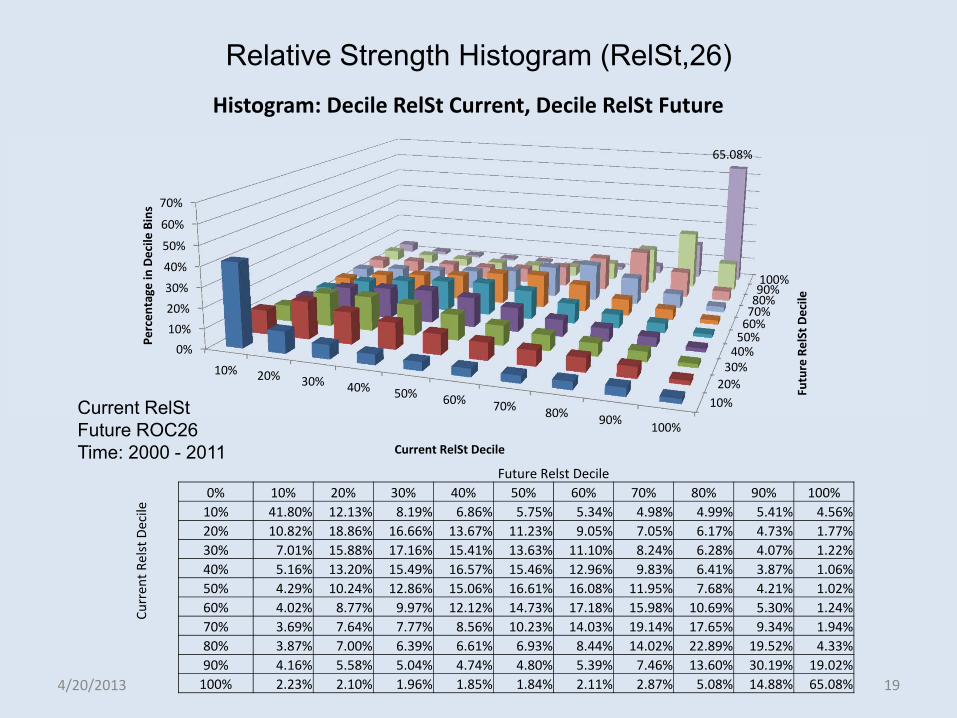
Relative Strength Histogram (RelSt,26)
4/20/2013 19
10%20%30%40%50%60%70%80%90%100%
0%10%20%30%
40%
50%
60%
70%
10% 20% 30% 40% 50% 60% 70% 80% 90% 100%
65.08%
Future RelSt Decile
Percen
tage
in Decile
Bins
Current RelSt Decile
Histogram: Decile RelSt Current, Decile RelSt Future
Future Relst Decile0% 10% 20% 30% 40% 50% 60% 70% 80% 90% 100%
Curren
t Relst Decile 10% 41.80% 12.13% 8.19% 6.86% 5.75% 5.34% 4.98% 4.99% 5.41% 4.56%20% 10.82% 18.86% 16.66% 13.67% 11.23% 9.05% 7.05% 6.17% 4.73% 1.77%30% 7.01% 15.88% 17.16% 15.41% 13.63% 11.10% 8.24% 6.28% 4.07% 1.22%40% 5.16% 13.20% 15.49% 16.57% 15.46% 12.96% 9.83% 6.41% 3.87% 1.06%50% 4.29% 10.24% 12.86% 15.06% 16.61% 16.08% 11.95% 7.68% 4.21% 1.02%60% 4.02% 8.77% 9.97% 12.12% 14.73% 17.18% 15.98% 10.69% 5.30% 1.24%70% 3.69% 7.64% 7.77% 8.56% 10.23% 14.03% 19.14% 17.65% 9.34% 1.94%80% 3.87% 7.00% 6.39% 6.61% 6.93% 8.44% 14.02% 22.89% 19.52% 4.33%90% 4.16% 5.58% 5.04% 4.74% 4.80% 5.39% 7.46% 13.60% 30.19% 19.02%100% 2.23% 2.10% 1.96% 1.85% 1.84% 2.11% 2.87% 5.08% 14.88% 65.08%
Current RelStFuture ROC26Time: 2000 - 2011

Historical Relative Strength Performance
4/20/2013 20
Future ROC3 Month 6 Months 12 Months
Curren
t ROC 3 Month 73.61% 67.75% 58.88%
6 Months 69.32% 63.95% 55.82%
12 Months 62.41% 57.74% 50.94%
RelST 70.51% 65.08% 56.98%
Percentage Current ROC between 90‐100% Percentile andFuture ROC between 90‐100% Percentile
Future ROC3 Month 6 Months 12 Months
Curren
t ROC 3 Month 50.05% 42.35% 27.68%
6 Months 49.22% 41.47% 26.78%
12 Months 48.03% 40.14% 25.44%
RelST 49.54% 41.80% 27.04%
Percentage Current ROC between 0‐10% Percentile andFuture ROC between 0‐10% Percentile
Charts can be produced for all above results

Relative Strength in Stock Charts
4/20/2013 21

Conclusions
• CANSLIM Methods can be utilized with alternative indicators• Relative Strength does provide ability to screen for probable winning stocks• Relative Strength is very useful in charts to detect uptrends or downtrends• Best Successes are undoubtedly achieved by:
• Studying Indicators and understanding strengths and weaknesses• Devoting time to develop chart pattern recognition skills
• Effective use of Money Management to minimize losses when strategies are unreliable and run with winners when reliable
4/20/2013 22


