The Resistance Responses of Potato Plants to Potato Virus ...


Potato Value Chain Analysis and
Development in Ethiopia Case of Tigray and SNNP Regions
Reported by
Bezabih Emana and Mengistu Nigussie Financial Support by USAID
October 2011
International Potato Center (CIP-Ethiopia), c/o ILRI, P.O. Box 5689, Addis Ababa Ethiopia
Tel: +251 11 617 2290; website: www.cipotato.org
DISCLAIMER:
The study is made possible by the support of the American People through the United States Agency for International Development (USAID). The contents of this document are the sole responsibility of the authors and do not necessarily reflect the views of USAID or the United States Government.
i
TABLE OF CONTENTS
LIST OF TABLES ........................................................................................................................ iii
LIST OF FIGURES ....................................................................................................................... v
ACKNOWLEDGMENTS .............................................................................................................. vi
ACRONYMS/ABBREVIATIONS ................................................................................................ vii
EXECUTIVE SUMMARY ............................................................................................................ viii
1. INTRODUCTION ...................................................................................................................... 1
1.1 Background ....................................................................................................................... 1 1.2 Objective ........................................................................................................................... 2 1.3 Study area ......................................................................................................................... 2
2. REVIEW OF LITERATURE ...................................................................................................... 4
2.1 Conceptual Framework of Value Chain ............................................................................ 4 2.2 Value Chain Study Approaches ........................................................................................ 6 2.3 Application of Value chain Analysis in Potato ................................................................... 7 2.4 Seed and Ware Potato Production in Ethiopia .................................................................. 8
2.4.1 Seed potato production and marketing system ........................................................ 8 2.4.2 Major problems of seed potato ................................................................................. 9 2.4.3 Ware potato production ............................................................................................ 9
3. METHODOLOGY ................................................................................................................... 11
3.1 Data Source and Method of Collection ........................................................................... 11 3.2 Data Analysis .................................................................................................................. 12
4. RESULTS AND DISCUSSION ............................................................................................... 13
4.1 Potato Seed System ....................................................................................................... 13 4.1.1 Seed potato production and marketing in SNNPR and Shashemene .................... 13 4.1.2 Potato varieties grown in Tigray and seed distribution channel ............................. 15
4.2 Ware Potato Production and Utilization in SNNPR and Shashemene ............................ 16 4.2.1 Ware potato production and productivity ................................................................ 16 4.2.2 Potato production and utilization ............................................................................ 18
4.3 Ware Potato Production and Utilization in Tigray ............................................................ 19 4.3.1 Production and productivity .................................................................................... 19 4.3.2 Potato production and utilization ............................................................................ 20
4.4 Value Chain Actors and Functions in SNNPR ................................................................ 21 4.4.1 Input suppliers ........................................................................................................ 22 4.4.2 Potato producers .................................................................................................... 23 4.4.3 Traders/Brokers ..................................................................................................... 25 4.4.4 Potato processing .................................................................................................. 25 4.4.5 Potato retailers ....................................................................................................... 26 4.4.6 Potato consumers .................................................................................................. 26 4.4.7 Potato support service providers ............................................................................ 27
ii
4.4.8 Value chain governance ......................................................................................... 28 4.5 Value Chain Actors and Functions in Tigray ................................................................... 29
4.5.1 Input suppliers ........................................................................................................ 29 4.5.2 Potato producers .................................................................................................... 29 4.5.3 Traders/Brokers ..................................................................................................... 31 4.5.4 Potato processing .................................................................................................. 31 4.5.5 Potato retailers ....................................................................................................... 31 4.5.6 Potato consumers .................................................................................................. 32 4.5.7 Potato support service providers ............................................................................ 32
4.6 Value Chain Analysis in SNNPR and Shashemene ........................................................ 33 4.6.1 Value chain map .................................................................................................... 33 4.6.2 Marketing analysis ................................................................................................. 34 4.6.3 Economic analysis of potato value chain ............................................................... 37 4.6.4 Factors of competitiveness in potato value chain................................................... 38 4.6.5 Constraints in potato value chain ........................................................................... 40
4.7 Value Chain Analysis in Tigray ....................................................................................... 42 4.7.1 Value chain map .................................................................................................... 42 4.7.2 Marketing analysis ................................................................................................. 42 4.7.3 Economic analysis of potato value chain ............................................................... 44 4.7.4 Factors of competitiveness in potato value chain................................................... 46 4.7.5 Constraints in potato value chain ........................................................................... 47
5. RECOMMENDATIONS FOR VALUE CHAIN DEVELOPMENT ............................................ 50
5.1 Summary of Interventions ............................................................................................... 50 5.2 Intervention Strategy ....................................................................................................... 53
References ................................................................................................................................. 55 Annexes ..................................................................................................................................... 57
Annex 1: Description of Value Chain Tools ............................................................................. 57 Annex 2: Sample Potato Producers by Sex ............................................................................ 58 Annex 3: Sample Potato Retailers and Wholesalers by Region .............................................. 59 Annex 4 :Companies with Potential to use Potato for Value Addition in Ethiopia ................... 59 Annex 5: Suggested Interventions/Solutions ........................................................................... 60 Annex 6: Contact Addresses of Selected Potato Traders ....................................................... 63 Annex 7: Data Collection Instruments ..................................................................................... 64
iii
LIST OF TABLES
Table 1: Proportion of sample farmers growing potato varieties in Hulla and Shashemene (%) ........... 13 Table 2: Proportion of farmers at Hulla and Shashemene selling seed potato to different
buyers (%) ................................................................................................................................. 14 Table 3: Proportion of sample farmers growing potato varieties in Tigray project woredas (%) ............ 15 Table 4: Proportion of farmers selling potato seeds to different buyers (%) ........................................... 16 Table 5: Potato activity calendar in at Hulla (% of producers undertaking the activities)* ...................... 17 Table 6: Potato activity calendar at Shashemene (% of producers undertaking the activities)*............. 17 Table 7: Average yield of potato for rainfed system in 2010/11 production year (t/ha) .......................... 18 Table 8: Potato production and utilization per household in Hulla and Shashemene woredas .............. 19 Table 9: Potato production activities in Tigray ........................................................................................ 19 Table 10: Average yield of Potato for the 2010/11 production year (t/ha) ................................................ 20 Table 11: Potato production and utilization in Tigray ................................................................................ 21 Table 12: Summary of potato value chain actors and functions ............................................................... 22 Table 13: Sources of potato seed in study areas (% of respondents) ...................................................... 22 Table 14: Proportion of framers and amount of fertilizer and seed used, Hulla and Shashemene .......... 23 Table 15: Descriptive statistics of land allocated to potato in the south, rainfed in 2010/11 (ha/HH) ....... 23 Table 16: Potato cropping methods (% of respondents)........................................................................... 24 Table 17: Proportion of potato producers using different stores in Hulla and Shashemene (%) .............. 24 Table 18: Percent of producers using different means of transporting potation the south ....................... 25 Table 19: Proportion of farmers who sold ware potato through different channels in 2010/11 (%) .......... 25 Table 20: Quantity of potato handled by retailers and effective months of potato trading ........................ 26 Table 21: Potato consumption in Hawassa ............................................................................................... 27 Table 22: Sources of potato seed in study areas (% of respondents) ...................................................... 29 Table 23: Proportion of framers and amount of fertilizer and seed used, Tigray ...................................... 29 Table 24: Land allocated to potato production (ha) in Tigray in 2010/11 .................................................. 30 Table 25: Potato cropping methods (% of respondents)........................................................................... 30 Table 26: Proportion of farmers using different types of stores (%) ......................................................... 30 Table 27: Transportation means to take potato to market ........................................................................ 31 Table 28: Proportion of producers who sold potato to different buyers (%) .............................................. 31 Table 29: Quantity of potato handled by retailers and effective months of potato trading ........................ 32 Table 30: Potato consumption in Mekele (Amount per year) .................................................................... 32 Table 31: Proportion of farmers who sold ware potato to different actors (%).......................................... 36 Table 32: Average producer price (Birr/t) by location in 2010/11 ............................................................. 37 Table 33: Cost of potato production in study areas (2010/11) .................................................................. 37 Table 34: Distribution of value addition among major chain actors at Hulla ............................................. 38

iv
Table 35: Distribution of value addition among major chain actors at Shashemene ................................ 38 Table 36: Proportion of farmers indicating marketing problems in the south (% of
respondents) ............................................................................................................................. 41 Table 37: Potato transportation problems proportion of farmers citing the problem (% of respondents) . 41 Table 38: Major problems related to potato post harvesting (% of respondents) ..................................... 41 Table 39: Cost of potato production in Tigary ........................................................................................... 45 Table 40: Distribution of value addition among major chain actors at Atsibi-Wonberta ........................... 46 Table 41: Distribution of value addition among major chain actors at Saesi-Tsaeda Emba .................... 46 Table 43: Proportion of farmers stating transportation problem (% of respondents) ............................... 48 Table 44: Major problems related to potato post harvesting (% of respondents) ..................................... 49 Table 42: Strategic intervention areas and actions to be taken ................................................................ 54

v
LIST OF FIGURES
Figure 1: Value chain Functions ............................................................................................................... 4 Figure 2: Value chain actors and support framework ............................................................................... 5 Figure 3: Proportion of potato produced by regions ............................................................................... 10 Figure 3: Potato seed flow system in the south: Shashemene is a HUB ............................................... 14 Figure 4: Potato seed flow system in Tigray ........................................................................................... 16 Figure 5: Proportion of households producing different levels of yield (%) ............................................ 18 Figure 6: Proportion of households producing different levels of yield (%). Tigray (%) ......................... 20 Figure 7: Processes and functions in potato value chain in SNNPR ...................................................... 21 Figure 8: Map of support service providers for potato ............................................................................ 27 Figure 9: Potato value chain in SNNPR.................................................................................................. 34 Figure 10: Source of potato supplied to Shashemene market (%) ........................................................... 34 Figure 11: Destination of potato supplied from Shashemene market (% of 19,417 t) .............................. 35 Figure 12: Marketing channels for ware potato in the south ..................................................................... 35 Figure 13: Seed potato marketing channel in the south ........................................................................... 36 Figure 14: Core constraints in potato value chain .................................................................................... 40 Figure 15: Potato Value Chain in Tigray Region ...................................................................................... 42 Figure 16: Distribution of quantity of potato supplied to Mekele market (t) .............................................. 43 Figure 17: Proportion of Supply of potato to Mekele market (1,800 t in 2010) ......................................... 43 Figure 18: Price variability within a year Mekele market (2010/11) .......................................................... 44 Figure 19: Trend of retail potato price at two market centers in Tigary from 2007-2011
(Birr/kg) .................................................................................................................................... 45

vi
ACKNOWLEDGMENTS
First of all, we are thankful to CIP – Ethiopia for giving us the opportunity to work on this important project. The management and staff of the project, named “Better Potato for Better Life” organized the Value Chain Training workshop and field level data collection in Tigray and SNNPR. The staff of the stakeholders who participated in the workshop participated in the interview of value chain actors including farmers. We acknowledge the time the farmers, transporters, traders, processors and consumers spared in responding to our questions during the data collection. We are thankful to the individuals and institutions who directly or indirectly contributed to the accomplishment of this study.

vii
ACRONYMS/ABBREVIATIONS
CIP International Potato Center CSA Central Statistical Authority DLS Diffused Light Store FGD Focus Group Discussion ha Hectare Kg Kilogram m Meter MoA Ministry of Agriculture SNNPR Southern Nations, Nationalities and Peoples Region t ton

viii
EXECUTIVE SUMMARY
The objectives of the potato value chain analysis are to provide a descriptive analysis of seed and ware potato value chains, identifying the major constraints of the ware and seed production and marketing, understanding support service provisions, and suggesting the specific areas of intervention to strengthen potato value chains in SNNPR and Tigray regions. The study employed value chain framework for analysis of the data. Participatory approach was employed to collect the data. The “Better Potato for Better Life” project stakeholders were trained in value chain study tools and involved in data collection of qualitative and quantitative data from potato producers, traders, transporters, processors and consumers. Secondary data were obtained through review of documents. The key findings are summarized as follows:
i) The major potato value chain actors include input (seed, fertilizer, fungicide, farm implement) suppliers, producers, wholesalers, brokers, retailers and consumers. There is no significant structural difference between the potato value chain in SNNPR and Tigray. The main difference is the quantity of potato marketed and associated prices at different levels and the level of value addition by the different market actors.
ii) Shashemene is the major source of seed potato used in the SNNPR and Tigray.
However, the quality of the seed is low and variety hardly traced. iii) Input supply in both regions is not adequate and the planning of input supply through
the extension system focuses on rainfed crops and excludes the irrigated ones. iv) Production of potato is both for seed as well as consumption. This system of
production is serious constraint for the establishment of economically viable seed sector. The specific needs of the consumers are not adequately considered in variety selection. Farmers are not getting adequate advisory service to increase potato productivity. Post harvest loss is also high due to lack of adequate storage. Potato is also damaged when transported due to inadequate transportation facility and poor handling.
v) Farmers grow potato mainly for marketing purpose. On average, 0.8 t to 3.2 t of
potato is sold per household during 2010 production season which is 52% to 86% of total potato produced by the household. The role of potato for food security is also significant as an average of 0.3 t and 0.4 t and 0.9 t of potato was consumed per household per year in Tigray, SNNPR and Shashemene respectively.
vi) Potato marketing takes place in all the four study areas but Shashemene serves as
distribution center for potato purchased and sold in the SNNPR and other parts of the country including Tigray.

ix
vii) Potato price fluctuates based on the season of harvest. Prices are set by the traders who increase or decrease the price considering the supply situation. Wholesalers are the value chain regulators and the role of producers in value chain management is minimal.
viii) Potato processing is not well developed in the country. Only small scale chips
making and cooking of potato is made. Processing industries are not developed. Even some super markets are preparing chips for sale due to absence of processing industries. Lack of scale is one of the reasons for a huge lag in this case. But the future for potato use for starch extraction exists.
ix) Consumption of potato is limited. At household level, knowhow of different ways of
utilizing potato is limited. x) The potato value chain is constrained by many problems. These problems and
suggestions have been included in the last chapter of this report.

Potato Value Chain Analysis and Development in Ethiopia
1
1. INTRODUCTION
1.1 Background
African economies are increasingly confronted with changing food and commodity markets, due to globalization, economic liberalization and urbanization (Hoeffler, 2005). As a result, consumer preferences change. This poses new opportunities but also challenges to small-scale producers, traders and processors along agricultural value chains. To address this situation, development agencies, donors and NGOs are placing more emphasis on enabling farmers to increase their level of competitiveness, to produce for an identified market, rather than trying to sell what they have already produced and also seeking new market opportunities that offer higher levels of income. Such goals can be achieved through better economic coordination and institutional linkages. Farmer organizations can play a key role of organizing economic activities beyond local boundaries. They can build up relationships with various chain actors and securing commitments from various actors to cooperate on mutually beneficial actions and investments and thus create value chains. Potato provides an opportunity for value chain development. It is one of the most productive food crops in terms of yields of edible energy and good quality protein per unit area and per unit of time fitting into intensive cropping systems (Burton, 1989). Nutritionally, the crop is considered to be a well-balanced major plant food with a good ratio between protein and calories, and has substantial amounts of vitamins, especially vitamin C, minerals, and trace elements. Due to its correct balance between protein and calories, it is considered a good weaning food (Berga et al., 1993). Ethiopia has good climatic and edaphic conditions for higher potato production and productivity (Endale, et al., 2008a). Compared to cereals, potato is short duration crop that can yield up to 30-35 t/ha potato in 3-4 months in Ethiopia (Endale et al. 2008b). In Bhutan, it is reported that the potential yield of potato can reach up to 50 t/ha (Joshi, et al., 2009). In Ethiopia, average tuber yield of potato was almost constant between 6-8 t/ha in the last 20-30 years while the area planted with potato increased from 30,000 ha to about 160,000ha in 2001 (Endale, et al., 2008a). The development and dissemination of many improved varieties of potato contributed to the improvement and expansion of potato production in Ethiopia. Most of the potato germplasm used for selection in Ethiopia are obtained from the CIP. Despite the research and development efforts in improving the production and productivity of potato, little has been done to improve the performance of the entire potato value chain. Some studies conducted on horticulture value chains considered potato as one of vegetable products and often dealt with ware potato only (e.g. Emana, 2008). Shortage of appropriate potato seed is a major bottleneck in potato supply. To fill the gap, “Better Potato for Better Life Project” has taken the initiative to improve the seed supply system in Tigray and Southern Nations, Nationalities and Peoples Regions. The project is funded by USAID and implemented by CIP together with regional partners.

Potato Value Chain Analysis and Development in Ethiopia
2
CIP-Ethiopia commissioned a participatory value chain study in the two regions to understand the main constraints along the potato value chain and identify strategic intervention areas. The study was conducted during May-June 2011.
1.2 Objective
The main objectives of the value chain analysis were to provide a descriptive analysis of seed and ware potato value chains in Tigray and SNNP regions, identify the major constraints of the ware and seed potato production and marketing, understand support service provisions, and suggest the specific areas of intervention to strengthen potato value chains in the two regions. The specific objectives of the value chain analysis were:
Develop value chain maps and identify the major potato value chain actors in SNNP and Tigray regions;
Carry out Value Chain Analyses with SNNP and Tigray regions Identify the constraints faced by potato value chain actors in both regions; Identify strategic intervention areas for increasing the competitiveness of potato
value chain in the two regions.
1.3 Study area
The study was conducted in two regions: SNNPR and Tigray. The study sites were purposefully selected to represent the “Better Potato for Better Life Project” sites. In Tigray, Atsibi-Wonberta and Saesi-Tseada Emba woredas were included to study the production side of the value chain. In the SNNPR, Hula Woreda was selected. The selection of another project woreda was shifted to Shashemene area after the training workshop conducted in Hawass for simple reason that the potato produced in SNNPR are largely sold in Shashemene market. It is a hub of potato production where seed and ware potato are produced twice in a year without using supplementary irrigation and distributed to other regions of the country. By the nature of value chain study, it is also good to see the whole chain from input supply up to the end market. Without including Shashemene, the value chain study would be incomplete.
Southern Nations, Nationalities and Peoples Region (SNNPR) SNNPR is one of the regional states occupying the southern parts of Ethiopia. It is bordered by Oromia in the north and eastern part, by Gambella regional state in the western part and by Kenya in the south. It is the third agriculturally potential crop producing regions of the country. According to the Ethiopian population census of 2007 (CSA, 2008/09), the population of SNNPR was estimated at 15,042,531 with 49.7% male and 50.3% female ratio. The majority of the population (89.7%) lives in the rural area and only 10.3% lives in urban area. The regional crop production data shows that the total area allocated to potato production in 2006/07 was estimated at 14,032 ha and total production was 97,435.4 tons for Meher season (CSA, 2007). The average potato yield was 6.95 t/ha which is low confirming the appropriateness of the project intervention with the aim to enhance production and

Potato Value Chain Analysis and Development in Ethiopia
3
productivity. In the region, an estimated 430,582 people were involved in the production of potato in 2006/07, which is about 15% of the households in the region (CSA, 2008/09).
Tigray Regional State Tigray regional state is located in the northern part of Ethiopia. It shares boundaries with Eretria in the north, Sudan in the west, Amhara in the south and Afar in the east. According to CSA (2008), the population of Tigray was estimated at 4,314,456 people of whom 50.8% are female. About 19.5% of the population resides in urban areas showing a higher rate of urbanization in Tigray than it is in the SNNPR. The total land allocated to potato production in 2006/07 Meher season was estimated at 622 ha with a total production of 5,773.8 t. (CSA, 2007). The average yield was 9.29 t per ha which is relatively higher than the yield in the SNNPR. The total potato growers in the region were estimated at 37,361, which is about 5% of the households in the region. With the increase in the introduction of irrigation technology, the potential for potato production in the region is growing.

Potato V
2. RE
2.1 C
A valuproducprocesend arend arand thtranspodecisiotechniccommuinterac The mfor therefers producproduc
Accordlittle nproducThrougamoun
Value Chain A
EVIEW
onceptua
ue chain enct or servicess actors likre the produre consumehousands oorting, procons, etc. It cal supportunication, inct in differen
multitude of e consumer
to the sysct, cash andcer to the fin
ding to KIT egotiating
cts, and thegh their assnt of high-
Analysis and
OF LITE
al Framew
ncompassese from its prke input supucers – the ers, who eatof individuacessing, sto
also includt (extensionnformation nt ways star
functions thrs is also e
stem that cd value flownal consum
et al. (2006power and
e traders fasociations, f-quality pro
d Developmen
ERATUR
work of V
s the full raroduction toppliers, prodfarmers wht, drink and
als and firmoring, sellingdes a rangn), businesbrokering,
rting from lo
hat are perfexpressed onsists of
ws that makeer. Figure
Figure 1: V
6), farmers d make littlace a greatfarmers canoduct. The
nt in Ethiopia
4
RE
Value Cha
ange of aco its end useducers, pro
ho grow the wear the fi
ms, each pg, buying, pe of servic
ss enablingetc.). The v
ocal to natio
formed to pin the concactors ande possible t1 shows the
Value chain
who are inve money adeal of ris
n negotiatee trader in
a
ain
ctivities ande (Kaplinsky
ocessors, tracrops and
inal productperforming opackaging, ces needed and finanvalue chain
onal and inte
produce gocept of ma organizatithe transfere value cha
n Function
volved in thand have nk and can a deal withn turn has
d services ry, 2000). Vaaders and raise the ants. In the mone small checking, m
d in the valcial service
n actors andernational le
ods and market chain. ons, relatior of goods oain of functio
s
he supply chno incentivebuy only loh a trader ws a contra
required to alue chainsconsumersnimals. At th
middle are hstep in themonitoring, lue chain ines, innovatd service pevels.
ake them aThe marke
ons, functioor services fons.
hain functioe to improow-quality pwho buys aact with t
bring a s include . At one he other undreds e chain: making
ncluding tion and providers
available et chain
ons, and from the
ons have ove their produce. a certain the end

Potato Value Chain Analysis and Development in Ethiopia
5
users/consumers. The function through which each actor is prepared to invest and support other actors to maximize the benefit from the chain performance is known as a value chain. This makes the chain to function smoothly and develops the sense of benefiting all actors from having a smooth supply of top quality products in a sustainable manner. Value chain include direct actors which are commercially involved in the chain (producers, traders, retailers, consumers) and indirect actors which provide services or support the functioning of value chain. These include financial or non-financial service provides such as bankers and credit agencies, business service providers, government, researchers and extension agents. Figure 2 illustrates the general framework for value chain actors and support system.
Figure 2: Value chain actors and support framework
The chains can be simple when producers directly sell to the consumers but long and complex when the other actors play role in buying, processing, transporting and selling to the end user, the consumer. The complex chain, however, offers a multitude of choice to farmers. They may choose to supply a specific market segment, and produce the crop or animal that is tailored to that segment. They may also try to process their produce to add value to it: they may dry chilies rather than selling them fresh, or they may make cheese rather than selling the unprocessed milk or cook rather than selling row potato. Farmers need to understand the players in the chain and the requirements of the different branches so they can supply the product which that branch requires. That will increase their bargaining power in the chain, and improve their price they get for their product. This in turn increases farmers’ comparative advantage by increasing the volume of supply, quality of the
Global Retailers
Producers
Input suppliers
National Retailers
Wholesalers
Supporting Market
Cross cutting providers
Sector specific providers
Financial providers
Exporters
Processors

Potato Value Chain Analysis and Development in Ethiopia
6
product and consistency of supply, which is often possible when farmers act as a group (Mayoux, 2003)1
2.2 Value Chain Study Approaches
An approach used in value-chain analysis depends on the research question (Kaplinsky and Morris 2001). Accordingly, four aspects of value-chain analysis have been applied in agriculture: i. Value chain mapping: a value-chain analysis systematically maps the actors
participating in the production, distribution, processing, marketing and consumption of a particular product (or products). This mapping assesses the characteristics of actors, profit and cost structures, and flows of goods throughout the chain, employment characteristics, and the destination and volumes of domestic and foreign sales.
ii. Identifying the distribution of benefits of actors in the chain: Through the analysis of margins and profits within the chain, one can determine who benefits from participation in the chain and which actors could benefit from increased support or organization. This is particularly important in the context of developing countries (and agriculture in particular), given concerns that the poor in particular are vulnerable to the process of globalization.
iii. Examining the role of upgrading within the chain: Upgrading can involve
improvements in quality and product design that enable producers to gain higher-value or through diversification in the product lines served. An analysis of the upgrading process includes an assessment of the profitability of actors within the chain as well as information on constraints that are currently present. Governance issues play a key role in defining how such upgrading occurs. In addition, the structure of regulations, entry barriers, trade restrictions, and standards can further shape and influence the environment in which upgrading can take place. Possible forms of upgrading include: process upgrading, product upgrading and function upgrading.
iv. Role of governance in the value-chain: Governance in a value-chain refers to the
structure of relationships and coordination mechanisms that exist between actors in the value-chain. Governance is important from a policy perspective by identifying the institutional arrangements that may need to be targeted to improve capabilities in the value-chain, remedy distributional distortions, and increase value-added in the sector.
By systematically understanding these linkages within a network, one can better prescribe policy recommendations and, moreover, further understand their reverberations throughout
1 Participatory Value Chain Analysis, DFID and Institute for Development Policy and Management at the
University of Manchester and Women in Sustainable Enterprise (WISE) Development Ltd. Available at http://lists.man.ac.uk/mailman/ listinfo/enterprise-impact

Potato Value Chain Analysis and Development in Ethiopia
7
the chain. The value chain approaches apply the following tools and steps (Berg et al., 2005): Different value chain study tools parallel the approaches discussed above. Generally, six sets of tools are used: (i) the analysis starts with prioritizing a commodity for value chain development; (ii) mapping of the value chain; (iii) analysis of the value chain performance in terms of costs, prices and margins; (iv) analysis of technology, knowledge and upgrading possibilities through assessment of gaps in technology and knowledge and existing or future opportunities; (v) value chain governance which is used to identify stakeholders influencing governance, rules and regulations and their enforcement and (vi) linkages among the stakeholder, referring to their relationships. For detailed description of value chain tools see Annex 1.
2.3 Application of Value chain Analysis in Potato
Value chain approach is used by many organizations across the globe. Following the pioneering contributions, of Porter (1985) who focused on how individual firms can create value and build up their competitive advantage and Gereffi (1994) who focused primarily on the economic governance patterns in “global” value chains, different institutions and individuals applied value chain approach. The World Bank Group is already engaged in value chain studies in various countries and regions of the world, including Africa, Latin America, Central Asia, South Asia, East Asia, and the Middle East and North Africa. In addition, many other international development agencies such as GTZ, USAID, the ComMark Trust and International Labour Organization use the approach. FAO is currently utilizing value chain approach for livestock development in IGAD countries. The application of value chain analysis in agriculture is growing due to market failure and non competitive setting of small scale agricultural production. Value chain and innovations are also interlinked. Improvement in productivity and competitiveness of the value chain is the litmus test for value chain innovation (Anandajayasekeram and Gebremedhin, 2009). The concept of value chains has been extended to the analysis of globalization (Gereffi and Korzeniewicz 1994; Kaplinsky 1999). However, value chain research related to potato is scanty. Most literature and research in the past has focused on potato production and some on marketing. The potato value chain conducted in Bhutan (Joshi and Gurung, 2009) analyzed the context of potato production, mapped chain actors, factors affecting value chain and chain relationships. A case study of the potato value chain conducted in Kenya has shown that contract farming can be used to reduce transaction costs and risks, and to improve the organization and governance of value chains by creating stable business relationships (Kirumba et al., 2004). The study also indicated that potato value chain is constrained by a number of market and institutional failures. The potato chain in Kenya is fragmented, characterized by little cooperation and integration, cartels, high transaction costs, deep mistrust, price inefficiencies and quality losses. Horticulture value chain study conducted in Eastern parts of Ethiopia indicated that potato is one of the major horticulture crops exported to Djibouti and Somali land (Emana, 2008).

Potato Value Chain Analysis and Development in Ethiopia
8
The same study indicated that potato accounted for about 70% of the total vegetables (i.e. 42,172.5 t) marketed in 2007 in Kombolcha district of eastern Ethiopia. The major constraints of marketing identified by the same study include lack of markets to absorb the production, low price for the products, large number of middlemen in the marketing system, lack of marketing institutions safeguarding farmers' interest and rights over their marketable produces (e.g. cooperatives), lack of coordination among producers to increase their bargaining power, poor product handling and packaging, imperfect pricing system and lack of transparency in market information communications. In potato marketing, low prices offered for ware potato used to be reported by producers. This is attributed to non-diversified potato consumption culture in the country. However, recently, processing and consumption of value added potato products, such as chips is showing an increasing trend especially in urban areas. A study by Agajie et al. (2007) indicated that demand for potato chips by both high and low income households has increased in recent years especially in Addis Ababa. Therefore, the sector has great potential for growth. This future growth should be geared towards improving the performance of the whole potato value chain. It is also important to link value chain with innovation system perspective in agricultural research for development so that one re-enforce the other.
2.4 Seed and Ware Potato Production in Ethiopia
2.4.1 Seed potato production and marketing system The production of high-grade basic seed remains a key constraint in the development of a competitive potato seed industry in Eastern and Central Africa. In Ethiopia several varieties of potato are grown by farmers some of which are local and others are improved varieties. About 20 varieties have been reported to be grown in different parts of Ethiopia (Gebremedin et al., 2008). Seed systems can be defined as the ways in which farmers produce, select, save and acquire seeds (Sthapit et al., 2008). Different authors classify seed systems into different types. Struik and Wiersema (1999) and Endale et al. (2008a) classified seed systems into informal and formal, while others classified the system into local and formal (World Bank, 2009), or farmers’ and formal (Almekinders and Louwaars, 1999). The farmers’, informal or local seed systems cover methods of local seed selection, production and distribution (Louwaars, 2007). The formal seed systems cover seed production and supply mechanisms operated by public or private sector specialists in different aspects of the seed system, ruled by well-defined methodologies, with controlled multiplication, and in most cases regulated by national legislation and international standardization methodologies (Louwaars 2007). The informal seed potato system is a seed potato system in which tubers to be used for planting are produced and distributed by farmers without any regulation. This seed system exists in all potato growing areas of Ethiopia. It is the major seed potato system. According to Gildemacher et al. (2009), it supplies 98.7% of the seed tubers required in Ethiopia. The seed tubers supplied by this system have poor sanitary, physiological, physical and genetic qualities (Lemaga et al., 1994; Mulatu et al., 2005; Endale et al., 2008b; Gildemacher et al., 2009).

Potato Value Chain Analysis and Development in Ethiopia
9
There is no public formal seed potato supply system in Ethiopia. The contribution of the formal seed potato system to the overall seed tuber use in Ethiopia is very meager as both the private sector and the cooperatives are at the incipient stage (Hirpha et al 2010). The Ethiopian Seed Enterprise (ESE) is not involved in seed potato production and supply because of its limited capacity and there is only one modern seed Potato Company in Ethiopia, i.e. the SolaGrow PLC (ibid).
2.4.2 Major problems of seed potato The supply of quality seed tubers is insufficient. All the three seed potato systems operating in Ethiopia have problems in undertaking their functions as a seed system (Hirpha et al., 2010). The major problems reported are poor in health, unsuitable physiological age, poor genetic quality, impurity (varietal mix-up), and physically damaged and inappropriate seed size. These constraints can be explained in some details as follows: i. Disease: Late blight [Phytophthora infestans (Mont.) de Bary] is common in all potato
growing areas of Ethiopia. It is the most important and damaging potato disease worldwide. Because of the use of home saved seed, use of seed potatoes of unknown origin from local markets, limited use of resistant varieties, poor storage practices like leaving potato underground un-harvested and only limited adoption of haulm killing and selection practices by farmers, the seed tubers used by most potato producers are of poor quality.
ii. Use of small seed size: Ethiopian smallholder farmers commonly practice saving tubers for seed that are too small and inferior to be sold for consumption (Mulatu et al., 2005; Endale et al., 2008a; Gildemacher et al., 2007).
iii. Seed potato physical damage: Physical damage includes cuts, bruises and holes, inflicted on tubers during harvesting, storage, packaging and transportation. Use of sharp/long fork tools to dig out tuber, throwing potato during harvest, packing potato in sack and transporting on donkey back, piling one sack on another and transporting by lorry, unsafe loading and unloading from lorry contribute to physical damage of potato seed.
iv. Use of potato seeds of unknown origin: Farmers usually use varieties of unknown origin and improved varieties are not available to the majority of the farmers. Long dormancy period of potato (stored for more than 3 months in eastern parts of Ethiopia) and lack of well sprouted good quality seed potato tubers are also among key potato seed problems frequently raised by potato growers. Potato growing farmers in Ethiopia do not usually remove haulms which greatly improves sprouting of potato seed (Assefa, 2011). According to Assefa (2011) farmers are key innovators especially in enhancing potato seed quality by controlling dormancy by removing the flowers after tuber maturity and maintaining the tuber in the soil.
2.4.3 Ware potato production Ethiopia has suitable edaphic and climatic condition for the production of high quality seed potato and ware potato. About 70% available agricultural land is located at an altitude of

Potato V
1800-22006). The stindicatproducproducconstit3). OroShashmajor s Given Tigray environexpand The soNationregionWolytain Oropotato
The avIndeedmuch improvvarietieimprov
Value Chain A
2500 m wh
tudy by Tetes that thection of 1.ction is deptute 46%, 3omia is a memene, thesuppliers of
the highly rto nationa
nmental rehding potato
outhern ares’, Nationa. The majo
a, Kambataomia. The f
twice a yea
S
verage yield a recent slow compar
ved varietiees, locationved seed is
Analysis and
ich is suita
esfaye et ae total acrea28 million picted on F34%, 19% amajor potatoe rift valley f potato.
rugged topoal potato phabilitation production
ea of Ethiopalities and or potato pr, Siltie and favourable ar using rain
Figure 3:
Source: Comp
d of potatostudy put tred to the p
es ranges b and other fbetween 19
d Developmen
able for pot
al. (2002) oage of pota
tons (CSAFigure 4. Aand 1%, of o producing area, east
ography andproduction and investm.
pia where Peoples’ Roducing zoSidama in climate an
nfall.
Proportion
uted from CSA
o in Ethiopihe nationalpotential 50between 19factors. Und9 and 38 t/h
Oromia46%
SNNPR19%
nt in Ethiopia
10
tato produc
on productiato in EthioA, 2008/09Accordinglythe nationaregion dueand west H
d past envircannot be
ment in irrig
potato is gRegional Stones in this the SNNPR
nd soil cond
n of potato
A sample agri
ia is estimal average yt/ha elsewh
9 t/ha to 46der farmersha for differe
Tigra1%
a
ction (Solom
on and maopia exceed9). Regiona, Oromia, al potato pre to the ecoHararghe an
ronmental de understatgation infras
rown, is mate (SNNParea are G
RS and Wesditions ena
produced
cultural surve
ated to be yield of potahere in the 6 t/ha repos’ condition,ent varieties
y
Amahara34%
mon, 1987
arketing of ds 160,000 al distributAmhara, Sroduction, rological suitnd west Sh
degradationed. In rec
structure, fa
ainly locatePR) and paGurage, Gast Arsi zone
able Shashe
by regions
y data
8 t/ha Tesato at 10.5 world. In Et
orted on-sta the averags at differen
as cited in
potato in ha with an
tion of theSNNPR andrespectivelytability of arhewa which
, the contribent years,
armers have
ed in the Sartly in the amo Goffa, e and Shasemene to
s
sfaye et al.t/ha which
thiopia, theation depenge yield repont locations.
Tasew,
Ethiopia n annual e potato d Tigray y (Figure reas like are the
bution of due to
e started
Southern Oromia Hadiya, hemene produce
, 2007). h is very yield of
nding on orted for

Potato Value Chain Analysis and Development in Ethiopia
11
3. METHODOLOGY
3.1 Data Source and Method of Collection
Different approaches of data collection and analysis were employed in this study. Brief descriptions of the methodologies used are given as follows:
i) Review of literature: The assessment started with review of relevant literature on ware and seed potatoes. Project documents, reports, published and unpublished documents, website data, publications of the International Potato Centre (CIP), CSA data and MOA data were reviewed. Moreover, concepts of value chain and value chain study tools were reviewed and used for training the stakeholders for a clear understanding of the concepts and approach to build their capacity and also apply it for the collection of data used in this report. The review of the literature is integrated into relevant sections of this report.
ii) Participatory training and data collection: The data were collected in a participatory manner by involving project stakeholders in Tigray and SNNP regional states. For this purpose, training workshop was conducted for 2 days in both regions: in Hawassa on May 9-10, 2011 and in Mekele on May 30-31, 2011. The workshop served dual purposes viz. training of participants on concepts of value chain through learning by doing approach and secondly collection of actual data on potato value chain through group discussions. The participants were representatives of farmers and traders, regional research institute, regional agriculture bureau, cooperatives, agricultural marketing agency, NGOs, and the project staff. The training involves concepts of value chain, the purpose of value chain, how the potato value chain benefits the poor, general approach to value chain studies and application of the value chain studies in potato, identification of value chain actors, economic analysis in potato including the actors’ margins, constraints in potato value chain and expert suggestions for interventions. The training approach was presentation of theory, concepts and application tools by consultants and group work by the participants to apply the tools to potato sector of the region. The results of the group work were presented to the plenary and discussed. Potato value chain maps of the respective region and identification of actors and constraints were done during the workshop. Because of the immense experiences of the workshop participants, relevant data on potato value chain actors, chain support service systems and constraints were identified. The role of the producers and traders who participated in the workshop was significant. Following the training, orientation was given on the survey questionnaire prepared for actual data collection. Market visits were made at three major markets (Shashemene, Hawassa and Mekele) in the study areas to get in-depth understanding about potato market channels, actors, costs of marketing, and consumption of potato.

Potato Value Chain Analysis and Development in Ethiopia
12
Survey questionnaire and data collection: Primary data were collected through structured questionnaire from main value chain actors such as farmers, traders (wholesalers and retailers), processors, brokers, transporters, consumers (household and institutions) and support providers (MFIs, Research, Bureaus of Agriculture). For each actor a separate questionnaire was prepared and administered to respondents by value chain trainees. In Tigray region the questionnaire for producers and traders (retailers, wholesalers) were translated into Amharic to help the trainees quickly understand and properly convey to respondents. The questionnaire used for each of the actor is given in Annex 1. A total of 202 respondents of whom 160 potato producers (8 female), 40 retailers (22 female) and 12 wholesalers (1 female) were interviewed (See Annex 2). Moreover, about 40 potato retailers (55% female) were interviewed (see Annex 2). Similarly, 16 potato wholesalers were interviewed at the three major potato markets i.e. Shashemene, Hawassa and Mekele. The wholesalers in the different markets have close market linkage tracing the sources of potato supplied to different markets. Wholesalers sell in bulk whereas retailers sell potato in small quantities as needed by the consumer. The data collection instrument is given in Annex 7.
3.2 Data Analysis
The data collected from different sources were analyzed using descriptive statistics. The tools of value chain analysis indicated in chapter 2 and described in Annex 1 were applied. The results of the analysis are presented in the following chapter.

Potato Value Chain Analysis and Development in Ethiopia
13
4. RESULTS AND DISCUSSION
4.1 Potato Seed System
Potato growers used seeds from different sources. Most common seed sources are farmers themselves. Some farmers select small sized potato, from the ware potato, and use them as seed. The notion of producing potato for seed purpose is a new phenomenon in Ethiopia.
4.1.1 Seed potato production and marketing in SNNPR and Shashemene
Potato varieties In the southern part of the country including the project sites, farmers recognize local and improved potato varieties. The improved varieties (often also grown for long in the area) are Agea (farmers call Agazi), Jalene, Gudene, Netch Ababa, Key Ababa, and China (Table 1). The local ones seem to have been grown in the area for longer periods and farmers consider them as own seed and hence local. In Hulla woreda, the largest proportion of the farmers (71%) grows the local seed. Among the improved potato varieties, Netch Ababa and Jalene are the most widely grown in Hulla woreda, mostly due to the “Better Potato for Better Life” project.
Table 1: Proportion of sample farmers growing potato varieties in Hulla and Shashemene (%)
Woreda Local Variety Jalene Gudene Nech
Abeba Key Abeba Agazea China
Hulla 71 11 5 11 3 - -
Shashemene 25 4 4 54 - 32 4
In Shashemene area which is considered to be the hub of potato seed supply, Nech Ababa (local name for white flowering potato” and Agazea are popularly grown. The two varieties are considered as disease resistant and preferred by the farmers. They are also evaluated as being good in taste and having relatively longer shelf life.
Potato seed marketing In both Hulla and Shashemene woredas, the farmers are the major buyers of the seed potato produced in the area. The survey result shows that 57% of the informal seed potato growers in Hulla woreda sold it to fellow farmers whereas the proportion of seed potato growers in Shashemene woreda who sold it to other farmers is 50% (Table 2). This indicates that farmer to farmer seed transfer (through market mechanism) is a dominant seed distribution system in the study areas. The second important seed potato marketing channel is through intermediaries such as traders and brokers. The brokers play an important role in Shashemene area where they purchase the potato from the producers and sell to wholesalers. Cooperatives are entering

Potato Value Chain Analysis and Development in Ethiopia
14
into potato seed business and hence started buying potato for seed and ware potato production. Accordingly, 25% of the producers in Shashemene area sold seed potato to cooperatives.
Table 2: Proportion of farmers at Hulla and Shashemene selling seed potato to different buyers (%)
Buyers of seed potato Hulla woreda Shashemene woreda
Trader 21 17
Broker 8
Processors 14
Cooperative 25
Producers 57 50
NGO 7
Source: Own survey data (2011)
Potato seed distribution channel The potato seed flow system in the study areas is mapped based on the primary data from producers and traders. The seed potato flow principally starts from Shashemene area which serves as a HUB for the potato seed supply system (Figure 3). Every 2-3 years, the Shashemene farmers replace the potato seed grown in their area by the seed produced in Arsi/Bale with the main aim to reduce disease susceptibility. Thus, Arsi and Bale zones are also major seed sources in the seed potato supply system.
Figure 3: Potato seed flow system in the south: Shashemene is a HUB
Shashemene
Tigray Region
Aleta Wondo (Hulla)
SNNPR (Hawassa)
Arbaminch area
Asela, Bale
Hararghe
Central Shewa
Wholesale channel from main supply
Local wholesale and retailing
Final user
Sales center

Potato Value Chain Analysis and Development in Ethiopia
15
Potato seed is purchased from Shashemene by wholesalers and transported to major towns like Mekele, Hawassa, Arbaminch and Hararghe (such as Harar, Haramaya, Langay, Gara Muleta, etc.). From these towns, the wholesalers sell the seed to other traders in smaller rural towns or directly to the farmers in their vicinity. It has been stated that potato seed from Aris/Bale is sold at Shashemene market and also the seed from Shashemene is sold to farmers in Arsi/Bale. The flow of the potato seed in either direction is used as a mechanism to reduce disease incidence by growing potato coming from a different environment.
4.1.2 Potato varieties grown in Tigray and seed distribution channel
Variety
The potato varieties used by the farmers in the Tigray region are local as well as introduced from other places. Varieties such as Gudene, Jalene and what farmers call Shashemene are the varieties grown in Shashemene area (Table 3). Other varieties might have been introduced from Holeta Agricultural Research Center, directly, or from Amhara region. In Atsibi-Wonberta woreda, most of the farmers grow new varieties of potato, which are introduced through the ‘Better Potato for Better Life” project. The project promoted Jalene and Gudene varieties by creating potato producer groups and created access to finance for the farmers who need to buy the seed. Farmers in Saesi-Tsaeda Emba woreda predominately grow the Shashemene variety, indicating that they rely on market to access seed potato. The “Better Potato for Better Life” project is one of the means by which the farmers accessed improved potato seeds.
Table 3: Proportion of sample farmers growing potato varieties in Tigray project woredas (%)
Woreda Local Variety Shashemene Jalene Gera Gudene Atsibi-Wonberta 3 - 42 36 18 Saesi-Tsaeda Emba 19 62 - 12 8
Source: Own survey (2011)
Marketing
The survey result shows that the producers sell their seed potato mostly to farmers in their area. For instance, producers in the two study woredas in Tigray sold approximately 54% of the seed potato produced in 2010 production season to other farmers (Table 4). Nowadays, NGOs and research institutions are involving in the strengthening local seed production by financially and technically supporting farmers’ groups. These institutions also purchase the seeds from the project beneficiaries to create access to seed for other farmers as well as to promote potato production. This also enables the local seed groups to access market for the seed. In Atsbi-Wonberta woreda ‘Better Potato for Better Life’ project is impacting the seed supply system where 12.50% of the producers sold the seed produced through the project and 4.17% of them sold it to NGOs.

Potato Value Chain Analysis and Development in Ethiopia
16
Table 4: Proportion of farmers selling potato seeds to different buyers (%)
Buyers Atsibi-Wonberta Saesi-Tsaeda Emba Trader 13 42 Broker 4 4 Cooperative 4 CIP 13 Farmers 54 54 Research institute 8 NGO 4
Source: Own survey data (2011)
Distribution channel
Potato farmers in Tigray region in general and in the project woredas in particular, use seed potato mainly coming from Shashemene. The seed arrives in Makele market and is then further sold to traders in the different woredas of the region (Figure 4). The distribution channel is, therefore, as follows: the wholesalers in Mekele buy seed potato from wholesalers in Shashemene and sell it to the retailers in woredas of the region or directly to the farmers. Some of the traders e.g. from Aduwa sell the seed potato to other woredas. It was also indicated that farmers consider potato seeds coming from Shashemene area as improved indicating the significance of the Shashemene as source of seed.
Figure 4: Potato seed flow system in Tigray
4.2 Ware Potato Production and Utilization in SNNPR and Shashemene
4.2.1 Ware potato production and productivity Production season: There are two main potato production seasons in Ethiopia: belg (January to June, short rain season), Meher (June to December, long rain season), residual moisture and irrigation based production systems. In many areas, the belg crop
Aduwa
Other woredas in Tigray
Mekele Hintalo Wajirat
Atsibi‐ Wonberta
Saesi-Tsaeda Emba
Wholesale channel from main supply source
Local wholesale and retailing
Shashemene
Final user
Sales center

Potato Value Chain Analysis and Development in Ethiopia
17
supplemented with irrigation constitutes the bulk of potato production. This is due to low incidence of the late blight and favorable market during this season. In SNNPR and Shashemene area, the main potato production season is the belg season. Calendar: The activity calendar of potato production in Hulla and Shashemene woredas is given in Tables 5 and 6 respectively. The majority of the producers prepare the land in January to February, plant it in February-March and harvest it during June-July. Thus, June-July is the peak potato production and marketing seasons which also characterized by low price.
Table 5: Potato activity calendar in at Hulla (% of producers undertaking the activities)*
Activity Jan Feb March April May June July August Sept Oct Nov Dec Land preparation 49 83 34 17 5 10 17 20 12 2 - 2
Planting - 5 68 54 2 - 7 15 15 7 - -
Weeding - - - 27 61 22 7 12 15 22 2 2
Harvesting 7 - - - 2 20 76 51 2 5 12 24
Marketing 7 2 2 - 5 7 46 44 24 15 7 20
* Number under each month indicates the number of responses for the specific activity * The shaded part is the predominant activity calendar; Legend: Common land preparation; peak planting time; common weeding time; peak harvesting time;
peak marketing time Source: Computed from Potato Producers survey
Table 6: Potato activity calendar at Shashemene (% of producers undertaking the activities)*
Activity Jan Feb March April May June July August Sept Oct Nov Dec Land preparation 68 29 7 - 4 7 32 25 - - 7 14
Planting 14 71 21 4 - - 11 25 - 7 - -
Weeding - 4 50 57 18 - 4 7 11 14 11 -
Harvesting 7 - 4 4 25 61 36 21 4 4 18 18
Marketing 18 14 11 - 14 32 29 36 18 11 32 14
* Number under each month indicates the number of responses for the specific activity. * The shaded part is the predominant activity calendar. Legend: Common land preparation; peak planting time; common weeding time; peak harvesting time;
peak marketing time Source: Computed from Potato Producers survey
Productivity: In the SNNPR, due to high population density, the land size is small compared to the land holding in Shashemene area. Hence, the area located to potato production is small. During 2010, farmers in Hulla woreda, on average, allocated 0.28 ha to potato whereas the area allocated to potato in Shashemene woreda is 0.45 ha/HH.

Potato V
Moreo10.4 t/reportegrowinmanag
Table
WoredHulla Shash
Source: Figureaveraglocatio
4.2.2 PThe reproduct and Shashhigh. Tper hoseed, Shashthat wi
Value Chain A
ver, the ave/ha in Hullaed in the liteng which is gement prac
7: Average
da
hemene : Computed f
5 reveals tge yield of tons where S
Figure 5: P
Source: Co
Potato proesult of theced per hou4.9 t respemene (67
The averageousehold in
about 22%emene worll be used a
‐
10
20
30
40
50
60
Hou
seho
lds (%)
Analysis and
erage potat woreda (Terature. Thusually locactices. Ther
e yield of p
N M40 28
from survey
that the maheir respec
Sheshemene
Proportion
omputed from
oduction ae househo
usehold durectively (Ta%) was sole quantity oHulla and S
% and 14%redas respeas seed in t
< 5
59
11
d Developmen
to yield is hiTable 7). In e low yield al or old imre is also a
potato for ra
Minimum 0.6 1.6
data
ajority of thective areas. e performs
of househ
m survey data
and utilizaold survey ring 2010 prable 8). Thld. The conof ware potShashemen
% of the pectively. Obhe next sea
5.1‐10
18
57
nt in Ethiopia
18
igher in Shaboth sites, may be attproved varihuge yield
ainfed syst
Maximum61.5 64.0
e producersThe result sbetter.
holds produ
a
ation shows tharoduction sehe largest ntribution oftato producne, respectiotato prodviously, the
ason.
10.1‐15
14
Yield level
Mean yield
Mean yield
a
ashemene (the averag
tributed to tety, poor sedifference a
tem in 2010
Mean10.414.3
in both stushows a cle
ucing differ
at the avereason at Huproportion f ware potaced and conively. As owuced was
ese seed tu
15.1‐20
8
(t/ha)
H
S
for Shashemen
d: Tulla = 10.4
(i.e. 14.3 t/hge yield is lothe type of eed quality,among the h
0/11 produ
Std. D11
udy areas hear yield va
rent levels
rage quantiulla and Shof the pro
ato to the fonsumed wawn potato isused for sbers are in
20.1‐25
5 4
Hulla (N=39)
Shashemene (
ne =14.2 t/ha
4 t/ha
ha) as compower than tvariety farm, disease, ahouseholds
uction year
Deviation 14.2 15.4
arvested beriation betw
of yield (%
ity of wareashemene
oduce espeood securitys 0.42 t an
s a major soseed in Hufact ware p
>25
10 14
(N‐28)
pared to the level mers are and poor s.
(t/ha)
elow the ween the
%)
e potato was 1.6
ecially in y is also nd 0.94 t ource of ulla and potatoes

Potato Value Chain Analysis and Development in Ethiopia
19
Table 8: Potato production and utilization per household in Hulla and Shashemene woredas
Woredas Production (t)
Utilization (t) Utilization (%)
Consumption Seed Sold Consumption Seed Sold
Hulla 1.6 0.4 0.4 0.8 26 22 52
Shashemene 4.9 0.9 0.7 3.3 19 14 67 Source: Computed from survey data
4.3 Ware Potato Production and Utilization in Tigray
4.3.1 Production and productivity Calendar: In Tigary, the largest proportion of the potato growers stated that land is prepared between December and January and planting in January to February for the irrigated field and in June for the rainfed fields. Thus weeding other crop management practices are done starting from February (for the irrigated) and July (for the rainfed). The two peak harvesting times are between June and July and between October to December (Table 9).
Table 9: Potato production activities in Tigray
Activity Jan Feb March April May June July August Sept Oct Nov Dec Land preparation 38 21 25 31 37 19 25 26 18 16 37 46
Planting 48 24 11 4 23 34 12 12 20 - 3 15
Weeding 15 33 34 22 8 15 44 40 23 16 12 5
Harvesting 8 1 7 7 26 38 12 13 18 29 26 32
Marketing 16 1 2 7 19 25 14 14 13 21 23 24 * Number under each month indicates the number of responses for the specific activity * The shaded part is the predominant activity calendar;
Legend: Common land preparation; peak planting time; common weeding time; peak harvesting time; peak marketing time
Source: Computed from Potato Producers survey Productivity: The survey result shows that farmers at Atsibi-Wonberta woreda grow potato more on irrigated area (0.47 ha) compared to rainfed area (0.18 ha). Generally, the area allocated to potato production is small in Saesi-Tsaeda Emba woreda. The average area allocated to potato (irrigated as well as rainfed) is about 0.2 ha in Saesi-Tsaeda Emba woreda whereas the average area per household in Atsibi-Wonberta woreda is 0.35 ha. The average yield reported by the sample potato producers was 7.5 t/ha in Saesi-Tsaeda Emba woreda and 8.4 t/ha at Atsibi-Wonberta woreda under rainfed system (Table 10). The average yield level in this region is smaller than the average in Shashemene (14.2 t/ha). The low yield may be attributed to the type of variety farmers are growing which is usually local or old improved variety, poor seed quality, disease, and poor management practices. As shown in Figure 6, larger number of farmers produce below average yield, showing that

Potato V
improvfarmer
Table
Wored
Atsibi-
Saesi-Emba
Source
Figure
Source
4.3.2 PAnalysfarmerSaeesproporproducmarketitems, Potato0.3t of which 0.5t (1
Hou
seho
lds (%)
Value Chain A
ving the vars and impro
10: Averag
da
-Wonberta
-Tsaeda
e: Computed
e 6: Propor
e: Computed
Potato prosis of the prs producedi-Tsaeda w
rtion of the ced was sot purposes meet socia
o also makef the ware pis about 9%4%) of pota
‐
5
10
15
20
25
30
35
40
45
<
32
29
Analysis and
riety and move the food
ge yield of
ProducsystemRainfed
IrrigatedRainfed
Irrigatedfrom survey
rtion of hou
from survey
oduction aotato produ
d an averagworedas res
produce wld during thwith the aim
al obligation
es part of thpotato produ% of the prato for own
5 5
38
9 29 31
d Developmen
managemend security o
Potato for
tion
d
d data
useholds p
data
and utilizauction and ge of about spectively dwas sold in he same yem to generaor investme
he diet of tuced was croduction ofseed.
5.1‐10
1
35
43 42
nt in Ethiopia
20
nt of potatoof their hous
the 2010/1
N Minim
34 0.49 0.
28 2.45 0.
producing d
ation utilization i3.7t and 3.uring 2010 both woredar. This indate income ent.
he househoconsumed pf the house
10.1‐15
15 14
29
18
Yield level
a
o can increseholds.
1 producti
mum Maxi
.4 32
.1 32
.4 13
.4 40
different le
n the two w4t of ware production
das. On avdicates that
which can
olds. In theper househoehold. The p
15.1‐20
12
16
7
l (t/ha)
Atsibi‐W
Atsibi‐W
Saesi‐Tsa
Saesi‐Tsa
ease the yi
on year (t/h
imum Me
2.0 82.0 9
3.3 70.0 8
vels of yie
woredas of potato in A
n year (Tabverage of 7
potato is mbe used to
e project sitold in 2010 producers a
20.1‐25
Wonberta, rain
Wonberta, irrig
aeda Emba, ra
aeda Emba, ir
eld level fo
ha)
ean SDev
.6
.7
.5
.4
ld (%). Tigr
f Tigray shoAtsibi-Wonbeble 11). The5% of ware
mainly produo access oth
es in Tigraproduction
also retaine
>25
3 6
fed (N=34)
gated (N=49)
ainfed (N=28)
rrigated (N=45
or many
Std. viation 6.5 7.8
3.3 6.5
ray (%)
ows that erta and e largest e potato uced for her food
y, some season
ed about
2
5)

Potato Value Chain Analysis and Development in Ethiopia
21
Table 11: Potato production and utilization in Tigray
Woredas Production (t)
Utilization (t) Utilization (%)
Consumption Seed Sold Consumption Seed Sold
Atsibi-Wonberta 3.7 0.3 0.5 2.8 9 14 77 Saesi-Tsaeda Emba 3.4 0.3 0.5 2.5 10 15 75 Source: Computed from survey data
4.4 Value Chain Actors and Functions in SNNPR
Value chain actors are classified as those individuals who take ownership of a product, through the exchange of money or equivalent goods or services, during the transaction process of moving the product from conception to the end user. Those individuals or firms providing a service without taking ownership of the product are classified as service providers. The primary actors in a potato value chain in both regions are seed and other input suppliers; farmers; traders; brokers; processors; retailers; and consumers. Each of these actors adds value in the process of changing product title. The main processes of potato value chain include input supply, technical support (extension service), production, processing, trading, and consumption. The functions performed by the chain actors are depicted in Figure 7. The description of the value chain functions and actors is given in the subsequent sub-sections. Table 12 lists the major actors of value potato value chain in the study areas.
Figure 7: Processes and functions in potato value chain in SNNPR
Source: Own formulation based on the field survey
Input supply Production Processing Trading Consumption
• Ploughing
• Ridging
• Planting
• Fertilization
• Weeding
• Pest/disease
control
• Harvesting,
storage
• Boiling
• Frying
• Sorting • Packaging • Grading • Transporting
• Fertilizer
• Seed
• Chemicals
• Fungicide
• Farm Tools
• Technical
support
(Advice)

Potato Value Chain Analysis and Development in Ethiopia
22
Table 12: Summary of potato value chain actors and functions
Potato Function Actors performing the function Input supply • Cooperatives, unions, federations
• Government institutions agriculture office (extension advise), research (seed), etc.;
• Farmers, farmers groups • Private companies; NGOs
Production • Smallholder farmers; farmers groups; cooperatives Processors • Street vendors
• Supermarkets • Cafeteria
Grading • Whole sellers; retailers; farmers • Collectors
Consumption • Urban and rural residents • Universities; hospitals prisoners; military • Hotels; cafeterias; cafe
Source: Compiled from workshop discussion
4.4.1 Input suppliers Potato farmers in the study areas, get seed from different sources. For instance, in Hulla and Shashemene woredas, the majority of the sample producers (54% and 48%, respectively), used their own seed (Table 13). Regarding fertilizers, some farmers used only organic fertilizer (manure and compost) while some farmers used both inorganic and organic fertilizers depending on the land size allocated to potato and the soil fertility status as perceived by the farmers. Potato growers obtained fertilizer from either cooperatives or private traders. Pesticides are supplied mostly by private vendors.
Table 13: Sources of potato seed in study areas (% of respondents)
Woreda N Own seed Market, traders MoA Cooperatives Hulla 41 54 32 5 10 Shashemene 28 48 44 4 4
Source: Computed from survey data
The intensity of fertilizer and input use is given in Table 12. Only 69% of the sample farmers responded that they applied fertilizer to potato field in Hulla woreda. The reason indicated for not using fertilizer were the use of organic fertilizer and high fertilizer price. In Hulla, the rate of fertilizer application by those users is also low (79 kg/ha). The rate of fertilizer and input use is higher in Shashemene area than it is in Hulla (Table 14).

Potato Value Chain Analysis and Development in Ethiopia
23
Table 14: Proportion of framers and amount of fertilizer and seed used, Hulla and Shashemene
Woreda N Proportion
of HH
Fertilizer Seed Average amount
(kg/HH) Rate
(kg/ha) Average amount
(t/HH) Rate (t/ha)
Hulla 41 69 22 79 0.4 2.0 Shashemene 28 100 75 167 0.7 1.8
Source: Computed from survey data
4.4.2 Potato producers The next major potato value chain actors following input suppliers are potato growers. They are generally smallholder farmers having different land size. CSA’s agricultural sample survey estimated the number of Ethiopian smallholder potato growing farmers at 1,386,670 in 2006/07 production year of whom 430,582 were in SNNPR. This implies that 31% of potato producers in 2006/07 were farmers in the SNNPR. There might be some increase since then but the general trend will not change much within just four years. The descriptive statistics of land allocated to potato in Hulla and Shashemene woredas during 2010/11 production year is given in Table 15. Potato production in these two woredas was based on rainfed system and insignificant number of farmers indicated that they had used irrigation. As one moves to the rift valley area, the intensity of using irrigation for potato production increases. In Shashemene area, potato is produced at least twice using rainfall. Larger land size was allocated to potato in Shashemene woreda (0.5 ha) as compared to Hulla (0.2 ha).
Table 15: Descriptive statistics of land allocated to potato in the south, rainfed in 2010/11 (ha/HH)
Woreda N Minimum Maximum Mean Std. Deviation Hulla 41 0.1 0.5 0.2 0.2 Shashemene 28 0.1 1.8 0.5 0.4 Note: No irrigated potato during the year Source: Computed from potato producers survey data Potato growers are the major actors who perform most of the value chain functions right from farm inputs preparation on their farms or procurement of the inputs from other sources to post harvest handling and marketing. The major value chain functions that potato growers perform include ploughing, ridging, planting; fertilization, weeding, pest/disease control, harvesting and post harvest handling. The most difficult function according to the farmers is ridge making, since it is labour intensive. Cropping system: Potato sole cropping is the most popularly practiced production system in both regions. More than 90% of producers reported that they practice sole cropping (Table 16). Farmers also occasionally intercrop potato with other crops like maize and beans.

Potato Value Chain Analysis and Development in Ethiopia
24
Table 16: Potato cropping methods (% of respondents)
Woreda N Cropping method
Sole crop Intercropped
Hulla 41 92 8
Shashemene 28 89 11
Source: Computed from producers survey data Post harvest handling: Post harvest handling, which includes different activities like sorting, grading, packing, storing, transportation, loading and unloading, is done by the farmers themselves or traders or brokers. If potato is sold at the farm gate which is the case in Shashemene woreda, all aforementioned activities are performed by the buyer (traders or broker). After harvesting, potatoes are collected in sacks of various sizes ranging from 60 kg to 180 kg, a common measurement unit in Shashemene woreda. Most of the farmers use sacks and ground floor of their residential house as a potato store (Table 17). The majority of the farmers store potato in sacks in Hulla woreda, which is not very common in Shashemene. Sorting and grading: The producers separate damaged and undamaged tubers. The bruised and damaged potato is consumed by the household. They select medium and large sized ware potatoes for immediate sale and keep small sized potatoes for seed. Using small size potato for seed is a common practice widely accepted by farmers in all the study areas.
Table 17: Proportion of potato producers using different stores in Hulla and Shashemene (%)
Type of store Percentage of Respondents
Hulla (N=41) Shashemene (N=28) Sacks 42 12 In house floor 52 72 In the soil 6 4 Warehouse 12
Source: Computed from producers survey data
Transportation: In most of the potato growing areas, the producers transport their potato to the nearby markets be it rural or urban centers. However, in Shashemene area which is the hub of potato production in the country, traders go to the farmers’ field and negotiate about price, purchase it and eventually transport the potato to urban markets. Traders prefer to buy on farm to get advantage of packing a lot of potato in large sacks but later sell it in smaller sacks. Means of transportation varies among locations but predominately on pack animals (donkey). Sixty eight percent of farmers in Shashemene and 66% in Hulla transported potato to the market by donkeys while about 29% of the producers in Shashemene area used trucks (Table 18).

Potato Value Chain Analysis and Development in Ethiopia
25
Table 18: Percent of producers using different means of transporting potation the south
Woreda N Means of transportation
Donkey Horse Truck Cart Hulla 41 66 29 6 - Shashemene 28 68 - 29 4 Source: Computed from producers survey data
4.4.3 Traders/Brokers Brokers play crucial role in potato marketing system of Ethiopia by facilitating potato transaction by linking producers with traders, a wholesaler with another wholesaler, and wholesalers with retailers. The role of brokers in potato selling at Shashemene woreda is high as indicated by 92% of the producers. However, only 7% of the producers in Shashemene area indicated that they sold potato through brokers (Table 19). In Hulla woreda, only 21% of the producers stated the interferences of brokers in potato marketing and none of them sold through brokers. The brokers sometimes go beyond facilitation of transaction and tend to control and fix prices, create price symmetry and make extra benefits from the process. The brokers in many parts of the country and here work in unregulated and informal way. They do not follow proper business conduct and as a result they constrain the marketing system more than they facilitate it.
Table 19: Proportion of farmers who sold ware potato through different channels in 2010/11 (%)
Actor Hulla (N=41) Shashemene (N=28) Trader 85 86 Broker - 7 Consumer 10 4 Processors 5 4 Coop 5 - Source: Computed from producers survey data
4.4.4 Potato processing Potato is commonly consumed in the form of boiled and cooked meals in different traditional dishes or 'wot'. Recently, consuming potato chips, crisps, and roasted potato are becoming common practices especially in cities like Addis Ababa, Hawassa, Adama, Mekele, etc. In urban areas it is also usually consumed mixed with other vegetables as salad. Large scale potato processing is non-existent in Ethiopia. Few processors were interviewed during the survey although they could not tell about the volume of potato processed as the product is sold mixed with different products like vegetables. Hence, it is hardly possible to report on the volume of potato processed in the study areas. Those few processors interviewed said that they prefer large size potato for processing. Consistent with other research findings, Jalene variety is preferred for processing in Hawassa and Shashemene. Supermarkets started to sell potato products like chips and crisps. In large cities like Addis Ababa, it is common to see hotels, restaurants and cafes prepare French Fries from

Potato Value Chain Analysis and Development in Ethiopia
26
potatoes. Urban consumers when out for recreation go along French Fries for snacks. Street vendors also prepare French Fries and supply to consumers at dusk. What is limiting potato consumption in Ethiopia is that very little is known to make different dishes from potato. Household consumption is limited to using potato stew, boiled and sometimes fried potato. One of the major constraints to increased production that has not been addressed is “utilization” (Gebrenedhin et al., 2008).
4.4.5 Potato retailers Retailers are key actors in potato value chain in Shashemene and Hawassa. They are the last link between producers and consumers. They mostly buy from wholesalers and sell to urban consumers. Sometimes they could also directly buy from the producers. Retailers not only sell potato but also trade other vegetables. Consumers usually buy the product from retailers as they offer according to requirement and purchasing power of the buyers. During the market visit, it was observed that retailers keep small amount of potato compared to tomato, onions and other vegetables. Retailers were asked how long they have been in potato retailing business. The response shows that retailers in Hawassa have business experiences of range between 2 and 17 years. A retailer, on average, purchased 186 kg per week in Hawassa (Table 20). Potato retailing activities are effectively undertaken on average for 6 months while the remaining period is slack period with limited potato transaction.
Table 20: Quantity of potato handled by retailers and effective months of potato trading
Woreda Variable N Minimum Maximum Mean Std. Deviation
Hulla Age of the retailer 11 18 35 26 6 Year since potato retailing started 17 2 17 7 4
Shashemene Potato purchased per market day (kg) 17 20 750 186 203
Months of potato trading/year 17 1 12 4 3
Source: Computed from producers survey data
4.4.6 Potato consumers About four types of potato consumers were identified: households, restaurants, cafés, and institutions which give services such as higher education institutions, hospitals, etc. (see Table 21). Overall the per capita potato consumption was 33 kg and 17 kg at peak (7 months) and slack (5 months) seasons respectively for all consumer types making the average annual per capita consumption about 50 kg. Peak season of potato consumption coincides with the harvest time and the slack season is when potato from local supply declines. Higher institutes provided higher demand for potato since the students cafeteria offers 500 kg per day for about 2,000 students during peak supply period and 300 kg during slack period. This implies that the per capita consumption at the university is 60 kg per person since there is regular budget allocated for the students service and potato provides alternative relish to meat.

Potato Value Chain Analysis and Development in Ethiopia
27
Table 21: Potato consumption in Hawassa
Institution Amount consumed per year (t per institution) Amount (kg/capita)
Household 0.3 50 Restaurants 5.2 Café 0.4 College of Agriculture, Hawassa University 19.2 60 Source: computed from consumer survey
Consumers prefer big potato with smooth skin and free from damage. Restaurants, hotels and higher institutes prefer bigger potato size whereas households prefer medium size potato.
4.4.7 Potato support service providers Support service providers are essential for value chain development and include sector-specific input and equipment providers, financial services, business management services, and market information access and dissemination, technology suppliers, advisory service, etc. The key support providers for potato in the SNNPR are pictorially depicted in Figure 8. Some service providers extend service beyond one function and others are limited to a specific function. For instance, agriculture offices provide service at input level, production and processing levels. whereas NGOs like the World vision participate in input supply. There is no organization involved in promoting the nutritional dimension of potato in the project sites (SNNPR).
Figure 8: Map of support service providers for potato
Agricultural development office provides agricultural extension services to farmers through development agents. The office provides advisory service, facilitate access to inputs and provide technical support in crop protection. One should note that the there is no specialized extension services for potato growers except that potato is considered as just one of the vegetables. Application of knowledge of general agriculture is not sufficient. The key informant’s interview shows that the producers get extension service on general
Input supply Production Processing Trading Consumption
MOA
International Org (CIP)
MOA/Research
NGOs
MOA
NGOs‐world vision
Banks
Transport
Marketing Agency
NGOs
Potato Value Chain Analysis and Development in Ethiopia
28
agriculture and it is not sufficient to improve the technical skill of the farmers. As the experts who participated in training workshop confirmed, specific knowledge and skill in production management of potato is lacking and the agriculture experts apply what they learnt for horticulture or vegetables to potato. In the SNNPR, “Better Potato for Better Life” is the only potato specific program providing input and innovation services to farmers. It focuses mainly on creating access to quality seed potato and technical support through capacity building. NGOs provide training service on potato production. Some traders get credit from banks if they can provide collateral. But this service is very much limited. About 9 research centers and 1 university are involved in developing potato variety for wider adaptation, high yielding and resistant to biotic and abiotic stress. These are Holeta, Kulumsa, Jima, Bako, Hawassa, Adet, Sinana, Alamata, and Mekele from agricultural research centers and Haramaya University from higher institutions. In the project areas where this study was conducted, varieties released from Holeta have been introduced and being adopted. Reports also show that Holeta research center is prominent in improved potato variety development in Ethiopia. Of the 18 improved varieties of potato that have been released between 1987-2006, Holeta research center was involved in the release of 14 improved varieties while Haramaya University released the remaining balance. The other research centers popularize the varieties released by Holeta research center for wider adoption by the farmers in their vicinity.
4.4.8 Value chain governance The dominant value chain actors play facilitation role. They determine the flow of commodities and level of prices. In effect they govern the value chain and most other chain actors subscribe to the rules set in the marketing process. The assessment made indicates that the wholesalers assisted by the brokers are the key value chain governors. They have sufficient information about the supply of potato and which direction it flows along the marketing channels and markets in different parts of the country. They also set prices. The wholesalers in different markets are well networked but informally. For instance, a potato wholesaler in Shashemene networks (via telephone communication) with wholesaler in Mekele, Dire Dawa, Harar, Addis Ababa, etc. These traders exchange information on potato prices, local supply situation and the prospects of harvest in their area. Then, they agree on the price at which the buyer is willing to take the price so that the seller determines the farmers’ price taking into account his profit margins. Except this networking and business relation, there is no formal collateral when the transaction takes place. Money is transferred through banks and often the wholesalers in the different markets had never personally met. List of some potato wholesalers in Shashemene and Mekele is given in Annex 6. The smallholder farmers are not organized and are not governing the value chain. Hence, they are price takers and hardly negotiate the price due to fear of post harvest loss, in case the product is not sold. The value chain governance is similar both in the SNNPR and Tigray. The major source of market information is the neighbours who sold potato during

Potato Value Chain Analysis and Development in Ethiopia
29
the previous market days. Recently the use of cell phone in the rural areas is increasing. It is a rare phenomenon for the farmers to receive potato market price through mass media.
4.5 Value Chain Actors and Functions in Tigray
The major actors of potato value chain in Tigray are similar to that of the SNNPR as summaries in Table 11 and discussed below.
4.5.1 Input suppliers Similar to farmers in the SNNPR, the farmers in Tigray region access seed potato from different sources. In Saesi-Tseada Emba woreda the majority of the farmers (76%) purchased the seed from traders/market while farmer in Atsibi-Wonberta woreda access seed potato from more diverse sources (Table 22).
Table 22: Sources of potato seed in study areas (% of respondents)
Woreda Own Market, traders MoA Cooperatives Other
farmers, NGO,
project, CIP Research
Atsibi-Wonberta 26 7 28 7 7 11 17
Saesi-Tsaeda Emba 27 76 7 2 - - -
Source: Computed from survey data
The source of fertilizer as well as the situation of utilizing organic fertilizer (manure and compost) is similar to that of the SNNPR. Potato growers obtain fertilizer from either cooperatives or private traders. Pesticides are supplied mostly by private vendors as well as through the agriculture office. The intensity of fertilizer and input use is given in Table 23. The results show that in both project woredas, the rate of fertilizer application averages at 169 kg/ha at Atsibi-Wonberta woreda and 178 kg/ha at Saesi-Tsaeda Emba. It was also indicated that about 10% of the potato growers did not report the use of fertilizer. The potato planting rate also averages at 2.3 t/ha and 2 t/ha at the respective woreda.
Table 23: Proportion of framers and amount of fertilizer and seed used, Tigray
Fertilizer Seed
Woreda Proportion of HH
Average amount (kg/HH)
Rate (kg/ha)
Average amount (t/HH)
Rate (t/ha)
Atsibi-Wonberta 100 44 169 0.7 2.3 Saesi-Tsaeda Emba 90 32 178 0.4 2.0
Source: Computed from survey data
4.5.2 Potato producers In Tigray potato is produced by smallholder farmers. According to CSA data, there were 37,361 potato farmers in Tigray during 2006/07 production year, which is 3% of the national potato growers. The survey result shows that farmers produce potato using rainfed and irrigated systems. An average of 0.3 ha of land is allocated per HH in Atsibi-Wonberta

Potato Value Chain Analysis and Development in Ethiopia
30
woreda and 0.2 ha in Saesi-Tsaeda Emba (Table 24). There is also variation among the households in terms of land allocated for potato production.
Table 24: Land allocated to potato production (ha) in Tigray in 2010/11
Woreda Farming system Minimum Maximum Mean Std. Deviation
Atsibi-Wonberta Rainfed 0.1 0.4 0.2 0.1Irrigation 0.1 1.2 0.5 0.9Total 0.1 1.2 0.3 0.5
Saesi-Tsaeda Emba Rainfed 0.1 1.0 0.2 0.2Irrigation 0.1 0.4 0.2 0.1Total 0.1 1.00 0.2 0.1
Source: Computed from potato producers survey data
Potato is produced mainly as a sole crop and intercropping is done by only few farmers (Table 25). Relatively larger proportions (about 7%) of the farmers in Saesi-Tsaeda Emba woreda intercrop potato with other crops than their counterparts in Atsibi-Wonberta woreda. Farmers also grow potato intercropped with other crops like maize and beans occasionally.
Table 25: Potato cropping methods (% of respondents)
Woreda Cropping method
Sole crop Intercropped Atsibi-Wonberta 98 2
Saesi-Tsaeda Emba 93 7
Source: Computed from producers survey data
Sorting and grading: Similar to the situation in the SNNPR and Shashemene, farmers select relatively bigger size potato and sell it as ware potato. Damaged and small sized potato is used for consumption and seed. Though there is some degree of price differentiation based on potato quality, prices are set arbitrarily and enhance discouraging farmers from sorting potato. Potato is stored under different conditions. A more diverse storage option is available at Atsibi-Wonberta woreda and especially 15% of the sample respondents stated that they use warehouse for potato storage which is provided through projects. The largest proportion of farmers in Saesi-Tsaeda Emba woreda stores potato in sacks, which a traditional way of storing potato. Some 28% of the farmers in this woreda store potato in the soil i.e. delay the harvesting with the expectation of price rise (Table 26).
Table 26: Proportion of farmers using different types of stores (%)
Type of store Percentage of Respondents Atsibi-Wonberta Saesi-Tsaeda Emba
Sacks 33 56 In house floor 36 16 In the soil 15 28 Warehouse 15

Potato Value Chain Analysis and Development in Ethiopia
31
Source: Computed from producers survey data
Transportation: Means of transporting potato is predominantly done by pack animal and truck in both study woredas in Tigray (Table 27). In Atsibi-Wonberta, 5% of the respondents reported that they transport potato by humans.
Table 27: Transportation means to take potato to market
Woreda
Percentage of respondent Donkey Truck Human
Atsibi-Wonberta 80 15 5 Saesi-Tsaeda Emba 62 38
Source: Computed from producers survey data
4.5.3 Traders/Brokers
In both Atsibi-Wonberta and Saesi-Tseada Emba woredas, the majority of the producers directly sold potato to traders (Table 28). The second larger group of farmers sold the product directly to consumers while 4% sold the produce to cooperatives and CIP (as it facilitates the finance for purchase of the seed by other needy farmers). From this, it is possible to understand that at producers level, the distinction between seed and ware potato is low confirming with the traditional definition of defining the seed potato as small sized potato.
Table 28: Proportion of producers who sold potato to different buyers (%)
Woreda Trader Broker Consumer Processors Cooperatives CIP Atsibi-Wonberta 56 2 31 4 4 4 Saesi-Tsaeda Emba 91 7 26
4.5.4 Potato processing Small scale processors who make chips in Mekele buy potato from retailers or the producers, process it and sell it. The major processors are the cafés and restaurants, processing potato sold together with other food items. Large scale processing of potato does not exist.
4.5.5 Potato retailers Retailers buy potato from the producers or from wholesalers to sell the product in smaller quantities to the consumers. They have business experience ranging from 1 to 11 years with an average of 4 years. The retailers practice potato trading for an average of 9 months per year though they also trade other vegetables to increase their business portfolio (Table 29). On average, the retailers market about 0.4 t per market day.

Potato Value Chain Analysis and Development in Ethiopia
32
Table 29: Quantity of potato handled by retailers and effective months of potato trading
Variable N Minimum Maximum Mean Std. DeviationAge of the retailer 25 18 50 31 9Year since potato retailing started 25 1 11 4 3 Potato purchase per market day (kg) 28 8 5000 389 991 Months of potato trading/year 25 2 12 9 3
Source: Computed from retailers’ survey data
4.5.6 Potato consumers Households and institutions are the ultimate consumers of potato. The per capita potato consumption was 24 kg per person per year with higher consumption rate during the peak potato supply period and during fasting period. The consumption rate of the institutions purchasing and using potato and the type of potato they prefer is given in Table 30.
Table 30: Potato consumption in Mekele (Amount per year)
Institution Amount consumed
per year (t per institution)
Consumption per capita (kg) Potato preference
Café 3.1 Medium size, circular, clean and bright color
Restaurants 3.4 Big size yellowish color Household 0.1 50 Medium size, circular, bright color Hotel 4.8 Yellowish color and big size Mekele University 4,00 29
Source: Survey (2011)
4.5.7 Potato support service providers The key support providers for potato in the study areas are pictorially depicted in Figure 8 since there is no structural difference between Tigray and SNNPR in this case. The major difference with the support structure of the SNNPR is a more concrete work on the nutritional aspect of potato by an NGO called Mums for Mums. In Tigray region, Mums for Mums is promoting consumption of potato by educating the farmers how to prepare various kinds of dishes/recipes from potato. This NGO has produced a manual on how to prepare various kinds of products from potato and how it can be prepared using local materials, according to the representative from the NGO at the workshop. This kind of initiatives should be encouraged in the future as it helps in diversifying potato markets and thereby create sustainable demand for potato. Agricultural development office provides agricultural extension services to farmers through development agents. The key informant’s interview shows that the producers get extension service on general agriculture and even technical to increase farmers production skill. Extension services, for example focus on compost making or land preparation. But the DAs themselves lack knowledge or skill regarding the fertilizer requirement and time of

Potato Value Chain Analysis and Development in Ethiopia
33
application of these inputs to potato. As the experts who participated in training workshop confirmed, specific knowledge and skill in production management of potato is lacking and the agriculture experts apply what they learnt for horticulture or vegetables to potato. In a similar approach some vegetable warehouses constructed by the Bureau of Agriculture in Tigray were found not suitable for potato due to its position relative to sun rise and design, though the major product in the area is potato. The farmers generally feel that there is no better extension advice given to them from the extension service. It appears that innovative ideas such as staggering the production system to catch up with the peak market demand for potato, investment in potato storage to enable farmers sell their produces when the price is relatively high, product quality improvement through sorting and grading, etc. are missing. The marketing agency along with the Cooperative Agency also supports potato marketing. Together with the cooperative office, the agency works on market linkage but all of them focus on cooperatives and little or no attention for individual farmers. CIP is the only NGO that provides potato specific services to farmers. It focuses mainly on quality seed potato supply.
4.6 Value Chain Analysis in SNNPR and Shashemene One of the dimensions of a value chain study is its flow, which is also called its input-output structure. In this sense, a chain is a set of products and services linked together in a sequence of value-adding economic activities. In other words, a value chain is a series of participants along the entire marketing spectrum who collaborate to satisfy market demands for specific products or services for their joint and collective mutual benefit. The key objective of value chain analysis is to find the most pressing bottlenecks first and address them in a systemic manner. These bottlenecks can be either issues related to functions, actors, linkages among them or even external factors such as policy and infrastructure. In addition, the isolation of the value added by each link in the chain can give useful clues to the areas where remedies are most needed, and where the most benefit is likely to follow from further focus of resources directed to improvement.
4.6.1 Value chain map Value chain mapping means drawing a visual representation of the chain, which involves various linkages among the potato growers, inputs and logistical service providers, transporters, middlemen and traders. The value chain map depicts the flow of potato in the market, activities carried out at each stage of the value chain, the structure of actors and the support involved in the value adding process. Figure 9 shows the potato value chain map in the SNNPR. The figure in parenthesis indicates approximate number of actors under the specified function. CSA’s sample agricultural survey estimated farmers that grow potato at 430,582 in SNNPR. The number of traders were estimated based on some of the evidences the workshop participates had. It was, however, difficult to get data on the number of input suppliers, processors and retailers.

Potato V
4.6.2 M
Quant
As disEthioppotato suppliesupplymarket(12%),
The ptranspothe easvia Ko
In
InpSu
Value Chain A
Marketing
tity of pota
cussed aboia. Based ois markete
ed from ary where Sht. The rem, Bale (8%)
Figure
potato purcorted to othst to Harargmbolcha m
Shama(SNNP
4%
Wondo1
nput supply
put uppliers
Analysis and
Fig
g analysis
to markete
ove, Shashon the discd in Shasheound Shasamama, Sh
maining balaand Arsi (5
e 10: Sourc
chased in her towns. Ighe where i
market. The
Arsi5%
Bale8%
ama PR)%
o Genet1%
S
Produ
Produc(430,5
d Developmen
gure 9: Pota
ed
hemene is tcussions maemene per
shemene whenta and ance come5%) (Figure
ce of potat
Shashemet goes to soit can be exlargest pro
e
Kofele12%
Sinkile4%
uction
cers 582)
nt in Ethiopia
34
ato value c
the largest ade with thyear. The l
while the SNSikile supps from diff 10)
o supplied
ene is onlyouth as far xported to Doportion of p
Trading
Traders (7475)
a
chain in SN
potato mare wholesallargest propNNPR supply equal pferent areas
d to Shashe
y partly coas Moyale,
Djibouti via Dpotato (46%
Shashe62%
Shent(SNNP
4%
Proc
NPR
rketing ceners, an estportion of thplies aboutroportion tos in Oromi
emene mar
onsumed lo, to the wesDire Dawa a
%) is also tr
mene%
ta PR)
cessing
Retailers
Processors
ter in the stimated 19,he product (t 12% of to the Shasia including
rket (%)
ocally and st to Arba Mand to Somransported t
Consum
Consu
southern 417 t of (62%) is the total hemene
g Kofele
largely Minch, to male land
to Addis
mption
umers

Potato V
Abababeyond
Figu
Potato
MarketPotatochannechannewhen tto urbachanneto reta
Channcase o
Chann
Chann
Chann
Chann
Channe
Value Chain A
a and part od. The des
ure 11: Des
Source
o market ch
ting channeo passes thels have beel occurs wthe farmer ban centers el is channeilers and th
Fig
nels 3 and 4of channel 4
H
nel 1:
nel 2:
Pnel 3:
Prnel 4:
Proel 5:
Analysis and
of this quatination of p
tination of
e: Data colle
hannels
els refer tohrough varioeen identifiewhen produbrings smalike it is in el 2 where e retailers t
gure 12: Ma
4 are very 4, farmers s
ModjoDebrez
7%
Moyale/ BuleHora/ Yabello
10%
Hawasa/ Dilla11%
Chuko/Alatawon
4%
Producers
Producers
Producers
roducers
oducers
d Developmen
antity is tranpotato mark
potato sup
ected by inter
the routesous channeed for ware cers directlll quantity oShashemethe farmersto final cons
arketing ch
much prevasell potato to
o/ zeit
e o
/ ndo
DuraArba
5
Consu
Wholes
Whole
Wholesa
Collecto
nt in Ethiopia
35
nsferred to keted in Sha
pplied from
rviewing who
s taken by els until it rpotato in th
ly sell it to of the produne areas. Ts sell it to wsumers.
hannels for
alent in Shao wholesale
ame/ minch5%
umers
salers
esaler1
alers
ors W
a
northern Eashemene i
m Shashem
olesalers in S
products frreaches thehe potato vathe consum
uct to markeThe most cwholesalers
r ware pota
ashemeneers and the
Addis AbNorth‐Et
46%
Ziway/ Bora4%
Retailers
Wholesaler
Retailer1
Wholesalers
Ethiopia reas given in F
mene marke
Shashemene
rom produce final consalue chain smers (chanet and whenommon typand whole
ato in the so
and Hawaswholesaler
baba/ thiop%
Kombolcha/ Hararge13%
a
Consum
r2 Reta
Reta
Retailer
aching MekFigure 11.
et (% of 19,
e market
cers to consumers. Sostudy. The nel 1). Thisn the farm i
pe of potatosalers in tu
outh
ssa marketsrs transport
ers
ailers
ailer2
rs C
kele and
,417 t)
sumers. ome five shortest
s occurs is closer
o market rn sell it
s. In the it to the
Consumers
Consumers
Consumers
s

Potato Value Chain Analysis and Development in Ethiopia
36
urban area where the potato is temporarily stored and sold to retailers. In the case of channel 4, the second retailers in the channel are Kiosk owners in urban areas who keep small amount of potato along side with other goods and sell to consumers who do not want to regularly travel to vegetable market to buy small amount of potato. Channel 5 is similar to channel 3 except that the collectors sell the product to wholesalers on farm after adding some margin on the price they paid to the farmers. This channel is common in Shashemene area. These farm level collectors make advantage of non-standard sack/bag size where they buy in large sack size weighing above 150 kg and sell it to traders in smaller sacks that weigh 100 kg or less. Use of non-standard containers negatively affects the producers by reducing their income. For seed potato three main channels were identified (Figure 13). The shortest channel is farmer to farmer seed potato transaction. Traders also buy seed potato from farmers and then sell it to other producers. In both regions, the role of traders is significant in terms of collecting seed from producers and selling it to the needy farmers. In Tigray, for example, wholesalers purchase seed potato from Shashemene and sell to the Tigray farmers.
Figure 13: Seed potato marketing channel in the south
Channel 1:
Channel 2:
Channel 3: Traders are the major buyers of ware potato in both Hulla and Shashemene woredas (Table 31). Moreover, only few producers sold potato to the consumers, which actually happen when the volume of potato supplied to the market is small.
Table 31: Proportion of farmers who sold ware potato to different actors (%)
Actors Hulla (N=41) Shashemene (N=28) Trader 92.1 88.9 Broker 5.3 7.4 Consumer 3.7 Cooperative 2.6
Source: Own survey (2011)
The survey result shows that 41% of the retailers purchased potato from the producers while 29% of them purchased from the wholesalers. Another 29% of the retailers purchase potato from the middlemen such as brokers. It also shows that the wholesalers sell most of the potato they trade to other wholesalers who transport the product to other regions or markets in the same region.
Producers Producers
Producers Traders Producers
Cooperatives NGOs Producers

Potato Value Chain Analysis and Development in Ethiopia
37
4.6.3 Economic analysis of potato value chain
Potato price analysis
Prices of agricultural products have peculiar nature where the prices drastically drop at harvest time and increase substantially during planting time. For potato the price variability between harvest and planting is very high due to perishability of the product. The potato price fluctuation is very high in the southern region. During 2010, the ware potato price at which the traders sell ranged from Birr 1,500 per ton at the peak harvest time to Birr 6,000 per ton during the slack season. The survey result shows that the farmers’ price ranged from Birr 800 per ton to Birr 6000 per ton in Hulla with an average of Birr 3,171 per ton. The price is further lower at Shashemene, with an average of Birr 2068 per ton (Table 32). The price of seed potato is higher by about 20%-50% of the average ware potato price due to late harvest of the potato seed, which means that the quantity of potato supplied to the market started to decrease and the price increases
Table 32: Average producer price (Birr/t) by location in 2010/11
Woreda N Minimum Maximum Mean Std. Deviation Hulla 38 1,000 6,000 3,171 1,799 Shashemene 33 1,000 3,700 2,068 1,003
Source: Computed from producers’ survey
Cost of potato production
The average potato production cost was estimated at Birr 8,750 per ha at Hulla and Birr 10,000 per ha at Shashemene. This means that the production cost was about Birr 1000 per t. The largest input cost is the seed and it appears that the producers in the south have access to relatively cheap potato seed as compared to their counterparts in Tigray. Table 33 shows the cost per ha and ton of production based on survey data.
Table 33: Cost of potato production in study areas (2010/11)
Woreda N Cost of inputs (Birr/ha)
Unit cost of production (Birr/t)
Hulla 41 8,750 1,094 Shashemene 24 10,000 1,020
Distribution of value addition
Each of the potato value chain actor adds value to the product as the product passes from one actor to another. In a way, the actors change the form of the product through processing or improve the grade through sorting, cleaning or washing or create space and time utility. The distribution of value addition among the potato value chain actors in Hulla woreda is depicted in Table 34. Value addition is the difference in sales price and cost of inputs (raw materials) at each stage of the value chain. Potato producers in Hulla woreda added 24% of the total value of ware potato in the woreda. Retailers are responsible for 59% of the value while wholesalers add about 17%. The price change from producer’s price and consumer price is 182%,

Potato V
which differeNyamocost. Twholesis highretailerunders
Table
Value Sales Cost oGross% of t
* Total
The poaddingWholethe totwhat fa
Table
Value Sales Cost oGross% of t
* Total
4.6.4 FThe mof lanpackagsafe trpotato Fertilitreportewhich for potmainta
Value Chain A
is high buntial betweongo, 2009The scale salers make making thers are notstate price a
34: Distrib
chain: price (Birr/kg
of raw materis Value addetotal value a
value added
otato produg a value osalers add tal value adarmers rece
35: Distrib
chain: price (Birr/kg
of raw materis Value addetotal value a
value added
Factors ofajor factors
nd, plantingging, fertilizransport, anvalue chain
ty of land:ed by the ffarmers stretato producain soil fertil
Analysis and
ut not as heen produc9). The high
of operatie small profem the domt as genuiand profit as
bution of va
g) ial d dded*
d= Birr 4.61 p
ucers in Shof Birr 0.5 pthe least (1
dded (Tableeive in Shas
bution of va
g) ial d dded*
d= Birr 2.35 p
f competits of competg materialser utilization
nd retail man is briefly d
: In Aleta farmers. Thessed that
ction. In addity.
d Developmen
high as in cers and hest profit ion of the fit margin p
minant valuene as pros they asso
alue additio
2.2
1.10 1.10 23.86
per kg
hashemene per kg whic5%) and th
e 35). The shemene is
alue additi
1.50
1.00 0.50 21.28
per kg
tiveness ititiveness ins, know-hon, farm dev
arketing. Hodiscussed a
wondo arehe soil in Smoisture re
dition, farme
nt in Ethiopia
38
other counconsumersis earned bretailers is
per unit of pe chain actooducers in ciate the inf
on among m
2.420.78
16.92
woreda rech is 21%
he retailers aprice differe 267%, whi
on among
2
1.65 0.35
14.89
in potato vn agriculturaow, producvices, qualityow, these faas follows.
a the soil iShashemenetention capers also pra
a
ntries suchs is as hiby the retas also sm
potato handors. It is also
informationformation w
major chai
3.2
2 8 2
ported loweof the totaadd Birr 1.5ential betwech is the hig
major cha
.00
2.20 1.50 63.83
value chaial and agro-ctive plantay control, cl
actors apply
is very suitne area is vpacity of theactice fallow
h as Kenyagh as 300ilers due toall. On theled but the
o good to non provision
with tax.
n actors at
6.25
3.52 2.73 59.22
er price of l value add
5 per kg wheen what cghest in all
in actors a
3.70
0 0 3
in -industrial pation, harveeaning and
y to and affe
table for povery fertile e soil in the wing land a
a, where th0% (Muthoo small opee other hair operationote that tradn. Traders/
t Hulla
Birr 1.5 peded in the ich is about
consumers the studied
at Shashem
products areesting tech
d grading, bect develop
otato produ(sandy-loaarea made
and crop rot
he price oni and erational and, the nal scale ders and /retailers
er kg by woreda. t 64% of pay and
d areas.
mene
e fertility hnology, randing,
pment of
ction as am type) e is ideal tation to

Potato Value Chain Analysis and Development in Ethiopia
39
Planting materials: Seed is the most important factor that affects potato yield. In the workshop as well as from producers’ survey results, it has been pinpointed that supply of improved potato varieties was inadequate. Thus, the supply of adequate good quality potato is determinant for improving potato supply to the market. Know-how: Through practices, the farmers gained good know how of potato production. Farmers’ know how agronomic management is improving over time due to the project: Better Potato for Better Life. The participants of the workshop indicated the improvement in crop management in the project areas compared to the non project areas. Farmers have modest knowledge on crop rotation though there is variability from location to location. Farmers have know-how on use of Ridomil to prevent potato late blight as reported during workshop held in Hawasa. Other important know-how missing among potato growers is fungicide and pesticide application on potato implying a poor extension service. Harvesting technology: Harvesting technology farmers use greatly matters to increase benefit generated from potato production. Farmers use traditional tools (sharp spades, hoe, sometimes pull the potato with hand to harvest), to harvest potato and as a result a lot of loss occurs. The loss at harvest is estimated at 20% in Alata Wondo Area. To protect quick wilting, farmers cover the harvested potato with leaves which is a good practice. Fertilizer utilization: Project farmers applied 0.079 t/ha in Hulla, which much less than the recommended rate and 0.167 t/ha in Shashemene area. The participants of the focus group discussion stated that the non-project farmers apply fertilizer far below recommended rate in SNNPR. In Shashemene area, some farmers have good culture of applying organic fertilizer (compost and manure) to their farm. Farm advice: No special farm advice tailored to potato production has been given in the study areas. DAs give extension service to farmers along side with other crops and their knowledge is also limited. Quality control: Quality of potato is mostly known through physical observations. Quality parameters used by consumers to select potato for consumption are size, color and no damage on potato tuber. There has been no potato quality control mechanism in the country be it seed production, ware potato transportation, and potato packaging. Cleaning and grading: Washing off-soils from potato, sorting potato according to size and damage on pulp are some of the cleaning and grading practices done by farmers in Aleta Wondo area. In marketing, potato traders grade ware potato and classify it into three main grades. Big size (flush) potato is classified as 1st grade, medium size is 2nd grade and small size and some bruises potatoes are classified as the third grade. Price varies according to such grades in the market. The price of seed potato depends on the variety and the season. Jalene is attracts the highest price among the seed potatoes and the price can is higher than the aware potato by 20-50%. Branding: No modern branding practices have been observed in all the study areas. Farmers use production area as branding to express quality differences. In Aleta Wondo area Durame Potato is quoted as best type. Other prominent potato variety Jalene which

Potato Value Chain Analysis and Development in Ethiopia
40
means we liked it. Shashemene potato is prominent brand especially for seed in Tigray region. In the future, branding system that is based on location which is currently used for coffee grading should be adopted for potato as well to increase the competitiveness of the product. Packaging: Potato packaging in modern business context is non-existent in all the study areas. However, chain actors use sacks, plastic materials, baskets to transport potato from production to consumption center. Safe transport: Poor transportation which leads to a lot of loss prevails in all the study areas. Some transporters load potato on floor of trucks and transport it a long distance which results in unpeeling of potato skin. One factor that greatly affects the competitiveness of potato value chain is lack of safe transportation means and equipments.
4.6.5 Constraints in potato value chain One of the merits of value chain approaches is that it helps to clearly identify bottlenecks to the development of the chain right from input supply up until the consumption level in vivid way. Figure 14 summarizes the constraints identified in this study which is common for both regions.
Figure 14: Core constraints in potato value chain
Marketing problems indicated by farmers include high seed potato price, brokers interference in the market and traders suppressing of potato price differences (Table 36).
Input supply Production Marketing/Trading
Processing Retailing Consumption
Shortage of improved and quality seed:
• Damaged and spoiled seed due to poor transporting and handling
Low yield Low irrigation facility;
Poor disease control
Less targeted to seed production
Perishability, storage facility;
Low skill in post harvest management;
Lack of storage facility
Lack of processing facilities; Low skill and technology for processing
Lack of facilities;
Lack of capital
Limited dishes/ recipes

Potato Value Chain Analysis and Development in Ethiopia
41
Table 36: Proportion of farmers indicating marketing problems in the south (% of respondents)
Marketing problems Hulla (N=41) Shashemene (N=28) Low price of ware potato 66.7 79.2 High seed potato price 5.6 8.3 Price fluctuation 11.1 4.2 Brokers interference 8.3 Trader give same price 11.1 No market 5.6
Source: Computed from producer survey data
The proportion of respondents indicating problems related to potato transportation is given in Table 37. Though there is slight variation among location, high transportation cost has been cited as the main problem of potato transporting. Poor road access to production areas, shortage of truck and perishability are key problems of potato transportation.
Table 37: Potato transportation problems proportion of farmers citing the problem (% of respondents)
Woreda High transport cost Poor road Shortage of truck
to transport Perishability
Hulla 69 15 8 8 Shashemene 57 21 21
Source: computed from producer survey data
One of the major problems in potato production in Ethiopia is post harvest loss. In some studies, post-harvest loss of 30-50% of the produce was reported (Endale et al. 2008b). That may be the reason why about 83% in Hulla and 53 % in Shashemene raised shortage of warehouse to store ware potato as the major post harvest problem (Table 38). Potato pest, perishability, lack of market outlet and lack of access road are other problems reported by farmers related to potato post harvest.
Table 38: Major problems related to potato post harvesting (% of respondents)
Harvest problems Hulla (N=41) Shashemene (N=28) Shortage of warehouse 83 53 Potato pest 13 47 Perishability 4
Source: computed from producer survey data
Seed problems have been manifested in different forms: inadequate supply; poor quality or mixed; untimely supply and delay in supply. Some varieties are susceptible to disease and pests (potato late blight). Supply of improved Jalene variety had been good for some time

Potato Value Chain Analysis and Development in Ethiopia
42
but now the variety is mixed with other poor quality seed potato as reported by some farmers in Aleta Wondo area. “Agazi” potato variety which has circular shape as described by consumers is highly preferred but unavailable in the market. This indicates that consumers demands are not communicated back to farmers through research and extension system. While Shashemene is the major supply source of potato seed for the farmers located at more than 100km radius, the area received little attention in terms of research and development support.
4.7 Value Chain Analysis in Tigray
4.7.1 Value chain map Figure 15 shows the potato value chain map Tigray. The figure in parenthesis indicates approximate number of actors under the specified function. According to CSA’s sample agricultural survey estimate, about 37,361 farmers in Tigray produce potato (Figure 15). Approximately 200 traders have license in vegetables marketing including potato. There are very few potato processors although several restaurants and cafes use potato chips and food which includes potato as a component. The contact address of prominent potato wholesalers is given in Annex 6.
Figure 15: Potato Value Chain in Tigray Region
4.7.2 Marketing analysis
Quantity of potato marketed
The estimates made by the wholesalers in Mekele indicates that a total of 1,800 t of ware potato was marketed in Mekele market during 2010. The product flow to the market fluctuates depending seasonality of production. Figure 16 shows the supply of potato to Mekele market in each month of the year 2010 and the pattern of this supply is the same every year.
Input supply Production Marketing/ Trading Processing Consumption
Input Suppliers
Producers (37,361)
Traders (<200)
Retailers (<100)
Processors (<10)
Consumers

Potato V
Potatofrom dTigray
F
Potato
The poFiguredominaabout purcha
Qua
ntity
(t)
Value Chain A
Figure 16:
o productiondifferent regproduces o
Figure 17: P
o market ch
otato marke 12. Howeates. Both 39% of the
ase potato f
0
50
100
150
200
250
300
350
Sept.Total 327.6
327.6
y()
Analysis and
Distributio
n within Tiggions is maonly 44% of
Proportion
hannels
eting channever, the cwholesaler
e retailers sfrom the wh
Oct. Nov6 109.2 90
6
109.29
Shasheme34%
A1
Gojam/Gond9%
d Developmen
on of quan
gray does narketed in f the potato
of Supply
els in Tigrachannel rers and retatated that tolesalers. T
v. Dec. Ja0 90 16
0 90
1
ene
ssala13%
der
nt in Ethiopia
43
tity of pota
not satisfy tTigray. Actraded in M
of potato t
ay are similapresenting ailers purchhey purchaThe remaini
an. Feb. M69.2 169.2
169.2 169.2
a
ato supplie
the regionaccording to Mekele (Figu
to Mekele m
ar to that ofpotato sa
hase from ase potato fing balance
March April120 237.6
120
237.6
T
ed to Mekel
l demand. some who
ure 17).
market (1,8
f the southeles by prothe produc
from the proe (4%) purch
May June60 120
60
120
Tigray region44%
le market (t
As a resultolesalers’ e
800 t in 201
ern region soducers to cers. Accooducers whhase from b
July Au188.4 158
0
188.4
15
t)
t, potato
estimate,
10)
shown in traders
ordingly, hile 57% brokers.
g.8.4
8.4
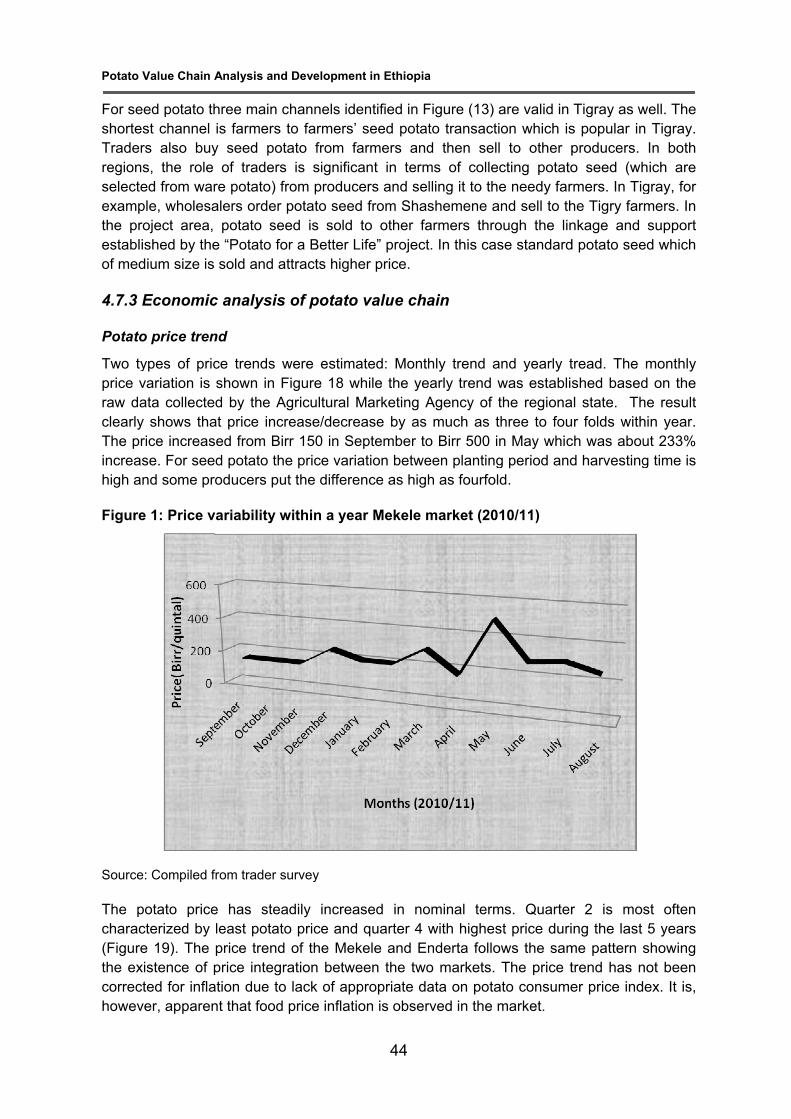
Potato V
For seshortesTraderregionsselecteexampthe proestabliof med
4.7.3 E
Potato
Two typrice vraw daclearlyThe princreashigh an
Figure
Source
The pcharac(Figurethe excorrecthowev
Value Chain A
ed potato thst channel rs also buys, the role ed from warple, wholesaoject area, shed by the
dium size is
Economic
o price tren
ypes of pricvariation is ata collectey shows tharice increasse. For seend some pr
e 1: Price v
e: Compiled f
potato pricecterized by e 19). The istence of pted for infla
ver, apparen
Analysis and
hree main cis farmers
y seed potof traders
re potato) fralers order
potato seee “Potato fo sold and a
c analysis
nd
ce trends wshown in Fd by the A
at price incrsed from Bired potato theroducers pu
variability w
from trader s
e has stealeast potatoprice trend price integr
ation due tont that food
d Developmen
channels ideto farmers’ tato from fas is significrom producpotato seeded is sold
or a Better Lttracts high
of potato
were estimaFigure 18 w
Agricultural Mrease/decrerr 150 in See price variat the differe
within a yea
survey
adily increao price andof the Mek
ration betwe lack of appprice inflati
nt in Ethiopia
44
entified in Fseed potat
armers andant in term
cers and seld from Shasto other fa
Life” projecter price.
o value cha
ated: Monthwhile the yeMarketing Aease by as eptember toation betwe
ence as high
ar Mekele m
ased in no quarter 4 wkele and Eneen the twopropriate daon is obser
a
Figure (13) ato transactid then sell
ms of colleclling it to theshemene aarmers throt. In this cas
ain
hly trend aarly trend w
Agency of tmuch as t
o Birr 500 ineen plantingh as fourfold
market (201
ominal termwith highesnderta folloo markets. ata on potarved in the m
are valid in on which is to other pcting potatoe needy farnd sell to th
ough the linse standard
nd yearly twas establisthe regionahree to foun May whicg period andd.
10/11)
ms. Quarterst price duriws the samThe price t
ato consumemarket.
Tigray as ws popular inproducers. o seed (whrmers. In Tighe Tigry farnkage and d potato see
tread. The shed based
al state. Thur folds withch was aboud harvesting
r 2 is mosng the last
me pattern strend has ner price ind
well. The n Tigray.
In both hich are gray, for mers. In support
ed which
monthly d on the he result hin year. ut 233% g time is
st often 5 years
showing not been ex. It is,

Potato Value Chain Analysis and Development in Ethiopia
45
Figure 19: Trend of retail potato price at two market centers in Tigary from 2007-2011 (Birr/kg)
Cost of production The average potato production cost was estimated at about Birr 14,500 per ha at Atsibi-Wonberta and Birr 16,000 per ha at Saesi-Tsaeda Emba. The production cost is relatively higher in Tigray as compared to in the SNNPR. Table 39 shows the cost per ha and ton of production based on survey data.
Table 39: Cost of potato production in Tigary
Woreda N Cost of inputs (Birr/ha)
Unit cost of production (Birr/t)
Atsibi-Wonberta 39 14,569 1,181 Saesi-Tsaeda Emba 45 15,938 938
Source: Own survey (2011)
Distribution of value addition
The distribution of value addition across potato value chain actors is depicted in Table 40. Value addition is the difference in sales price and cost of inputs (raw materials) at each stage of the value chain. In Atsibi-Wonberta, potato growers added about 36% of total value addition. Retailers made about 25% of total value addition while wholesalers added 39% of the potato value at the end of the value chain. The price differential between producer and consumer prices is 133% which is smaller than the margin in the southern part of the country.
0
1
2
3
4
5
6
7
8
9
Price (Birr/kg)
Mekelle Endaslasie
Q=Quarter

Potato V
Table
Value Sales Cost oGross% of t
*Total v
The prprice rsignificdifferehigher
Table
Value Sales Cost oGross% of t
*Total
4.7.4 FSimilarin potahow, pdevicefactors4.6.4. Fertilitsmall. creates Plantinlocal scompeShashKnow-and kn
Value Chain A
40: Distrib
chain: price (Birr/kg
of raw materis Value addetotal value a
value added=
rice of potatreported bycantly differnt at the Sa(49%) and
41: DistribEmba
chain: price (Birr/kg
of raw materis Value addetotal value a
value add
Factors ofr to that of ato productproductive
e, quality cos apply to anHere only ty
ty of land: Irrigation t
s huge opp
ng materiaseed potatoetitive situatemene is n-how: Farm
now how is a
Analysis and
bution of va
g) ial d dded*
= Birr 4.96 pe
to is generay value chrent from taesi-Tsaedthat of the
bution of va
g) ial d dded*
ded= Birr 5
f competitthe SNNPRion and maplantation,
ontrol, cleand affect deypical situat
The soil fetechnologieortunity for
als: The seo supply in tion by reduamed as immers lack talso limited
d Developmen
alue additio
3.001.20
1.80 36.20
er kg
ally higher ihain actors that of Atsia Emba anwholesalers
alue additio
3.50
1.00 2.50 49.02
.10 per kg
tiveness iR and Shasarketing in T
harvestinganing and gevelopment tions in Tiga
ertility is gooes increasin
increased p
eed supply ithe region
ucing transmproved varthe equipme. The impac
nt in Ethiopia
46
on among m
3.30
1.9539.20
n Tigray thin Saesi-T
bi-Wonbertnd the shares is smaller
on among m
3.850.65
12.75
in potato vshemene arTigray are fg technologgrading, brof potato v
ary are brie
od to promongly introduproduction a
in Tigray is n is increasportation coriety thoughent necessct on beeke
a
major chai
5.25 5
1 2
an in the STsaeda Emta. But the e of the pror (about 13%
major chai
4.50 4.9
1.9 38.2
value chairea, the mafertility of lagy, packagranding andvalue chain efly discusse
ote potato puced and aand produc
linked to thsingly emerost. In Tigra
h they are nary to apply
eeping is gro
n actors at
7.00 5.78
1.23 24.6
NNPR and mba is slig
total valueoducers in %) as show
n actors at
6.90 95
95 24
in ajor factors and, plantining, fertilized safe tranhas been ded.
production. adopted by ctivity.
hat of Shasrging and tay, the seeot necessary pesticide owing.
t Atsibi-Wo
Shashemehtly lower e added isthe value an in Table 4
t Saesi-Tsa
of competitng materialser utilizatio
nsport. Howdiscussed in
But the landthe farme
shemene. Hhis can res
ed that comrily improvefor crop pr
onberta
ene. The but not slightly
added is 41.
aeda
tiveness s, know-on, farm w, these n section
d size is ers. This
However, sult in a
mes from ed. rotection

Potato Value Chain Analysis and Development in Ethiopia
47
Crop Management: Similar to the situation in the SNNPR, the use of improved seeds is low. Hence, the productivity of the crop is low. However, if properly managed, the emerging irrigation facility can create a competitive condition for increased yield. Harvesting technology: Harvesting technology farmers use greatly matters to increase benefit generated from potato production. It is non-existent in the study areas. Farmers use traditional tools (sharp spades, hoe, sometimes pull the potato with hand to harvest), to harvest potato and as a result a lot of loss occurs. The loss at harvest is estimated at 20% in Alata Wondo Area. To protect quick wilting, farmers cover the harvested potato with leaves which is a good practice. Extension service: No special farm advice tailored to potato production has been given in the study areas. DAs give extension service to farmers along side with other crops and their knowledge is also limited. Quality control: Quality of potato is mostly known through physical observations. Size, color and no damages on potato tuber are used as quality criteria in ware potato selection. There has been no potato quality control mechanism in the country be it seed production, ware potato transportation, and potato packaging. Cleaning and grading: Washing off-soils from potato, sorting potato according to size and removing damaged ones are some of cleaning and grading practices done by farmers. In marketing, potato traders sort out and grade potato and classify it into three main grades and differentiate prices accordingly. Retailers mix different sizes when selling. Branding: No modern branding practices have been observed in all the study area. Packaging: Potato packaging in modern business context is non-existent in all the study areas. However, people use sacks, plastic materials, baskets to transport potato. Leaves are used to cover the sack to reduce evaporation. Safe transport: Poor transportation which leads to a lot of loss prevails in all the study areas. Some transporters spread potato on floor of the truck and transport long distance. Major means of potato transportation to market is on donkey pack and horse pack and by people and rarely by trucks.
4.7.5 Constraints in potato value chain Basically the potato value chain in Tigray is confronted with similar constraints in the SNNPR as illustrated in Figure 14, above. These are briefly discussed below:
• Input supply- Shortage of improved and quality seed potato, which is more serious in Tigray. Fertilizer application rate is reasonably high. But the supply of fertilizer depends on the time it is imported. Mostly, fertilizer is imported by considering the rainy season calendar in the planning frame. Irrigated vegetables use leftover fertilizer from the rainy season. Currently the problem is not significant as the rate of fertilizer adoption is the country in general is low. However, with the strengthening of the extension system which aims to double yield to transform the economy, the
Potato Value Chain Analysis and Development in Ethiopia
48
fertilizer adoption rate is expected to increase. This will definitely put pressure on irrigated agriculture, including roots and tuber crops.
• Production- Low yield due to inadequate agronomic practices and untimely supply of agricultural inputs such as fertilizer;
• Marketing- Marketing problems cited by farmers include high seed potato price,
brokers interference in the market and traders suppressing of potato price. As shown in Table 42, the largest proportion of the producers stress that low price of ware potato is a major problem followed by price fluctuation. Lack of grading and standards for potato created opportunity for the traders to determine weight and prices of the product. Farmers are generally price takers and the traders make margins whether the price increases or reduces.
Table 42: Proportion of farmers indicating marketing problems (% of respondents)
Marketing problems Atsibi-Wonberta Saesi-Tsaeda Emba Low price of ware potato 45 55 High seed potato price 16 10 Price fluctuation 26 24 Brokers interference 3 7 Traders fix price/lack of competitiveness 7 5 No market 3
Source: Computed from producer survey data
• Transportation problem: The proportion of respondents indicating problems related to potato transportation is given in Table 43. Though there is slight variation among locations, high transportation cost has been stated as the main problem related to potato transportation. Poor road access to production area, shortage of truck and perishability are key problems of potato transportation.
Table 43: Proportion of farmers stating transportation problem (% of respondents)
Woreda High transport cost Poor road Shortage of truck
to transport Persishability
Atsibi-Wonberta 28 17 42 14 Saesi-Tseada Emba 65 19 17 Hulla 69 15 8 8 Shashemene 57 21 21
Source: computed from producer survey data
• Storage problem: One of the major problems in potato production and marketing in Ethiopia is high post harvest loss. A post-harvest loss of 30-50% of the produce was reported in some studies (e.g. Endale et al., 2007). Lack of adequate storage is the major reason for post harvest loss. In this study, 63% of the producers in Atsibi Wonbertata and 62% in Saesi-Tseada Emba stated shortage of warehouse as the

Potato Value Chain Analysis and Development in Ethiopia
49
major problem resulting in post harvest losses (Table 44). Potato pest, perishability, lack of market outlet and lack of access road are other problems reported by farmers related to potato post harvest.
Table 44: Major problems related to potato post harvesting (% of respondents)
Harvest problems Atsibi-Wonberta Saesi-Tsead a Emba Shortage of warehouse 63 62 Potato pest 15 15 Perishability 15 15 No market 4 6 No Road 4 3

Potato Value Chain Analysis and Development in Ethiopia
50
5. RECOMMENDATIONS FOR VALUE CHAIN DEVELOPMENT
A value chain is a supply chain consisting of the input suppliers, producers, processors and buyers that bring a product from its conception to its end use. A value chain approach to development seeks to address the major constraints at each level of the supply chain, rather than concentrating on just one group (e.g., producers) or on one geographical location. Constraints often include a lack of technical, business or financial support services, lack or a difficult regulatory framework, poor public infrastructure (roads, telecommunications, electricity, etc.), a lack of information about or weak connections to end markets, and/or inadequate coordination between firms. The studied value chains i.e. that of the SNNPR and Tigray are constrained by similar problems as discussed under sections 4.6.5 and 4.7.5 respectively. Thus, the similar interventions will be needed unless uniquely specified below. The interventions are also based on the suggestions given in the participatory value chain assessment. A summary of the recommendations is given below and the details are given in Annex (5 ).
5.1 Summary of Interventions
Input supply i. Establish and/or strengthen cooperatives/groups that engage in potato seed
production to achieve the economies of scale needed to meet producers’ high demand for improved potato seed;
ii. The study found out that Shashemene area is the hub of the seed potato supply for different areas in the country. Farmers of the area have long experience of good-quality potato production for seed or consumption purposes. Farmers of the area have comparative advantage in terms of location and agroecology. Along with increasing the traditional seed supply system, introducing improved seed production and marketing system can significantly contribute to the solution. The seed potato producers can then be linked with ware potato producers to create access to market for their business.
iii. Farmers continue to use improved potato variety distributed sometimes ago. Obviously, the productivity of the seed declines overtime. Thus improved potato seed replacement system should be put in place by involving the relevant stakeholders like Ministry of Agriculture, Bureaus of Agriculture, Research Institutions and Seed Producers. The system should enable farmers to replace the improved varieties at regular interval.

Potato Value Chain Analysis and Development in Ethiopia
51
Storage facilities
Potato is highly perishable agricultural product. In all the study areas lack of storage facilities for ware and seed potato was raised by farmers and other actors as a priority problem. In few places where there is DLS farmers started to benefit a lot. It was also reported that in some places (in Tigray) DLS was inappropriately designed and constructed by some NGOs and the government department which eventually was not utilized by farmers. Therefore,
i. It is recommended to expand DLS in high potato producing areas as per standard DLS design and construction. Through technical support to the farmers, cost effective mechanism of expanding DLS should be considered.
ii. Build capacity of the government staff especially DAs to control the quality of the DLS constructed at household level. Training and experience sharing for local business persons may stimulate construction of DLS to making earning out of it. Individual farmers can invest in storage facilities if they are well aware of the benefits and could increase their productivity. This requires capacitating farmers’ entrepreneurship.
Production Producing diverse types of potato varieties can create attractive market. From consumer and processor surveys, it was learnt that preference for potato varies from location to location and by consumer type. Higher institutions and restaurants and cafes prefer large sized potato that can be easily peeled. Household consumers prefer medium sized local varieties such as Durame in the southern region. In most study areas variety called Jalene which is also an improved variety released by Holeta Agricultural Research Center is highly preferred but seed is in short supply. This variety is also confirmed by food specialist as the best quality potato for processing into chips and crisps.
i. Therefore, the extension system should be capacitated to communicate this and relevant feed back to the producers. Awareness raising program on potato food value and its processing techniques can promote potato consumption in the urban areas through health extension agents.
ii. Potato specific technical recommendations should be adequately disseminated to increase potato production and productivity. The extension service should take up potato as essential commodity and enhance its productivity.
iii. Input provision should be adequately scheduled to meet the cropping calendar of
irrigated crops such as potato.
iv. Crop protection in Tigray is said to be set back due to lack of chemical sprayers. Cost sharing sprayer supply mechanism should be put in place. It is suggested that projects or the extension department avails sprayers and farmers pay reasonable service for the use.
Potato Value Chain Analysis and Development in Ethiopia
52
Transportation In the potato market survey, it was observed that potato is transported over long distance either spread on floor of the truck or put in congested sacks. During loading and unloading, there is mishandling of the products which lead to quick spoilage and high loss.
i. It is important to establish potato transportation standards and enforce it;
ii. Local seed production may reduce the need for long distance transportation. Hence, enhance the potato seed production in the project regions. For the ware potato, create awareness on potato transportation. It is also essential to establish linkage between producers and traders and promote the relationship between quality and price. As this goes along, the traders start to demand the use of appropriate means of transporting potato.
Marketing i. Standardization of weighing scale in a participatory manner is needed through legal
framework that defines standard measurements and mechanisms of protecting the uneducated farmers from being exploited. Build the capacity of the producers to claim their right. Moreover, providing weighing facility for the cooperatives contributes to realization of claiming the right. Awareness raising for traders and brokers on this is necessary.
ii. Brokers operate without license. As they do good in linking buyers and sellers, they also distort prices to make hidden margin from the deal. It is suggested to advocate for licensing the functions of brokers where they will be accountable for their actions. Building their capacity on how cooperation in value chain development is beneficiary and their role.
iii. Organize and capacitate producers to enhance their negotiation power and skill.
iv. Create value chain forum at woreda level where the different value chain actors come together and discuss the problems of potato value chain and solve them.
Processing Potato processing facilities were non-existent in all the study areas. Introduction of potato varieties will increase the supply. Along this, it is important to introducing potato processing facilities that can induce consumption and also increase shelf life of the product. Involving the private sector in the enhancement of the processing of potato can result in sustainability of the intervention.
Consumption i) The demand for the product in the total consumption bundle of rural and urban
consumers is small which means that the product fetches low price. The low consumption attributes to lack of knowledge to prepare different recipe, dishes,
Potato Value Chain Analysis and Development in Ethiopia
53
products from potato by most consumers in Ethiopia. Therefore, promotion of potato utilization through demonstration different ways of utilizing potato for food can induce higher demand their by motivating the producers to produce more.
ii) At a household level, it is good to emulate the experience of Mums for Mums in
Tigray to create awareness on nutrition value of potato and different ways of processing potato to make it part of household diet.
iii) At an industry level, nearly no one is processing potato. Starch and alcohol could be
produced from potato though there is a need for economic feasibility of the business. As the production of potato booms, it will be necessary to bring on board the potential industries such as starch extractors, alcohol producers and food complex industries such as the ones listed in Annex 5.
5.2 Intervention Strategy
The implementation of the above recommendations may require the adoption of the following strategies.

Potato Value Chain Analysis and Development in Ethiopia
54
Table 42: Strategic intervention areas and actions to be taken
Strategic intervention areas Supportive Tasks/Action
1. Strengthening seed and ware potato production, marketing linkages among key actors
• Foster horizontal cooperation among seed potato producer groups, cooperatives and potato producers through creation of regional potato boards;
• Foster vertical linkage between Potato traders and Potato producers in surplus production areas through field visit and buyer contracting;
• Establish ware Potato producing groups and link them with Potential Food processing plants at Addis Ababa
2. Engaging in public- private partnership in potato processing
• Facilitate the engagement of private food processing plants in processing potato as one component of balanced food preparation;
• Help producers in concluding contract agreements with potential food processors;
• Arrange field visit for food processing plants to watch excess Potato Producing areas such as Shashemene;
• Link potato research centres, farmers and food processing plants in identifying and producing suitable potato variety for processing.
3. Strengthening services in potato value chains
• Work on improving the responsiveness of Potato research centres to improved market demanded Potato Variety development and supply;
• Similarly work on improving the responsiveness of government fertilizer and fungicide input providers to timely provide these inputs as per the cropping calendar identified
4. Financing potato value chains
• Facilitate Potato value chain financing arrangements for instance for manufacturing of Potato processing equipments by SME;
• Support Private Potato transporter who could engage in using standardized potato transporting equipments.
5. Introducing location based potato quality control mechanisms
• Facilitating the development of location based potato quality control mechanisms with emphasis on seed quality;
• Promote quality and standard based pricing of Potato; • Work with relevant GOs in developing / adapting existing
standards such that they can be implemented

Potato Value Chain Analysis and Development in Ethiopia
55
References Anandajayasekeram P. and B. Gebremedhin (2009), Integrating Innovation System perspective
and Value Chain Analysis in Agricultural Research for Development: Implication and Challenge. Improving Productivity and Market success(IPMS) of Ethiopian Farmers Project Working papert 16. ILRI 67pp.
Assefa, Alemayehu (2011), Innovation in Seed Production Management for Enhanced Seed Quality of Groundnut and Potato in Babile and Haramaya Districts in East Hararghe Zone. Paper presented to Local Seed Business Project, Haramaya University.
Berga, M.V.D., M. Boosman, I. Cucco, L. Cuna, N. Jansson, P. Moustier, L. Prota, T. Purcell, D. Smith, and S. V. Wijk (1993). Making Value Chain Work Better for the Poor: A tool book for practitioners of value chain analysis.
CSA (Central Statistical Agency of Ethiopia) (2007) Agricultural sample survey: Report on area and production of crops, Addis Ababa, Ethiopia.
CSA (Central Statistical Agency of Ethiopia) (2008/2009) Agricultural sample survey: Report on area and production of crops, Addis Ababa, Ethiopia, p 126.
Emana, B. (2008), Participatory Value Chain Analysis of Horticultural Crops in Kombolcha District of Eastern Oromia, Ethiopia, Research Report, ActionAid Ethiopia, Addis Ababa.
Endale, G., W. Gebremedhin, and B. Lemaga. 2008a. Potato Seed Management. In Root and tuber crops: The untapped resources, ed. W. Gebremedhin, G. Endale, and B. Lemaga, 53–78. Addis Ababa: Ethiopian Institute of Agricultural Research.
Endale, G., W. Gebremedhin, K. Bekele, and B. Lemaga. 2008b. Post Harvest Management. In Root and tuber crops: The untapped resources, ed. Wolde Giorgis, G.M., G. Endale, and B. Lemaga, 113– 130. Addis Ababa: Ethiopian Institute of Agricultural Research.
FAOSTATA data (2004). www.fao.org
Gereffi, Gary (1994), “The Organisation of Buyer- Driven Global Commodity Chains: How U.S. Retailers Shape Overseas Production Networks,” in Gary Gereffi and M. Korzeniewicz (eds.), Commodity Chains and Global Capitalism (Westport CT, Praeger), pp. 95–122.
Gildemacher, P., P. Demo, P. Kinyae, M. Nyongesa, and P. Mundia (2007). Selecting the best plants to improve seed potato. LEISA Magazine 23(2): 10–11.
Gildemacher, P., W. Kaguongo, O. Ortiz, A. Tesfaye, W. Gebremedhin, W.W. Wagoire, R. Kakuhenzire, P. Kinyae, M. Nyongesa, P.C. Struik, and C. Leewis (2009). Improving potato production in Kenya, Uganda and Ethiopia. Potato Research 52: 173–205.
Heike Hoeffler (2005), Promoting the Kenyan Potato Value Chain: Can Contract Farming Help Build Trust and Reduce Transaction Risks?. Paper prepared for presentation at the 99th EAAE Seminar ‘Trust and Risks in Business Networks, February 8-10, 2006, Bonn, Germany.
Hirpa, A. , Miranda P. M. Meuwissen, A. Tesfaye , Willemien J. M. Lommen , Alfons Oude Lansink , A. Tsegaye , Paul C. Struik (2010), Analysis of Seed Potato Systems in Ethiopia. American Journal of Potato Research. Volume 87; Number 6.
Joshi, Surendra Raj and Bhim Raj Gurung (2009), Potato in Bhutan - Value Chain Analysis. Regional Agricultural Marketing and Cooperatives Office (RAMCO); Department of Agricultural Marketing and Cooperatives. Ministry of Agriculture, Trailing, Mongar.
Kaplinsky, R. (1999), "Globalisation and Unequalization: What Can Be Learned from Value Chain Analysis." Journal of Development Studies 37(2): 117-146.

Potato Value Chain Analysis and Development in Ethiopia
56
Kaplinsky, R. and M. Morris (2001), A Handbook for Value Chain Research. Brighton,
United Kingdom, Institute of Development Studies, University of Sussex.
__________(2007), Making Value Chain Work for the Poor. A tool book for Practitioners of Value Chain Analysis.
Kirumba, W., Kinyae, P. Muchara, M., (2004), Potato Market Survey. GTZ-MoA publication, Nairobi, Kenya.
KIT, Faida MaLi and IIRR (2006), Chain empowerment: Supporting African farmers to develop markets. Royal Tropical Institute, Amsterdam; Faida Market Link, Arusha; and International Institute of Rural Reconstruction, Nairobi.
Lemaga, B., G. Hailemariam, and W. Gebremedhin(1994), Prospects of seed potato production in Ethiopia. In Proceedings of the second national horticultural workshop of Ethiopia, ed. E. Hareth and D. Lemma, 254–275. Addis Ababa: Institute of Agricultural Research and FAO.
Louwaars, N. (2007), Seeds of confusion: The impact of policies on seed systems. PhD dissertation, Centre for Genetic Resources, WUR, The Netherlands.
Mulatu, E., E.I. Osman, and B. Etenesh( 2005a), Improving potato seed tuber quality and producers’ livelihoods in Hararghe, Eastern Ethiopia. Journal of New Seeds 7(3): 31–56.
Muthoni, J; Nyamongo, D O (2009), A review of constraints to ware Irish potatoes production in Kenya. In Journal of Horticulture and Forestry Vol. 1(7) pp. 098-102.
Nape, G.W.Otim ( 2007), Harmonization of Variety Release Procedures for Potato and Sweet Potato in Ethiopia, Kenya, Ruwanda and Uganda.
Porter, Michael E. (1985), Competitive Advantage: Creating and Sustaining Superior Performance (New York: The Free Press).
Richter, P. (2005), The Application of the Value Chain Methodology in Development Projects: Reporting on the Sri Lankan Experiences, GTZ-Integration, Sri Lanka.
Schmitz, H (2005) Value Chain Analysis for Policy-Makers and Practitioners. ILO, Geneva.
Struik, P.C., and S.G. Wiersema (1999), Seed potato technology, 383. Wageningen: Wageningen Perss.
Tesfaye, A., C. Yirga, G.M. Wolde Giorgis, M. Haile and E. Gebre (2002). Potato production, marketing and utilization systems in Ethiopia: the case of East and West Shewa zones.
Tesfaye, A., G.M. Wolde Giorgis and B. Lemaga (2007), Market for fresh and frozen potato chips in the ASARECA region and the potential for regional trade: the case of Ethiopia.
World Bank, FAO, and IFAD. 2009. Gender in seed production and distribution. Gender in Agriculture Sourcebook, 764. Washington, DC: World Bank.

57
Annexes
Annex 1: Description of Value Chain Tools
Tool 1: Prioritizing value chains for analysis Prior to undertaking a value chain analysis, a decision needs to be made on which sub-sectors, products or commodities should be prioritized for analysis.
Tool 2: Mapping the value chain Mapping value chain helps to get a better understanding of connections between actors and processes and interdependency between actors and processes in a value chain. A value chain map allows one to depict all activities, actors, and relationships among segments of the chain, and the interactions between producers and intermediaries. A value chain has many dimensions: the actual product flow, the number of actors and the accrued value. Eight steps are involved in mapping value chain: Mapping the core processes in the value chain; identifying and mapping the main actors involved in these processes; mapping flows of products, information and knowledge; mapping the volume of products and number of actors; mapping the geographical flow of the product or service; mapping the value at different levels of the value chain; mapping relationships and linkages between value chain actors and mapping business services that feed into the value chain.
Tool 3: Measuring value chain performance: cost and margins One of core activities in undertaking value chain analysis is to measure the performance of the chain in order to know the investment required to increase the competitiveness of the chain and measure the concentration/distribution of the value chain benefit. Cost and margin are key indicators of value chain performance. Measuring costs and margins enables the researcher to determine how pro-poor value chain should be developed. About seven major steps are involved to measure value chain performances. These are:
• Identifying costs and required investments; • Calculating revenues per actor; • Calculating financial ratios; • Analysis cost and margin changes over time; • Relative financial position of actors in the value chain; • Calculating opportunity costs; • Benchmarking and • Going beyond the quantitative data.
Tool 4: Analyzing technology, knowledge and upgrading Three main steps are involved in analysis of upgrading, technology and knowledge.
• Map the variation / differences in Knowledge and Technology in the separate processes in the Value Chain;
• Identify distinct market chains based on knowledge and technology; • Identify and quantify gaps in knowledge & technology that hinder upgrading between
market chains.

58
Tool 5: Governance and services Governance encompasses the system of coordination, organization and control that preserves and enhances the generation of value along a chain. Governance and service analysis can help identifying levers for interventions aimed at increasing the overall efficiency of the value chain. The analysis of value chain governance and services is best approached by separating three dimensions: Rules and Regulations, Enforcement and Services. Four steps are involved in analysis of governance and service. These are:
• Map stakeholders influencing governance; • Identify rules and regulations; • Analyze enforcement and • Analyze support services.
Tool 6: Linkages Analysis of linkage helps to identify how value chain actors are linked along the value chain. Linkages analysis involves not only identifying which organizations and actors are linked with one another, but identifying the reasons for those linkages and whether the linkages are beneficial or not.
In this value chain analysis combinations of these tools have been applied where suitable. Through applications of the tools, potato value chain maps developed, potato value chain performance measured, governance and services and linkages of actors analyzed.
Annex 2: Sample Potato Producers by Sex
Region Woreda Sex
Male Female Total
Tigray Atsibi-Wonberta 44 1 45
Saesi-Tseada Emba 46 0 46
SNNPR Hulla 34 7 41
Oromia Shashemene 28 0 28
Total 152 8 160

59
Annex 3: Sample Potato Retailers and Wholesalers by Region
Region Actor Male Female Total
Tigray Retailers 13 15 28 Wholesalers 10 10
SNNPR Retailers 5 7 12 Wholesalers 1 1 2
Oromia Retailers 0 0 Wholesalers 4 3
Total Retailers 18 22 40 Wholesalers 11 1 12
Annex 4 : Companies with Potential to use Potato for Value Addition in Ethiopia
1. Bale Zaf Alcohol, P.o.Box 4855, Addis Ababa, Tel. 011 1860299
2. YITBAREK ALEMU STARCH, CHEMICAL & ADHESIVE INDUSTRY. Tel: 251-11-66281 61. Fax Icon Fax: 251-11-279 10 72. City: Addis Ababa.
3. Chips are produced super markets since they operate at e.g. ALL MART produces chips it sells in the shop. Others collect chips from small scale processors. These producers do not have labels or even address on the products.
4. Food processing companies are many in Addis Ababa, Adama and Dire Dawa. For example, Kaliti Food Share Company in Addis Ababa is one of the well established flour mill preparing biscuits, child food, breads, etc. The ingredients of the child food does not include potato and there is no plan to include it soon.

60
Annex 5: Suggested Interventions/Solutions The stakeholders of the “Better Potato for Better Life” project suggested the following solutions for the problems occurring along the value chain in both regions.
Constraints in potato value chain and suggested solutions
Potato Value Chain Functions Constraints Possible Interventions by the project
Input Supply (Seed Potato)
Impurity of potato seed (high dormancy, mixed variety)
• Creating awareness about seed potato production, sorting, grading, quality control, • Support Construction of Affordable DLS; establish and introduce potato seed
certification and distribution mechanisms
Lack of improved potato variety • Establish seed potato producing farmers groups, cooperatives; • Strengthen capacity of research centers engaged in Potato variety development
Absence of formal potato seed supply
• Set-up suitable potato seed supply system involving relevant stakeholders; • Create market linkage between potato seed producers and buyers
Use of small size potato for seed • Teach farmers on merits and demerits of using small size potato; • Advise producers on proper potato seed size to use and demonstrate on farmers plot
Input Price (Seed Potato) Exorbitant potato seed price • Increase potato seed multiplication centers
Input(Fungicide) Lack of know-how on fungicide application to potato by producers • Train potato producers on appropriate application of fungicide to potato
Input supply (Fertilizer)
Adulteration of fertilizer by private traders
• Put in place good M & E system to check for expiry date of chemical fertilizers; • Awareness raising for farmers about fertilizer quality
Low awareness of the optimum fertilizer rate on Potato
• Teach farmers on effect of using fertilizer below recommendation rate ; • Advise on proper rate to use and demonstrate on farmers plot impact of using
appropriate rate
Untimely supply of fertilizer • Strictly follow cropping calendar in agricultural input supply • Teach input supply planning for input suppliers at various levels • Advocate for consideration of irrigated cropping in input supply planning and delivery

61
Potato Value Chain Functions Constraints Possible Interventions by the project
Ware Potato Marketing
Large number of brokers in the market
• License the brokers; • Provide business ethics training
Lack of real time market information
• Create access to market information • Support Potato price information provision through FM radios to producers
Lack of suitable transportation equipments
• Manufacture suitable potato transportation equipments; • Awareness creation of transporters and others involved on the issue
Potato Processing
Lack of potato processing technology
• Establishing factories that use potato; • Encourage establishment of SMEs on potato processing; • Expand potato production and create awareness and linkage
Lack of awareness on potato value addition through processing
• Introduce potato processing facilities; • Promotion on potato processing and value addition through processing
Small sized potato is not convenient for processing to consume at household level
• Introduce potato value addition by introducing knowledge like using it for livestock feed; • Promotion to large scale processors on processing potato to extract starch from it
Potato Consumption
Cereal based food habit • Campaign on changing food habit to vegetables and fruits from predominant cereals based;
Limited knowledge on recipes/dishes that could be made from potato by consumers
• Introduce home economics education to farmers and consumers;
High potato price at slack production season (e.g. April-May)
• Increase efficiency of potato marketing; • Establish good ware potato marketing and distribution system
Taste and preference variability by location
• Communicate consumers preference to producers; • Improve potato extension system
Potato could not be stored in the soil for long period and consumption is limited to only 2 - 3 months
• Establish ware potato stores at strategic locations
Trading Lack of proper potato sorting facilities • Training to farmers and traders on potato sorting ;

62
Potato Value Chain Functions Constraints Possible Interventions by the project
• Introduce quality based pricing Poor road to access rural potato growing areas
• Construct feeder roads; • Support community to construct cost effective feeder roads
High transport cost • Mobilize group sells to achieve economies of scale Inadequate ware and seed potato storage facility • Establish DLS for seed potato and suitable storage for ware potato as well
Lack of weighing scale at rural areas • Avail standard weigh scale at affordable price
Production
In adequate potato management practice
• Train producers on appropriate potato management practice;
Late blight diseases, rodents, termites attack on potato
• Develop appropriate harvesting technology; • Train farmers on appropriate time of potato planting in different locations
High perishability of potato • Introduce modern potato transportation equipments; • Create SME and Producers partnership for manufacturing and marketing of potato
transportation equipments

63
Annex 6: Contact Addresses of Selected Potato Traders No Name Location Telephone 1 Tafesse Bared Shashemene 0916 822182 2 Mulugeta Beyene Shashemene 0916 908930 3 Tesema Wodajo Shashemene 4 Eshetu Melese Shashemene 5 Wosena Kindie Shashemene 0916 822182 6 Tesfaye Gebru Mekele 0914 134180 7 Merigeta G/Alem T/Haimanot Mekele 0914 003746

64
Annex 7: Data Collection Instruments PART I: General questions
Mapping Seed/Ware Potato Value Chain
1) What are the different (core) processes/functions in the potato value chain? 2) Who are the actors involved in these processes and what do they actually do? 3) What are the flows of product, information and knowledge in the value chain? 4) What is the number of actors, the volume of products, employment provided by the
chain actors? 5) Where does the product (or service) originate from and where does it go? 6) How does the value change throughout the chain? 7) What types of relationships and linkages exist between the value chains? 8) How do you evaluate the relationship? Cooperative? Competitive? Rival? 9) What type of (business) services is feeding into the chain? 10) Who are the dominant players in the seed and ware potato value chain?
Cost and Margin of participating in Seed/Ware Potato Value Chain
1) What are the costs incurred by each value chain actor, both fixed and variable costs, and what are required investments for entering a value chain?
2) What are the revenues of each value chain actor i.e. what volumes of seed/ware potato are sold by each of the value chain actor and at what prices?
3) What are the net profits, margins and breakeven point for each of the value chain actors?
4) How are investments, costs, revenues, profits and margins changing over time? 5) How are investments, costs, revenues, profits and margins divided over the actors in the
value chain? 6) Are the costs and margins of this value chain lower or higher compared to other product
value chains? In other words what are the opportunity costs of employing production resources for this particular value chain?
7) Are the costs and margins of this value chain lower or higher compared to similar value chains in other places? Follow the marketing channel to determine the difference.
8) What are the underlying causes of the division of costs and margins in a value chain?
Analyzing technology and knowledge
1) What is the typology of current technology in use in the Value Chain (per processes, actors)?
a. Varieties used by the producers b. Other input technologies used by all value chain actors (tools, machinery,
storage, etc) 2) How effectiveness are the technologies? 3) What indigenous and other knowledge is being used in the Value Chain? 4) Does the Knowledge & Technology produce the required output? 5) What does the use of technology cost? What about the benefit?

65
6) Who determines orientation and investment in Knowledge & Technology in the Value Chain?
Upgrading i) What upgrading options for potato value chain are available? ii) Does investment in upgrading pay off? Does it bring enough added values to the
poor? Who has access to knowledge and who provides knowledge (example the role of extension)?
iii) Can the costs of potato production/marketing/transporting be reduced? iv) Can speed of delivery of potato to consumers/market be increased? v) Can a farmer reduce the use of fertilizers while maintaining the same production
levels for instance use compost/manure? vi) Can a transporter use better potato container to reduce losses/damage?
Product upgrading:
• Can a processor use a better packaging to increase shelf life of potato?
Functional upgrading
• In your opinion should a farmer be producer, processor and transporter or should specialize in a given functions of a value chain?
• Can a group of small farmers in your area bring their potato together to the market in one small truck or should they all travel individually with the potato on the back of their donkey?
Linkage
• Existence of linkages (Yes/No) • Number of different actors (Number of different people in each organization
grouping) • Frequency of contact (Number of times per year met) • Level of formality (Informal/Verbal Agreement/Written Contract)? • Reason for linkages / Reason for no linkages • Relative Benefit/Costs of linkage (Benefits>Costs / Benefits=Costs / Benefits <
Costs) • Level of trust (distrust / no trust / little trust / some trust / fully trust)
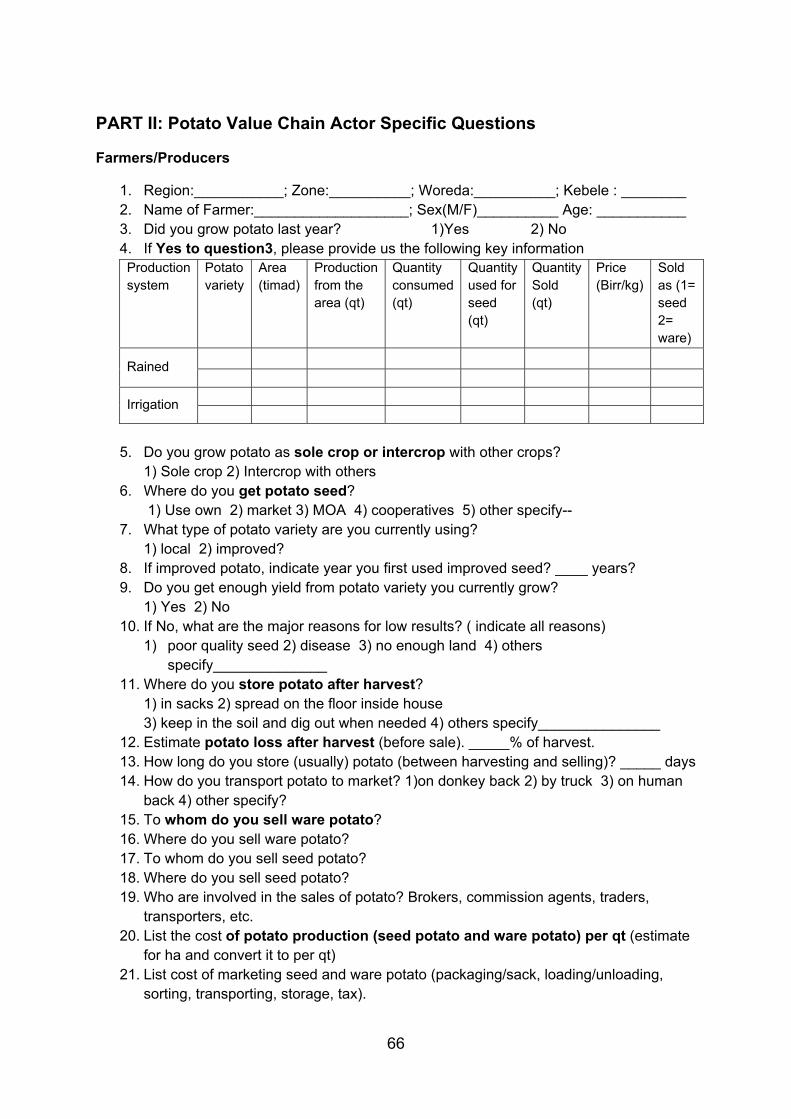
66
PART II: Potato Value Chain Actor Specific Questions
Farmers/Producers
1. Region:___________; Zone:__________; Woreda:__________; Kebele : ________ 2. Name of Farmer:___________________; Sex(M/F)__________ Age: ___________ 3. Did you grow potato last year? 1)Yes 2) No 4. If Yes to question3, please provide us the following key information Production system
Potato variety
Area (timad)
Production from the area (qt)
Quantity consumed (qt)
Quantity used for seed (qt)
Quantity Sold (qt)
Price (Birr/kg)
Sold as (1= seed 2= ware)
Rained
Irrigation
5. Do you grow potato as sole crop or intercrop with other crops?
1) Sole crop 2) Intercrop with others 6. Where do you get potato seed?
1) Use own 2) market 3) MOA 4) cooperatives 5) other specify-- 7. What type of potato variety are you currently using?
1) local 2) improved? 8. If improved potato, indicate year you first used improved seed? ____ years? 9. Do you get enough yield from potato variety you currently grow?
1) Yes 2) No 10. If No, what are the major reasons for low results? ( indicate all reasons)
1) poor quality seed 2) disease 3) no enough land 4) others specify______________
11. Where do you store potato after harvest? 1) in sacks 2) spread on the floor inside house 3) keep in the soil and dig out when needed 4) others specify_______________
12. Estimate potato loss after harvest (before sale). _____% of harvest. 13. How long do you store (usually) potato (between harvesting and selling)? _____ days 14. How do you transport potato to market? 1)on donkey back 2) by truck 3) on human
back 4) other specify? 15. To whom do you sell ware potato? 16. Where do you sell ware potato? 17. To whom do you sell seed potato? 18. Where do you sell seed potato? 19. Who are involved in the sales of potato? Brokers, commission agents, traders,
transporters, etc. 20. List the cost of potato production (seed potato and ware potato) per qt (estimate
for ha and convert it to per qt) 21. List cost of marketing seed and ware potato (packaging/sack, loading/unloading,
sorting, transporting, storage, tax).

67
22. Relation Matrix
Linkage*
If linkage=Yes; Nature of Linkage**
If linkage=Yes; How Much Do You Trust***?
frequency of with other org meeting/year****
F C T P F C T P F C T P F C T P Farmers(F) Coop Traders (T) Processors(P)
*: 1=Yes; 2=No; **:1= informal; 2=verbal arrangement; 3=written agreement; ***:-1=distrust; 2=no trust; 3=a little trust; 4=some trust; 5=full trust; ****: 1=ones; 2=twice; 3=three; 4= times; 5=irregularly
23. What are the major problems in potato production, post harvest, marketing and
transportation in your area? 24. Production related problems:___________________________________________ 25. Post harvest related problems:__________________________________________ 26. Market related problems:_____________________________________________ 27. Transport related problems: __________________________________________
28. Please indicate potato activity calendar in your locality, mark with( )
Main Activity Sept Oct Nov Dec Jan Feb Mar Apr May Jun Jul Aug Land preparation Planting Weeding Harvesting Marketing Low price time Medium price High price time

68
A. Traders (wholesalers)
A. Region:___________; Zone:____________; Woreda:__________; Kebele : ______________ B. Name of Farmer:__________________; Sex(M/F)______________ Age: ________________
1) Do you buy and sell potato? 1) Yes 2) No 2) If yes, how long since you have started potato trading? _______ years 3) From whom do you buy potato?
1) Farmers 2) Middle men 3) cooperatives 4) others specify__________ 4) To whom do you sell potato?
1) Whole sellers 2) retailers 3) consumers 4) others specify_____________ 5) Please indicate your costs, transaction volume and price of potato trading just last one year
Source & destination Markets (from---- to-------
Quantity of potato purchase (qt/month)
#effective months of potato trading/year
Purchase Price (Birr/kg)
Sells price (Birr/kg)
Transportation cost (Birr/qt)
Loading/ unloading cost(Birr/qt)
Sacks cost (Birr)
Other costs specify
6) Other costs (storage, tax, etc)? 7) How long do you store potato before selling? 8) How do you transport potato to market? 1) on donkey back 2) by truck 3) on human
back 4) other specify? 9) Please indicate the relationship you have with other organizations indicated below
Linkage*
If linkage=Yes; Nature of Linkage**
If linkage=Yes; How Much Do You Trust***?
frequency of with other org meeting/year****
F C T P F C T P F C T P F C T P Farmers(F) Coop Traders (T) Processors(P)
*: 1=Yes; 2=No; **:1= informal; 2=verbal arrangement; 3=written agreement; ***:-1=distrust; 2=no trust; 3=a little trust; 4=some trust; 5=full trust; ****: 1=ones; 2=twice; 3=three; 4= times; 5=irregularly
10) What are the major problems in potato harvest, marketing and transportation in your area?
11) Post harvest related problems:_____________________________________________
12) Market related problems:_________________________________________________
13) Transport related problems: ____________________________________________

69
14) Please indicate potato activity calendar in your locality, mark with( ) Main Activity Sept Oct Nov Dec Jan Feb Mar Apr May Jun Jul Aug Harvesting Marketing Low price time Medium price High price time
B) Traders (retailers) a. Region:___________; Zone:______________; Woreda:__________; Kebele : ________ b. Name of Farmer:_____________________; Sex(M/F)_________ Age: ______ 1) How long since you have started potato retailing? _____ years. 2) From whom do you buy potato? 1) Farmers 2) Middle men 3) wholesalers 4) others specify-------- 3) To whom do you sell potato? 1) Individual consumers 2) cafes 3) others specify 4) Please indicate your costs, transaction volume and price of potato trading just last one year
Source & destination Markets (from—to-------
Quantity of potato purchase (kg/day)
#effective months of potato trading/ year
Purchase Price (Birr/ kg)
Sells price (Birr/kg)
Transportation cost (Birr/qt)
Loading/ unloading cost (Birr/qt)
Sacks cost (Birr)
Other costs specify
6) Other costs (storage, tax, etc)? 7) How long do you store potato before selling? 8) Estimate the loss (%)________ 9) How do you transport potato to retail site? 1) mini bus 2) on human back 3) on donkey back
4) other specify? 10) Please indicate the relationship you have with other organizations indicated below
Linkage*
If linkage=Yes; Nature of Linkage**
If linkage=Yes; How Much Do You Trust***?
frequency of with other org meeting/year****
F R T P F R T P F R T P F R T P Farmers(F) Retailers(R) Traders(T) Processors(P) *: 1=Yes; 2=No; **:1= informal; 2=verbal arrangement; 3=written agreement; ***:-1=distrust; 2=no trust; 3=a little trust; 4=some trust; 5=full trust; ****: 1=ones; 2=twice; 3=three; 4= times; 5=irregularly

70
11) What are the major problems in potato harvest, marketing and transportation in your area?
• Post harvest related problems:_____________________________________________
• Market related problems:_________________________________________________
• Transport related problems: ______________________________________
12) Please indicate potato activity calendar in your locality, mark with ( ) Main Activity Sept Oct Nov Dec Jan Feb Mar Apr May Jun Jul AugHarvesting Marketing Low price time Medium price High price time
C) Processors a. Region:___________; Zone:______________; Woreda:__________; Kebele : ____________ b. Name of Farmer:_____________________; Sex(M/F)______________ Age: ______
1) How long since you have started potato processing? _____ years 2) From whom do you buy potato? 1) Farmers 2) Middle men 3) Wholesalers 4) others specify_______ 3) To whom do you sell potato? 1) Cafes 2) supper market 3) consumers 4) others specify_______
4) Please indicate your costs, transaction volume and price of potato trading just last one year
Type of processing
Quantity of potato purchase (qt/month)
#effective months of potato processing/ year
Purchase Price(Birr/ kg)
Sells price (Birr/kg)
Transportation cost (Birr/qt)
Loading/ unloading cost(Birr/qt)
Packing
Other costs specify
Chips Crisp(?) Other….
5) Other costs (cost of processing, storage, tax, etc)? __________Birr (give for each)
6) Please indicate the relationship you have with other organizations indicated below

71
Linkage*
If linkage=Yes; Nature of Linkage**
If linkage=Yes; How Much Do You Trust***?
frequency of with other org meeting/year****
F R T P F R T P F R T P F R T P Farmers(F) Retailers(R) Traders(T) Processors(P)
*: 1=Yes; 2=No; **:1= informal; 2=verbal arrangement; 3=written agreement; ***:-1=distrust; 2=no trust; 3=a little trust; 4=some trust; 5=full trust; ****: 1=ones; 2=twice; 3=three; 4= times; 5=irregularly
7) What are the major problems in potato harvest, marketing and transportation in your area? • Post harvest related problems:_____________________________________________ • Market related problems:_________________________________________________ • Transport related problems: ______________________________________________ 8) Please indicate potato activity calendar in your locality, mark with ( )
Main Activity Sept Oct Nov Dec Jan Feb Mar Apr May Jun Jul Aug
Harvesting
Marketing
Low price time
Medium price
High price time
D) Consumers/Restaurants/Cafes a. Region:________; Zone:___________; Woreda:__________; Kebele : __________ b. Name of Farmer:_______________; Sex(M/F)____________ Age: ____________ c. Household size:_________ 1. Type of buyer 2. Income (Birr/year): _________ 3. Do you consume potato in your household? 4. Quantity purchased per week: 1) Peak season___ kg; Scarce supply season: ____kg 5. From whom do you usually buy potato? 1) Farmers 2) Middle men 3) wholesalers
4) Retailers 5) Others specify_____________ 6. Preference (form of potato needed)________________________________ ______ 7. Time when potato is available/scarce:
Potato availability Sep Oct Nov Dec Jan Feb Mar Apr May Jun Jul Aug
Easily available Scarce Totally not available
8. Problems related to potato marketing and consumption?