Postpr int - DiVA portalkth.diva-portal.org/smash/get/diva2:663405/FULLTEXT01.pdf · Postpr int...
25
http://www.diva-portal.org Postprint This is the accepted version of a paper published in Wear. This paper has been peer-reviewed but does not include the final publisher proof-corrections or journal pagination. Citation for the original published paper (version of record): Abbasi, S., Teimourimanesh, S., Vernersson, T., Sellgren, U., Olofsson, U. et al. (2013) Temperature and Thermoelastic Instability at Tread Braking Using Cast Iron Friction Material. Wear, 314(1–2): 171-180 http://dx.doi.org/10.1016/j.wear.2013.11.028 Access to the published version may require subscription. N.B. When citing this work, cite the original published paper. NOTICE: this is the author’s version of a work that was accepted for publication in Wear. Changes resulting from the publishing process, such as peer review, editing, corrections, structural formatting, and other quality control mechanisms may not be reflected in this document. Changes may have been made to this work since it was submitted for publication. A definitive version was subsequently published in Wear, 314, 1–2, (18-APR-2014) DOI 10.1016/j.wear.2013.11.028 Permanent link to this version: http://urn.kb.se/resolve?urn=urn:nbn:se:kth:diva-133894
Transcript of Postpr int - DiVA portalkth.diva-portal.org/smash/get/diva2:663405/FULLTEXT01.pdf · Postpr int...

http://www.diva-portal.org
Postprint
This is the accepted version of a paper published in Wear. This paper has been peer-reviewed but doesnot include the final publisher proof-corrections or journal pagination.
Citation for the original published paper (version of record):
Abbasi, S., Teimourimanesh, S., Vernersson, T., Sellgren, U., Olofsson, U. et al. (2013)
Temperature and Thermoelastic Instability at Tread Braking Using Cast Iron Friction Material.
Wear, 314(1–2): 171-180
http://dx.doi.org/10.1016/j.wear.2013.11.028
Access to the published version may require subscription.
N.B. When citing this work, cite the original published paper.
NOTICE: this is the author’s version of a work that was accepted for publication in Wear. Changesresulting from the publishing process, such as peer review, editing, corrections, structural formatting,and other quality control mechanisms may not be reflected in this document. Changes may havebeen made to this work since it was submitted for publication. A definitive version was subsequentlypublished in Wear, 314, 1–2, (18-APR-2014) DOI 10.1016/j.wear.2013.11.028
Permanent link to this version:http://urn.kb.se/resolve?urn=urn:nbn:se:kth:diva-133894

TEMPERATURE AND THERMOELASTIC INSTABILITY AT TREAD
BRAKING USING CAST IRON FRICTION MATERIAL
Saeed Abbasia,*, Shahab Teimourimaneshb, Tore Vernerssonb,c, Ulf Sellgrena, Ulf Olofssona and Roger Lundénb
aDepartment of Machine Design, Royal Institute of Technology (KTH), 100 44 Stockholm, Sweden bChalmers Applied Mechanics / CHARMEC, 412 96 Gothenburg, Sweden
cAlso ÅF Industry AB, 417 56 Gothenburg, Sweden
ABSTRACT
Braking events in railway traffic often induce high frictional heating and thermoelastic instability (TEI) at the
interfacing surfaces. In the present paper, two approaches are adopted to analyse the thermomechanical
interaction in a pin-on-disc experimental study of railway braking materials. In a first part, the thermal problem
is studied to find the heat partitioning between pin and disc motivated by the fact that wear mechanisms can be
explained with a better understanding of the prevailing thermal conditions. The numerical model is calibrated
using the experimental results. In a second part, the frictionally induced thermoelastic instabilities at the pin-disc
contact are studied using a numerical method and comparing them with the phenomena observed in the
experiments. The effects of temperature on material properties and on material wear are considered. It is found
from the thermal analysis that the pin temperature and the heat flux to the pin increase with increasing disc
temperatures up to a transition stage. This agrees with the behaviour found in the experiments. Furthermore, the
thermoelastic analysis displays calculated pressure and the temperature distributions at the contact interface that
are in agreement with the hot spot behaviour observed in the experiments.
KEYWORDS
Railway tread braking, frictional heating, heat partitioning, thermoelastic instability (TEI), hot spots, pin-on-disc
test, numerical analysis.

2
NOMENCLATURE
A Real contact area (m2) R Thermal resistance (m2 °C/W)
a Semi-contact length (m) Ra Rayleigh number
Cp Influence coefficient for normal contact
(m3/N)
Reωr ωr2/νair, local rotational Reynolds number
Cq Influence coefficient for tangential
contact (m3/N)
T Contact temperature (°C)
Et Elastic modulus at certain temperature
(N/m2)
T0 Base temperature (°C)
F Applied load (N) Tni Neutral temperature
G Gap between two surfaces before loading
(m)
X Characteristic length of the system in
contact with fluid (m)
H Height of wear (m) ts Time step (s)
h Coefficient of heat transfer (W/m2 °C) tt Total simulation time (s)
i, j Cell indices vv Rolling speed (m/s)
Kw Specific wear rate at certain temperature
(m3/Nm=1/Pa)
vs
Sliding velocity (m/s)
k Thermal conductivity (W/m °C) x
Longitudinal direction
L Péclet number y
Lateral direction
Local Nusselt number z Normal direction of the contact surface
Mean Nusselt number α Heat-partitioning factor
p Pressure (N/m2) αt Thermal expansion at certain temperature
(1/°C)
pa Allowable (limit) pressure (N/m2) δz Global displacement (m)
Pr cair μ/k, Prandtl number κ Thermal diffusivity (m2/s)
pt Compressive/tensile stresses due to
thermal expansion (N/m2)
μf Friction coefficient
q Heat flux (W/m2) ρ Density (kg/m3)
r Radial direction of disc (m) υ Poisson’s ratio
ω Rotational speed (rad/s)
νair Air kinematic viscosity (m2/s)
1 Introduction
The properties of the friction materials at the contact interface determine the behaviour and performance of the
brake system of a vehicle. The local temperatures and the wear of railway brake blocks are important parameters
which depend on several tribological phenomena such as non-uniformities in the contact pressure distribution
and third body behaviour of the contact interface. The temperatures in the frictional contact are often calculated
assuming either that the contact pressure between the friction material and the rotor is constant in time or that the
contact pressure has evolved to a stationary state as a result of an assumed constant wear rate (e.g., [1]).
Simplified analyses of this kind are regularly being used for calculating (average) temperatures in brake systems.

3
However, also the phenomenon of frictionally induced thermoelastic instability (TEI) was investigated early,
both experimentally and analytically, by Barber [2] and was later studied in detail by Burton [3]. TEI can explain
the significant variations in pressure, temperature and material transition in the contact area, which deviate
substantially from what can be calculated using the simplified analysis described above with e.g., constant
contact pressure between the friction material and the rotor. TEI effects cause extensive temperature gradients at
the contact interfaces and can be used to explain the local temperature variations in brake materials. TEI effects
have been studied in automotive applications related to brake rotors and pads and have also been examined for
railway tread braking materials [4-8]. Railway brake blocks can be made from composite, sinter or cast iron
materials, all with highly temperature-dependent physical properties (in a typical temperature range 0-600 °C).
The heat partitioning at railway tread braking has previously been studied by full-scale rig testing, see [5].
In the present paper, results from a series of pin-on-disc experiments are investigated to study in detail the
thermomechanical behaviour of cast iron brake block material. Previously, results from these experiments were
presented with respect to wear properties of composite, sinter and cast iron railway brake block materials at
controlled elevated disc temperatures, see Vernersson et al. [7]. According to the experimental results, the cast
iron block material shows a decreasing wear rates at temperatures higher than 500 °C. Additionally, the
generation of hot spots on the contacting surface of the cast iron pin was an interesting phenomenon which can
be explained with thermoelastic effects. It should be noted that the experiments at elevated disc temperature
featured an external induction heating device for controlling the disc temperature during the tests.
In the first part of the paper, the thermal problem is studied where frictional heat is generated in the contact
between the stationary pin and the rotating disc and is partitioned between the two bodies. The heat partitioning
for the pin-on-disc configuration is studied by a transient heat transfer analysis using a finite element model of
the pin-on-disc set-up. The temperatures are calculated for a prescribed uniform contact pressure without
consideration of stresses and deformations at the contact. The heat generated by friction in the pin-on-disc device
is partitioned between the pin and the disc via a thermal contact resistance model. The aim of the thermal
modelling is to study the heat partitioning at different temperatures and also to prepare a temperature field and
the heat partitioning for the following thermoelastic instability analysis.
In the second part of the paper, a thermomechanical boundary element (BE) model is established to study the
transient thermoelastic behaviour of the pin during pin-on-disc tests. In this model the influence of temperature-
dependent material properties and wear rates are implemented using an explicit interpolation technique.
4
2 Method
2.1 Experimental setup
A conventional pin-on-disc machine equipped with a set of thermal instruments was used in the present study.
The disc (diameter 100 mm, thickness 10 mm) rotates at a prescribed speed and the flat-head pin (diameter
10 mm, length 17 mm) is loaded with a dead weight. The disc is made from the rim of a railway wheel of
material ER8T according to European norm EN 13262 and the pin is from P10 cast iron. The sliding velocity is
controlled using a device that allows specification of test speed, time of acceleration and time of deceleration. At
the pin-on-disc tests performed here, the sliding velocity varies between 8 and 13 m/s and the pin-disc contact
pressure is 0.56 MPa, which corresponds to the average block-wheel contact pressure for typical train stop
braking cycles. However, the temperature is controlled in the present experiments and the actual braking data are
therefore not of primary interest.
The pin wear is determined by measuring the weights of the pin and holder before and after each test run. An
inductive displacement sensor measures the vertical displacement of the top of the pin holder. Furthermore, the
machine is equipped with a laser displacement sensor that measures the vertical displacement of the rotating disc
support. The friction force is measured using a force transducer that constrains the loading arm. A dedicated
computer is used to sample data (100 Hz) from the inductive displacement sensor and the force transducer.
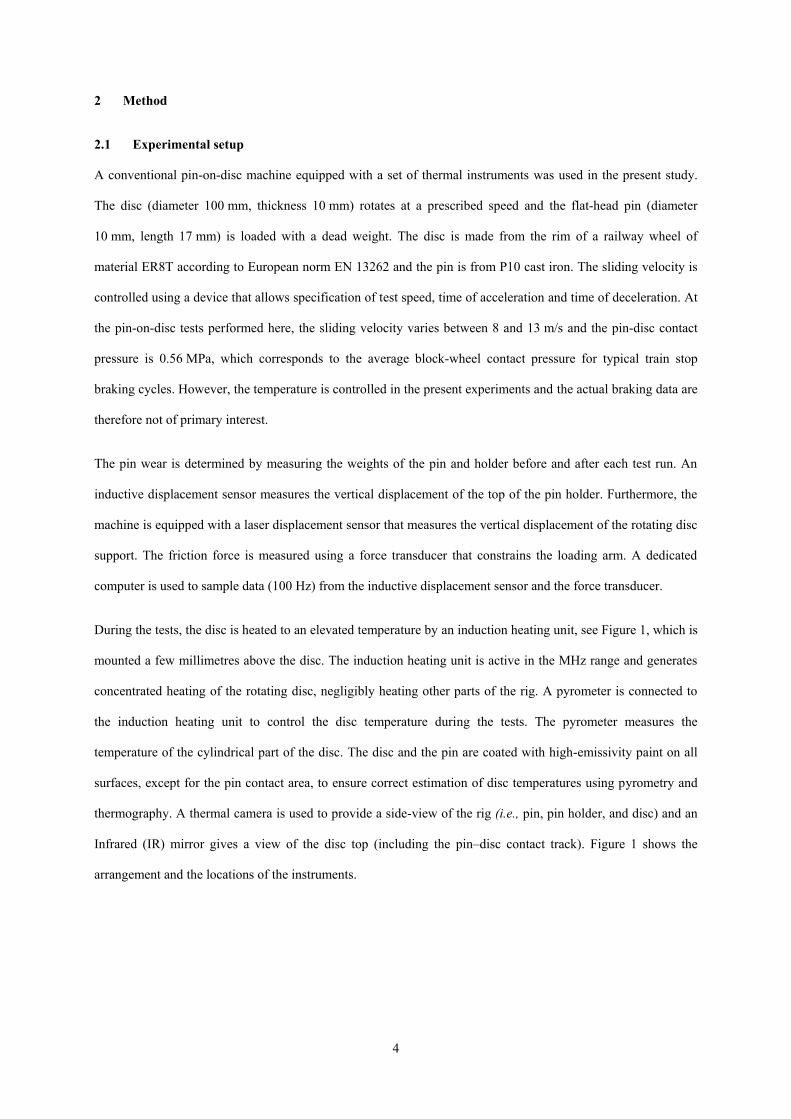
During the tests, the disc is heated to an elevated temperature by an induction heating unit, see Figure 1, which is
mounted a few millimetres above the disc. The induction heating unit is active in the MHz range and generates
concentrated heating of the rotating disc, negligibly heating other parts of the rig. A pyrometer is connected to
the induction heating unit to control the disc temperature during the tests. The pyrometer measures the
temperature of the cylindrical part of the disc. The disc and the pin are coated with high-emissivity paint on all
surfaces, except for the pin contact area, to ensure correct estimation of disc temperatures using pyrometry and
thermography. A thermal camera is used to provide a side-view of the rig (i.e., pin, pin holder, and disc) and an
Infrared (IR) mirror gives a view of the disc top (including the pin–disc contact track). Figure 1 shows the
arrangement and the locations of the instruments.
5
Figure 1: Arrangement of IR mirror, laser displacement sensor, induction heating unit and inductive displacement
sensor on a conventional pin-on-disc machine.
2.2 Modelling framework
The modelling framework has been divided in two parts. In the first part, a thermal model of the experimental
set-up is established which is used to investigate the heat partitioning between the disc and the pin. In the second
part, a thermomechanical boundary element model is established for studying the transient thermoelastic
behaviour of the pin during pin-on-disc tests.
2.2.1 Thermal model
Geometry
The modelled pin-on-disc system is shown in Figure 2. The disc, disc adaptor and spinning disc are modelled as
axisymmetric and pin, pin holder and arm as two-dimensional (plane), accounting for their respective out of
plane thickness. Convection and radiation are added in a straightforward manner for all edges in the model but
also for the front faces of the pin, pin holder and arm by use of tuned shell elements. Relevant geometrical
parameters of the pin-on-disc system are listed in Table 1. The pin is modelled with rectangular cross section
where the cross sectional area is taken as equal to the actual area of the cylindrically shaped pin.
6
Figure 2: Schematic picture of disc, pin, pin-holder and arms. Frictional heat fluxes qD and qP are indicated.
Table 1: Geometrical parameters for disc, pin, pin holder and arms for two-dimensional thermal model of the pin-on-
disc system.
Radius of disc RD = 50 mm Arm length LA = 40 mm
Disc thickness BD = 10.0 mm Arm thickness BA = 50 mm
Pin height HP1 = 17 mm Pin-holder length LH = 30 mm
Pin height out of holder HP2 = 5.0 mm Pin-holder height HH1 = 90 mm
Pin length LP = 10 mm Pin-holder height HH2 = 10 mm
Pin thickness BP = 7.85 mm Pin-holder height HH3 = 30 mm
Arm height HA = 50 mm Pin-holder thickness BH = 50 mm
For the tests from ambient temperature, the disc is put on-top of an aluminium disc and a steel disc (in order to
keep temperatures low). However, for the tests at elevated temperatures an insulating material, having low
thermal conductivity, was placed in-between the test disc and the aluminium disc. The convective heat exchange
from a simple disc, rotating in still air, was calculated assuming a laminar boundary layer on the disc surface
when the local rotational Reynolds number is Reωr < 2.5×10⁵ (Reωr= ωr2/νair) and the Prandtl number is
0.7< Pr <5.0. The local Nusselt number is calculated [9] as
7
( )
(1)
where h is the coefficient of heat transfer for air, r is the radial coordinate in the cylindrical coordinate system
bound to the disc and k is the thermal conductivity.
The free convective heat transfer of the pin, pin-holder and arm is approximated by use of a vertical plane in
laminar regime. The mean Nusselt number can be calculated [10] as
( )
(2)
where Ra is the Rayleigh number and X is the characteristic length of the system. The free convective heat
transfer coefficient has been calculated similar to the second equation in formula (2). The forced and free
convection formulas (1, 2) have been used to find a base estimate of the actual cooling rates in the pin-on-disc
set-up. Hence, the cooling rates of the disc and the remaining structure are scaled by a calibration parameter
adjusted by a non-dimensional cooling parameter to improve the agreement between simulated and experiments
results. Moreover, the radiation boundary conditions in heat transfer analyses are applied by considering certain
emissivities for exterior surfaces.
In the present paper, the commercial finite element package Abaqus/Standard [11] has been employed for
analysing the transient heat transfer in the pin-on-disc system. It is assumed that Coulomb’s law of friction is
valid with a constant contact pressure p which is calculated from the weight loading on pin. The frictional power
(per area unit) in the contact is then proportional to the coefficient of friction μf and the sliding velocity vs as
(3)
In the simulations it is assumed that the coefficient of friction varies in time in the same manner as it does in the
experiments.

8
Heat partitioning
The “third body approach” can explain the temperature jump at the interface between two contacting bodies.
Godet [12, 13] defines the third-body in a material sense as an interface zone between contacting surfaces
formed by different compositions of wear debris and contaminants. A heat partitioning model based on the
generation of heat in the third-body is studied by Laraqi [14, 15]. The model assumes that the generated heat is
partitioned via two thermal resistances, according to [14], see Figure 3.
Figure 3: Schematic view of heat partitioning model for a unit surface area of pin and disc in contact. Of a total
generated heat flux at contact qcontact
, the flux qD goes to disc and qP to pin. Surface temperatures are and
for disc and pin, respectively. Heat generation in third body with thermal resistances RD and RP [16].
It is assumed that the frictional power generated during the test is transformed into heat over the common area of
contact between pin and disc and is partitioned between pin and disc at their contact interface as shown in Figure
3. The heat flux qcontact = qD + qP generated in the disc-pin contact is partitioned as
(4)
(5)
In these equations, the first and second terms show the influence of temperature difference and the local heat
partitioning, respectively.
The heat conduction between the other components of the pin-on-disc system, such as pin and pin-holder, pin-
holder and arms, aluminium disc adaptor and spinning disc, has been modelled by defining the gap conductance
between the contacting surfaces with a high thermal contact conductance to prescribe a perfect thermal contact.
The thermal contact conductance between the steel disc and the aluminium adaptor is assumed to be
h=1000 W/m2 °C for the test at ambient temperature, according to [17-19]. However, for the tests at elevated
temperatures, an insulator between the disc and the aluminium adaptor is used. Here, the thermal contact

9
conductance between the disc and the aluminium adaptor is assumed to be completely insulated (h=0 W/m2 °C)
and a prescribed temperature is used as boundary condition for the lower part of the disc, see Figure 2.
In the calibration process, the parameters controlling the convection cooling and the thermal resistances have
been determined by minimizing the differences between the measured temperatures and the simulated results at
several time points during a test. The corresponding simulated temperatures have been considered with respect to
the average pin and disc temperatures as visible to the thermocamera, see Figure 4. Response surface methods
have been employed using Matlab [20]. For most of the work, three-level full factorial variations of variables
have been used to build response surfaces having full quadratic terms. The final choice of convection cooling
and heat partitioning parameters is an outcome of visualization of these response surfaces, but also from
optimization analyses based on these response surfaces by use of the Matlab optimization toolbox.
Figure 4: Side view of pin-on-disc rig as registered by thermocamera. Black squares indicate areas used for extraction
of average pin and disc temperatures.
2.2.2 Thermoelastic instability
The proposed numerical method is based on a framework for estimating TEI in contact surfaces that integrates
four submodels to determine pressure, temperature, wear, and updated geometry, respectively.
Figure 5 shows this framework and the relationships between the four submodels. It is assumed that the pin and
disc surfaces are completely smooth. As the main target of this study is TEI in the pin, the pin contact surface is
divided into i × j rectangular elements (i.e., i elements in the x direction and j elements in the y direction).

10
h
Material properties, contact conditions,
mesh grids, simulation factors, friction coeff
Inp
ut
GeometryNormally
loaded contact
Wear effect Frictional heatM
ate
ria
l p
ro
perti
es
at
new
te
mp
eratu
re
Material properties
at new temperature
Surface temperature distribution over timeO
utp
ut
p,
a,
µf
Kw , ts , ( p + pt )
Figure 5: Framework and relationships between the four submodels.
Normally loaded contact model
The boundary element method by Björklund and Andersson [21] is used to predict contact pressures. It is
assumed that the pressure on each cell is acting in the normal direction and thus independent of tangential
tractions.
Knowing the gap, g, between two surfaces, the pressure for all elements can be solved in matrix form as
(6)
where Cp is the influence coefficient matrix. Each component, Ci,jp, relates the deformation at element i to the
unit pressure in cell j. The influence coefficients for a uniform pressure on a rectangular cell were found by Love
[22]. The global displacement is δz, which can be regarded as the distance the two contact surfaces would have
overlapped without any interaction. The equation is solved by iteratively varying δz to find the known applied
normal force. As the apparent contact area is known in advance for conformal contacts, it is first estimated as the
region where the two contacting surfaces interpenetrate without any deformation. Solving Eq. (6) will result in
some pressures having negative values, indicating that these elements are outside the contact region. These
elements are removed and Eq. (6) is solved again until all pressures become positive.
Since the contact pressures on some asperities exceed the yield stresses, the resulting deformation is plastic
rather than elastic. An approximate approach to account for this is to include an ideal plastic material model that

11
limits the allowable pressure [23]. Thus, Eq. (6) is first solved by removing all negative pressures. The pressures
in the contact region are then inspected; the pressures on some elements exceeding the allowable pressures, pa,
are set to this limit value and then removed from subsequent iterations. These elements are considered plastically
deformed and still contribute to deforming the elastic elements. Iteration is resumed until all pressures are
positive and less than or equal to the allowable pressure. The allowable pressure level can, for example, be set as
the ultimate stress or the hardness of the materials [23]. Note that the allowable pressure is temperature-
dependent. Thus, the value of the allowable pressure on each element depends on the temperature of the element.
The output of the normally loaded contact model is the pressure of all elements and the real contact area.
Contact temperature model
The contact temperature model computes the local contact temperature and the current values of the temperature-
dependent material properties. According to Knothe and Liebelt [24], the Péclet number, which may be
interpreted as the ratio between the surface speed and the rate of diffusion of heat into the solid, is given by:
(7)
If L > 10, heat conduction occurs only perpendicularly to the contact plane, i.e., in the z-direction [24]. Note that
the same coordinate system was utilized in this work as introduced by Knothe and Liebelt. In our case, the Péclet
number, L, is quite large, i.e., L>100 [24]. As a result, longitudinal and lateral heat conduction, i.e., in the x- and
y-directions, can be neglected. The assumptions applied in the submodel are as follows:
the effects of elastic deformation are negligible;
the frictional losses are transformed completely into heat and not into wear particle formation;
heat losses due to radiation and convection are negligible in the contact; and
the frictional heat flows into both bodies.
The method proposed by Knothe and Liebelt [24] is based on a 2D solution for arbitrary pressure distribution.
However, here the method is generalized for three dimensions, as follows:
√ √
∑
(√ √ ) (8)
(9)

12
where T0 is the base temperature, i.e., the surface temperature away from the contacting surfaces. Note that there
is no rolling in the pin-on-disc machine, so vv = vs .
In this model, the heat-partitioning factor α is assumed time and temperature-dependent and follows the method
proposed by Yevtushenko and Grzes [25].
The material properties, such as the elastic modulus, E, the allowable pressure (yield limit), pa, and the thermal
properties that are used as input to the other submodels depend on the surface temperature. Using the calculated
local contact temperatures and interpolating the values for the material properties from Table 2 leads to a
reasonable estimate of the material properties in each cell based on their temporary temperature. The calculated
contact temperatures are local contact temperatures, which are used to define the local elastic modulus, and the
local ultimate stresses that are used as the allowable pressures in the normally loaded contact model.
Table 2: The temperature dependent material properties for railway cast iron [26]
Temperature ( °C) 25 100 300 500 600
Elastic modulus (GPa) 103 100 93 85 81
Thermal expansion (1/°C) 10 × 10-6 10.5 × 10⁻⁶ 11.75 × 10⁻⁶ 13 × 10-6 13.3 × 10⁻⁶
Specific heat (J/ kg °C) 520 540 615 775 820
Thermal conductivity (W/m °C) 48 47.7 43.8 37.4 34.1
Allowable pressure (MPa) 350 330 206 193 103
Compressive stresses due to thermal expansion
The elevated temperature in the contact surface induces local thermal expansion of both pin and disc, causing
non-uniform expansion in cells. As one-dimensional heat transfer was assumed for the pin cells in the contact
area, they behave as interconnected insulated rods. The interconnection condition balances the thermally induced
compressive and tensile stresses as the mean pressure is not temperature-dependent. We therefore have
( ) ( ) ( ) ( ) (10)
∑ ( ) (11)
The neutral temperature, Tni, is calculated through eqs. (10) and (11) for each cell. However, this temperature
generally does not correspond to mean pressure because of the non-linear temperature-dependence of thermal
expansion and elastic modulus. After this the compressive or tensile stresses are determined for each cell.
13
Wear process and updated geometry
The sliding contact between the pin and disc causes wear of both objects. In this study, we neglect the wear
process on the disc and assume that only the pin is worn. Based on this assumption, we can predict the wear in
each cell of the pin using Archard’s wear model. We can therefore estimate the thickness of the worn material
for each cell in every time step as
( ( )) ( ) ( ) (12)
This incremental wear means that the geometries of the two mating surfaces do not fulfil the initial condition. It
is therefore necessary to update the geometry and then, for the updated geometry, to calculate and update both
the pressure and the temperature. The summary of the whole process is elaborated on in Figure 6.
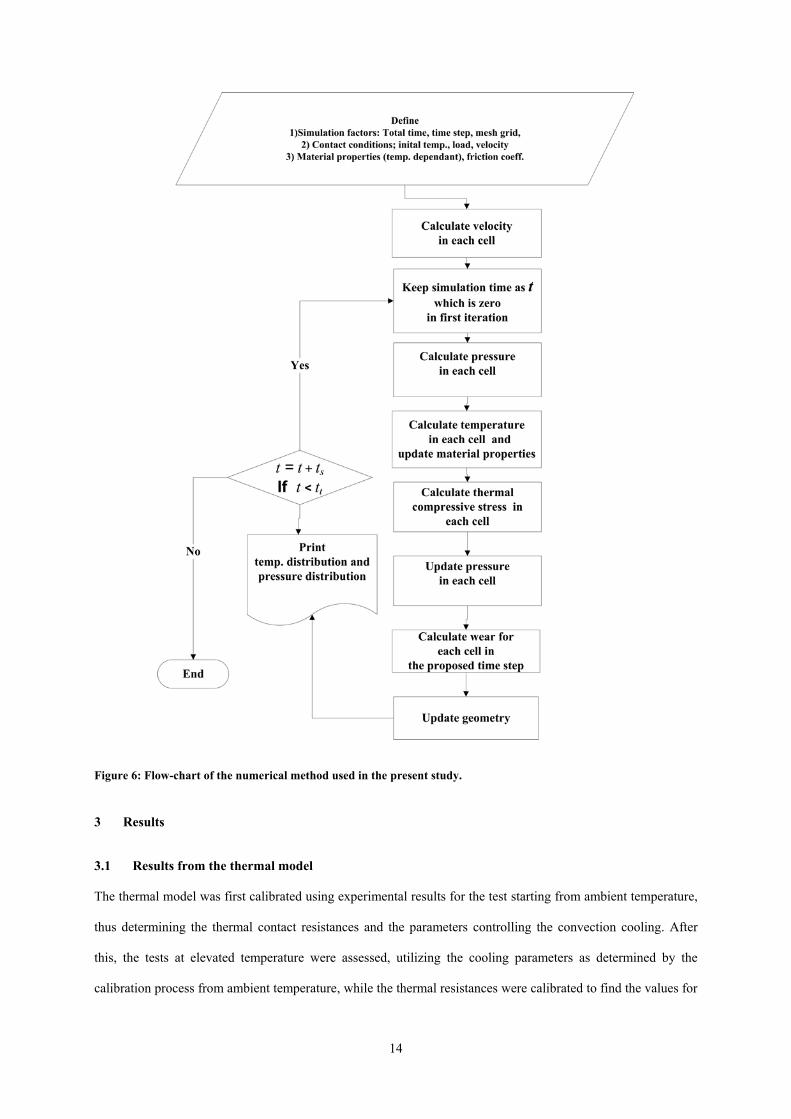
14
Figure 6: Flow-chart of the numerical method used in the present study.
3 Results
3.1 Results from the thermal model
The thermal model was first calibrated using experimental results for the test starting from ambient temperature,
thus determining the thermal contact resistances and the parameters controlling the convection cooling. After
this, the tests at elevated temperature were assessed, utilizing the cooling parameters as determined by the
calibration process from ambient temperature, while the thermal resistances were calibrated to find the values for

15
the high temperatures. Examples of measured temperatures and temperatures calculated by the calibrated model
are given in Figure 7 for testing at ambient temperature and at a temperature of 300 °C. The temperatures from
the calibrated model can be seen to follow the measured temperatures for the main part of the testing time which
is about 20 min for these tests. Note that the large variations of the (maximum) experimental pin temperature are
a result of the movements of hot spots at the disc contact. By use of the calibrated model it is now possible to
illustrate the heat partitioning between pin and disc during a test. Figure 8 illustrates results from testing at
ambient temperature and at a temperature of 300 °C. To determine the disc heating at the elevated temperature
levels it is utilised that the disc temperature is stationary, meaning that the heat into the disc equals the heat lost
by cooling which is found by employing standard post-processing routines.
A summary of the heat partitioning values towards the end of the tests are given in
Table 3. The results show that the part of the thermal power that goes to the pin increases with (disc) testing
temperature up to 500 °C and then decreases for higher temperature. This transition between 500 °C and 550 °C
means a drop in the fraction of the heat that goes to the pin from about 20% to 15%.
Figure 7: Comparison between pin and disc temperatures from experiments and from calculations using the
calibrated thermal model. Results are given for test at ambient temperature and for test at 300 °C.

16
Figure 8: History of friction heat to pin at different temperatures. Results are given for test at ambient temperature
and for test at 300 °C.
Table 3: Calculated heat partitioning values towards end of tests. Note that the disc is heated by an external heat
source when testing at elevated temperature. Note that all the tests except for one of them have a rotational disc speed
of v = 3180 rpm.
Disc test temperature Heat partitioning
T0 (°C) Qpin/Qtotal
Qdisc/Qtotal
Ambient temperaturea 0.105 0.895
Ambient temperature 0.155 0.846
200 0.230 0.770
300 0.185 0.815
400 0.181 0.819
500 0.204 0.796
550 0.155 0.845
600 0.155 0.845
a This case has a rotational disc speed of v = 2120 rpm
Figure 9: Average pin temperature at contact with respect to disc temperature towards end of the test (left). Heat
parts going to disc and pin as functions of average disc temperature (right). Note different scales in right figure.

17
Figure 9 illustrates the pin temperatures and heat introduced into disc and pin as a function of disc temperature.
Note that the heat going to the disc is supplied both from frictionally induced heating and from heating with the
external induction heater. These results show that the pin temperature increases by increasing disc temperatures
up to an elevated temperature of 500 °C. This agrees with the results in
Table 3 which shows the heat partitioning to the pin. Moreover, the heat to pin follows the same trend as the
average pin temperature with respect to disc temperature, see Figure 9 (right).
3.2 Results from thermoelastic model
Figure 10 shows typical results from the physical experiments. The hot region of the pin is seen to move
from the left to the right side of the pin. Figure 11 shows the friction force at a sliding velocity of 8.5 m/s and a
load of 2 kg.
Figure 10: Temperature distribution on pin surface and moving hot spot. Data from thermal camera.
Figure 11: The friction force between cast iron pin and disc changes over time. The initial temperature was room
temperature, the normal force was 20 N, and the sliding velocity was 8.5 m/s. Data from Vernersson et al. [7].

18
Figure 12 presents the specific wear rate of a cast iron pin at various temperatures. These data
are extracted from Vernersson et al. [7] based on the material loss of the pin at various initial contact
temperatures. The increase in the specific wear rate with temperature can be explained by oxidation wear. The
oxidation rate increases with temperature (and moisture); this creates an oxide layer that is brittle and easily
worn off, giving a wear rate that increases with temperature. At a specific temperature, the oxidation rate
becomes large enough to create a more stable and thus a more wear-resistant oxide layer. Figure
12 shows that the specific wear rate drastically decreases at temperatures above 500°C.
Figure 12: Specific wear rate of a cast iron pin at various temperatures

19
Figure 13: Typical results from thermocamera. In this case, initial temperature is room temperature, load 2 kg, and
sliding velocity 8.5 m/s. The figure depicts the average, maximum, and minimum temperatures for surfaces of the pin
and disc exposed to the thermocamera. There is an increasing general trend for all recorded temperatures for the
disc, while the temperature recorded for the pin surface sometimes drops.
The temperature drops as registered for the pin temperatures in Figure 13 can be explained by hot spots moving
in the pin contact; occasionally the hot spots are in the view of the thermocamera but at other times they are at
the other corner of the pin where they are out of the view from the camera. When the hot spots move out of view,
drops in pin maximum and average temperature are registered, the drops in maximum temperature being more
distinct. This problem does not occur for the minimum pin temperature or the average, maximum, and minimum
disc temperatures as no moving hot spots are observed in these cases.
(a)
20
(b)
(c)
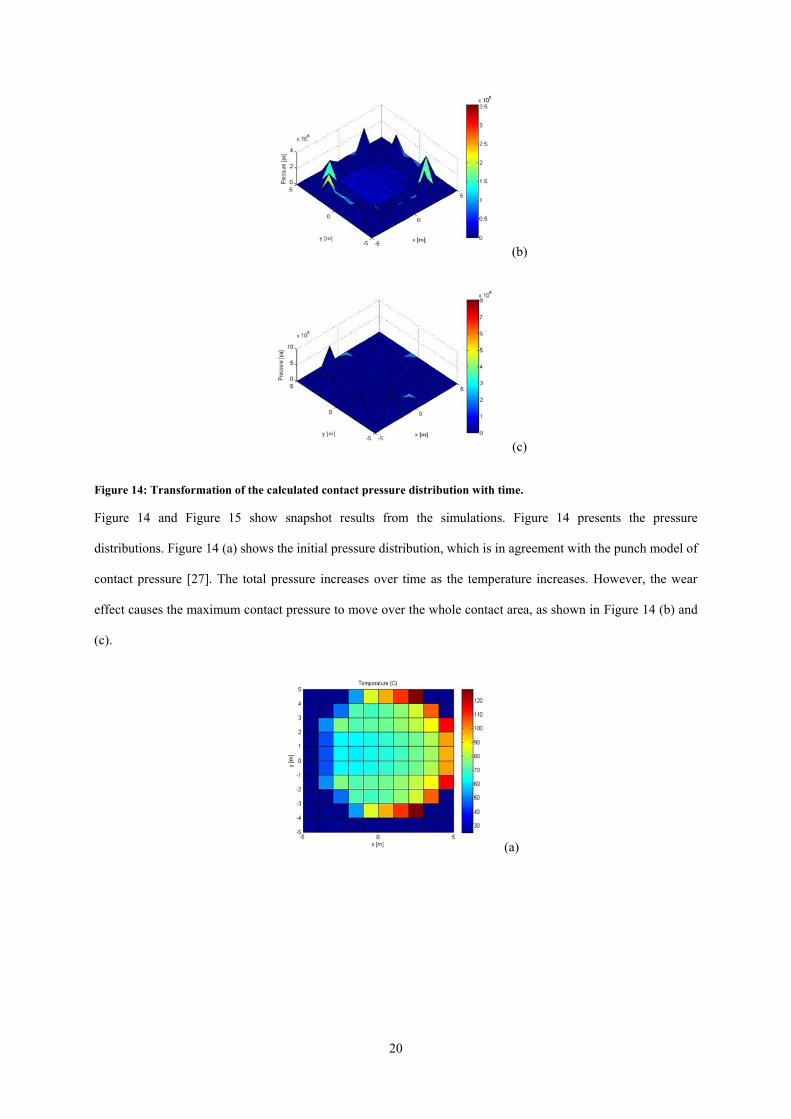
Figure 14: Transformation of the calculated contact pressure distribution with time.
Figure 14 and Figure 15 show snapshot results from the simulations. Figure 14 presents the pressure
distributions. Figure 14 (a) shows the initial pressure distribution, which is in agreement with the punch model of
contact pressure [27]. The total pressure increases over time as the temperature increases. However, the wear
effect causes the maximum contact pressure to move over the whole contact area, as shown in Figure 14 (b) and
(c).
(a)

21
(b)
(c)
Figure 15: Temperature distribution on contact surface. The temperature increases over time and the hot spot moves
over the whole contact surface.
Figure 15 shows the temperature distributions. In the initial stage (Figure 15a), the maximum temperature occurs
in places with the highest contact pressure and the highest sliding velocity. Figure 15b shows the temperature
increase in various cells; however, the hot spots are still on the right side of contact surface. In Figure 15c, the
hot spots have moved to the left side of the contact surface, which is a result of the shift of the highest local
pressures caused by local wear at the points of initial contact.
4 Concluding remarks and outlook
The current study has demonstrated two different approaches for studying the thermomechanical interaction at a
pin-on-disc test using one of the most common railway braking materials, i.e., cast iron, at ambient and at
elevated disc temperatures. First, the thermal problem was studied by a finite element approach where a model
was calibrated using measured temperatures to reveal the heat partitioning in the pin-on-disc test. It has been
shown that the heat flux to the pin (and the pin temperature) increases by increasing disc temperatures up to an
elevated temperature of 500 °C. This also corresponds to an increase in wear rate that was found in the
experimental study [7]. The results show that the part of the heat that goes to the pin drops by about 25%
(Qpin / Qtotal decreases from 0.205 at 500 °C to 0.155 at 550 °C) for disc temperatures higher than the transition
22
temperature 500 °C. The decrease in wear rate above the transition temperature has previously been explained by
formation of a layer of stable oxides in the contact surface, which according to the new findings also modifies
the part of the heat entering the pin. The two-dimensional model and methodology developed may be used to
predefine the heat partitioning factor for thermoelastic analysis in a sequential multiphysics workflow.
In the second part of the work, a numerical model has been developed to study the transient thermoelastic
behaviour of the pin during pin-on-disc tests by assuming that the pin has been built up by finite rectangular
elements. It is shown that the contact pressure increases over time as the temperature increases. Both temperature
and pressure vary over the contact area which can explain the hot spot movement on the pin. The results indicate
that the proposed methodology can be used to predict different TEI phenomena for railway braking materials. Its
usage can be extended to other applications, if the required material data are known. The results of these
simulations are promising, but the analysis was qualitative to study the main phenomena occurring. Therefore,
further studies are needed to improve this model, for example, by considering disc wear, initial roughness, and
discontinuities on both disc and pin (grooves), and to identify and represent hot spots and potential regions of
material transformation, for example, to martensite, on the disc surface. It is also highly relevant to include other
surface cooling effects, such as convection and radiation from the pin and disc surfaces. Another challenge
would be to find the most suitable and efficient cell size and time step in the calculations.
Temperature fluctuations and thermoelastic instability, and consequently hot spot evolution in railway tread
braking, are likely to occur due to contact conditions such as pressure distribution and heat partitioning.
Therefore, studying the effect of material properties and thermal capacity of railway wheels and brake blocks can
help to develop the performance of this type of frictional braking. These contact mechanics phenomena generate
challenging problems that result from the complexity of physical effects that occur at and in the surrounding of
the interfacing surfaces. These effects are still not fully understood and much research remains to be done.
ACKNOWLEGMENT
This research was performed in cooperation between the Railway Group at KTH – Royal Institute of
Technology, Stockholm, and the Competence Centre CHARMEC (Chalmers Railway Mechanics) at Chalmers
University of Technology, Gothenburg, Sweden. The authors acknowledge the valuable assistance of Mr Yi Zhu
and Mr Aftab Ahmad at KTH. Professor Emeritus Bengt Åkesson assisted in improving the manuscript.

23
REFERENCES
1 Talati, F. and Jalalifar, S. Analysis of heat conduction in a disk brake system. Heat and Mass
Transfer/Waerme- und Stoffuebertragung, 2009, 45(8), 1047-1059.
2 Barber, J. R. The influence of thermal expansion on the friction and wear process. Wear, 1967, 10(2),
155-159.
3 Burton, R. A. Thermal deformation in frictionally heated contact. Wear, 1980, 59(1), 1-20.
4 Sellgren, U. Simulation of brake block induced corrugation on railway wheels. 1998, 8th Int. ANSYS
Conference, August 17-19, 1998, Pittsburgh, PA, USA.
5 Vernersson, T. Tread braking of railway wheels - noise-related tread roughness and dimensioning wheel
temperatures, Doctoral Dissertation, Department of Applied Mechanics, Chalmers University of Technology,
Gothenburg, Sweden, 2006, 136 pp.
6 Geijselaers, H. J. M. and Koning, A. J. E. Finite element analysis of thermoelastic instability with
intermittent contact. Tribology, 2000, 122, 42-46.
7 Vernersson, T., Lundén, R., Abbasi, S., and Olofsson, U. Wear of railway brake block materials at
elevated temperatures ─ pin-on-disc experiments. Proceedings EuroBrake Conference, Dresden, Germany,
2012.
8 Vernersson, T. Thermally induced roughness of tread-braked railway wheels, Part 1: brake rig
experiments. Wear, 1999, 236(1-2), 96-105.
9 Wong, H. Y. Handbook of essential formulae and data on heat transfer for engineers, Longman, New
York, 1977, p. 236.
10 Churchill, S. W. and Chu, H. H. S. Correlating equations for laminar and turbulent free convection from
a vertical plate. International Journal of Heat and Mass Transfer, 1975, 18(11), 1323-1329.
11 ABAQUS/Standard. Online Documentation, Version 6.11, Dassault Systèmes, 2011.
12 Godet, M. The third-body approach: A mechanical view of wear. Wear, 1984, 100(1-3), 437-452.
13 Godet, M. Third-bodies in tribology. Wear, 1990, 136(1), 29-45.
14 Laraqi, N. Velocity and relative contact size effects on the thermal constriction resistance in sliding solids.
Journal of Heat Transfer, Transactions of the ASME, 1997, 119(1), 173-177.
15 Salti, B. and Laraqi, N. 3-D numerical modeling of heat transfer between two sliding bodies: temperature
and thermal contact resistance. International Journal of Heat and Mass Transfer, 1999, 42(13), 2363-2374.
24
16 Vernersson, T. Temperatures at railway tread braking, Part 1: modelling Proceedings of the Institution of
Mechanical Engineers, Part F: Journal of Rail and Rapid Transit, 2007, 221(2), 167-182.
17 Lewis, D. V. and Perkins, H. C. Heat transfer at the interface of stainless steel and aluminum-the
influence of surface conditions on the directional effect. International Journal of Heat and Mass Transfer, 1968,
11(9), 1371-1383.
18 Parmenter, K. E. and Marschall, E. Influence of surface preparation on thermal contact conductance of
stainless steel and aluminum. Experimental Heat Transfer, 1995, 8(3), 195-208.
19 Madhusudana, C. V. Thermal contact conductance. Mechanical engineering series, 99-0867300-9,
Springer-Vlg, New York, 1996, p. 165.
20 Matlab, Users manual, in Natick, I. Mathsworks, Editor: MA. USA 2010.
21 Björklund, S. and Andersson, S. A numerical method for real elastic contacts subjected to normal and
tangential loading. Wear, 1994, 179(1-2), 117-122.
22 Love, A. E. H. The Stress Produced in a Semi-Infinite Solid by Pressure on Part of the Boundary.
Philosophical Transactions of the Royal Society of London. Series A, Containing Papers of a Mathematical or
Physical Character, 1929, 228, 377-420.
23 Marshall, M. B., Lewis, R., Dwyer-Joyce, R. S., Olofsson, U., and Björklund, S. Experimental
characterization of wheel-rail contact patch evolution. Journal of Tribology, 2006, 128(3), 493-504.
24 Knothe, K. and Liebelt, S. Determination of temperatures for sliding contact with applications for wheel-
rail systems. Wear, 1995, 189(1-2), 91-99.
25 Yevtushenko, A. and Grzes, P. Finite element analysis of heat partition in a pad/disc brake system.
Numerical Heat Transfer; Part A: Applications, 2011, 59(7), 521-542.
26 Sellgren, U. Brake block and wheel interaction - clarification and prediction of physical behaviour with
numerical modeling and simulation, Department of Machine Design, Royal Institute of Technology (KTH), 1999.
27 Johnson, K. L. Contact mechanics, Cambridge University Press, 1985, p. 452.