POSTPARTUM DEPRESSION: DO INTRAPARTUM EVENTS...
93
Postpartum Depression: Do Intrapartum Events Matter? Item Type text; Electronic Dissertation Authors Evans, Heather L. Publisher The University of Arizona. Rights Copyright © is held by the author. Digital access to this material is made possible by the University Libraries, University of Arizona. Further transmission, reproduction or presentation (such as public display or performance) of protected items is prohibited except with permission of the author. Download date 19/07/2018 09:44:55 Link to Item http://hdl.handle.net/10150/195740
Transcript of POSTPARTUM DEPRESSION: DO INTRAPARTUM EVENTS...

Postpartum Depression: Do Intrapartum Events Matter?
Item Type text; Electronic Dissertation
Authors Evans, Heather L.
Publisher The University of Arizona.
Rights Copyright © is held by the author. Digital access to this materialis made possible by the University Libraries, University of Arizona.Further transmission, reproduction or presentation (such aspublic display or performance) of protected items is prohibitedexcept with permission of the author.
Download date 19/07/2018 09:44:55
Link to Item http://hdl.handle.net/10150/195740

POSTPARTUM DEPRESSION:
DO INTRAPARTUM EVENTS MATTER?
by
Heather Lin Evans
________________________
A Dissertation Submitted to the Faculty of the
COLLEGE OF NURSING
In Partial Fulfillment of the Requirements
For the Degree of
DOCTOR OF PHILOSOPHY
In the Graduate College
THE UNIVERSITY OF ARIZONA
2 0 0 8

2
THE UNIVERSITY OF ARIZONA
GRADUATE COLLEGE
As members of the Dissertation Committee, we certify that we have read the dissertation
prepared by Heather Lin Evans
entitled “Postpartum Depression: Do Intrapartum Events Matter?”
and recommend that it be accepted as fulfilling the dissertation requirement for the
Degree of Doctor of Philosophy.
_______________________________________________________________________ Date: November 3, 2008
Judith Berg, PhD, RNC, WHNP, FAANP, FAAN
_______________________________________________________________________ Date: November 3, 2008
Terry Badger, PhD, RN, PMHCNS-BC, FAAN
_______________________________________________________________________ Date: November 3, 2008
Melissa Goldsmith, PhD, RNC
Final approval and acceptance of this dissertation is contingent upon the candidate’s
submission of the final copies of the dissertation to the Graduate College.
I hereby certify that I have read this dissertation prepared under my direction and
recommend that it be accepted as fulfilling the dissertation requirement.
________________________________________________ Date: November 3, 2008
Dissertation Director: Judith Berg, PhD, RNC, WHNP, FAANP, FAAN

3
STATEMENT BY AUTHOR
This dissertation has been submitted in partial fulfillment of requirements for an
advanced degree at The University of Arizona and is deposited in the University Library
to be made available to borrowers under rules of the Library.
Brief quotations from this dissertation are allowable without special permission,
provided that accurate acknowledgment of source is made. Requests for permission for
extended quotation from or reproduction of this manuscript in whole or in part may be
granted by the head of the major department or the Dean of the Graduate College when in
his or her judgment the proposed use of the material is in the interests of scholarship. In
all other instances, however, permission must be obtained from the author.
SIGNED: Heather Lin Evans

4
ACKNOWLEDGMENTS
The hard work and dedication for completing this dissertation has been shared by
many. I was fortunate to work under the guidance of a skilled dissertation committee. Dr
Berg, my dissertation chairperson, offered her extensive experience and wisdom in order
to guide and mentor me through this process. I was honored to work with a scientist of
her caliber and will be forever grateful for her encouragement. I was mentored by Dr
Goldsmith as an undergraduate and her support of my learning continued into my
graduate education. I aspire to have her calm confidence. Dr Badger was the voice of
reason many times throughout my graduate program, as she guided me in the right
direction.
I want to thank Ashley Evans, who started this journey with me and supported me
with friendship through the first semesters of learning. Her sense of humor and wit will
not be forgotten.
Over the past four years I have had a strong voice of constant encouragement and
support. Linda Boelke, my mother, has been the greatest cheerleader one could wish for.
My mother believed in my ability to complete this dissertation when my own confidence
wavered. I hope someday to have her optimism.
My most sincere gratitude is extended to the two men in my life. Brian Evans, my
husband, was my partner throughout this entire process. He makes hard work look
effortless and has taken on much more than his share so that I could focus on my
dissertation. One could not wish for a better friend than I have in my husband. William
Evans, my son, inspires me with his energy and sense of humor. His hugs, kisses, and
silliness were welcome distractions from my studies. I love my husband and son
endlessly and owe them greatly for the sacrifices they have made so that I could
accomplish my dream.

5
DEDICATION
This is dedicated to my son, William Evans.
6
TABLE OF CONTENTS
LIST OF ILLUSTRATIONS...............................................................................................9
LIST OF TABLES.............................................................................................................10
ABSTRACT.......................................................................................................................11
CHAPTER 1: BACKGROUND AND SIGNIFICANCE..................................................13
Introduction...............................................................................................................13
Background ...............................................................................................................13
Definitions.................................................................................................................15
Postpartum Depression (PPD) ........................................................................15
Intrapartum ......................................................................................................16
Postpartum .......................................................................................................16
Postnatal ..........................................................................................................16
Critical Access Hospital ..................................................................................16
Rural ................................................................................................................17
Study Variables ................................................................................................17
Problem and Purpose ................................................................................................18
Specific Aims............................................................................................................18
Research Questions...................................................................................................18
Significance...............................................................................................................19
Summary...................................................................................................................20
CHAPTER 2: CONCEPTUAL FRAMEWORK AND LITERATURE REVIEW...........21
Introduction...............................................................................................................21
Diathesis Stress Model..............................................................................................21
Hypothetical Diathesis-Stress Model for Exploration of Postpartum Depression ...23
Research Variables ...................................................................................................27
Intrapartum Events ..........................................................................................27
Caesarean section ...................................................................................27
Labor induction.......................................................................................28
Labor augmentation................................................................................29
Pain medication ......................................................................................29
Prolonged first stage of labor .................................................................30
Prolonged second stage of labor ............................................................31
Episiotomy...............................................................................................32
Degree of perineal laceration .................................................................32
Postpartum Depression....................................................................................32
Literature Review......................................................................................................33
Postpartum Depression Risk Factors ..............................................................34
Intrapartum Events and Postpartum Depression ............................................35
Conclusion ................................................................................................................40

7
TABLE OF CONTENTS – Continued
CHAPTER 3: METHODS.................................................................................................41
Introduction...............................................................................................................41
Design .......................................................................................................................41
Setting and Sample ...................................................................................................42
Setting ..............................................................................................................42
Sample..............................................................................................................42
Power analysis ........................................................................................43
Data Collection Procedures.......................................................................................43
Instrumentation .........................................................................................................44
Edinburgh Postnatal Depression Scale (EPDS)..............................................46
Data Management .....................................................................................................47
Data Analysis ............................................................................................................48
Summary...................................................................................................................49
CHAPTER 4: RESULTS...................................................................................................50
Introduction...............................................................................................................50
Sample ......................................................................................................................50
Research Findings.....................................................................................................52
Specific Aim One..............................................................................................52
Specific Aim Two..............................................................................................53
Specific Aim Three ...........................................................................................54
Research question 1 ................................................................................54
Research question 2 ................................................................................56
Summary...................................................................................................................68
CHAPTER 5: DISCUSSION.............................................................................................69
Introduction...............................................................................................................69
Discussion.................................................................................................................69
Sample..............................................................................................................69
Specific Aim One..............................................................................................70
Specific Aim Two..............................................................................................71
Specific Aim Three ...........................................................................................71
Diathesis – Stress Model..................................................................................74
Limitations ................................................................................................................75
Significance of Research Findings............................................................................76
Implications for Further Research ............................................................................77
Summary...................................................................................................................77

8
TABLE OF CONTENTS – Continued
APPENDIX A: EDINBURGH POSTNATAL DEPRESSION SCALE (EPDS) ............79
APPENDIX B: UNIVERSITY OF ARIZONA INSTITUTIONAL REVIEW BOARD
(IRB) APPROVAL.................................................................................82
APPENDIX C: FACILITY CONSENT FORM...............................................................85
REFERENCES ..................................................................................................................87

9
LIST OF ILLUSTRATIONS
FIGURE 1: Meehl’s Diathesis-Stress Model ...................................................................25
FIGURE 2: Diathesis-Stress Model Variation .................................................................25
FIGURE 3: Diathesis-Stress Model for Postpartum Depression .....................................26

10
LIST OF TABLES
TABLE 1: Constructs and Variables .................................................................................45
TABLE 2: Age for Included and Excluded Cases .............................................................51
TABLE 3: Characteristics of Sample ................................................................................52
TABLE 4: Frequency of Stressors.....................................................................................53
TABLE 5: Frequency of EPDS Scores at Two and Six Weeks Postpartum .....................54
TABLE 6: Number of Stressors.........................................................................................55
TABLE 7: Correlation of EPDS with Number of Intrapartum Stressors at Two and Six
Weeks Postpartum ...........................................................................................56
TABLE 8: Stepwise Regression at Two Weeks Postpartum.............................................58
TABLE 9: Two Week Model Variance .............................................................................61
TABLE 10: Stepwise Regression at Six Weeks Postpartum...............................................62
TABLE 11: Six Week Model Variance ...............................................................................65
TABLE 12: Two and Six Week EPDS Scores for Pitocin and No Pitocin .........................67

11
ABSTRACT
Approximately 500,000 women in the US suffer from postpartum depression (PPD)
every year. Yet only half of women affected seek treatment. PPD affects the entire family
unit, altering parenting behaviors and increasing prevalence of depression among male
partners of women suffering from PPD. In addition, infants whose mothers suffer from PPD
have a higher risk of Sudden Infant Death Syndrome (SIDS) and more frequent
hospitalization as well as cognitive and behavioral delays. Despite the significance of PPD to
the health of women and families, most research has focused on the identification and
treatment of PPD. Research pertaining to intrapartum events as possible risk factors for PPD
has been contradictory and variable in quality. The purpose of this study is to examine
possible relationships between intrapartum events and subsequent incidence of postpartum
depression.
The Diathesis-Stress Model provides the foundation for this proposed research, in
which a combination of vulnerability factors (diatheses) in the context of life events (stress)
results in psychopathology (PPD). Vulnerability factors such as previous history of
depression, prenatal anxiety, or low self esteem may interact with intrapartum stressors such
as cesarean section, induction of labor, or use of pain medication to increase PPD
symptomatology. This study will examine the stress component of the Diathesis-Stress
Model. Should intrapartum events prove to have a relationship with Edinburgh Postnatal
Depression Scale (EPDS) score, future research will focus on the interaction of both the
diatheses and the stressors in determining risk for PPD.
The study design was a retrospective descriptive design aimed at identifying
relationships between intrapartum events and PPD. A chart review was performed to identify

12
intrapartum events and scores on the Edinburgh Postnatal Depression Scale (EPDS) at two-
and six- weeks postpartum. The sample consisted of 102 women who delivered at a specified
rural New England birthing center during 2007. SPSS was used to examine relationships
between specific intrapartum events and EPDS scores at two- and six weeks postpartum.
Nurses commonly interface with women in health care settings and are uniquely
poised to educate them about PPD. Nurses have the unique opportunity to alert women to the
potential risk for PPD and encourage them to report signs and symptoms early. Increased
reporting of symptoms can reduce the number of unidentified cases and promote
interventions that avert some of the devastating emotional, physical, and economic
consequences.

13
CHAPTER 1: BACKGROUND AND SIGNIFICANCE
Introduction
This chapter presents the problem and details background pertaining to
postpartum depression (PPD), defined as depressed mood that occurs in the period after
childbirth (Epperson, 1999). This is followed by background related to a potential
relationship between intrapartum events, defined as stressors that occur during labor and
delivery, and postpartum depression (PPD). The purpose and specific aims of the present
study are detailed and specific related terminology is defined.
Background
Each year, more than 400,000 mothers in the United States experience PPD (Beck
& Gable, 2000). Reported prevalence of PPD symptoms varies widely. Rates of PPD
during the first six months postpartum are reported to be 10-22% in all women and up to
26% among adolescent mothers (Cox, Murray & Chapman, 1993; Llewellyn, Stowe &
Nemeroff, 1997). A 2006 literature review highlighted the discrepancy in reported
prevalence of PPD, indicating that reported prevalence ranges from 0% to 60% in various
culturally specific samples (Halbreich & Karkun, 2006). This shows that previous
estimates of PPD prevalence may not be representative of global prevalence. With some
samples identifying significantly higher PPD rates than other samples, methodological
issues come into question (Leahy-Warren & McCarthy, 2007). Further complicating the
issue, it is estimated that up to 50% of all cases go undetected (Beck & Gable, 2001).
Intrapartum events are any occurrence that takes place while a woman is laboring
and delivering a baby. The most obvious intrapartum events are cesarean section,

14
induction of labor, and the administration of pain medication. These interventions have
become the topic of conversation for both healthcare providers and childbearing women.
As women have moved into the workforce and are leading busy lives, induction of labor
has become attractive, as it allows the woman and her family to plan for the birth. The
use of pain medication in labor continues to polarize health care providers and
childbearing women with some people in favor and others drastically opposed. Cesarean
section is a common intrapartum intervention, with an all time high in 2002 of more than
a quarter (26.1%) of all births in the United States occurring via cesarean section
(London, Ladewig, Ball & Bindler, 2007). Some areas of the United States have cesarean
section rates that approach 40%. World wide, cesarean section rates are as low as 5% or
7% in Bolivia and Peru respectively and as high as 40% in Brazil and Chile (London, et
al., 2007). Aside from pain medication, labor induction, and cesarean section, however,
there are many other important aspects of the intrapartum time period that can be
explored such as placement of an intravenous catheter, labor augmentation, use of
vacuum extractor/forceps for delivery assistance, and length of time spent in each stage
of labor.
The majority of the current literature pertaining to PPD and intrapartum events
was conducted using samples of women living in the European Union (EU). Much of the
recent literature describing North American women was conducted by Beck (1993, 1996,
2001, 2002, 2003), and comes from a sample of white, mid-upper socioeconomic status
women residing in urban settings. These samples may not be representative of other

15
women residing in the United States. This researcher has not identified any PPD literature
conducted using a sample of women living in rural, North American settings.
PPD may result in altered family functioning. Women who experience PPD
symptoms may have difficulty transitioning into the mother role, as women with major
PPD have described more profound emotional responses to their maternal role transitions
(Clemmens, Driscoll & Beck, 2004). Altered maternal/child interactions have been
identified in women who suffer from PPD (Sagami, Kayama & Senoo, 2004; Edhborg,
Lundh, Seimyr & Widstrom, 2003; and Wisner, Chambers & Sit, 2006). Prenatal and
postpartum depressive symptoms have also been associated with problem behaviors in
male children of depressed mothers (Carter, Frampton & Mulder, 2006) and risk for later
psychopathology in the children of mothers with PPD (Forman, O’Hara, Stuart, Gorman,
Larsen & Coy, 2007). In addition, the incidence of paternal depression in community
samples ranges from 1.2%-25.5% but paternal depression ranges from 24%-50% in
samples of men whose partners were experiencing PPD (Goodman, 2004).
Definitions
Postpartum Depression (PPD)
PPD is a clinical term that refers to a depressive episode that is associated with
childbirth (Epperson, 1999). PPD is a treatable mood disorder (Beck & Gable, 2001) that
may begin at 24 hours after birth or several months postpartum but typically has an onset
between two and six weeks postpartum (Epperson, 1999). PPD is not recognized as being
distinct from nonpuerperal depression by the Diagnostic and Statistical Manual of Mental

16
Disorders (DSM-IV) but there is the possible addition of a postpartum-onset specifier for
clients whose onset of depression was within four weeks of delivery (Epperson, 1999).
Intrapartum
The intrapartum time period begins with the onset of labor and ends with the
delivery of the infant and placenta (London, et al., 2007). This time period is sometimes
referred to in health care as labor and delivery.
Postpartum
The postpartum time period begins with the delivery of the placenta and continues
until the woman’s body returns to a non-pregnant condition (London, et al., 2007). This
may last anywhere from 9 months to 18 months.
Postnatal
Postnatal is synonymous with the term postpartum. The word ‘postnatal’ is more
frequently used in European literature whereas the term ‘postpartum’ is more frequently
used in North American literature.
Critical Access Hospital
A Critical Access Hospital (CAH) is a facility that meets specific criteria defined
by the Center for Medicaid Services. The Critical Access Facility must:
1) be located in a State that has established with CMS a Medicare rural hospital
flexibility program; and
2) be designated by the State as a CAH; and
3) be currently participating in Medicare as a rural public, non-profit or for-profit
hospital; or was a participating hospital that ceased operation during the 10-year
17
period from November 29, 1989 to November 29, 1999; or is a health clinic or
health center that was downsized from a hospital; and
4) be located in a rural area or is treated as rural; and
5) be located more than a 35-mile drive from any other hospital or CAH (in
mountainous terrain or in areas with only secondary roads available, the mileage
criterion is 15 miles); and
6) maintain no more than 25 inpatient beds; and
7) maintain an annual average length of stay of 96 hours per patient for acute
inpatient care; and
8) comply with all CAH Conditions of Participation, including the requirement to
make available 24-hour emergency care services seven days per week.
(Department of Health & Human Services, 2008).
Rural
The U.S. Census Bureau (2007) defines rural as a territory, population or housing
unit which is not classified as urban. To be classified as urban, the territory, population or
housing units generally consists of a large central place and adjacent densely settled
census blocks that together have a total population of at least 2,500 for urban clusters, or
at least 50,000 for urbanized areas (U.S. Census Bureau, 2007).
Study Variables
Independent and dependent variables are defined and discussed in Chapter 2.

18
Problem and Purpose
Current research has focused on the identification and treatment of PPD and the
identification of pre-disposing risk factors. A thorough examination of intrapartum events
as possible risk factors has not been performed, with current literature contradictory and
variable in quality. The purpose of this study was to examine relationships between
intrapartum events and postpartum depression.
Specific Aims
The three specific aims identified were:
1) To describe the number of intrapartum events experienced by women
who gave birth in a birthing center located in rural New England
during the 2007 calendar year.
2) To describe PPD scores on the Edinburgh Postpartum Depression
Scale at two- and six- weeks postpartum for this sample.
3) To explore the relationship between number of intrapartum events and
Edinburgh Postnatal Depression Scale scores in women in this sample
at two- and six-weeks postpartum.
Research Questions
Two research questions were identified:
1) Does the number of intrapartum events have a relationship with the
Edinburgh Postnatal Depression Scale score at both two- and six-
weeks postpartum?

19
2) Do some intrapartum events have more significant relationships to
Edinburgh Postnatal Depression Scale scores than other intrapartum
events?
Significance
Current knowledge indicates more than 400,000 women in the United States
suffer from PPD annually (Beck & Gable, 2000). Reported prevalence of PPD symptoms
varies widely. Rates of PPD during the first six months postpartum are reported to be 10-
22% in all women and up to 26% among adolescent mothers (Cox, Murray & Chapman,
1993; Llewellyn, Stowe & Nemeroff, 1997). Halbreich & Karkun (2006) report the
prevalence of PPD as high as 60% in some culturally specific samples, but note many
discrepancies in prevalence rates reported. Prevalence of PPD symptoms was more than
23% in a sample of Native American women (Baker, Cross, Greaver, Wei, Lewis &
Healthy Start CORPS, 2005), 25.6% of Turkish women participating in a study screened
at a high PPD level (Dindar & Erdogan, 2007), and 22% of mothers from a sample of
Iranian women screened positive for PPD symptomatology (Montazeri, Torkan &
Omidvari, 2007). This demonstrates previous estimates of PPD prevalence may not be
representative of global prevalence. With some samples identifying significantly higher
PPD rates than other samples, methodological issues come into question (Leahy-Warren
& McCarthy, 2007). Further complicating the issue, it is estimated that up to 50% of all
cases go undetected (Beck & Gable, 2001). Although prevalence of PPD appears high,
few have investigated the contributions of intrapartum events to PPD.

20
Clinically, I have observed an increase in the number of interventions that are
becoming common practice during the intrapartum period. I have also witnessed the
difficult transition to motherhood and the devastating effects of PPD experienced by
some women. These two anecdotal observations made me curious about the relationship
between intrapartum events and PPD.
Rurality was not the focus of the present study, but it provided context and setting
for the sample selected. This study afforded an opportunity to focus on women who
delivered in a rural setting and report findings from a homogenous group of women
living in a rural community. Rural dwelling women have rarely been described in PPD
literature.
Nurses caring for childbearing women are uniquely poised to educate women
about PPD. Should intrapartum events significantly relate to outcome of PPD, nurses can
alert women to the potential risk and encourage early reporting of signs/symptoms.
Increased reporting can reduce the number of unidentified cases and promote
interventions that avert devastating emotional, physical, and economic consequences.
Summary
Identification of relationships between intrapartum events and PPD is an
important area in need of nursing research, particularly because PPD affects so many
women and families. With the identification of relationships between intrapartum events
and PPD, nurses, as front line care providers for women, are uniquely poised to educate
and provide early detection.

21
CHAPTER 2: CONCEPTUAL FRAMEWORK AND LITERATURE REVIEW
Introduction
This chapter describes the Diathesis-Stress Model, the conceptual framework
upon which the study was based. The concepts of diathesis and stress, as described by the
Diathesis-Stress Model, are reviewed followed by definitions of study variables related to
intrapartum stress. Finally, review and critique of pertinent extant literature is presented.
Diathesis-Stress Model
To understand the Diathesis-Stress Model, the underlying concepts must be
delineated. The word diathesis derives from the Greek idea of disposition, related to the
humoral theory of temperament and disease (Zuckerman, 2000). This humoral theory of
temperament held that black bile was the diathesis for depression, or melancholia
(Zuckerman, 2000). Diathesis is currently conceptualized as a predispositional factor, or
set of factors, making possible a disordered state (Ingram & Luxton, 2005). Diatheses are
the antecedent condition for the development of a disorder, and may be biological or
psychological (Zuckerman, 2000).
Most discussions regard diatheses as enduring traits, relatively permanent and
determined by genetic endowment (Ingram & Luxton, 2005). For instance, when
referring to people with schizophrenia, Zubin and Spring (1977) noted that “the one
feature that all schizophrenics have…is the everpresence of their vulnerability” (p. 122).
However, Hankin & Abela (2005) indicate that, while diathesis is permanent in many
cases, it is not always true. For instance, if the level of vulnerability analysis is
psychological rather than genetic, change may be possible (Hankin & Abela).

22
The term diathesis is synonymous with the term vulnerability, the two being used
interchangeably in psychopathology literature. Thus, some also refer to the Diathesis-
Stress Model as a Vulnerability-Stress Model. For the sake of clarity, I will only refer to
the term diathesis when naming the model throughout this paper.
The second important concept is stress. The term stress is borrowed from physics,
where it refers to “a force exerted when one body or body part presses on, pulls on,
pushes against, or tends to compress or twist another body or body part” (Merriam-
Webster, 2007). In psychiatry, stress is defined as the physical and psychological factors
that impose strain on a person or the effects of the strain on him (Zuckerman, 2000).
Stress can be viewed as major or minor life events that disrupt mechanisms which
maintain the stability of an individual’s physiology, emotion, and cognition (Ingram &
Luxton, 2005). Zuckerman (2000) explained severe stress events may leave a residue of
depression following them.
Given an understanding of the terms diathesis and stress, the Diathesis-Stress
Model can then be defined as a combination of stress factors (diatheses) in the context of
life events (stress) which result in psychopathology (Zvolensky, Kotov, Antipova &
Schmidt, 2005). So, without the occurrence of negative events (the stress), individuals
who possess depressogenic schemata (the diatheses) are no more likely to become
depressed than are individuals who do not possess such schemata (Abela &
D’Alessandro, 2002). This theory originated from Meehl’s (1962) schizophrenia theory
in which he described a dominant “schizogene” as the diathesis that eventuates in a
schizotypic personality after the introduction of an environmental stressor. Thus, Meehl

23
(1962) proposed a relationship between diathesis (genetic or personality traits) and the
occurrence of stressors in the expression of schizophrenia. Meehl clarified his model in
1989 and 1990. The Diathesis-Stress Model, previously applied to schizophrenia, was
further applied to depression by Beck (1967, 1983). The Diathesis-Stress Model has
continued to serve as the foundation for depression research involving breast cancer
(Badger, Segrin, Meek, Lopez & Bonham, 2005), adolescent depression (Lewinsohn,
Joiner & Rhode, 2001), and postpartum depression (Grazioli & Terry, 2000).
Hypothetical Diathesis-Stress Model for Exploration of Postpartum Depression
The Diathesis-Stress Model has been used to generate theories of schizophrenia
(Meehl, 1962), depression (Beck, 1967; Monroe & Simons, 1991; Robins & Block,
1988), major depressive disorder in adolescents (Lewinsohn, Joiner & Rhode, 2001), and
psychological distress in women with breast cancer (Badger, Segrin, Meek, Lopez &
Bonham, 2005). The Diathesis-Stress Model has also been used to generate theories
explaining anxiety disorders (Williams, Reardon, Murray & Cole, 2005), eating disorders
(Cooper, 2005), and substance abuse in adolescence (Kassel, Weinstein, Skitch, Veilleux
& Mermelstein, 2005). Because the Diathesis-Stress Model has not previously been used
to fully explore postpartum depression (PPD), a hypothesized model was developed.
Prenatal risk factors for PPD have been extensively explored. Personal or family
history of depression, high levels of psychosocial stress, marital discord, and inadequate
social support are considered risk factors for PPD (Clay & Seehusen, 2004). Beck (1996)
identified prenatal depression, childcare stress, prenatal anxiety, life stress, social
support, marital relationship, history of depression, infant temperament, and maternity

24
blues as PPD risk factors. Self-esteem, marital status, socioeconomic class, and
unplanned/unwanted pregnancy were added as PPD risk factors in 2001 (Beck & Gable,
2001). In total, 13 risk factors have been identified as significant risk factors for PPD;
prenatal depression, child care stress, life stress, social support, prenatal anxiety, marital
satisfaction, depression history, infant temperament, maternity blues, self-esteem,
socioeconomic status, marital status, and unplanned or unwanted pregnancy (Beck,
2002). In the hypothesized model, these 13 risk factors are seen as the diathesis for PPD.
Honey and Morgan (2003) directly addressed the Diathesis-Stress Model in
relation to PPD, explaining that high Edinburgh Postnatal Depression Scale scores were
predicted by women’s predisposition to depression, negative appraisals of an anticipated
childcare stressor, perceptions of low antenatal support, and a high use of avoidance
coping. However, very little attention has been placed on exploring the stress component
of the Diathesis-Stress Model as it pertains to PPD. This is similar to the comments made
by Zvolenski, et al., (2005) in their assessment of the neglect in exploring the stressor
component in predicting anxiety symptoms. In the hypothesized model, intrapartum
events are explored as the stress component for PPD.
While birth itself can be seen as a stressor, it is also a normal, natural event. To
date, there is a lack of research that explores intrapartum events as possible stressors,
each having potential to be more of a stressor than others with possible additive effects.
Thus, intrapartum events, rather than birth itself, are hypothesized to be stressors in the
Diathesis-Stress Model of PPD.

25
FIGURE 1: Meehl’s Diathesis-Stress Model
Meehl’s original Diathesis-Stress Model (Figure 1) describes how a person with a
genetic predisposition to psychopathology must encounter an environmental stressor in
order to produce the psychopathology (Hankin & Abela, 2005). Monroe and Simons
(1991) developed a variation of the Diathesis-Stress Model in order to describe
depression (Figure 2). In the Monroe and Simons (1991) model, stress is either a minor
factor, a result of the diathesis’s expression, or simply a consequence of the emerging
disorder.
FIGURE 2: Diathesis-Stress Model Variation
The hypothesized Diathesis-Stress Model for PPD (Figure 3) indicates that the 13
stressors identified by Beck and Gable (2001) are the diatheses. They present themselves
Diathesis
Depression
Stress
Diathesis Leads to
Psychopathology
Stress +

26
as the predisposing risk factors for developing PPD. Because giving birth is a stressor of
its own accord, a person may experience the PPD simply because they gave birth and
they possess one or more of the predisposing risk factors. However, this model proposes
that additional intrapartum stressors, in combination with the presence of one or more
diatheses, will result in PPD. Unlike the Munroe and Simons (1991) model, the stressor
can not be the consequence of the emerging disorder, as intrapartum events precede PPD
in all situations.
FIGURE 3: Diathesis-Stress Model for Postpartum Depression
Since prenatal risk factors have been studied extensively, the present study
focused on the stress component (intrapartum events) of the Diathesis-Stress Model of
Diathesis
PPD
Stress Planned C-section
Un-planned C-section
Labor induction
Labor augmentation
Pain medication
First Stage > 24 hours
Second stage > 2 hours
Episiotomy Degree of perineal laceration
+
BIRTH

27
PPD. An examination of correlation between the number of stressors and Edinburgh
Postnatal Depression Scale scores was performed. A model was then constructed to
determine which of the intrapartum events explain variance. The number of intrapartum
stressors was predicted to have a positive relationship with Edinburgh Postnatal
Depression Scale scores and both two- and six-weeks postpartum. In addition, it was
predicted that some intrapartum stressors would have more significant relationships to
Edinburgh Postnatal Depression Scale scores than other intrapartum stressors.
Research Variables
Intrapartum Events
Independent variables of interest are planned or unplanned cesarean section,
intravenous catheter usage, labor induction or augmentation, pain medication use,
prolonged first or second stage of labor, episiotomy, and perineal laceration. Each
independent variable will be discussed in this section.
Cesarean section. Cesarean section (c-section) is the surgical procedure that
results in the birth of an infant through an abdominal and uterine incision (London, et al.,
2007). C-sections were originally used in an attempt to save the fetus of a dying woman
but today c-sections are frequently performed for stable women whose fetuses are
unstable (London, et al., 2007). In 2002, c-section rates in the United States reached an
all-time high of 26.1% of all births (Hamilton, Martin & Sutton, 2003). When compared
to vaginal births, elective c-sections have a higher maternal morbidity rate with only 2.1
per 100,000 women dying during vaginal birth and 5.9 per 100,000 women dying during
c-section (Hannah, 2004). Women who undergo emergency or unplanned c-sections face

28
a mortality rate of 18.2 per 100,000 (Hannah, 2004). Maternal morbidity following c-
section is usually associated with infection, reaction to medications, blood clots, or
hemorrhage (London, et al., 2007).
A planned c-section is any birth by c-section that was planned, in cooperation of
the woman and her health care provider, prior to the woman going into labor. An
unplanned or emergency c-section is any birth by c-section that was not planned by the
woman and her health care provider prior to her going into labor. The unplanned or
emergency c-section may be the result of either fetal or maternal health issues. Both
planned and emergent c-sections will be measured as dichotomous variables.
Labor induction. Induction of labor is broken down into two distinct
interventions; cervical ripening and induction of uterine contractions. These two
interventions, while related, are compared separately.
Cervical ripening is the softening and effacing of the cervix (London, et al.,
2007). Cervical softening occurs as the result of endogenous prostaglandins. Following
cervical softening, the cervix effaces. Cervical effacement is the shortening of the cervix
in preparation for cervical dilation. Pharmacologic methods of cervical ripening include
prostaglandin agents, such as Cervidil, as well as misoprostol, a synthetic PGE1 analogue
(London, et al., 2007). The use of prostaglandin agents or synthetic PGE1 analogues prior
to the onset of labor are considered induction of labor by method of cervical ripening.
Cervical ripening will be measured as a dichotomous variable.
Induction of uterine contractions may be accomplished with amniotomy, stripping
of the amniotic membranes, or intravenous infusion of Pitocin (London, et al., 2007).

29
This study focuses on the use of Pitocin, an exogenous form of oxytocin, as the method
for labor induction. Exogenous oxytocin (Pitocin) exerts a selective stimulatory effect on
the smooth muscle of the uterus by increasing the excitability of the myometrial cells of
the uterus (London, et al., 2007). The use of Pitocin prior to the onset of labor is
considered induction of labor by method of stimulation of uterine contractions. This will
be measured as a dichotomous variable.
Labor augmentation. Pitocin, discussed above as a method to induce labor
contractions, may also be used to augment labor that is progressing slowly or that has
stalled. Any use of Pitocin, after the onset of labor, is considered augmentation of labor.
Labor augmentation with the use of Pitocin will be measured as a dichotomous variable.
Pain medication. Labor and birth are personal and highly subjective events. As
such, childbearing women may experience varying level of pain or discomfort during the
intrapartum time period (London, et al., 2007). For some women, the pain and discomfort
experienced in the intrapartum time period make coping difficult. For this reason, many
women choose to use pharmacologic interventions throughout the intrapartum period.
Pharmacologic interventions include systemic medications, regional medications, local
medications, and general anesthesia. For this research, any use of pain medication during
the intrapartum period, regardless of route of administration or therapeutic effect, was
recorded as a dichotomous variable by specific type.
Systemic drugs, a form of analgesia, have the goal of providing maximum pain
relief at minimum risk for the woman and fetus (London, et al., 2007). These medications
30
are administered via intramuscular or intravenous injection and may be narcotic
analgesics, such as Stadol or Nubain, or an opioid such as Morphine.
Regional anesthesia is the temporary loss of sensation produced by injecting an
anesthetic agent into direct contact with nervous tissue, usually in the epidural or
intrathecal spaces of the spine (London, et al., 2007). The local agent stabilizes cell
membranes, preventing the initiation or transmission of nerve impulses. Pharmacologic
agents frequently used for regional anesthesia include amides, such as Xylocaine,
Carbocaine, or Marcaine and opioids, such as morphine, fentanyl, butrophanol, and
meperidine.
Local infiltration of anesthesia, in the intrapartum period, is the injection of an
anesthetic agent into the intracutaneous, subcutaneous, or intramuscular areas of the
perineum (London, et al., 2007). Local anesthesia is generally used in preparation for an
episiotomy or for the repair of a laceration following birth. Pharmacologic agents
frequently used as local anesthesia during the intrapartum period are Nesacaine,
Xylocaine, and Carbocaine.
General anesthesia induces unconsciousness and may be used for cesarean birth
or for other complications, such as retained placenta following birth (London, et al.,
2007). A combination of intravenous injection of pharmacologic agents and inhalation of
anesthetic agents is used for general anesthesia.
Prolonged first stage of labor. The first stage of labor is broken into three phases;
the latent phase, the active phase, and the transition phase. The latent phase begins when
contractions become regular, although they may still be of mild strength and short in
31
duration. The cervix begins to dilate and efface. Women in this phase are generally able
to cope well with their contractions (London, et al., 2007).
The active phase is characterized by contractions that are of increased intensity,
duration, and frequency. During this phase, the cervix usually dilates from 3 cm to 8 cm.
Women in this phase often have increased pain, fear, and a loss of some coping
mechanisms (London, et al., 2007).
Transition, the final phase of the first stage of labor, is characterized by strong
contractions that occur every two minutes and last approximately 60 to 90 seconds.
Cervical dilation progresses from 8 to 10 cm and the woman may have difficulty coping
with the increased contraction pain and frequency of contractions (London, et al., 2007).
For a nullipara, a woman who has not previously given birth, the first stage of
labor lasts an average of 16.8 hours (London, et al., 2007). Whereas the first stage of
labor for a multipara, a woman who has given birth to at least one previous baby, is
usually less than 10 hours. Prolonged first stage of labor was measured as both a
dichotomous variable, whether or not the woman experienced greater than 24 hours in the
first stage of labor, and as a ratio measurement of actual time spent in the first stage of
labor.
Prolonged second stage of labor. The second stage of labor begins with complete
cervical dilation and ends with the delivery of an infant (London, et al., 2007). During
this stage the woman is required to push and deliver her infant. For a nullipara, the
second stage of labor can last up to three hours whereas it usually only lasts up to 30
minutes for a multipara (London, et al., 2007). Prolonged second stage of labor was

32
measured as both a dichotomous variable, whether or not the woman experienced greater
than two hours in the second stage of labor, and as a ratio measurement of actual time
spent in the second stage of labor.
Episiotomy. An episiotomy is a surgical incision to the perineal body (London et
al., 2007). This incision is cut in order to enlarge the perineal outlet, allowing for a more
rapid delivery of the fetal head or for the placement of instruments such as forceps or a
vacuum extractor. Episiotomy is the second most common procedure in maternal-child
care but the routine use of episiotomies has been questioned for several years (London, et
al., 2007). This is because the perineal lacerations characteristic of normal vaginal birth
heal more quickly than the extension of deep perineal tears that sometimes result from
episiotomies (London, et al., 2007). Episiotomy was measured as a dichotomous variable
of women either having an episiotomy or not having an episiotomy.
Degree of perineal laceration. The perineum may become lacerated as a result of
the normal birth process or as the result of episiotomy. Perineal lacerations are graded on
a scale of 1 to 4. A first degree laceration involves a vaginal laceration and perineal skin.
A second degree laceration extends into the perineal muscle. A third degree laceration
extends into the anal sphincter and a forth degree laceration extends completely through
the anal sphincter (London, et al., 2007). Perineal laceration was measured as an ordinal
variable.
Postpartum Depression
The dependent variable of interest is PPD. PPD is a clinical term that refers to a
depressive episode that is associated with childbirth (Epperson, 1999). PPD is a treatable

33
mood disorder (Beck & Gable, 2001) that may begin at 24 hours after birth or several
months postpartum but typically has an onset between two and six weeks postpartum
(Epperson, 1999). PPD is not recognized as being distinct from nonpuerperal depression
by the Diagnostic and Statistical Manual of Mental Disorders (DSM-IV) but there is the
possible addition of a postpartum-onset specifier for clients whose onset of depression
was within four weeks of delivery (Epperson, 1999).
The Edinburgh Postnatal Depression Scale (Appendix A) is the most widely used
instrument for detecting PPD symptoms (Boyd, Le & Somberg, 2005). This study
utilized the Edinburgh Postnatal Depression Scale score as a predictor for PPD. The
cutoff score of 12/13 was used to identify risk for PPD. PPD was measured as a
dichotomous variable of the summated Edinburgh Postnatal Depression Scale score.
Literature Review
An online search was performed using Medline, the Cumulative Index of Nursing
and Allied Health Literature (CINAHL), and the Allied and Complementary Medicine
index (AMED). The online search was performed using the terms “postpartum
depression” or “postnatal depression.” The only limit placed on the search was to show
only results printed in the English language. The search resulted in more than 2,500
references from 1950 to the present. Those results were then further limited by cross-
referencing terms of interest such as cesarean section, pain medication, screening scale,
and intrapartum.

34
Postpartum Depression Risk Factors
Research has identified PPD as a health problem for women and adequate
screening instruments have been developed and tested. Focus has also been placed on
identifying risk factors for PPD such as history of previous depression, life stress, lack of
social support, prenatal anxiety, and marital dissatisfaction (Beck, 1996). Biological risk
factors have also been explored such as low serum estradiol (Ahokas, Kaukoranta &
Aito, 1999) and fluctuations in gonadal steroid levels (estradiol and progesterone) (Bloch,
Schmidt, Danaceau, Murphy, Nieman & Rubinow, 2000). Nierop, Bratsikas, Sinnermann
and Ehlert (2006) found evidence that “healthy pregnant women developing postpartum
depressive symptoms might be identified during pregnancy by means of their higher
cortisol reactivity and their higher psychological reactivity in response to psychosocial
stress” (p. 931). While these biological risk factors are of interest, more rigorous research
is needed to validate the findings. For instance, the research identifying low estradiol
levels as a risk factor for PPD had a sample size of two participants (N = 2) (Ahokas,
Kaukoranta & Aito, 1999). The Bloch, et al., (2000) study that identified fluctuating
estradiol and progesterone levels as risk for PPD had 16 participants (N = 16) and the
authors did not provide operational definitions of their important concepts.
Prenatal risk factors for PPD have been extensively explored. Personal or family
history of depression, high levels of psychosocial stress, marital discord, and inadequate
social support are considered risk factors for PPD (Clay & Seehusen, 2004). Beck (1996)
identified prenatal depression, childcare stress, prenatal anxiety, life stress, social
support, marital relationship, history of depression, infant temperament, and maternity

35
blues as PPD risk factors. Self-esteem, marital status, socioeconomic class, and
unplanned/unwanted pregnancy were added as PPD risk factors in 2001 (Beck, 2001).
Culture must also be considered when identifying risk factors, as giving birth to a girl has
been identified as a risk for PPD in a Turkish Sample (Dindar & Erdogan, 2007) and
polygamy is a risk factor for PPD in a sample of Nepalese women (Ho-Yen, Bondevik,
Eberhard-Gran & Bjorvatn, 2007).
Intrapartum Events and Postpartum Depression
Literature discussing possible relationships between events of the birth process
and the onset or severity of PPD is limited. The information that does exist is largely
contradictory. Adewuta, Fatoye, Ola, Ijaodola and Ibigbami (2005) reported predictors of
PPD in their sample included preterm delivery, instrumental delivery, and having a c-
section. Edwards, Porter and Stein (1993) reported a significantly higher incidence of
postnatal depression found among participants who had undergone c-section than those
who had a vaginal delivery. General, but not regional anesthesia used for cesarean section
was found to have a significant association with PPD (Edwards, et al., 1993).
Furthermore, Koo, Lynch and Cooper (2003) found women who had an emergency
delivery (cesarean section, forceps, or vacuum) had a risk of developing PPD at six
weeks postpartum that was almost two times greater than that of women who did not
have emergency deliveries. Verdoux, Glatigny-Dallay and Minissini (2002) reviewed
literature and found an increased risk of PPD after delivery complications such as
cesarean section, use of forceps, or long labor. The authors then tested this in a sample of
441 women and found that “exposure to severe obstetrical complications during

36
pregnancy was associated with more intense depressive symptoms in the early postnatal
period” (Verdoux, et al., 2002, p. 212). Finally, Robertson, Grace, Wallington and
Stewart (2004) performed an analysis of peer-reviewed literature and found that
pregnancy-and delivery-related complications had a small but significant effect on the
development of PPD.
There were many contradictions to the above findings. Carter, Frampton and
Mulder (2006) indicated the link between cesarean section and postpartum depression has
not been established. Forman, Videbech, Hedegaard, Salvig and Seecher (2000) had the
largest sample for all current postpartum depression research, 6790 pregnant, Danish
speaking women. Results indicated no association between pregnancy or delivery
complications and PPD (Forman, et al., 2000). These findings were supported by the
research of Josefsson, Angelsioo, Berg, Ekstrom, Gunnervik, Nordin & Sydsjo, in 2002.
The setting for this study was Denmark, where health care differs from health care in the
United States. Denmark, like many European countries, uses nationalized health care and
the attitudes and decision making related to health care may differ from that of United
States.
Patel, Murphy and Peters (2005) recently reported no evidence that elective c-
section increased the odds of PPD when compared with planned vaginal delivery and
there was also no evidence to suggest an increased risk of PPD with emergency c-section
or assisted vaginal delivery when compared to spontaneous vaginal delivery. Finally,
Hiltunen, Raudaskoski, Ebeling & Moilanen, (2004) reported that “elective or emergency

37
cesarean section did not increase the risk of high EPDS scores at the first week or at four
months postpartum” (p. 257).
With this wide array of contradictory findings, one must question the rigor of the
current research. Literature pertaining to postpartum depression is vast and extremely
variable in quality (Robertson, et al., 2004). In addition, some of the variables identified
and measured may not be truly independent (Robertson, et al., 2004). Rather, the
variables might be influenced by extraneous variables. For example, decisions made that
lead to interventions during the intrapartum period differ between physicians, hospitals,
and countries (Robertson, et al., 2004).
Carter, Frampton and Mulder (2006) reported no support for a link between
cesarean section and PPD. However, this finding was the result of a meta-analysis of
current literature that examined only the impact of cesarean section on PPD (Carter, et al.,
2006). The authors excluded studies that examined other delivery complications. The
authors acknowledged that “few studies have adequately controlled for all confounding
factors” (Carter, et al., 2006, p. 322) but they did not discuss how they addressed these
confounding variables in their meta-analysis. For instance, Hiltunen, et al., (2004)
reported receiving epidural anesthesia decreased the risk of PPD in their sample. This
raises questions about the results reported by Carter, et al., (2006). What if cesarean
section increases the risk of PPD but the women who received the cesarean section also
received epidural anesthesia, acting to negate the risk?
Forman, Videbech, Hedegaard, Salvig and Seecher (2000) reported no association
between delivery complications and PPD. However, the authors lacked discussion or

38
explanation of reasons for participant mortality. Of the 6790 women enrolled in the
study, only 5091 women (75%) were included in the final analysis. The authors explained
that 171 women were excluded due to missing items on their PPD screening
questionnaire, 28 women were excluded due to infant death, and nine women were lost to
follow-up. This explains 208 of the women who were lost. There was no explanation of
the 1491 other women who were not included in the final analysis. Could the women who
dropped out of the study have been experiencing more PPD than the women who
completed the study? Social withdrawal is a known symptom of depression. Perhaps
these women did not complete the study because they were depressed, and less likely to
interact with others outside their home. The women who did not complete the study or
were dropped due to missing data may be significantly different than the rest of the
sample meaning that the results may not be representative of the sample or population of
interest.
In contradiction to the above findings, Adewuya, et al., (2005) reported that
cesarean section was a predictor of PPD, along with preterm delivery and instrumental
delivery, in their sample of 876 Nigerian women. The authors then, however, noted that
“women with medical complications and hospital admissions during pregnancy were
more likely to have preterm babies through operative or instrumental deliveries,
prolonging the baby’s, and hence the mother’s stay in the hospital” (Adewuya, et al.,
2005, p. 356). The authors did not attempt to explore this further, though, making it
difficult to know whether the relationship between cesarean section and PPD was due to

39
the surgery itself or, perhaps to a confounding variable such as the preterm delivery or the
prolonged hospital stay.
Edwards, Porter and Stein (1993) reported findings from their sample of English
women and indicated there was a significant association between PPD and general
anesthesia but no association between PPD and regional anesthesia. The authors also
reported that there was no association between PPD and the indication for the cesarean
section (Edwards, et al., 1993). This finding is surprising since healthcare providers
working in the labor and delivery environment are aware the majority of cesarean
sections performed under general anesthesia are due to emergency situations and the lack
of time available to administer regional anesthesia. The authors provided no discussion as
to why the women received general anesthesia so the possibility of confounding variables
presents itself.
Koo, Lynch and Cooper (2003) described findings indicating that women having
emergency deliveries via cesarean section, forceps assistance, or vacuum assistance had
twice the risk of developing PPD. However, the majority of the women in this sample
were Malay, Chinese, or Indian. The authors did not validate their PPD screening
instrument, the EPDS, for this sample of women. We cannot be sure that the cutoff score
of 13, which the authors used to indicate risk of PPD, is appropriate for this sample nor
can we be sure the instrument adequately measured PPD for this sample.

40
Conclusion
The Diathesis-Stress Model provided the theoretical framework for this research
and was used to develop the hypothetical Diathesis-Stress Model for Postpartum
Depression. Intrapartum events of interest, the independent variables, were described and
defined with a clear indication of how they were measured. PPD, the dependent variable,
was defined and the Edinburgh Postnatal Depression Scale was discussed as the
instrument used to screen for PPD.
The extant literature focuses on diagnosing and treating PPD. Literature
pertaining to PPD risk is focused on prenatal factors, family history, and personal history.
Few studies examined intrapartum events and their relationship to PPD. Of those, the
most common intrapartum event studied was cesarean section. The results of these
studies were contradictory and variable in quality.

41
CHAPTER 3: METHODS
Introduction
This chapter discusses the methods chosen for this research. This chapter also
includes rationale for the chosen research methods and concludes with a discussion of
data collection procedures and instrumentation.
Design
A nonexperimental descriptive correlational design was employed to answer the
following aims:
1) To describe the number of intrapartum events experienced by women who
gave birth in a birthing center located in rural New England during the 2007
calendar year.
2) To describe PPD scores on the Edinburgh Postpartum Depression Scale at
two- and six- weeks postpartum for this sample.
3) To explore the relationship between number of postpartum events and
Edinburgh Postnatal Depression Scale scores in women in this sample at two-
and six- weeks postpartum.
Two research questions were identified in order to clarify the aims. The first
question was, “Does the number of intrapartum events have a relationship with the
Edinburgh Postnatal Depression Scale score at both two- and six- weeks postpartum?”
The second question was, “Do some intrapartum events have more significant
relationships to Edinburgh Postnatal Depression Scale scores than other intrapartum
events?”

42
Setting and Sample
Setting
As previously identified, women living in rural settings are underrepresented in
research pertaining to PPD. This study was conducted at a critical access facility in a
rural New England area. Participants received prenatal, intrapartum, and postpartum care
from the healthcare providers of the OB/GYN clinical group associated with the critical
access facility.
Sample
After obtaining University of Arizona Institutional Review Board (IRB) approval
(Appendix B), a sample was selected from the delivery log of all women delivering in the
birthing center of the identified rural access facility. All participants obtained prenatal,
intrapartum, and postpartum care by a practice of Certified Nurse Midwives and
Physicians at the identified facility, with delivery of their infants during the 2007
calendar year. All women who delivered at the identified facility were eligible to
participate. Inclusion criteria were: delivery of a live fetus at the identified facility in
2007, 37-42 weeks gestation, and signed admission consent for their personal health data
to be utilized for research purposes. Inclusion criteria was limited to women who had
results of the Edinburgh Postnatal Depression Scale at two- and/or six- weeks
postpartum. Women were excluded in the event of intrauterine fetal demise, infant death
prior to the six-week postpartum PPD screening, or if the infant was not living in their
home due to hospitalization or removal for safety reasons. These exclusion criteria could
be confounders as infant morbidity and mortality are known to produce depression in

43
women. All women delivering in the identified facility signed consent for medical
records to be used for facility-approved research (Appendix C).
Power analysis. Power analysis was performed in order to have sufficient power
to address the three specific aims. The number of participants required for correlation
coefficient analysis was greater than the number of participants required for the
regression analyses. Therefore, the number of participants was set using the power
analysis for the correlation coefficient. Since little is known about the possible
relationship between intrapartum events and postpartum depression, determining effect
size was difficult. Considering that this study examined the relationship of several
intrapartum events to postpartum depression, a medium effect size of 0.35 was assumed
(Cohen, 1988). With N=61 power was predicted at 0.8 to detect a hypothesized
correlation coefficient of 0.35 with a significance level at 5%. With N=61 and R2 of .30
the power for multiple regression using all independent variables was 0.9. Although the
power analysis indicated that 61 participants would be needed for predicted power of 0.8,
an actual sample of 102 was obtained, as this was the accessible sample of women
meeting inclusion and exclusion criteria.
Data Collection Procedures
Charts were selected for all participants meeting inclusion and exclusion criteria.
Data were extracted from medical records and entered into electronic study files by
assigned study member without personal identifiers. Age was collected in years rather
than by using birth date to further assure confidentiality of the participants. Further, no

44
link between study number and medical record number was maintained, and study files
consist only of de-identified data.
Demographic data were collected from the charts and included age, employment
status, marital status, number of previous pregnancies, number of previous births, and
race affiliation. Socio-economic status was assessed by collecting presence of private
insurance or Medicaid.
Standard protocol for postpartum care at the critical access facility includes the
administration of the Edinburgh Postpartum Depression Scale (EPDS) at two weeks
postpartum and again at six weeks postpartum. The results of these screenings were
extracted from participants’ medical records.
Instrumentation
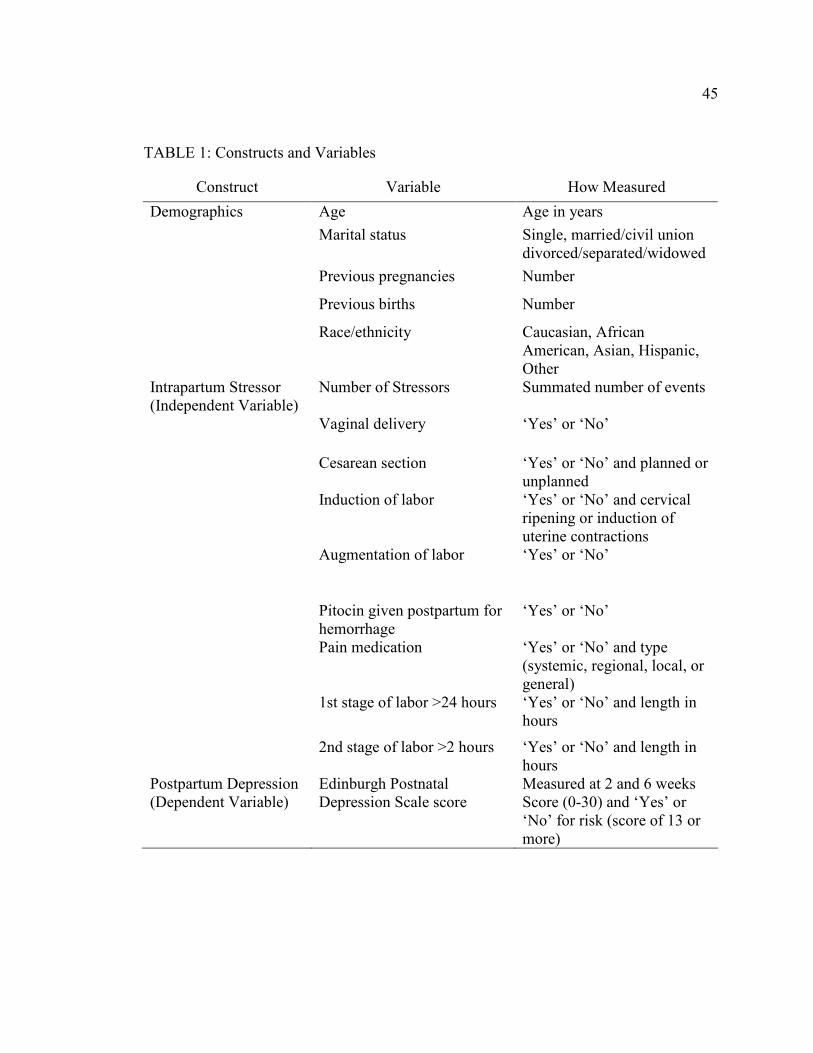
All data utilized in the present study were extracted from participants’ medical
records. Many intrapartum events, such as vaginal delivery, were measured as
dichotomous variables. Other intrapartum events, such as degree of perineal laceration,
were continuous variables. Table 1 illustrates the variables and how each variable was
measured.
45
TABLE 1: Constructs and Variables
Construct Variable How Measured
Demographics Age Age in years
Marital status Single, married/civil union
divorced/separated/widowed
Previous pregnancies Number
Previous births Number
Race/ethnicity Caucasian, African
American, Asian, Hispanic,
Other
Intrapartum Stressor
(Independent Variable)
Number of Stressors Summated number of events
Vaginal delivery ‘Yes’ or ‘No’
Cesarean section ‘Yes’ or ‘No’ and planned or
unplanned
Induction of labor ‘Yes’ or ‘No’ and cervical
ripening or induction of
uterine contractions
Augmentation of labor ‘Yes’ or ‘No’
Pitocin given postpartum for
hemorrhage
‘Yes’ or ‘No’
Pain medication ‘Yes’ or ‘No’ and type
(systemic, regional, local, or
general)
1st stage of labor >24 hours ‘Yes’ or ‘No’ and length in
hours
2nd stage of labor >2 hours ‘Yes’ or ‘No’ and length in
hours
Postpartum Depression
(Dependent Variable)
Edinburgh Postnatal
Depression Scale score
Measured at 2 and 6 weeks
Score (0-30) and ‘Yes’ or
‘No’ for risk (score of 13 or
more)
46
Edinburgh Postnatal Depression Scale (EPDS)
The Edinburgh Postnatal Depression Scale (EPDS) was used in this study to
screen for PPD and is the most widely used instrument for detecting PPD symptoms
(Boyd, Le & Somberg, 2005). The EPDS is a screening tool and is not diagnostic for
detection of PPD but has the advantage of being the first scale developed specifically for
PPD screening and has been used for more than 20 years in both research and clinical
settings.
The EPDS is a 10-item, self-report scale that was validated using a sample of 84
mothers living in Edinburgh or Livingston (Cox, Holden & Sagovsky, 1987). The semi-
Likert format has possible ranges of 0 to 30. A threshold of 12/13 was found to identify
women with a diagnosis of major depressive illness in the sample (Cox, et al., 1987). The
cutoff score has since been adjusted for various populations. Navarro, Ascaso, Garcia-
Esteve, Aguado, Torres & Martin-Santos, (2007) reported the EPDS cutoff score as 9/10
in their sample. A cutoff of 14/15 was identified for a sample of Vietnamese-speaking
women (Boyd, et al., 2005). Cox, Holden and Sagovsky (1987) reported sensitivity of the
EPDS as 86% with specificity of 78% and positive predictive value of 73%, with Jardi,
Pelta, Maron, Thomas, Delion, Codaccioni & Gouldmand, (2006) reporting similar
findings. The popularity of the EPDS is a result of its short length, ease of use, and its
ability to be quickly scored by the healthcare provider.
One major advantage of the EPDS is that the tool is concise. The EPDS does not
require an extraordinary amount of time for the client to take the self-administered test
and it is easy for the healthcare provider to add the scores and make an evaluation of the
47
total score. Another advantage is that the EPDS is one of only three instruments
developed specifically screen for PPD rather than general depression. The major reason
for using the EPDS for this study was the instrument administration was a standard of
postpartum care and results were available for two- and six-weeks postpartum. This
allowed a chart review to be used for data collection rather than enrolling participants and
having to administer the PPD screening instrument longitudinally after they delivered.
This saved valuable research resources and time.
The EPDS demonstrates moderate to good reliability properties across samples
from a wide variety of countries and languages (Boyd, et al., 2005). Test-retest
reliabilities for the EPDS are moderate to good (.53-.74) (Boyd, et al., 2005). Internal
consistency for the EPDS has been demonstrated at .73-.87 (Boyd, et al., 2005). In
addition, the EPDS demonstrates moderate to good correlations with other depression
screening tools (Boyd, et al., 2005).
The EPDS has demonstrated a sensitivity of 59-100% and a specificity of 49-
100% (Boyd, et al., 2005). Cox, Holden, and Sagovsky (1987) identified a positive
predictive value for the EPDS of 73%.
Data Management
This study was approved by the University of Arizona Institutional Review Board
prior to data collection. Data from medical records of qualifying participants were
entered directly into SPSS data sheets by study number without personal identifiers. No
file exists that could link participant identity to de-identified data in SPSS files. Only the

48
PI had access to de-identified study files. All computer files are password protected. The
de-identified computer files will be kept indefinitely.
Data were cleaned by checking for outliers. Missing data were not an issue, as
only participants with Edinburgh Postnatal Depression Scale scores at two-and six-
weeks were included in the sample. For one of the regression analyses there were missing
data about length of labor. This was managed by deleting the women from the analysis.
Despite losing those nine cases, the sample size was still adequate to meet the power
analysis.
Data Analysis
Descriptive statistics were calculated for demographic characteristics and were
displayed in table format to portray the sample. The independent variable, intrapartum
events, was described using frequencies and summation of the mean number of events for
the sample. EPDS scores at two- and six- weeks postpartum were described and the
scores were divided into risk for depression (13 or more) and no risk for depression.
Specific Aim One was answered by describing the frequency of intrapartum events for
the sample. Specific Aim Two was answered by summating PPD scores on the EPDS at
two- and at six- weeks postpartum. At each measurement point, the number and percent
of the sample to score at risk for depression (13 or more) was described. For Specific
Aim Three, Spearman’s Rho was used to identify correlation between number of
intrapartum events and EPDS summated scores at two- and six- weeks postpartum. To
determine the contribution of specific intrapartum events to variance in EPDS scores, a
stepwise regression with backward elimination was constructed with EPDS scores as the

49
dependent variable. The statistically significant relationships with predictive ability were
retained in the model. For all inferential tests, level of significance was set at α ≤ .05.
Summary
A nonexperimental, descriptive correlational design was used to investigate the
relationships between intrapartum events and PPD. Intrapartum events were used to test
the stress component of the hypothesized Diathesis-Stress Model of PPD. A chart review
of women delivering at a rural, critical access facility was used to obtain data for these
analyses. An existing instrument, the EPDS, was used as the screening tool for EPDS.

50
CHAPTER 4: RESULTS
Introduction
This chapter describes the sample and reviews the results of this non-
experimental, descriptive study by specific aims and research question.
Sample
Two hundred fifty births occurred in the identified facility during the 2007
calendar year. Data were collected for 213 of the births but could not be collected for 37
cases because the charts were not present at the time of data collection. Of the 213 cases,
one case was excluded because the birth was actually an intrauterine fetal demise with
birth of a deceased infant at 20 weeks gestation. Two cases were excluded because the
birth occurred at < 37 weeks gestation. One hundred eight cases were excluded due to
missing Edinburgh Postnatal Depression Scale (EPDS) score at two- and/or six- weeks
postpartum. Therefore, the total sample included in this study was 102 (N=102) women.
The included and excluded cases were examined to determine if demographic
differences existed between the two groups. There was no significant difference in the
age in years of the included group and the excluded group (t = .106) (Table 2). There was
also no significant association between race/ethnicity and the two groups (X2(1) = 1.113,
p > .05). The number of first time mothers was also not significantly different for the two
groups (X2(1) = .002, p > .05). There was, however, a significant association between the
marital status and the two groups (X2(1) = 4.686, p <.05), as the included group was more
likely to be married than the excluded group.

51
TABLE 2: Age for Included and Excluded Cases
Levine's test
for Equality of
Variances t-test for Equality of Means
95% Confidence
Interval of the
Difference
F Sig. t df
Sig
(2-tailed)
Mean
Diff
Std. Error
Difference Lower Upper
Age Equal variances
assumed
2.638 0.106 -0.54 211 0.952 -0.444 0.827 -2.075 1.187
Equal variances
not assumed
-0.54 210.9 0.59 -0.444 0.823 -2.067 1.18
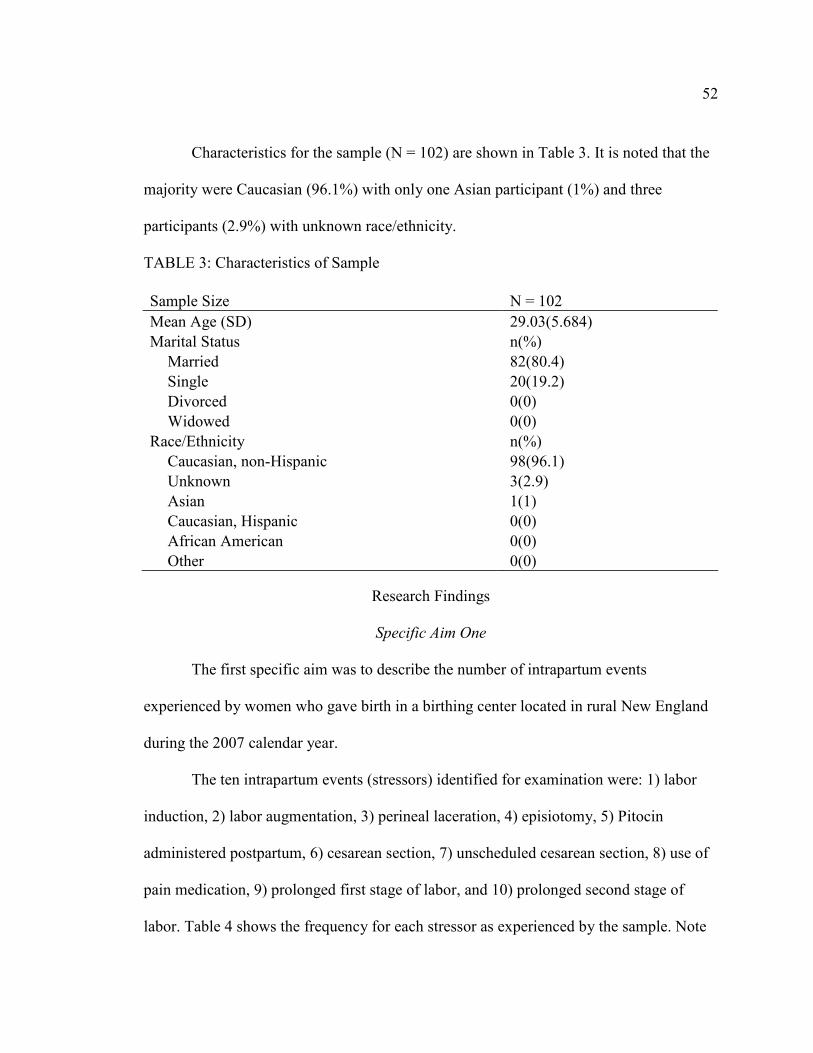
52
Characteristics for the sample (N = 102) are shown in Table 3. It is noted that the
majority were Caucasian (96.1%) with only one Asian participant (1%) and three
participants (2.9%) with unknown race/ethnicity.
TABLE 3: Characteristics of Sample
Sample Size N = 102
Mean Age (SD) 29.03(5.684)
Marital Status n(%)
Married 82(80.4)
Single 20(19.2)
Divorced 0(0)
Widowed 0(0)
Race/Ethnicity n(%)
Caucasian, non-Hispanic 98(96.1)
Unknown 3(2.9)
Asian 1(1)
Caucasian, Hispanic 0(0)
African American 0(0)
Other 0(0)
Research Findings
Specific Aim One
The first specific aim was to describe the number of intrapartum events
experienced by women who gave birth in a birthing center located in rural New England
during the 2007 calendar year.
The ten intrapartum events (stressors) identified for examination were: 1) labor
induction, 2) labor augmentation, 3) perineal laceration, 4) episiotomy, 5) Pitocin
administered postpartum, 6) cesarean section, 7) unscheduled cesarean section, 8) use of
pain medication, 9) prolonged first stage of labor, and 10) prolonged second stage of
labor. Table 4 shows the frequency for each stressor as experienced by the sample. Note

53
perineal laceration (n = 56) was the stressor experienced by the most women in the
sample followed by Pitocin given postpartum (n = 29), labor induction (n = 23), and the
use of pain medication (n = 22). Episiotomy (n = 1) was the stressor experienced with the
least frequency.
TABLE 4: Frequency of Stressors
Sample Size N = 102
Stressors n(%)
Labor Induction 23(22.5)
Labor Augmentation 10(9.8)
Perineal Laceration 56(54.9)
Episiotomy 1(1)
Pitocin Given Postpartum 29(28.4)
Cesarean Section 7(6.9)
Unscheduled Cesarean Section 4(3.9)
Pain Medication 22(21.6)
Prolonged First Stage 9(8.8)
Prolonged Second Stage 6(6.0)
Specific Aim Two
The second specific aim was to describe PPD scores on the Edinburgh Postpartum
Depression Scale (EPDS) at two- and six- weeks postpartum for the sample.
Women in this sample had a range of EPDS scores. Although the possible range
for EPDS scores is 0-30, the actual range of scores at two weeks was 0-24 and the actual
range at six weeks was 0-19 (Table 5). More women (n = 16 at two weeks and n = 29 at
six weeks) reported zero on the EPDS score at both two- and six- weeks postpartum than
any other score.

54
TABLE 5: Frequency of EPDS Scores at Two and Six Weeks Postpartum
EPDS Score
Frequency at
Two Weeks (%)
Frequency at
Six Weeks (%)
0 16(15.7) 29(28.4)
1 12(11.8) 11(10.8)
2 7(6.9) 9(8.8)
3 11(10.8) 9(8.8)
4 7(6.9) 13(12.7)
5 9(8.8) 5(4.9)
6 12(11.8) 8(7.8)
7 8(7.8) 4(3.9)
8 5(4.9) 5(4.9)
9 2(2.0) 1(1.0)
10 4(3.9) 1(1.0)
11 2(2.0) 2(2.0)
12 2(2.0) 1(1.0)
13 1(1.0) 3(2.9)
14 2(2.0) 0(0.0)
17 1(1.0) 0(0.0)
19 0(0.0) 1(1.0)
24 1(1.0) 0(0.0)
Total 102 102
Specific Aim Three
The third specific aim was to explore the relationship between number of
postpartum events and Edinburgh Postnatal Depression Scale (EPDS) scores in women in
this sample at two- and six- weeks postpartum. This specific aim is answered in the two
research questions as described below.
Research question 1: Does the number of intrapartum events have a relationship
with the EPDS score at both two- and six- weeks postpartum? To answer this research
question, Spearman’s rho was used to examine nonparametric correlations between
EPDS score at two- and six- weeks postpartum and the number of stressors. The ten
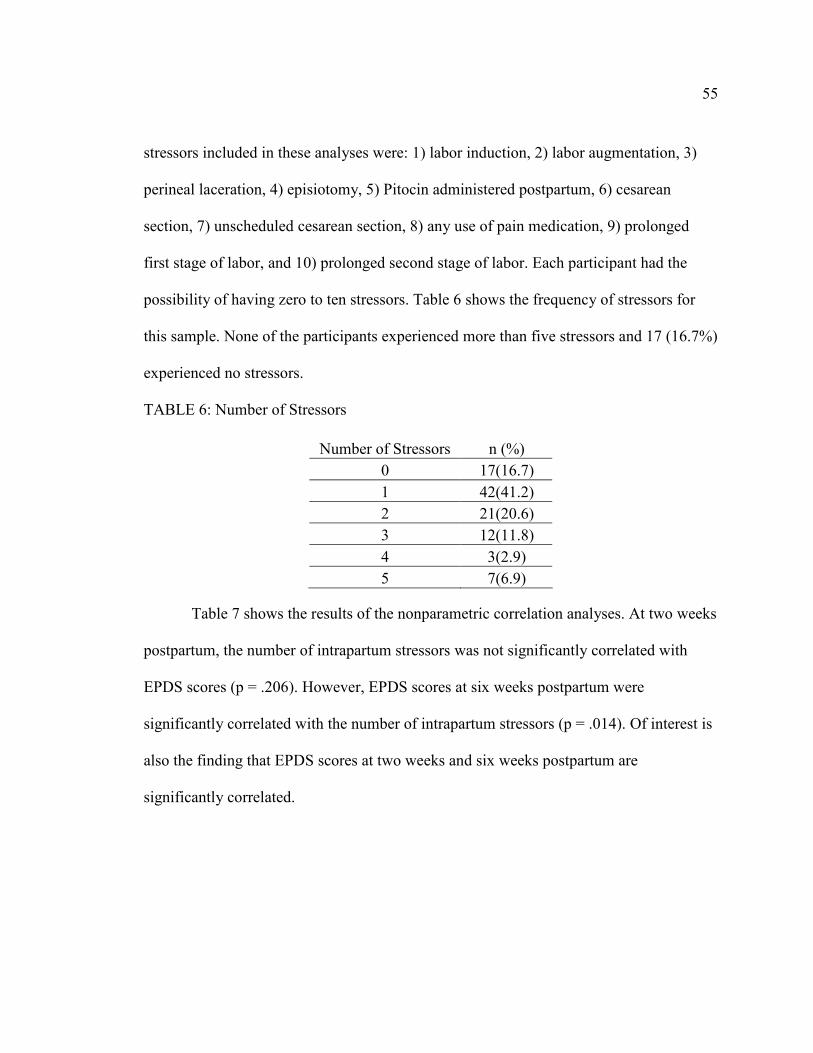
55
stressors included in these analyses were: 1) labor induction, 2) labor augmentation, 3)
perineal laceration, 4) episiotomy, 5) Pitocin administered postpartum, 6) cesarean
section, 7) unscheduled cesarean section, 8) any use of pain medication, 9) prolonged
first stage of labor, and 10) prolonged second stage of labor. Each participant had the
possibility of having zero to ten stressors. Table 6 shows the frequency of stressors for
this sample. None of the participants experienced more than five stressors and 17 (16.7%)
experienced no stressors.
TABLE 6: Number of Stressors
Number of Stressors n (%)
0 17(16.7)
1 42(41.2)
2 21(20.6)
3 12(11.8)
4 3(2.9)
5 7(6.9)
Table 7 shows the results of the nonparametric correlation analyses. At two weeks
postpartum, the number of intrapartum stressors was not significantly correlated with
EPDS scores (p = .206). However, EPDS scores at six weeks postpartum were
significantly correlated with the number of intrapartum stressors (p = .014). Of interest is
also the finding that EPDS scores at two weeks and six weeks postpartum are
significantly correlated.

56
TABLE 7: Correlation of EPDS with Number of Intrapartum Stressors at Two and Six
Weeks Postpartum
stressors
EPDS score
2 weeks
EPDS score
6 weeks
Spearman's
rho Stressors
Correlation
Coefficient 1 --- .---
Sig. (2-tailed) . --- ---
N 102 --- ---
EPDS score at
2 weeks
Correlation
Coefficient .126 1 ---
Sig. (2-tailed) .206 . ---
N 102 102 ---
EPDS score at
6 weeks
Correlation
Coefficient .242* 0.718** 1
Sig. (2-tailed) .014 .000 .
N 102 102 102
* Correlation is significant at the 0.05 level (2-tailed)
** Correlation is significant at the 0.01 level (2-tailed)
Research question 2: Do some intrapartum events have more significant
relationships to Edinburgh Postnatal Depression Scale scores than other intrapartum
events? To answer this question, a stepwise regression with backward elimination was
used for all ten intrapartum stressors at both two- and six- weeks. All ten possible
explanatory predictors (the intrapartum stressors) were put into the regression equation
and then removed, one at a time, until the remaining predictors were all significant. This
resulted in a remaining model with perineal laceration (p = .040) and unscheduled
cesarean section (p = .087) as significant predictors of EPDS score at two weeks (Table
8). It should be noted that unscheduled cesarean section had a significance level above
the .05 threshold. This is because conventional criteria for including or eliminating
predictors in the model is significance levels up to .10. Since the unscheduled cesarean

57
section variable does not meet apriori significance of ≤.05, it cannot be considered to be a
significant predictor of PPD. It does, however, approach significance.
The regression coefficients indicated that those who experienced perineal
lacerations are predicted to have an increase in EPDS scores at two weeks postpartum of
1.782. Those who had an unscheduled cesarean section are predicted to have an increase
in EPDS scores at two weeks of 4.31. Although perineal laceration and unscheduled
cesarean section are significant predictors of EPDS score at two weeks postpartum, the
R-square values in Table 9 show that they explain only 6% of the variance in EPDS
score.

58
TABLE 8: Stepwise Regression at Two Weeks Postpartum
Unstandardized Coefficients
Standardized
Coefficients
Model B Std. Error Beta t Sig.
1 (constant) 4.082 .803 5.046 .000
Labor Induction -1.981 1.093 -.197 -1.813 .073
Labor Augmentation -1.302 1.539 -.092 -.846 .400
Perineal Laceration 1.359 .940 .159 1.466 .152
Episiotomy .296 4.857 .007 .061 .952
Pitocin Postpartum .136 .994 .015 .137 .891
Cesarean Section -1.132 2.885 -.063 -.392 .696
Unscheduled C-Sect 4.639 4.034 .187 1.150 .253
Pain Medication 1.672 1.392 .161 1.201 .233
Prolonged First Stage -.691 2.031 -.047 -.340 .735
Prolonged Second Stage 2.573 2.096 .144 1.228 .223
2 (constant) 4.079 .804 5.076 .000
Labor Induction -1.977 1.085 -.196 -1.823 .072
Labor Augmentation -1.297 1.528 -.092 -.849 .398
Perineal Laceration 1.362 .933 .160 1.459 .148
Pitocin Postpartum .128 .980 .014 .131 .896
Cesarean Section -1.146 2.861 -.064 -.401 .690
Unscheduled C-Sect 4.670 3.981 .188 1.173 .244
Pain Medication 1.690 1.351 .162 1.251 .214
Prolonged First Stage -.720 1.962 -.049 -.367 .715
Prolonged Second Stage 2.623 1.921 .147 1.365 .176

59
TABLE 8: Stepwise Regression at Two Weeks Postpartum - Continued
Unstandardized Coefficients
Standardized
Coefficients
Model B Std. Error Beta t Sig.
3 (constant) 4.103 .778 5.272 .000
Labor Induction -1.979 1.079 -.196 -1.835 .070
Labor Augmentation -1.249 1.476 -.08 -.847 .399
Perineal Laceration 1.366 .927 .160 1.473 .144
Cesarean Section -1.157 2.844 -.065 -.407 .685
Unscheduled C-Sect 4.727 3.935 .190 1.201 .233
Pain Medication 1.720 1.324 .165 1.299 .197
Prolonged First Stage -.734 1.949 -.050 -.377 .707
Prolonged Second Stage 2.629 1.910 .147 1.376 .172
4 (constant) 4.116 .774 5.318 .000
Labor Induction -1.991 1.073 -.198 -1.855 .067
Labor Augmentation -1.299 1.463 -.092 -.888 .377
Perineal Laceration 1.334 .919 .156 1.451 .150
Cesarean Section -1.028 2.810 -.058 -.366 .715
Unscheduled C-Sect 3.997 3.409 .161 1.173 .244
Pain Medication 1.579 1.264 .152 1.249 .215
Prolonged Second Stage 2.477 1.859 .139 1.333 .186
5 (constant) 4.041 .743 5.440 .000
Labor Induction -1.909 1.045 -.190 -1.827 .071
Labor Augmentation -1.209 1.435 -.086 -.843 .402
Perineal Laceration 1.423 .882 .167 1.613 .110
Unscheduled C-Sect 3.222 2.658 .130 1.212 .229
Pain Medication 1.374 1.128 .132 1.218 .226
Prolonged Second Stage 2.526 1.845 .141 1.369 .174

60
TABLE 8: Stepwise Regression at Two Weeks Postpartum - Continued
Unstandardized Coefficients
Standardized
Coefficients
Model B Std. Error Beta t Sig.
6 (constant) 3.800 .684 5.552 .000
Labor Induction -1.825 1.039 -.181 -1.758 .082
Perineal Laceration 1.605 .854 .188 1.880 .063
Unscheduled C-Sect 3.487 2.635 .140 1.323 .189
Pain Medication 1.322 1.124 .127 1.176 .243
Prolonged Second Stage 2.585 1.841 .145 1.404 .164
7 (constant) 3.960 .672 5.893 .000
Labor Induction -1.581 1.020 -.157 -1.551 .124
Perineal Laceration 1.622 .855 .190 1.896 .061
Unscheduled C-Sect 4.567 2.475 .184 1.846 .068
Prolonged Second Stage 2.909 1.824 .163 1.595 .114
8 (constant) 3.639 .644 5.651 .000
Perineal Laceration 1.637 .862 .192 1.900 .060
Unscheduled C-Sect 4.361 2.489 .175 1.752 .083
Prolonged Second Stage 2.163 1.772 .121 1.221 .225
9 (constant) 3.690 .644 5.729 .000
Perineal Laceration 1.782 .856 .209 2.083 .040
Unscheduled C-Sect 4.310 2.495 .173 1.727 .087
a. Dependent Variable: EPDS score at 2 weeks

61
TABLE 9: Two Week Model Variance
Model R R Square
Adjusted R
Square
Std. Error of the
Estimates
1 .346 .120 .021 4.217
2 .346 .120 .032 4.194
3 .346 .119 .042 4.171
4 .344 .118 .051 4.152
5 .342 .17 .060 4.132
6 .332 .110 .063 4.126
7 .311 .097 .059 4.134
8 .272 .074 .045 4.164
9 .244 .060 .040 4.175
The process was then repeated for EPDS scores at six weeks postpartum as the
dependent variable. All ten possible explanatory predictors were again put into the
regression equation and then removed, one at a time, until the remaining predictors were
all significant. This resulted in a model with prolonged second stage of labor (p = .021)
and cesarean section (p = .012) as significant predictors of EPDS score at six weeks
(Table 10). Table 11 shows that this model explains 11% of the variance in EPDS score.

62
TABLE 10: Stepwise Regression at Six Weeks Postpartum
Unstandardized
Coefficients
Standardized
Coefficients
Model B Std. Error Beta t Sig.
1 (constant) 3.150 .708 4.451 .000
Labor Induction -1.264 .956 -.142 -1.322 .190
Labor Augmentation -.951 1.346 -.076 -.706 .482
Perineal Laceration .205 .822 .027 .249 .804
Episiotomy 3.658 4.250 .097 .861 .392
Pitocin Postpartum .337 .870 .041 .387 .699
Cesarean Section 2.396 2.525 .151 .949 .345
Unscheduled C-Sect 1.149 3.530 .052 .326 .746
Pain Medication .342 1.217 .037 .281 .779
Prolonged First Stage 1.160 1.777 .088 .653 .516
Prolonged Second Stage 2.909 1.833 .184 1.587 .116
2 (constant) 3.274 .502 6.519 .000
Labor Induction -1.287 .947 -.144 -1.359 .178
Labor Augmentation -1.047 1.283 -.084 -.816 .417
Episiotomy 3.715 4.221 .098 .880 .381
Pitocin Postpartum .346 .864 .042 .401 .690
Cesarean Section 2.242 2.435 .142 .921 .360
Unscheduled C-Sect 1.107 3.507 .050 .316 .753
Pain Medication .369 1.206 .040 .306 .761
Prolonged First Stage 1.206 1.758 .092 .686 .494
Prolonged Second Stage 2.930 1.822 .185 1.608 .111
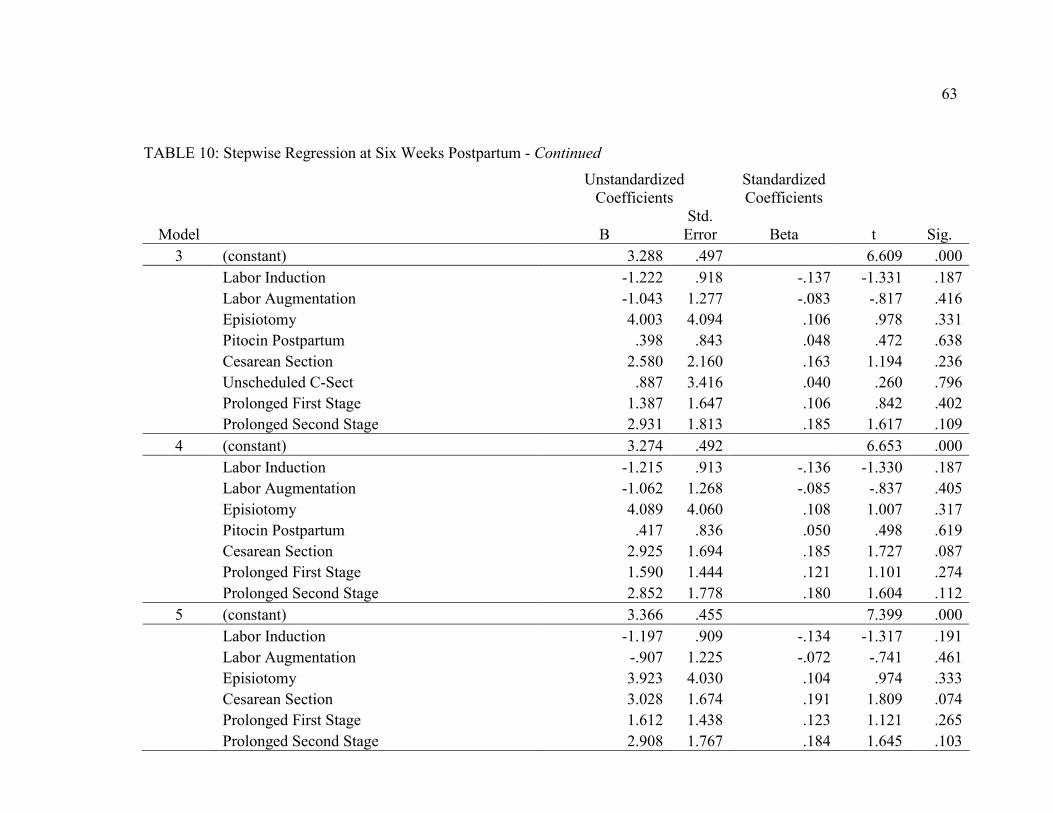
63
TABLE 10: Stepwise Regression at Six Weeks Postpartum - Continued
Unstandardized
Coefficients
Standardized
Coefficients
Model B
Std.
Error Beta t Sig.
3 (constant) 3.288 .497 6.609 .000
Labor Induction -1.222 .918 -.137 -1.331 .187
Labor Augmentation -1.043 1.277 -.083 -.817 .416
Episiotomy 4.003 4.094 .106 .978 .331
Pitocin Postpartum .398 .843 .048 .472 .638
Cesarean Section 2.580 2.160 .163 1.194 .236
Unscheduled C-Sect .887 3.416 .040 .260 .796
Prolonged First Stage 1.387 1.647 .106 .842 .402
Prolonged Second Stage 2.931 1.813 .185 1.617 .109
4 (constant) 3.274 .492 6.653 .000
Labor Induction -1.215 .913 -.136 -1.330 .187
Labor Augmentation -1.062 1.268 -.085 -.837 .405
Episiotomy 4.089 4.060 .108 1.007 .317
Pitocin Postpartum .417 .836 .050 .498 .619
Cesarean Section 2.925 1.694 .185 1.727 .087
Prolonged First Stage 1.590 1.444 .121 1.101 .274
Prolonged Second Stage 2.852 1.778 .180 1.604 .112
5 (constant) 3.366 .455 7.399 .000
Labor Induction -1.197 .909 -.134 -1.317 .191
Labor Augmentation -.907 1.225 -.072 -.741 .461
Episiotomy 3.923 4.030 .104 .974 .333
Cesarean Section 3.028 1.674 .191 1.809 .074
Prolonged First Stage 1.612 1.438 .123 1.121 .265
Prolonged Second Stage 2.908 1.767 .184 1.645 .103

64
TABLE 10: Stepwise Regression at Six Weeks Postpartum - Continued
Unstandardized
Coefficients
Standardized
Coefficients
Model B
Std.
Error Beta t Sig.
6 (constant) 3.253 .428 7.606 .000
Labor Induction -1.131 .902 -.127 -1.253 .213
Episiotomy 3.861 4.020 .102 .960 .339
Cesarean Section 3.175 1.658 .201 1.915 .059
Prolonged First Stage 1.521 1.429 .116 1.064 .290
Prolonged Second Stage 3.017 1.757 .191 1.717 .089
7 (constant) 3.243 .427 7.588 .000
Labor Induction -1.035 .896 -.116 -1.155 .251
Cesarean Section 3.275 1.654 .207 1.980 .051
Prolonged First Stage 1.308 1.411 .100 .927 .356
Prolonged Second Stage 3.678 1.616 .233 2.276 .025
8 (constant) 3.281 .425 7.716 .000
Labor Induction -.928 .888 -.104 -1.045 .299
Cesarean Section 3.874 1.522 .245 2.545 .013
Prolonged Second Stage 4.005 1.576 .253 2.541 .013
9 (constant) 3.091 .385 8.037 .000
Cesarean Section 3.909 1.522 .247 2.568 .012
Prolonged Second Stage 3.576 1.522 .226 2.349 .021
a. Dependent Variable: EPDS score at 6 weeks

65
TABLE 11: Six Week Model Variance
Model R R Square
Adjusted R
Square
Std. Error
of the
Estimates
1 .346 .141 .045 3.690
2 .375 .141 .055 3.671
3 .374 .140 .064 3.652
4 .373 .139 .073 3.634
5 .370 .137 .081 3.619
6 .363 .132 .085 3.610
7 .351 .123 .086 3.609
8 .339 .115 .087 3.606
9 .324 .105 .087 3.608
The regression coefficients indicate those who experienced a prolonged second
stage of labor were predicted to have an increase in EPDS scores at six weeks postpartum
of 3.576. Those who had a cesarean section, regardless of whether or not it was
scheduled, were predicted to have an increase in EPDS scores at six weeks postpartum of
3.909.
Raw data suggested either prolonged first stage of labor, prolonged second stage
of labor or the total length of labor should be examined as a possible predictor or EPDS
score at two- and six- weeks postpartum. Pearson’s product-moment correlation
coefficient was used to measure the strength of the relationship between total length of
labor (length of first stage plus length of second stage) and EPDS scores at two- and six-
weeks postpartum. These analyses showed total length of labor was not correlated with
EPDS scores at two- or six- weeks. It should be noted sample size for total length of labor
was only 93 women rather than the expected total sample of 102. This is because nine of

66
the charts had missing data and were excluded. These nine charts were missing length of
first stage of labor, length of second stage of labor, or both.
There were three points at which women may have received Pitocin: 1) to induce
labor, 2) to augment labor, or 3) to stop postpartum hemorrhage. Raw data suggested the
examination of whether or not any administration of Pitocin had a relationship with
EPDS scores at two- and/or six- weeks postpartum regardless of the time of
administration or the reason for administration. An independent t-test was used to
examine the relationship between Pitocin and EPDS score at two- and/or six- weeks
postpartum (Table 12). Forty one (40.2%) of the 102 women in the sample received
Pitocin at least once during their labor process. The t-test indicated there was no
significant difference in EPDS scores at two weeks (t(100) = .348, p >.05) or six weeks
(t(100) = -.604, p >.05) postpartum for women who did or did not receive Pitocin.

67
TABLE 12: Two and Six Week EPDS Scores for Pitocin and No Pitocin
Levine's test
for Equality
of Variances t-test for Equality of Means
95% Confidence
Interval of the
Difference
F Sig. t df Sig (2-tailed)
Mean
Difference
Std. Error
Difference Lower Upper
EPDS
score at
2 weeks
Equal
variances
assumed
.951 .332 .348 100 .729 .300 .862 -1.409 2.009
Equal
variances
not
assumed
.361 95.458 .719 .300 .831 -1.350 1.949
EPDS
score at
6 weeks
Equal
variances
assumed
1.116 .293 -.604 100 .547 -.461 .762 -1.973 1.051
Equal
variances
not
assumed
-.596 81.761 .553 -.461 .773 -1.998 1.077

68
Summary
EPDS scores at two weeks postpartum are not significantly correlated with the
number of intrapartum stressors. However, perineal laceration and unscheduled cesarean
section are significant predictors of EPDS score at two weeks postpartum. EPDS scores
at six weeks postpartum are significantly correlated with the number of intrapartum
stressors. In addition, having a prolonged second stage of labor and having a cesarean
section are significant predictors of EPDS at six weeks postpartum. The total length of
labor was not correlated with EPDS scores at two- or six- weeks postpartum and there
was no significant difference in the EPDS scores between women who were given
Pitocin and women who were not given Pitocin.
69
CHAPTER 5: DISCUSSION
Introduction
This chapter elaborates upon the research findings, examines how the specific
aims and research questions were addressed, and discusses the implications of this
research for the nursing profession and patient outcomes.
Discussion
Sample
Of the 213 cases for which data were collected, the final sample contained only
102 participants (N = 102). More than 50% of the cases were excluded due to missing
EPDS scores at two weeks, six weeks, or at both two- and six- weeks. The only statistical
difference found between the two groups (included cases and excluded cases) was
included women were more likely to be married than excluded women. Surprisingly,
100% of the included cases were women who received care from Certified Nurse
Midwives. All women cared for by physicians were excluded due to lack of one or both
EPDS scores. This is an interesting finding, since it is the perception of the combined
OB/GYN practice (both Certified Nurse Midwives and physicians) that all of their clients
are screened for PPD at two- and six- weeks postpartum. It may be that Certified Nurse
Midwives are better educated to understand the importance of detecting PPD as a way to
determine need for interventions that avert or ameliorate the known negative effects. It
may also reflect practice differences or professional focus. This finding, however, does
speak to a need for greater PPD education for healthcare professionals, particularly
physicians, who interact with women postpartum and manage their care.

70
Although the two groups (included cases and excluded cases) were not
significantly different in race/ethnicity, this is mostly due to the fact that the vast majority
(96.1% of included women and 92.7% of excluded women) classified themselves as non-
Hispanic Caucasian women. It is worth mentioning that women were not included or
excluded from this study based on race or ethnicity. The homogeneity of the sample is a
function of the rural setting in which this sample was obtained. Results may differ when
obtained from samples of women who are ethnically diverse, who live in geographically
distinct areas, or who are from urban settings.
Specific Aim One
The first specific aim was to describe the number of intrapartum events
experienced by women who gave birth in a birthing center located in rural New England
during the 2007 calendar year.
Perineal laceration (n = 56) was the stressor experienced by the most women in
the sample followed by Pitocin administration postpartum (n = 29). Episiotomy (n = 1)
was the stressor experienced with the least frequency, with only one participant. These
findings are not surprising, as the obstetric practice from which the sample was obtained
is known in the community for its support of low-intervention childbirth. Women with
significant health issues are transferred to one of two major medical centers for their
prenatal and intrapartum care. The frequency of stressors experienced by women is
expected to be different in a major medical center or in a facility that cares for medically
high risk pregnancies.

71
The description of the number of intrapartum events experienced by women of
this sample adds to what is currently known about PPD. Current research focuses on the
relationship between one or two intrapartum events and PPD. I am unaware of any other
research that has explored such a wide array of intrapartum events in relation to PPD.
Specific Aim Two
The second specific aim was to describe PPD scores on the Edinburgh Postpartum
Depression Scale at two- and six- weeks postpartum for the sample. Although the
possible range for EPDS scores is 0-30, the actual range of scores at two weeks was 0-24
and the actual range at six weeks was 0-19. There were no outliers. Literature indicates
rates of PPD during the first six months postpartum are 10-22% in all women (Cox, et al.,
1993; Llewellyn, et al., 1997). The present sample had EPDS scores of 13 + (indicating
high risk for PPD) of only 6% at two weeks postpartum and 4% at six weeks postpartum.
It may be women who live in rural settings have lower PPD prevalence, or it may be
women who deliver in a low risk facility and have fewer intrapartum events (stressors)
have lower PPD prevalence. This finding warrants further exploration and research to
tease out the specific contributions of rural place vs. lower numbers of intrapartum events
to PPD prevalence.
Specific Aim Three
The third specific aim was to explore the relationship between number of
postpartum events and EPDS scores in women in this sample at two- and six- weeks
postpartum. In this sample (57.9%) experienced zero or one stressor.

72
Nonparametric correlation analysis indicated that number of stressors is not
significantly correlated with EPDS scores at two weeks but number of stressors is
significantly correlated with EPDS scores at six weeks postpartum. This is a curious
finding, as it would seem a more immediate response to cumulative stressors likely. This
delayed response to cumulative stressors may be due to increasing fatigue, to physiologic
factors, or to heretofore unidentified factors. It would be interesting to examine this
relationship in a more diverse sample of women who experienced more intrapartum
stressors.
Interestingly, the results of Specific Aim Three might aid in explaining the results
of Specific Aim Two. Specific Aim Two showed that only 6% of this sample reported
EPDS scores that indicated risk for PPD. This is much below the expected 10-22% of
PPD in all women. However, Specific Aim Three showed that EPDS score is
significantly correlated with EPDS scores at six weeks postpartum and that the majority
of this sample experienced zero or one stressor. The low number of stressors experienced
by this group might explain the lower than expected EPDS risk. These findings warrant
further exploration and additional research.
At two weeks postpartum, perineal laceration predicted EPDS scores.
Unscheduled cesarean section approached significance in the final model. In future
studies with diverse and high risk samples, this relationship may be clarified. Findings
may differ in groups with cesarean section rates that approach the national average. Only
6.9% of the present sample experienced scheduled or unscheduled cesarean sections.

73
At six weeks postpartum, prolonged second stage of labor and cesarean section
were significant predictors of EPDS scores. This corresponds to the findings of Edwards,
et al., (1993), who reported a significantly higher incidence of postnatal depression
among participants who had undergone c-section than those who had a vaginal delivery.
These findings would be stronger if the stressors predicting EPDS scores at two weeks
postpartum would be the same stressors that predict EPDS scores at six weeks.
Interestingly, Forman, et al., (2000) reported no association between pregnancy or
delivery complications and PPD while my results show certain intrapartum events as
predictors for EPDS score. This difference may be explained by different instruments
used to detect PPD or by differences in sample characteristics.
Prolonged second stage of labor was included in the model that predicted EPDS
scores at six weeks postpartum. Although, raw data suggested total length of labor be
examined as a possible predictor or EPDS score at two- and six- weeks postpartum, no
correlation was detected. This is an interesting and unexpected finding that warrants
further research. If total length of labor had been found to have correlation with EPDS
scores at two- and/or six- weeks postpartum, fatigue would have been an obvious area to
explore. Since total length of labor was not found to have correlation with EPDS scores
in this sample, the significance of second stage of labor rises to the surface. There could
be something specific to second stage of labor that affects PPD. One possible area to
explore is the role of physiologic factors such as hormones. Such physiologic events may
explain some of the variance in PPD and warrants investigation.
74
The fact that Pitocin administration was not indicated in the models that predict
EPDS scores at two- or six- weeks postpartum was an unexpected finding. It was noted
that there were three points at which women may have received Pitocin: 1) to induce
labor, 2) to augment labor, and 3) to stop postpartum hemorrhage. Raw data suggested
that it was worth examining whether or not any administration of Pitocin had a
relationship with EPDS scores at two- and/or six- weeks postpartum regardless of the
time or reason of administration. Forty one (40.2%) of the 102 women in the sample
received Pitocin at least once during their labor process and the t-test indicated that, in
this sample, there was no significant difference in EPDS scores at two weeks or six
weeks postpartum for women who did or did not receive Pitocin.
Experience and clinical observation suggested that Pitocin is a factor in the
difficult transition that some women have to motherhood. Thus the findings in this study
were unexpected and warrant further exploration. Pitocin is frequently administered to
women who already have a dysfunctional labor pattern and are, therefore, already at risk
for complication including cesarean section. Administering Pitocin also requires
additional interventions such as IV canulation and continuous electronic fetal monitoring.
Perhaps the Pitocin is not the variable of interest and other variables should be explored.
Diathesis-Stress Model
The findings of this study provide partial support of the proposed Diathesis-Stress
Model of PPD. It was interesting to find that number of stressors had a significant
relationship with EPDS scores at six weeks postpartum. In addition, the regression
models provided information that implicates some intrapartum stressors as predictors for

75
EPDS scores of the women in this sample. These findings warrant further testing of the
model, with inclusion of the diathesis component in addition to the stressor component,
in order to completely test the model.
Limitations
This study explored postpartum depression in a very under-represented population
– rural women. However, this positive feature also limits the generalizability of the
findings to women living in other geographic locations. While race and ethnicity were not
inclusion or exclusion factors in sample selection, the fact that this sample consisted
almost entirely of Caucasian women is another limitation.
Missing data were a significant limitation. All women who received obstetric care
from the physicians of the identified practice were excluded due to missing EPDS scores.
It might be valuable to explore whether the providers’ profession (Certified Nurse
Midwife or physician) accounted for any variation in EPDS scores. This potential
relationship can only be investigated with equal provider representation. In the present
study, all participants were cared for by Certified Nurse Midwives.
Being a retrospective examination of medical records, another limitation was the
level of control over initial data collection methods. It is not clear how the EPDS scale
was administered and whether or not there was interrater reliability, since each provider
administered the scale themselves. While the retrospective design of this study is a
limitation, it should also be mentioned that the retrospective design of this study allowed
for a very important finding. This study identified the gap in the providers’ perceived
care and the care that the providers actually provide, illustrating a need for education for
76
the providers. The retrospective design allowed for the examination of actual practice.
This finding may not have been identified in a prospective study.
Additionally, this study examined women who are at risk for PPD rather than
women who actually suffer from PPD. The EPDS screens for depression but does not
actually diagnose depression. Therefore, relationships between intrapartum events and
actual PPD were not explored.
Significance of Research Findings
The findings from the present study have great significance. The sample was
obtained from an obstetric care practice that assumes all clients are screened for PPD at
two- and six- weeks postpartum. In fact 108 (50.7%) of the 213 women who delivered in
2007 were excluded due to missing EPDS scale scores at two- and/or six- weeks
postpartum. It is surprising to learn that half of the women who received care at the
identified obstetric practice did not receive the screening believed to be performed. While
all of the women receiving care from the physicians of the practice were excluded, there
were also Certified Nurse Midwife clients who were excluded due to missing EPDS scale
scores. This finding suggests a need for further education for obstetric providers about the
importance of screening for EPDS.
Findings from this study provided some support for previous research that
suggests a relationship between cesarean section and PPD. The relationship was not
robust, in that cesarean section explained less than 10% of the variance in PPD screening
scores. However, the present sample had a lower cesarean section rate than samples in

77
other studies and this finding from rural women who delivered in a low risk facility will
be an important addition to the literature.
The findings of this research offer an important opportunity to nurses who care
for childbearing women. Nurses caring for childbearing women are uniquely poised to
educate women about PPD. With the knowledge that certain intrapartum events are
predictors of EPDS scores, nurses can alert women to the potential risk and encourage
early reporting of signs/symptoms. Nurses working in obstetric offices can play an
important role in advocating for the PPD screening of all postpartum women. Increased
reporting can reduce the number of unidentified cases and promote interventions that
avert devastating emotional, physical, and economic consequences.
Implications for Future Research
This research should be replicated using samples from more diverse populations.
There are also additional opportunities to explore the relationship between the second
stage of labor and PPD. Most importantly, a prospective study would be the logical next
step. A prospective study would allow for more control over the research methods. A
prospective study would also allow for the testing of the complete Diathesis-Stress Model
whereas this study focused on the stress component of the model.
Summary
Through this research study, I was able to determine that EPDS scores at two
weeks postpartum are not significantly correlated with the number of intrapartum
stressors. However, at two weeks postpartum, perineal laceration and unscheduled
cesarean section are significant predictors of EPDS scores. EPDS scores at six weeks

78
postpartum are significantly correlated with the number of intrapartum stressors. In
addition, having a prolonged second stage of labor and having a cesarean section are
significant predictors of EPDS at six weeks postpartum. The total length of labor was not
correlated with EPDS scores at two- or six- weeks postpartum and there was no
significant difference in the EPDS scores between women who were given Pitocin and
women who were not given Pitocin.
This research also indicated a need for continued research and exploration. Most
importantly, though, this research illuminated the need for further education for
healthcare providers about the importance of PPD screening. Nurses can play an
important role in this education process. Nurses are also uniquely poised to educate
women about possible increased risk of PPD as determined by their intrapartum
experiences.

79
APPENDIX A:
EDINBURGH POSTNATAL DEPRESSION SCALE (EPDS)

80

81

82
APPENDIX B:
UNIVERSITY OF ARIZONA INSTITUTIONAL REVIEW BOARD (IRB)
APPROVAL

83

84

85
APPENDIX C:
FACILITY CONSENT FORM

86

87
REFERENCES
Abela J. & D'Alessandro, D. (2002). Beck's cognitive theory of depression: A test of the
diathesis-stress and causal mediation components. British Journal of Clinical
Psychology, 41, 111-128.
Adewuya, A., Fatoye, F., Ola, B., Ijaodola, O. & Ibigbami, S. (2005). Sociodemographic
and obstetric risk factors for postpartum depressive symptoms in Nigerian
women. Journal of Psychiatric Practice, 11(5), 353-358,
Ahokas, A., Kaukoranta, J. & Aito, M. (1999). Effect of oestradiol on postpartum
depression. Psychopharmacology, 146, 108-110.
Badger, T., Segrin, C., Meek, P., Lopez, A., & Bonham, E. (2005). Profiles of women
with breast cancer: Who responds to a telephone interpersonal counseling
intervention? Journal of Psychological Oncology, 23(2/3), 79-100.
Baker, L., Cross, S., Greaver, L., Wei, G., Lewis, R. & Healthy Start CORPS. (2005).
Prevalence of postpartum depression in a native American population. Maternal
and Child Health Journal, 9(1), 21-25.
Beck, A. T. (1967). Depression: Clinical, experimental, and theoretical aspects, New
York: Harper & Row.
Beck, A. T. (1983). Cognitive Therapy of Depression: New Perspectives. In P. J.
Clayton & J. E. Barrett (Eds.), Treatment of depression: Old controversies and
new approaches (pp. 265-290). New York: Raven Press.
Beck, C. (1993). Teetering on the edge: A substantive theory of postpartum depression.
Nursing Research, 42(1), 42-48.
Beck, C. (1996). A meta-analysis of predictors of postpartum depression. Nursing
research, 45(5), 297-303.
Beck, C. (2001). Predictors of postpartum depression: An update. Nursing Research,
50(5), 275-285.
Beck, C. (2002). Revision of the postpartum depression predictors inventory. JOGNN,
31(4), 394-402.
Beck, C. (2003). Recognizing and screening for postpartum depression in mothers of
NICU infants. Advances in Neonatal Care. 3(1), 37-46.
Beck, C & Gable, R. (2000). Postpartum depression screening scale: Development and
psychometric testing. Nursing Research, 49(5), 272-282.

88
Beck, C & Gable, R. (2001). Further validation of the Postpartum Depression Screening
Scale. Nursing Research, 50(3), 155-164.
Bloch, M., Schmidt, P., Danaceau, M., Murphy, J., Nieman, L., & Rubinow, D. (2000).
Effects of gonadal steroids in women with a history of postpartum depression.
American Journal of Psychiatry, 157, 924-930.
Boyd, R., Le, H. & Somberg, R. (2005). Review of screening instruments for postpartum
depression. Archives of Women's Mental Health, 8, 141-153.
Carter, F., Frampton, C. & Mulder, R. (2006). Cesarean section and postpartum
depression: A review of the evidence examining the link. Psychosomatic
Medicine, 68, 321-330.
Clay, E. & Seehusen, D. (2004) A review of postpartum depression for the primary care
physician. Southern Medical Journal, 97(2): 157-161.
Clemmens, D., Driscoll, J., Beck, C. (2004). Postpartum depression as profiled through
the postpartum depression screening scale. Maternal Child Nursing, 29(3), 180-
186.
Cohen, J. (1988). Statistical power analysis for the behavioral sciences (2nd ed.).
Hillsdale, New Jersey: Lawrence Erlbaum Associates.
Cooper, M. (2005). A developmental vulnerability-stress model of eating disorders: A
cognitive approach. In B. L. Hankin & J. R. Abela (Eds.) (2005). Development of
Psychopathology: A Vulnerability-Stress Perspective (pp. 328-354). Thousand
Oaks: Sage Publications.
Cox, J. L., Murray, D., & Chapman, G. (1993). A controlled study of onset, duration and
prevalence of postnatal depression. British Journal of Psychiatry, 163, 27-31.
Cox, J., Holden, J. & Sagovsky, R. (1987). Detection of postnatal depression:
Development of the 10-item Edinburgh Postnatal Depression Scale. British
Journal of Psychiatry, 150, 782-786.
Department of Health & Human Services (2008). Critical access hospitals. Retrieved
May 8, 2008 from
http://www.cms.hhs.gov/Certificationandcomplianc/04_CAHs.asp
Dindar, I. & Erdogan, S. (2007). Screening of Turkish women for postpartum depression
within the first postpartum year: The risk profile of a community sample. Public
Health Nursing, 24(2), 176-183.
89
Edhborg, M., Lundh, W., Seimyr, L. & Widstrom, A. (2003). The parent-child
relationship in the context of maternal depressive mood. Archives of Women’s
Mental Health, 6, 211-216.
Edwards, D., Porter, S. & Stein, G. (1993). A pilot study of postnatal depression
following caesarean section using two retrospective self-rating instruments.
Journal of Psychosomatic Research, 38(2), 111-117.
Epperson, C. N. (1999). Postpartum major depression: Detection and treatment.
American Family Physician, 59(8).
Forman, D., O’Hara, M., Stuart, S., Gorman, L., Larsen, K., & Coy, K. (2007). Effective
treatment for postpartum depression is not sufficient to improve the developing
mother-child relationship. Development & Psychopathology, 19, 585-602.
Forman, D., Videbech, P., Hedegaard, M., Salvig, J., & Seecher, N. (2000). Postpartum
depression: Identification of women at risk. British Journal of Obstetrics and
Gynaecology, 107, 1210-1217.
Goodman, J. (2004). Paternal postpartum depression, its relationship to maternal
postpartum depression, and implications for family health. Journal of Advanced
Nursing, 45(1), 26-35.
Grazioli, R. & Terry, D. (2000). The role of cognitive vulnerability and stress in the
prediction of postpartum depressive symptomatology. British Journal of Clinical
Psychology, 39, 329-347.
Halbreich, U. & Karkun, S. (2006). Cross-cultural and social diversity of prevalence of
postpartum depression and depressive symptoms. Journal of Affective Disorders,
91, 97-111.
Hamilton, B., Martin, J., & Sutton, P. (2003). Births: Preliminary data for 2002. National
Vital Statistics Reports, 5(1), 1-20.
Hankin, B. & Abela, J. (2005). Development of Psychopathology: A Vulnerability-
Stress Perspective. Thousand Oaks, CA: Sage Publishing.
Hannah, M. (2004). Planned elective cesarean A reasonable choice for some women?
Canadian Medical Association Journal, 170(5), 813-814.
Hiltunen, P., Raudaskoski, T., Ebeling, H. & Moilanen, I. (2004). Does pain relief during
delivery decrease the risk of postnatal depression? Acta Obstetricia et
Gynecologica Scandinavica, 83, 257-261.

90
Honey, K. & Morgan, M. (2003). A stress-coping transactional model of low mood
following childbirth. Journal of Reproductive and Infant Psychology, 21(2), 129-
143.
Ho-Yen, S., Bondevik, G., Eberhard-Gran, M. & Bjorvatn, B. (2007). Factors associated
with depressive symptoms among postnatal women in Nepal. Acta Obstetricia et
Gynecologica, 86, 291-297.
Ingram, R. & Luxton, D. (2005). Vulnerability-Stress Models. In B. L. Hankin & J. R.
Abela (Eds.) (2005). Development of Psychopathology: A Vulnerability-Stress
Perspective (pp. 32-46). Thousand Oaks: Sage Publications.
Jardi, R., Pelta, J., Maron, M., Thomas, P., Delion, P., Codaccioni, X. & Gouldmand, M.
(2006). Predictive validation study of the Edinburgh Postnatal Depression Scale
in the first week after delivery and risk analysis for postnatal depression. Journal
of Affective Disorders, 93, 169-176.
Josefsson, A., Angelsioo L., Berg G., Ekstrom C., Gunnervik, C., Nordin, C., & Sydsjo,
G. (2002). Obstetric, somatic, and demographic risk factors for postpartum
depressive symptoms. Obstetrics & Gynecology, 99(2), 223-228.
Kassel, J., Weinstein, S., Skitch, S., Veilleux, J., & Mermelstein, R. (2005). The
development of substance abuse in adolescence: Correlates, causes, and
consequences. In B. L. Hankin & J. R. Abela (Eds.) (2005). Development of
Psychopathology: A Vulnerability-Stress Perspective (pp. 355-384). Thousand
Oaks: Sage Publications.
Koo, V., Lynch, J., & Cooper, S. (2003). Risk of postnatal depression after emergency
delivery. Journal of Obstetric and Gynaecological Research, 29(4), 246-250.
Llewellyn, A. M., Stowe, Z. N., & Nemeroff, C. B. (1997). Depression during pregnancy
and puerperium. Journal of Clinical Psychiatry,. 58, 26-32.
Leahy-Warren, P. & McCarthy, G. (2007). Postnatal depression: Prevalence, mothers’
perspectives, and treatments. Archives of Psychiatric Nursing, 21(2), 91-100.
Lewinsohn, P., Joiner, T. & Rhode, P. (2001). Evaluation of cognitive diathesis-stress
models in predicting major depressive disorder in adolescents. Journal of
Abnormal Psychology, 110(2), 203-215.
London, M., Ladewig, P., Ball, J., & Bindler, R. (2007). Maternal & Child Nursing Care
(2nd Ed.). Upper Saddle River, NJ: Pearson Education, Inc.
Meehl, P. (1962). Schizotaxia, schizotypic, schizophrenia. American Psychologist, 17,
827-838.

91
Meehl, P. (1989). Schizotaxia revisited. Archives of General Psychiatry, 46, 935-944.
Meehl, P. (1990). Toward an integrated theory of schizotaxia, schizotypic, and
schizophrenia. Journal of Personality Disorders, 4, 1-99.
Merriam-Webster. (2007). Stress. Retrieved October 19, 2007 from http://www.merriam-
webster.com/dictionary/stress
Monroe, S. & Simons, A. (1991). Diathesis-Stress theories in the context of life stress
research: Implications for he depressive disorders. Psychological Bulletin, 110(3),
406-425.
Montazeri, A., Torkan, B. & Omidvari, S. (2007). The Edinburgh Postnatal Depression
Scale (EPDS): Translation and validation study of the Iranian version. BMC
Psychiatry, 7(11).
Navarro, P., Ascaso, C., Garcia-Esteve, L., Aguado, J., Torres, A. & Martin-Santos, R.
(2007). Postnatal psychiatric morbidity: A validation study of the GHQ-12 and
the EPDS as screening tools. General Hospital Psychiatry, 29, 1-7.
Nierop, A., Bratsikas, A., Sinnermann, R. & Ehlert, U. (2006). Are stress-induced
cortisol changes during pregnancy associated with postpartum depressive
symptoms? Psychosomatic Medicine, 68, 931-937.
Patel, R., Murphy, D., & Peters, T. (2005). Operative delivery and postnatal depression:
A cohort study. BMJ, 330, 879.
Radloff, L. (1977). The CES-D Scale: A self-report depression scale for research in the
general population. Applied Psychological Measures, 1, 385-401.
Robertson, E., Grace, S., Wallington, T. & Stewart, D. (2004). Antenatal risk factors for
postpartum depression: A synthesis of recent literature. General Hospital
Psychiatry, 26, 289-295.
Robins, C. & Block, P. (1988). Personal vulnerability, life events, and depressive
symptoms: A test of a specific interactional model. Journal of Personality and
Social Psychology, 54(5), 847-852.
Sagami, A., Kayama, M. & Senoo, E. (2004). The relationship between postpartum
depression and abusive parenting behavior of Japanese mothers: A survey of
mothers with a child less than one year old. Bulletin of the Menninger Clinic,
68(2), 174-187.
U.S. Census Bureau. (2007). Definition: Urban & rural. Retrieved May 8, 2008 from
https://ask.census.gov

92
Verdoux, H., Galtigny-Dallay, E. & Minissini, A. (2002). Obstetrical complications and
the development of postpartum depressive symptoms: A prospective survey of the
MATQUID cohort. ACTA Psychatrica Scandinavica, 106, 212-219.
Wisner, K., Chambers, C. & Sit, D. (2006). Postpartum depression: A major public health
problem. JAMA, 296(21), 2616-2618.
Williams, N., Reardon, J., Murray, K., & Cole, T. (2005). Anxiety disorders: A
developmental vulnerability-stress perspective. In B. L. Hankin & J. R. Abela
(Eds.) (2005). Development of Psychopathology: A Vulnerability-Stress
Perspective (pp. 289-327). Thousand Oaks: Sage Publications.
Zubin, J. & Spring, B. (1977). Vulnerability: A new view of schizophrenia. Journal of
Abnormal Psychology, 86, 103-126.
Zuckerman, M. (2000). Vulnerability to Psychopathology: A Biosocial Model.
Washington, DC: American Psychological Association.
Zvolensky, M., Kotov, R., Antipova, A. & Schmidt, N. (2005). Diathesis stress model for
panic-related distress: a test in a Russian epidemiological sample. Behaviour
Research and Therapy, 43, 521-532.