POSTHARVEST ANALYSIS OF VEGETABLES IN...
110
Transcript of POSTHARVEST ANALYSIS OF VEGETABLES IN...
POSTHARVEST ANALYSIS OF VEGETABLES IN FIJI
EGGPLANT, OKRA AND TOMATO
by
Binesh Prasad
A thesis submitted in fulfillment of the requirement for the degree of
Master of Agriculture
Copyright © 2015 by Binesh Prasad
School of Agriculture and Food Technology
Faculty of Business and Economics
The University of the South Pacific
March, 2015
i
ii
TABLE OF CONTENTS
PAGE
1.0 INTRODUCTION 1
1.1 Research Problem 3
1.2 Research Objectives 4
2.0 LITERATURE REVIEW 5
2.1 Background of Fiji 5
2.1.1 Fiji’s agriculture industry 5
2.1.2 The export of vegetables from Fiji 6
2.2 The Postharvest Technology of the Selected Vegetable Crops 7
2.2.1 Eggplant 7
2.2.2 Okra 7
2.2.3 Tomato 8
2.3 Status Of Postharvest Handling And Losses 9
2.4 Causes of Postharvest Losses 18
2.4.1 Mechanical injury 18
2.4.2 Postharvest pathogens 18
2.4.3 Physiological deterioration 18
2.5 Postharvest Loss and Quality Indicators 19
2.6 Significance of Postharvest Loss to Natural Resource Management 19
2.7 Climatic Factors Affecting Postharvest Quality of Vegetables 20
2.8 Firmness and Decay of Vegetables 21
iii
2.9 Commodity System Analysis Methodology 21
2.9.1 Causes of losses at different points of the system 24
3.0 RESEARCH METHODOLOGY 25
3.1 Scope 25
3.2 Research Design and Sampling 27
3.3 Crop Selection 28
3.4 Data Collection 29
3.4.1 Types of losses at production level 29
3.4.2 Types of losses at exporter level 29
3.4.3 Types of losses at retailer level 30
3.4.4 General data 30
3.5 Quantitative Loss Assessment 30
3.5.1 Percentage of rejected crops at different levels 31
3.5.2 Types of rejected crops at different levels 31
3.5.3 End use of rejected crops at different levels 31
3.5.4 Observed tomatoes 32
3.6 Statistical Analysis 32
4.0 RESULTS AND DISCUSSIONS 33
4.1 Eggplant 33
4.1.1 Postharvest losses in eggplants at different levels 33
4.1.1.1 Postharvest losses in eggplants at production strata level 33
4.1.1.2 Postharvest losses in eggplants at local municipal retailer level 35
iv
4.1.1.3 Postharvest losses in eggplants at exporter strata level 36
4.1.2 End use of rejected eggplants at different levels 37
4.1.2.1 End use of rejected eggplants at production strata level 37
4.1.2.2 End use of rejected eggplants at local municipal retailer stratalevel
38
4.1.2.3 End use of rejected eggplants at exporter strata level 39
4.1.3 Aggregate postharvest losses and end use of rejected eggplants 39
4.1.4 Non-trade loss vs. absolute loss of eggplants 41
4.2 Okra 42
4.2.1 Postharvest losses in okra at different levels 42
4.2.1.1 Postharvest losses in okra at production strata level 42
4.2.1.2 Postharvest losses in okra at local municipal retailer strata level 44
4.2.1.3 Postharvest losses in okra at exporter strata level 46
4.2.2 End use of rejected okra at different levels 47
4.2.2.1 End use of rejected okra at production strata level 47
4.2.2.2 End use of rejected okra at local municipal retailer strata level 47
4.2.2.3 End use of rejected okra at exporter strata level 48
4.2.3 Aggregate postharvest losses and end use of rejected okra 49
4.2.4 Non-trade loss vs. absolute loss of okra 51
4.3 Tomato 51
4.3.1 Postharvest losses in tomato at different levels 52
4.3.1.1 Postharvest losses in tomato at production strata level 52
4.3.1.2 Postharvest losses in tomato at local municipal retailer stratalevel
53
v
4.3.2 End use of rejected tomato at different levels 54
4.3.2.1 End use of rejected tomato at production strata level 54
4.3.2.2 End use of rejected tomato at local municipal retailer strata level 55
4.3.3 Aggregate postharvest losses and end use of rejected tomato 55
4.3.4 Non-trade loss vs. absolute loss of tomato 58
4.4 Five Hundred (500) Observed Tomatoes 59
4.5 Postharvest Operations 61
4.5.1 Harvesting 61
4.5.2 Sorting and Grading 61
4.5.3 Handling and Transportation 61
5.0 SUMMARY, CONCLUSIONS AND POLICY IMPLICATIONS 62
REFERENCES 70
APPENDICES 75
vi
LIST OF FIGURES
PAGE
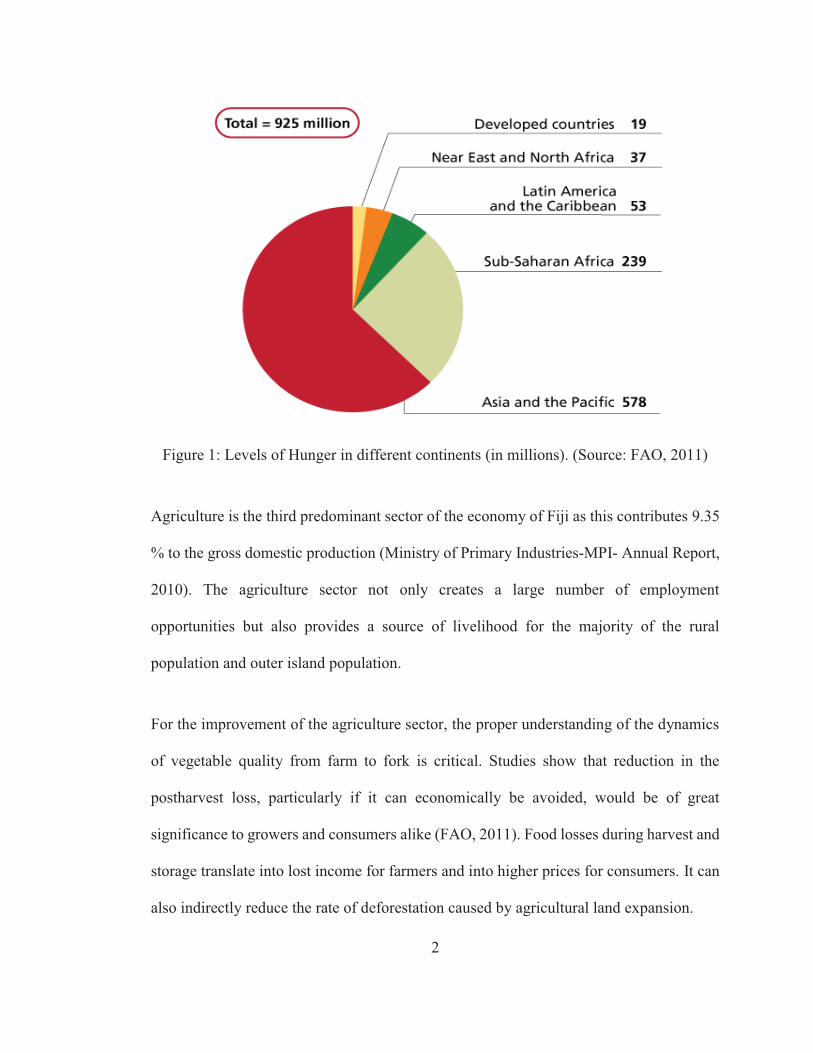
Figure 1 Levels of Hunger in different continents (in millions) 2
Figure 2 Multi-Stratified Sampling 28
Figure 3 Overall postharvest losses in eggplants 40
Figure 4 Overall end use of rejected eggplants 41
Figure 5 Non-trade loss vs. absolute loss of eggplants 42
Figure 6 Overall postharvest losses in okra 49
Figure 7 Overall end use of rejected okra 50
Figure 8 Non-trade loss vs. absolute loss of okra 51
Figure 9 Overall postharvest losses in tomatoes 56
Figure 10 Overall end use of rejected tomatoes 57
Figure 11 Non-trade loss vs. absolute loss of tomatoes 58
Figure 12 Flow network and losses of eggplant from farmers’ fields to consumers
62
Figure 13 Flow network and losses of okra from farmers’ fields to consumers
63
Figure 14 Flow network and losses of tomato from farmers’ fields to consumers
64
Figure 15 Projected loss of tomatoes over a storage period of 12 days under farmer’s conditions.
65
vii
LIST OF PLATES
PAGE
Plate 1 Map of Fiji 25
Plate 2 Sigatoka Valley 25
Plate 3 Photo of Sigatoka Valley 26
Plate 4 Photo of Sigatoka Valley 26
viii
LIST OF TABLES
PAGE
Table 1 Income Classification of Selected Countries of the Asia-Pacific Region
10
Table 2 Estimated Levels of Postharvest Losses in the Asia-Pacific
Region
11
Table 3 Average Levels of Postharvest Losses in Vegetables at Various Steps of the Marketing Chain
17
Table 4 Postharvest losses in eggplants at production level 34
Table 5 Postharvest losses in eggplants at local municipal retailer level 35
Table 6 Postharvest losses in eggplants at exporter level 37
Table 7 End use of rejected eggplants at production level 38
Table 8 End use of rejected eggplants at local municipal retailer level 38
Table 9 End use of rejected eggplants at exporter level 39
Table 10 Postharvest losses in okra at production level 43
Table 11 Postharvest losses in okra at local municipal retailer level 45
Table 12 Postharvest losses in okra at exporter level 46
Table 13 End use of rejected okra at production level 47
Table 14 End use of rejected okra at local municipal retailer level 48
ix
Table 15 End use of rejected okra at exporter level 48
Table 16 Postharvest losses in tomatoes at production level 52
Table 17 Postharvest losses in tomato at local municipal retailer level 54
Table 18 End use of rejected tomatoes at production level 55
Table 19 End use of rejected tomatoes at local municipal retailer level 55
Table 20 Losses in 500 tomatoes observed at four (4) day intervals 59
Table 21 Summary of total postharvest losses in selected vegetables 66
Table 22 Summary of types of postharvest losses in selected vegetables 66
x
LIST OF APPENDICES
PAGE
Appendix 1 Questionnaire and Data Collection Sheet at Production Level 75
Appendix 2 Questionnaire and Data Collection Sheet at Exporter Level 79
Appendix 3 Questionnaire and Data Collection Sheet at Retailer Level 82
Appendix 4 The Fiji Quarantine Pathway – Bilateral Quarantine Agreement 85
Appendix 5 Analysis of variance for % losses of eggplant at farmer level
88
Appendix 6 Analysis of variance for % losses of eggplant at retailer level
89
Appendix 7 Analysis of variance for % losses of eggplant at exporter level
90
Appendix 8 Analysis of variance for % losses of okra at farmer level
91
Appendix 9 Analysis of variance for % losses of okra at retailer level
92
Appendix 10
Analysis of variance for % losses of okra at exporter level
93
Appendix 11
Analysis of variance for % losses of tomato at farmer level
94
Appendix 12
Analysis of variance for % losses of tomato at retailer level
95

xi
ACKNOWLEDGEMENT
I would like to put across my sincere appreciation and positive reception to a number of
people who were very generous and ready to lend a hand during the course of my research.
Without their backing, things would not have gone virtually as well.
Heartfelt thanks to ACIAR/USP for availing the funds for the study and providing all the
required backup support and services.
I am greatly indebted to Mr Falaniko Amosa and Professor Steven J. R. Underhill for
being my supervisor and co-supervisor respectively, providing initial guidance and
assistance during my planning, field research and thesis writing stages.
A very special recognition and thanks to Mr Sanjay Anand for tolerating me during the
entire period of my initial planning and thesis writing. Thank you very much for your
valuable expertise in statistical analysis, patience and continuous guidance and kind
words of encouragement and support.
Countless thanks to Rohit, Shonal and Kalawa for accompanying and helping me
tirelessly during the execution of field tasks and data collection. I also thank my
colleagues: Dinesh, Ami, Bimlesh and the staff of Sigatoka Agriculture Station especially
Pranil, Ajay, Naresh and Siti for their assistance in numerous ways.
I also thank and dedicate this thesis to my beautiful wife (Anjini), handsome son
(Animesh) and cute daughter (Anisha) for making me this capable through their
sacrifices, guidance, patience and continuous encouragement.
And finally to my parents and the Glory of the Almighty, my Saviour to whom I owe
everything. You were the pillars of my strength.
xii
ABSTRACT
Research was conducted in Fiji to determine the extent of perceived postharvest losses
occurring at three levels - production level, exporter level and local municipal retailer
level - and the end use of the rejected perishable vegetable commodities, namely;
eggplant, okra and tomato. Postharvest losses of these vegetables were found to be
ranging from 25.2 to 40.4; 23.9 to 31.5 and 19.5 to 31 per cent respectively. An
aggregate average postharvest loss of 32.8% was ascertained for eggplants, 27.5% for
okra and 25.8% for tomatoes along the postharvest chain.
The postharvest loss caused by shape was relatively similar i.e. 7.8% and 8.7% for
eggplant and okra respectively. Losses due to physical abrasion was quite high (10.5%)
in eggplant whereas okra and tomato were in the lower bracket of 3.8% and 4%
respectively. Percentage loss caused by senescence/overripe ranged from 8.8 to 10.9 for
the three crops and loss caused by pest/disease was very high in tomato 11% whereas
eggplant and okra were in the lower bracket of 5.9 and 6.1 per cent respectively.
The total postharvest losses of the selected commodities were further categorised into
non-trade loss (monetary gains partially realised in terms of domestic consumption and
livestock feed) and absolute loss (wastage). Eggplant (80%) had the highest absolute loss
followed by okra (76%) and tomatoes (71%).
Actual postharvest loss in tomatoes were also ascertained at production level by observing
tomatoes from the three production strata (lower valley, mid valley and upper valley) and
a very interesting data was obtained, which is challenging the traditional view that Fijian
xiii
farmers are often poorly connected with market-based postharvest losses. The actual
postharvest loss in tomatoes observed after four days was 15.3% and the perceived
postharvest loss in tomato at production level was 14.6%.
A number of deficiencies currently exist in the postharvest management and processing of
vegetables in Fiji and action must be taken in order to upgrade systems, in order to reduce
the levels of postharvest losses. There is a great need to adopt and develop simple
technologies for loss prevention and value addition along the postharvest chain.
1
CHAPTER 1
INTRODUCTION
Fresh vegetables have been a part of the human diet since the dawn of history. However,
their full nutritional importance has only been recognised in recent times (Wills et al.,
1998). Despite the remarkable advances made in increasing food production at the global
level, approximately one-third of all food produced is lost or wasted from farm to fork.
(Food and Agriculture Organisation-FAO, 2011). There are many reasons for this, one of
which is food losses occurring in the postharvest and marketing system. The report
suggests that these losses tend to be highest in those countries where the need for food is
greatest. There are several accounts on the estimate of postharvest losses to be anywhere
between 20 – 100% (FAO, 1989). In the light of growing demand for food and land
resources, such losses are simply unacceptable.
This wastage not only has an enormous negative impact on the global economy and food
availability, it also has major environmental impacts. It is distressing to note that so much
time is being devoted to the culture of the plant, so much money is spent on irrigation,
fertilisers and crop protection measures, but little attention is paid and resources devoted
to the issues related with postharvest losses resulting in failure to meet food requirement
of the hungry millions (FAO, 2010, Fig. 1).
Preventing postharvest losses reduces the use of resources required for food production,
labour and disposal costs, and reduces all the environmental, economic and social impacts
linked to food waste disposal (FAO, 2011).
2
Figure 1: Levels of Hunger in different continents (in millions). (Source: FAO, 2011)
Agriculture is the third predominant sector of the economy of Fiji as this contributes 9.35
% to the gross domestic production (Ministry of Primary Industries-MPI- Annual Report,
2010). The agriculture sector not only creates a large number of employment
opportunities but also provides a source of livelihood for the majority of the rural
population and outer island population.
For the improvement of the agriculture sector, the proper understanding of the dynamics
of vegetable quality from farm to fork is critical. Studies show that reduction in the
postharvest loss, particularly if it can economically be avoided, would be of great
significance to growers and consumers alike (FAO, 2011). Food losses during harvest and
storage translate into lost income for farmers and into higher prices for consumers. It can
also indirectly reduce the rate of deforestation caused by agricultural land expansion.
3
Increased emphasis should be placed on conservation after harvest, rather than
endeavouring to further boost crop production, as this would appear to offer a better return
for the available resources of labour, energy and capital (Wills et al., 1998).
1.1 Research Problem
The growing importance of vegetables in Fiji’s economy can be well appreciated in terms
of their rising domestic demand on account of increase in population and per capita
income; their increasing export potential; the need for providing employment
opportunities in the rural areas, and vegetables being relatively more remunerative crops.
Due to the large distances that separate the production areas and the sub-optimal
postharvest technology management (including the method of picking/plucking/digging,
grading, packing, storing and transporting), a large proportion of vegetables is lost or
spoiled at various stages of the postharvest activity chain (Kumar, 2004).
Many studies have been conducted for estimating the postharvest losses, particularly in
the developed countries. However, the importance of postharvest losses in agricultural
commodities is not fully recognised in developing countries where agricultural production
is not commercial or market oriented. Meanwhile, the number of scientists involved in
production research in these countries is significantly higher than those engaged in
postharvest losses in agricultural commodities (FAO, 2011).
4
The study by Karim and Wee (1996) had revealed that well managed postharvest
activities for vegetables led to higher yields and profits to producers. It is therefore,
important to estimate the nature and extent of postharvest losses of vegetables occurring
in Fiji, why they are occurring and the best way to remediate them.
Hence, keeping all these problems into consideration, a study on postharvest analysis of
vegetable crops in Fiji was undertaken.
1.2 Research Objectives
1.2.1 To estimate the postharvest losses in the selected vegetable crops namely
eggplant, okra and tomato at farmer, exporter and local municipal retailer
levels;
1.2.2 To separate the postharvest losses into “non-trade postharvest loss” and
“absolute postharvest loss”;
1.2.3 To estimate the actual postharvest losses in tomato at four (4) day intervals for
12 days;
1.2.4 To make suggestions to minimise postharvest losses in vegetable crops namely
eggplant, okra and tomato.
5
CHAPTER 2
LITERATURE REVIEW
2.1 Background of Fiji
Fiji is a group of islands in the South Pacific, lying about 4,450 km (2,775 miles)
southwest of Honolulu and 1,770 km (1,100 miles) north of New Zealand. Of the 322
islands and 522 smaller islets making up the archipelago, about 106 are permanently
inhabited. Viti Levu, the largest island, covers about 57 % of the nation's land area, hosts
the two official cities (the capital Suva, and Lautoka) and most other major towns, such as
Ba, Nasinu, and Nadi (the site of the international airport), and contains some 69 % of the
population. Vanua Levu, 64 km to the north of Viti Levu, covers just over 30 % of the
land area though is home to only some 15 % of the population. Its main towns are Labasa
and Savusavu (Wikipedia, 2012).
2.1.1 Fiji’s agriculture industry Agriculture being the mainstay of Fiji’s economy, contributes around 28% to total
employment in the formal sector and indirectly employing many more. This sector which
was once a major stronghold of Fiji’s economy is the third largest now, contributing $416
million (9.35%) annually to the nations GDP. Sugarcane which used to dominate the
sector now only contributes (1.7%) and has been surpassed by other crops, horticulture
and livestock production (3.6%) and subsistence sector (2.75%) (Agriculture Fiji Online,
2012).
The non-sugar agricultural sector over the years has shown a promising trend. The main
commodities’ that constitute this sector are root crops (taro, cassava, yams and sweet
6
potato), tropical fruits (pineapple, papaya and mango), vegetables, spices, kava, coconut
products and livestock (Agriculture Fiji Online, 2012).
Agriculture has the potential in other sectors such as tourism and agro-industries and as a
major economic activity in the rural areas; agriculture plays an important role in the
process of rural development as it is an interwoven component of rural life. Having a rich
resource base and tropical climate, Fiji has an advantage in producing a wide variety of
tropical fruits and vegetables. Given Fiji’s fast expanding tourism sector, agricultural
growth is necessary to supply the ever increasing demand from the local and hotel and
tourism sector. Thus, the potential for Fiji’s agriculture sector is in production for local
consumption, export of high value commodities and niche agricultural produce.
2.1.2 The export of vegetables from Fiji
A Bilateral Quarantine Agreement (BQA) (Appendix 4) was signed between Fiji and the
main vegetable export market i.e., New Zealand for selected fresh produce. This
agreement necessitates that Fiji facilitate technical requirements of pest risk management
in accordance with requirements of the importing country. As a follow up to the
establishment of this BQA, an export pathway for fruits and vegetables destined for export
to New Zealand was developed. In accordance with this agreement, a High Temperature
Forced Air (HTFA) treatment facility was established in Nadi, Fiji to fulfill the
pre-requisite for fresh export of fruit fly host crops.
7
2.2 The Postharvest Technology of the Selected Vegetable Crops
2.2.1 Eggplant
The botanical name of eggplant is Solanum melongena L., also known as Guinea squash,
garden egg, aubergine, and bringal or bringall. The fruit shape varies from globular to pear
to elongate. Eggplants require an optimum temperature range of 21o to 29oC for best
growth and should not be exposed to extremes of temperature, but can produce well under
light or heavy rainfall conditions (Nonnecke, 1989).
Eggplants are ready for harvest when fully formed and before the fruit has begun to
change colour usually fifty days (early types) to eighty days (late types) under optimum
growing conditions. Harvest is by hand and progressive as the season advances and fruits
mature in successive waves. The appropriately matured eggplant fruit is firm, heavy
feeling, and glistening, and the calyx should be fresh and green. Anything less than this in
appearance gives the impression of excessive water loss and aging i.e. eggplant
postharvest damage/loss (Nonnecke, 1989).
2.2.2 Okra
Okra, or Hibiscus esculentus L, is a member of the Malvaceae (mallow) family, also
known as gumbo, gombo, quingumbo, lady’s finger, or quaibo. The edible portion of the
okra is the immature tender seed pod, which quickly loses its desirable characteristics as it
matures (Nonnecke, 1989).
The okra pods must be harvested at the most appropriate stage of maximum quality and
acceptability. To be attractive okra pods should appear bright green, firm, free of
8
blemishes and because okra bruises easily, the pods must be tightly placed in containers
for transportation (Nonnecke, 1989).
2.2.3 Tomato
The botanical name of tomato is Lycopersicon esculentum and is a highly perishable crop
of the Solanaceae family. The thrust of all tomato production is to have fruit acceptable to
the market for which the crop was grown. Definitions of tomato maturity have to be
precise in order to identify the differing requirements for the harvested fruits (Nonnecke,
1989).
The United States Department of Agriculture (USDA), (1963) has established tomato fruit
colour codes that express the maturity of fruit using colour:
i. Green Fruit – mature green, the jelly surrounding the seed has formed –
when treated the fruit becomes equivalent to vine ripened fruit.
ii. Breakers – 10 per cent pink or red, usually internally pink
iii. Turning – 10 to 30 per cent pink or red
iv. Pink – 30 to 60 per cent pink or red
v. Light red – 60 to 90 per cent pink or red
vi. Red – over 90 per cent surface red
According to Nonnecke (1989), the tomato throughout its maturity cycle should remain
firm and be free from puffiness, bruises, blemishes and off-odours. Harvested tomatoes in
the postharvest handling cycle should be firm to the touch and its quality is at its peak
when the fruit has reached the red ripe stage.
9
2.3 Status of Postharvest Handling and Losses
Rapid growth in horticultural development has been witnessed in the Asia-Pacific region
(FAO, 2011). The developments in science and technology could provide an opportunity
for intensifying the production of horticultural produce.
The World Food Conference convened in Rome in 1974, drew attention to the concept of
postharvest food loss reduction as a significant means to increase food availability. The
Special Action Program for Food Loss Prevention, of the Food and Agriculture
Organisation of the United Nations (FAO) initially focused on durable food grains, owing
to their prominence in developing country diets. An Expert Consultation on Food Loss
Prevention in Perishable Crops, mainly covering fruit and vegetables was held in Rome in
1980.
A recent study in Fiji by Underhill (2013) stated that a postharvest horticultural loss along
a commercial tomato supply chain from farm to vendor is 32.93 %. Of the total losses, 8.8
% of the harvested crop is rotten at time of packing due to high ripening temperature and
humidity because the grower places tomatoes under plastic sheeting or leaves in the sun to
speed up the on-farm ripening process from day 1 to 4. Furthermore, farmers pick hard
green fruits to reduce damage by birds but 8.9 % of tomatoes failed to ripen at the time of
packing and 0.13 % had physical damages during transportation on day 5 and 6.4 % of
tomatoes are rejected by vendor on the first day of trading due to overripe or rotting.
Underhill further, stated that a projected further 14.45% loss will occur if tomato fruits are
not consumed within 48 hours and after reaching the vendor and if there was a 1 day delay
or break in the chain then total postharvest wastage would be 60.78%.
10
In the same work, Underhill (2013) reported that the total rejected tomatoes (32.93%) that
are removed from the commercial supply chain are used either at home or undergoes
intra-community trading (11%), fed to domestic livestock (6.34%), ends up as on-farm
and municipal refuse (14.69%) and 0.9 % of product end use was not identified.
Poor infrastructures for storage, processing and marketing in many countries of the region
contribute to a high proportion of waste, which average between 10% and 40%
(Choudhury, 2004). Sirivatanapa (2004) also presented that postharvest losses which
average between 24% and 40% in developing countries, and between 2% and 20% in
developed countries, are a major source of waste. Major infrastructural limitations also
continue to impose severe constraints to domestic distribution as well as to the export of
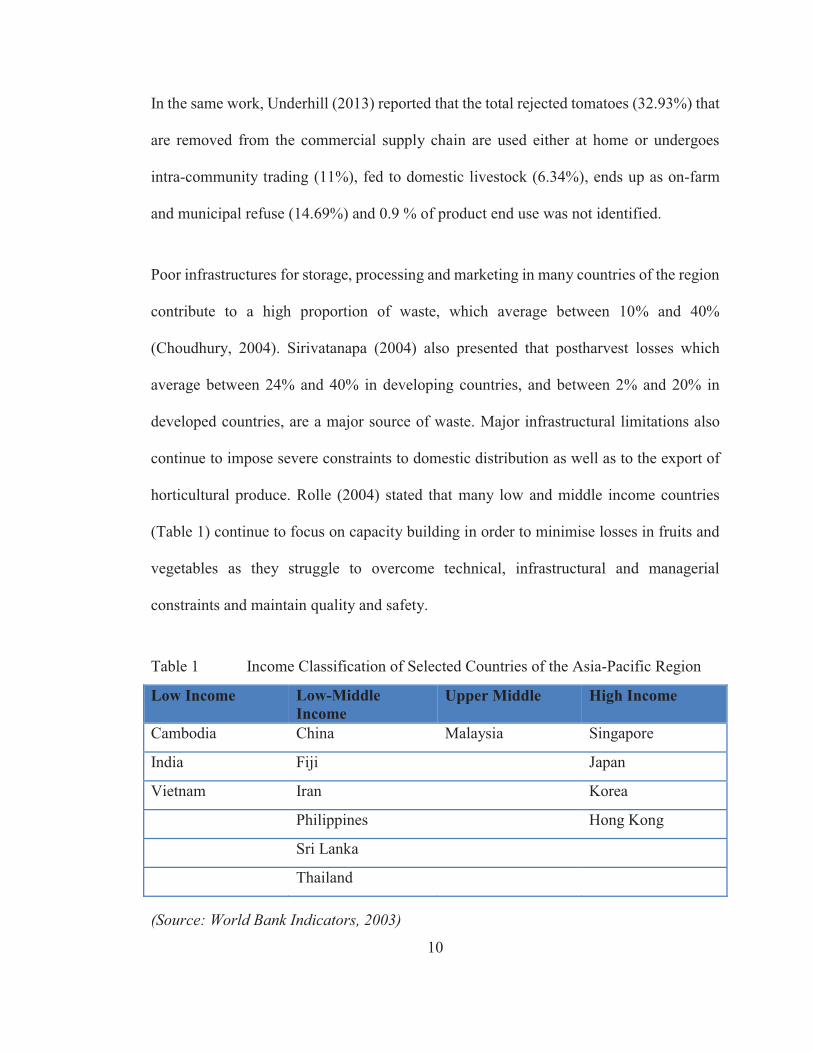
horticultural produce. Rolle (2004) stated that many low and middle income countries
(Table 1) continue to focus on capacity building in order to minimise losses in fruits and
vegetables as they struggle to overcome technical, infrastructural and managerial
constraints and maintain quality and safety.
Table 1 Income Classification of Selected Countries of the Asia-Pacific Region
Low Income Low-Middle
Income
Upper Middle High Income
Cambodia China Malaysia Singapore
India Fiji Japan
Vietnam Iran Korea
Philippines Hong Kong
Sri Lanka
Thailand
(Source: World Bank Indicators, 2003)
11
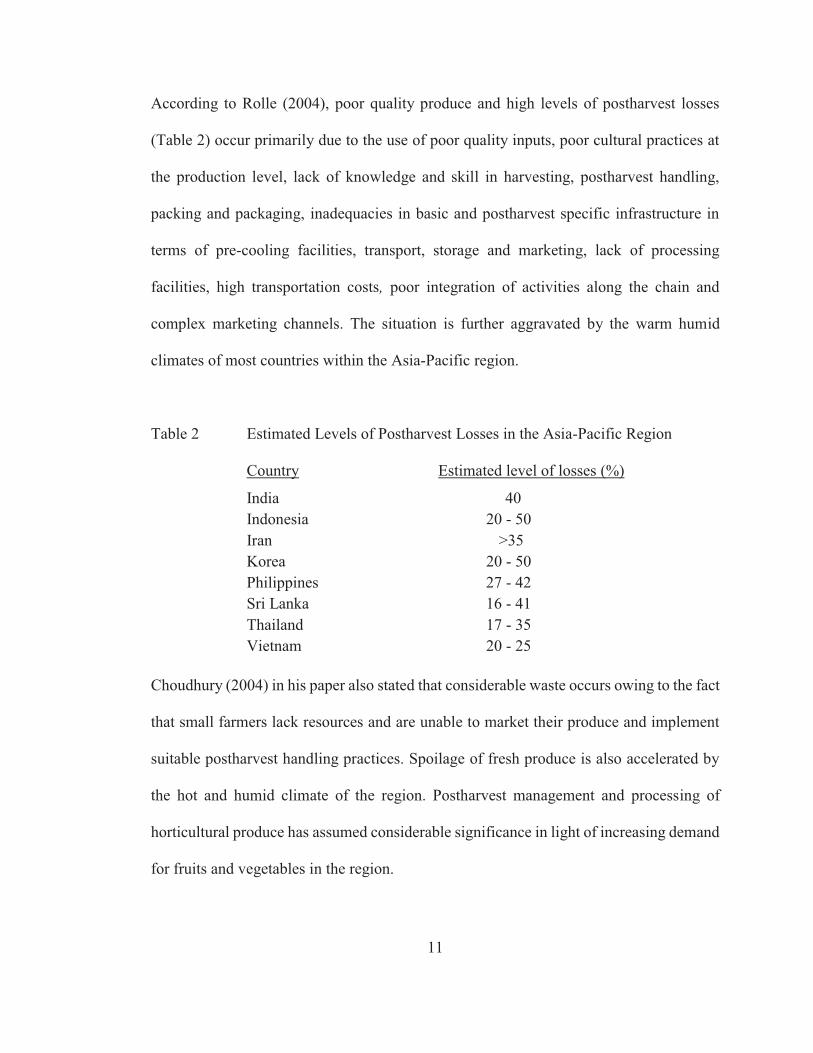
According to Rolle (2004), poor quality produce and high levels of postharvest losses
(Table 2) occur primarily due to the use of poor quality inputs, poor cultural practices at
the production level, lack of knowledge and skill in harvesting, postharvest handling,
packing and packaging, inadequacies in basic and postharvest specific infrastructure in
terms of pre-cooling facilities, transport, storage and marketing, lack of processing
facilities, high transportation costs, poor integration of activities along the chain and
complex marketing channels. The situation is further aggravated by the warm humid
climates of most countries within the Asia-Pacific region.
Table 2 Estimated Levels of Postharvest Losses in the Asia-Pacific Region
Country Estimated level of losses (%)
India 40Indonesia 20 - 50 Iran >35 Korea 20 - 50 Philippines 27 - 42 Sri Lanka 16 - 41 Thailand 17 - 35 Vietnam 20 - 25
Choudhury (2004) in his paper also stated that considerable waste occurs owing to the fact
that small farmers lack resources and are unable to market their produce and implement
suitable postharvest handling practices. Spoilage of fresh produce is also accelerated by
the hot and humid climate of the region. Postharvest management and processing of
horticultural produce has assumed considerable significance in light of increasing demand
for fruits and vegetables in the region.
12
Doza (2005) in a country paper presented that postharvest losses in food grains in
Bangladesh are reported at an estimated 15%, while in fruits and vegetables they are
estimated at 20%–25%. For highly perishable fruits and vegetables, these losses may go
as high as 40%. Furthermore, Doza (2005) said that the problem of postharvest losses is
compounded by the lack of proper processing, preservation and storage systems. The
absence of a well-developed marketing network and rapid transportation in Bangladesh
also contributes significantly to high postharvest losses in fruits and vegetables.
According to Mao (2005), growth in the Cambodian agricultural sector can be fuelled by:
increased production through higher productivity, containment of losses which could
often be as high as 35%– 40%, sound postharvest support systems, crop diversification
including horticulture and floriculture, and clearing of large areas of landmines and
unexploded ordinances, and increased emphasis on animal husbandry and fisheries.
Ahsan (2005) reported that India is the second largest producer of vegetables in the world,
ranking next to China, and accounts for about 15% of global vegetable production. It is
estimated that between 30% and 35% of India’s total vegetable production is lost owing to
poor postharvest practices. Verma and Joshi (2000) stated that greater emphasis must be
placed on problem oriented research which employs integrated approaches to solving
postharvest issues. Furthermore, they stated that while mechanical harvesting of
horticultural crops increases efficiency, it results in considerable waste.
13
The problems encountered with production agriculture are more easily overcome than
those experienced in the postharvest sector. The production of horticultural crops in
Indonesia showed an increasing trend for the period 2001 through 2003. Fruit production
increased from 9.96 million tons in 2001, to 11.7 million tons in 2002, and reached 13.6
million tons in 2003. Similar trends were observed for vegetables, the production of which
increased from 6.9 million tons in 2001 to 7.1 million tons in 2002, and reached 8.6
million tons in 2003 (Haryanto and Rochani, 2005).
Despite this progressively growing trend in production, constraints to postharvest
handling continue to be encountered. Considerable losses therefore, occur in horticultural
products. Budiastra (1995) reported losses of the order of 30% to 40% while Tridjaya
(2005) reported losses of 10% for fruits and 9.6% for vegetables in Indonesia.
According to Haryanto and Rochani (2005), postharvest handling of fresh fruits and
vegetables has a relatively insignificant impact on farmer income, given the low level of
consumer demand for fruits and vegetables that have been cleaned, sorted and graded.
Farmers are therefore, reluctant to apply proper postharvest handling techniques.
Furthermore, the insignificant price reward for produce quality often results in losses to
the farmer when postharvest handling is done on an individual, rather than on a
collaborative basis. A case study on banana marketing in West Java Province in Indonesia
indicated that farmers were reluctant to adopt quality improvement technologies since
there was no guarantee of improved prices (Setijadi et al., 2003).
14
Similarly, Moghaddasi et. al. (2005) reported that considerable volumes of agricultural
crops produced in developing countries go to waste between their production and
consumption points. Levels of waste vary between 30% and 35%. Approximately 7.6
metric tonnes of the 25 metric tonnes of fruits and vegetables produced in Iran go to waste.
Significantly lower quantities of waste of the order of 7% to 10% are realised in developed
countries. The most significant losses occur in strawberries (35%–40%) while the lowest
level of losses is realised in saffron (2%–3%).
Horticultural produce is highly perishable and is thus highly prone to postharvest losses.
Losses in horticultural produce in Nepal vary between 15% and 35% at different stages
along the chain from harvesting to marketing (Kaini, 2000).
According to the Nepalese Master Plan for Horticulture Development (MPHD, 1991), as
reported by Paudel (2005), conservative estimates of losses on a weight basis were 25%
for vegetables, 20% for fruits and 32% for potatoes including tuber seed. The postharvest
shelf life of horticultural produce is dependent upon the condition of production, season,
variety, the stage of harvesting, the method of harvesting, as well as the packaging,
transportation and marketing system.
Bajracharya (2000), reported that the total loss during the transportation of tomato from
Syangja (mid hills) to Butwal (markets in the plains) was around 23% and Sharma
(2001/2002) reported that the losses sustained during transportation of tomato up to
Kathmandu from Kapurkot, Salyan (western hills) and Lal Bandi, Sarlahi (Terai) were
approximately 35%.
15
Werner et al. (1991) reported physical losses of 22.85% in tomatoes, 15.84% in cabbage
and 12.85% in cauliflower, in addition to the 5% to 10% moisture losses determined by
research conducted by FAO, in Terai, Kalimati market and retail shops in Kathmandu.
A study on losses during the transportation of horticultural produce from Bhairahwa,
Nepal to Gorakhpur, India, conducted by the Marketing Development Division (MDD,
1999/2000), determined a 74% loss in oranges, 26.3% loss in apples, 17.39% loss in
cabbages and 15% loss in potatoes. Losses incurred during the transportation of apples,
mangoes, cauliflower and cabbages from Birgunj, Nepal to Patna, India were also
assessed by the MDD. These were 22.22%, 36.36%, 18.75% and 19.23%, respectively.
Physical losses, which occur during the transportation of tomato, French bean, capsicum
and cauliflower from Kapurkot, Shalyan, Nepal to Sitapur market Lucknow, India, were
10%, 5%, 5% and 5%, respectively (MDD). Similarly physical losses in tomatoes, French
beans, capsicum and cauliflower from Kapurkot, Salyan, Nepal to Azadpur market, New
Delhi, India were 1.33%, 1.25%, 5.88% and 1%, respectively. In the case of transporting
cabbage, radish, cauliflower and orange from Birtamod, Nepal to Silguri, India, these
were 6.7%, 3.48%, 4.48% and 2.06%, respectively. Thapa and Shrestha (2001/02)
reported that losses in mandarin oranges during transportation from Dhankuta to
Kathmandu by bus ranged between 2.7 and 8.2% and thereby recommended the use of
small wooden and bamboo boxes of 18''x12''x12'' for packaging these fruit.
16
The Agra-Business and Trade Promotion Multi-Purpose Co-operative (ABTRACO-2003)
reported a 50% postharvest loss in mandarin oranges during their export to Tibet and
Bangladesh.
Anjum and Awan (2005) in their report stated that Pakistan has a comparative advantage
in the production and export of high value and non-traditional crops as the Government
has adopted an Act namely; Agricultural Produce (Grading and Marking Act), under
which grades and standards of quality of agricultural and livestock commodities are laid
down and enforced for export. Despite this comparative advantage, returns to farmers are
low, due to postharvest losses, which average between 30% and 40%.
Serrano (2005) reported that according to Pantastico (1979), postharvest losses in fruit
crops in the Philippines averaged at 28% in 1979. Approximately 6% of fruit production
was used either as feed or went to waste in 1985 (Statistical Handbook of Agriculture,
MAF-BAECON, 1985).
Losses in bananas ranged from 4% to 60% and were caused by physical damage, green
soft disorder, weight loss, disease, and over ripening. Losses in the ‘Carabao’ variety of
mangoes, ranged from 5% to 87% owing to stem-end rot, mechanical damage and
rejection by mango exporters. Variability in national data on losses in these crops
stemmed from the use of several loss assessment methods each with different objectives,
as well as the manner in which data on losses was presented (Lizada, 1990).
17
According to Rapusas (2005), loss studies conducted in Philippines by the Postharvest
Horticulture Training and Research Centre (PHTRC) on the tomato cultivar ‘Improved
Pope’, shipped from Claveria in Mindanao to Los Baños, Laguna in Luzon, losses ranged
from 4% to 8%. This transport loss was based on the proportion of rotten fruits as well as
diseased and severely damaged fruits. Weight (moisture) losses after ripening of sound
fruits, slightly damaged fruits and fruits with severe abrasions were found to be 7.9%,
18.0% and 58.6%. Mangaoang (1982) reported a postharvest loss of 11.9% and a
post-storage loss of 12.1% amounting to a total postharvest loss of 24%.
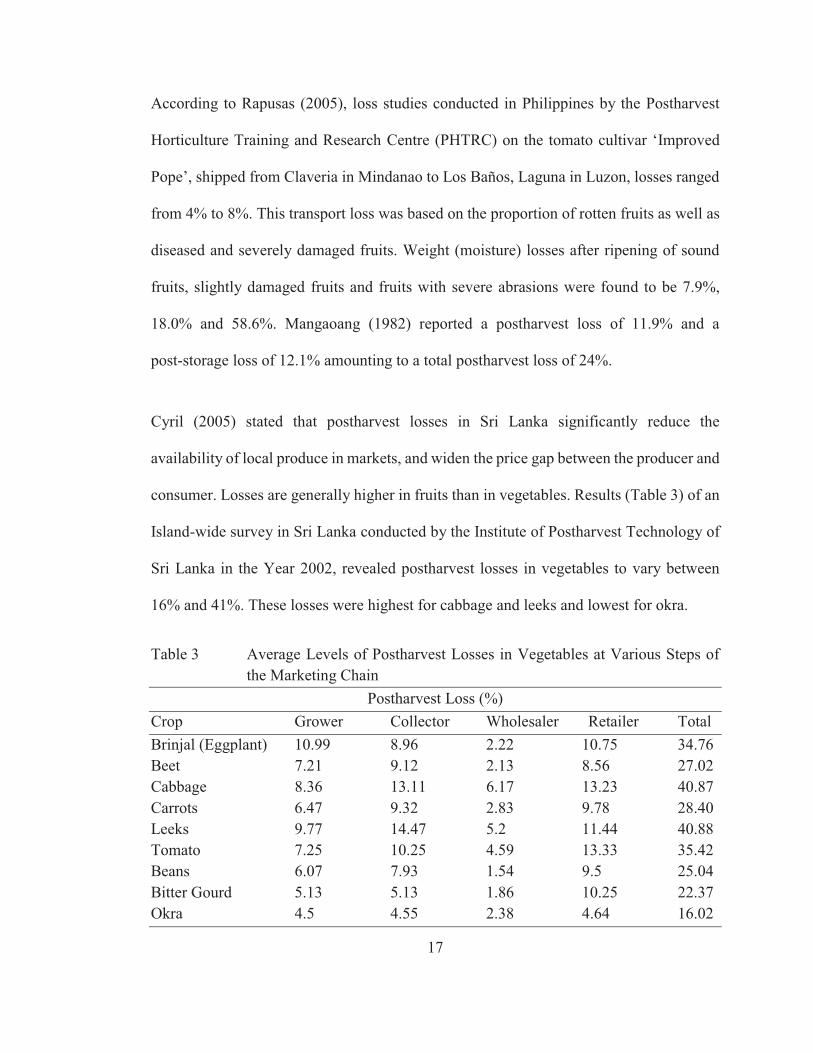
Cyril (2005) stated that postharvest losses in Sri Lanka significantly reduce the
availability of local produce in markets, and widen the price gap between the producer and
consumer. Losses are generally higher in fruits than in vegetables. Results (Table 3) of an
Island-wide survey in Sri Lanka conducted by the Institute of Postharvest Technology of
Sri Lanka in the Year 2002, revealed postharvest losses in vegetables to vary between
16% and 41%. These losses were highest for cabbage and leeks and lowest for okra.
Table 3 Average Levels of Postharvest Losses in Vegetables at Various Steps of
the Marketing Chain Postharvest Loss (%)
Crop Grower Collector Wholesaler Retailer Total Brinjal (Eggplant) 10.99 8.96 2.22 10.75 34.76 Beet 7.21 9.12 2.13 8.56 27.02 Cabbage 8.36 13.11 6.17 13.23 40.87 Carrots 6.47 9.32 2.83 9.78 28.40 Leeks 9.77 14.47 5.2 11.44 40.88 Tomato 7.25 10.25 4.59 13.33 35.42 Beans 6.07 7.93 1.54 9.5 25.04 Bitter Gourd 5.13 5.13 1.86 10.25 22.37 Okra 4.5 4.55 2.38 4.64 16.02
18
2.4 Causes Of Postharvest Losses
2.4.1 Mechanical injury
Mechanical damage during harvesting and associated handling operations can result in
defects on the produce (Wills et al., 1998). According to Choudhury (2004), fresh fruits
and vegetables are extremely vulnerable to mechanical injury due to their tender texture
and high water content. Improper handling, inappropriate packaging and poor packing
during transit are the cause of bruising, cutting, breaking, impact wounding, and other
forms of damage in fresh fruits and vegetables.
2.4.2 Postharvest pathogens
The incursion of fruits and vegetables by fungi, bacteria, insects and other organisms, is a
major cause of postharvest losses in fruits and vegetables. Microorganisms readily attack
fresh produce and spread rapidly, owing to the lack of natural protection mechanisms in
the tissues of fresh produce, and the large quantity of nutrients and moisture which
supports their growth. Managing postharvest rot is ever more becoming a complicated
task, since the number of pesticides available is rapidly declining as end user concern for
food safety is greater than ever (Choudhury, 2004).
2.4.3 Physiological deterioration
Vegetable tissues still respire after harvest, and continue their physiological activity. It
occurs due to lack of minerals or unattractive ecological conditions such as low or high
temperature injury and humidity. Physiological deterioration can also occur unexpectedly
owing to enzymatic activity, leading to over ripeness and senescence (Choudhury, 2004).
19
2.5 Postharvest Loss and Quality Indicators
Postharvest loss is defined as a “measurable quantitative and qualitative loss of a given
product at any point along the postharvest chain” (De Lucia & Assennato, 1994); and
includes the change in the availability, edibility and wholesomeness of the food that
prevents it from being consumed (FAO, 1989). Postharvest losses are highest with
horticultural produce whose postharvest quality is much dependent on climatic
conditions.
Quality is defined as “the composite of product characteristics that offers value to the
buyer or consumer” (De Lucia & Assennato, 1994) or more loosely as “the degree of
excellence of a product or its suitability for a particular use” (Abott, 1999). There are
several quality attributes of fresh produce that changes after harvesting. Therefore, it is
fundamental to establish good management practices in the agricultural industry,
especially during distribution and marketing chains.
Like fruits, vegetables are perishable crops. These crops deteriorate very rapidly after
harvest owing to a number of factors. Quantitative losses, which are readily measurable,
occur as a result of reduced weight due to product decay and senescence. Qualitative
losses occur due to deterioration in texture, flavour and nutritional value (Liu, 1999).
These forms of losses can be translated into monetary loss due to reduced prices.
2.6 Significance of Postharvest Loss to Natural Resource Management
High postharvest losses mean that vegetable farmers have to expand the land area under
cultivation or to continuously crop the same land from season to season to compensate for
20
the anticipated losses. This practice of continued expansion of farm land is exerting more
pressure on the fragile natural resource base. For example, FAO (2006) reported that there
is widespread nutrient depletion of soils arising from continuous cropping. The
over-exploitation of forest resources for food production is a major cause of deforestation
and loss of biodiversity throughout the world and postharvest losses have been found to
contribute significantly to deforestation.
2.7 Climatic Factors Affecting Postharvest Quality of Vegetables
The principal weapon in the postharvest armoury relates to control of the storage
environment and handling practices. Temperature, the most significant environmental
factor, is very crucial in the postharvest chain. Rates of postharvest deterioration are
affected by increase in temperature owing to the elevated rate of postharvest physiological
processes occurring in crop produce after harvest.
Castro et al., (2005) reported that vegetables can be stored for a relatively longer period
provided conditions are favourable, notably a temperature and relative humidity of
10-15oC and 85-95%, respectively. Studies by Getinet et al. (2008) also proved that
maintaining relatively lower temperature and higher relative humidity during storage
using evaporative cooling systems could maintain the quality of vegetables.
Moreover, Yeshida et al. (1984) indicated that high temperature increases enzymatic
catalysis and leads to biochemical breakdown of compounds in fruits and vegetables.
Paull (1999) also stated that temperature and relative humidity are two major criteria used
21
to define critical limits in monitoring programs associated with the hazard analysis and
critical control point (HACCP) system.
2.8 Firmness and Decay of Vegetables
According to Van Dijk and Tijskens (2000), the texture and firmness of fruits and
vegetables depend on the presence and interactions of different chemical components,
such as pectin’s in the middle lamellae and cellulose/hemi-cellulose matrix in the primary
cell wall, as well as on physical aspects like archestructure and turgor. During transit and
storage some of these chemical components or physical aspects are affected, whilst others
are not. Therefore, it is assumed that the firmness of vegetables consists of two parts, a
variable part and a fixed part. Components adding to the fixed part of the firmness include
the (chemically inert) cellulose/hemi-cellulose matrix. Turgor and part of pectin that is
susceptible to enzymatic degradation constitute the variable part of the firmness.
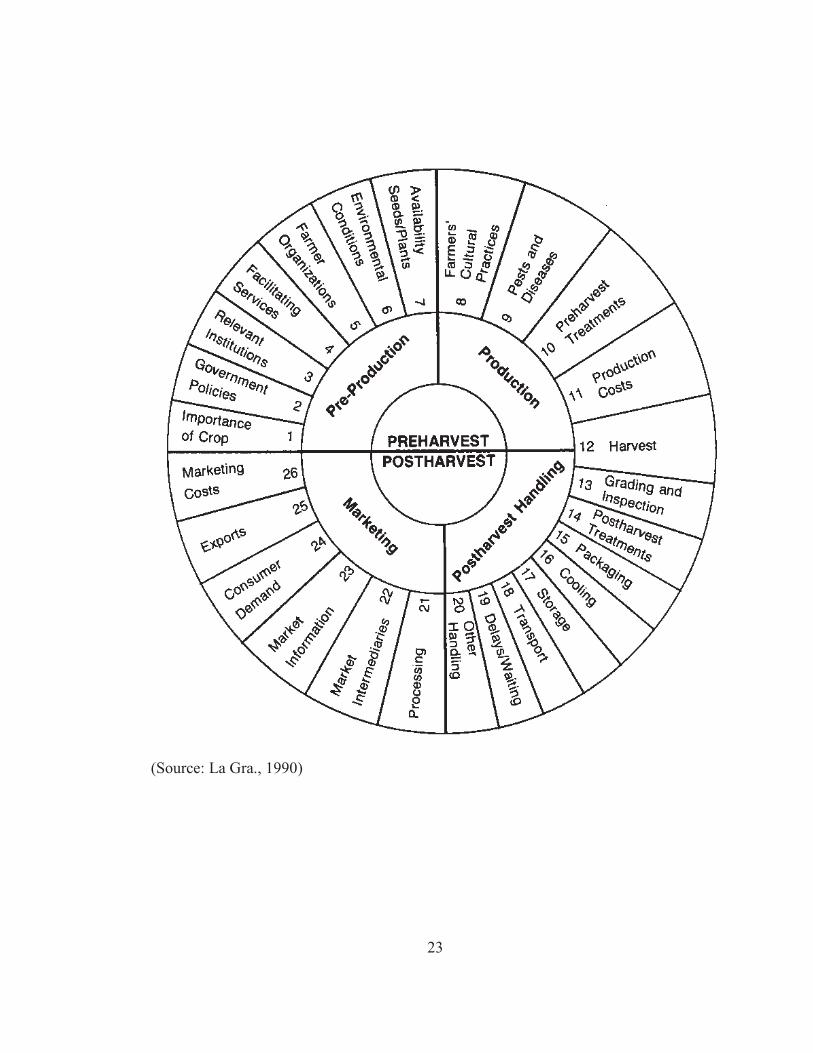
2.9 Commodity System Analysis Methodology
There are 26 components in the Commodity System Analysis Methodology and each
component is potentially important but not always relevant for all commodities. This
methodology permits analysis of a whole commodity system and requires a
multidisciplinary team (La Gra, 1990).
Components 1-7 (Pre-Production) put the commodity into perspective within the
horticultural market, and gain some understanding of how much competition one may
22
face, whether there are any political, economic or environmental constraints or incentives,
and if there is any technical or marketing assistance available.
Components 8 – 11 (Production) deals with many of the choices made during production
that will later affect postharvest quality, food safety, produce losses and economic value.
The first step in identifying possible improvements is to determine whether any of these
production components are contributing to postharvest problems. As you collect
information on each component, compare current practices to known recommendations
for producing the commodity.
Components 12-21 (Postharvest)-Postharvest handling practices will have an enormous
impact on produce quality, losses and safety. Postharvest handling maintains the quality
of produce, but cannot improve it. Understanding each step of the postharvest chain will
enable you to determine whether any current practices are causing problems. Sometimes it
is possible to measure losses at each step and determine whether making a simple change
can have a major impact.
Component 22-26 (Marketing) is not simply the last step of handling fresh produce, but
must be part of the overall plan to provide produce that best meets the needs of the
consumer. Consumer preferences play a large role in determining the economic value of
the produce.
23
(Source: La Gra., 1990)
24
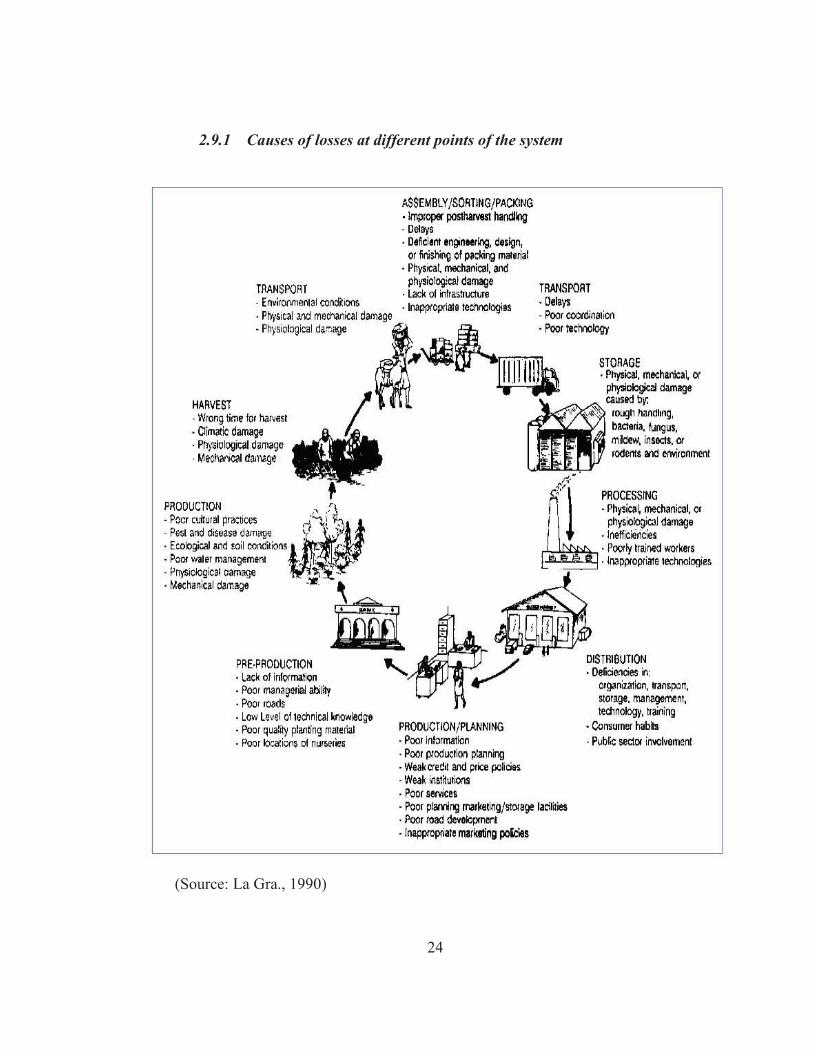
2.9.1 Causes of losses at different points of the system
(Source: La Gra., 1990)
25
CHAPTER 3
METHODOLOGY
3.1 Scope
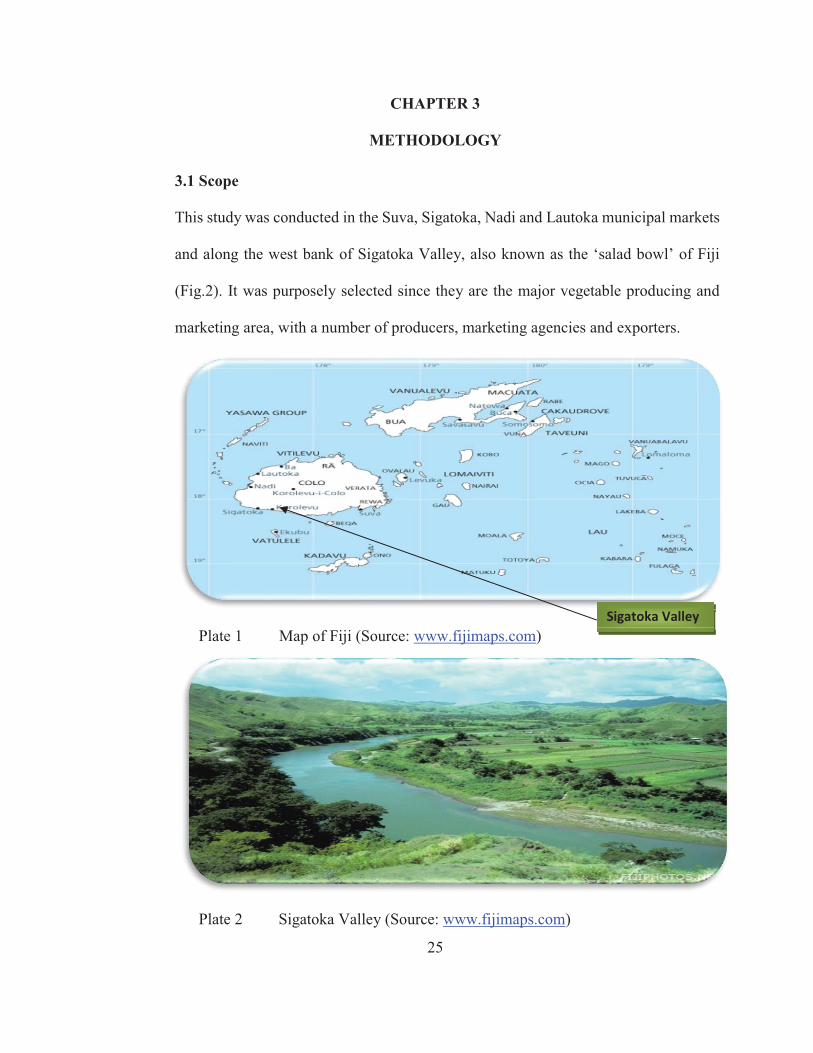
This study was conducted in the Suva, Sigatoka, Nadi and Lautoka municipal markets
and along the west bank of Sigatoka Valley, also known as the ‘salad bowl’ of Fiji
(Fig.2). It was purposely selected since they are the major vegetable producing and
marketing area, with a number of producers, marketing agencies and exporters.
Plate 1 Map of Fiji (Source: www.fijimaps.com)
Plate 2 Sigatoka Valley (Source: www.fijimaps.com)
Sigatoka Valley
26
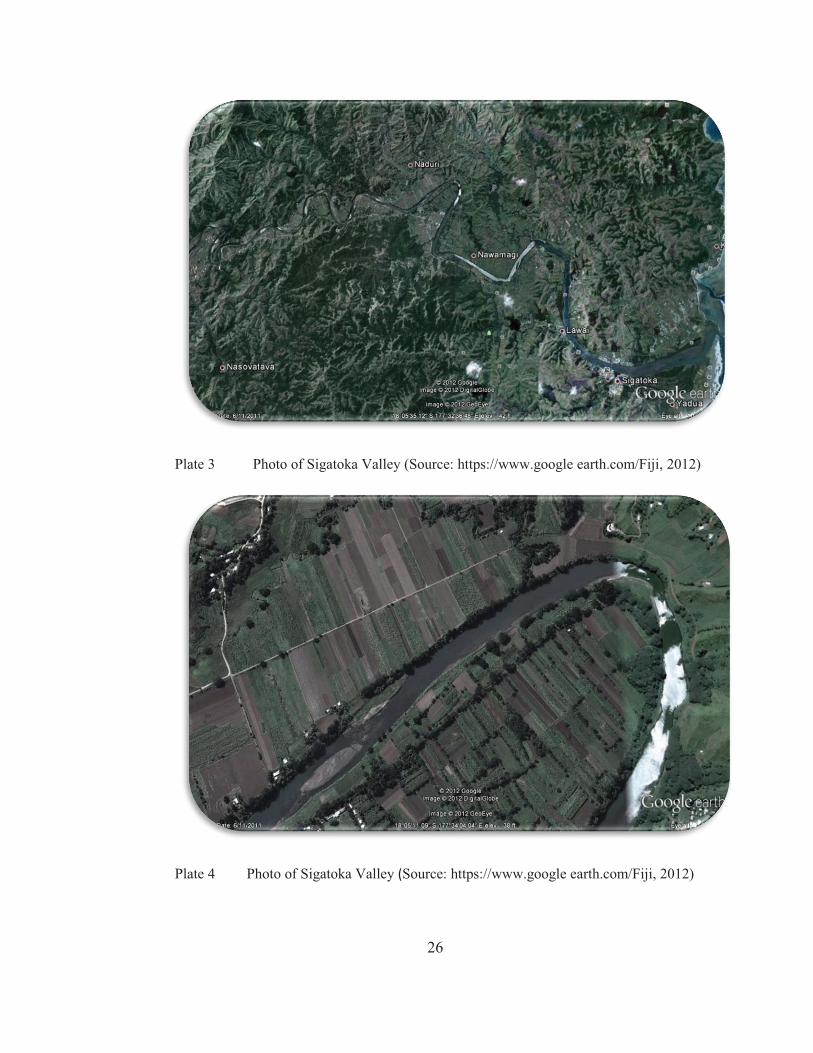
Plate 3 Photo of Sigatoka Valley (Source: https://www.google earth.com/Fiji, 2012)
Plate 4 Photo of Sigatoka Valley (Source: https://www.google earth.com/Fiji, 2012)
27
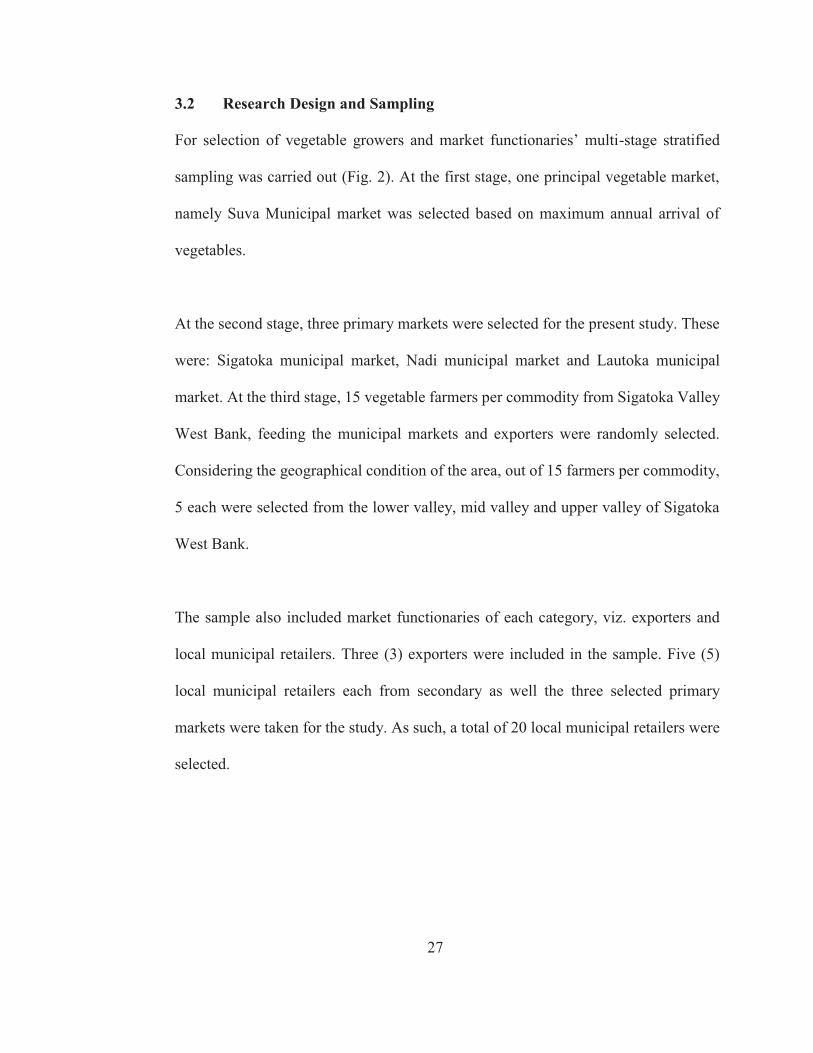
3.2 Research Design and Sampling
For selection of vegetable growers and market functionaries’ multi-stage stratified
sampling was carried out (Fig. 2). At the first stage, one principal vegetable market,
namely Suva Municipal market was selected based on maximum annual arrival of
vegetables.
At the second stage, three primary markets were selected for the present study. These
were: Sigatoka municipal market, Nadi municipal market and Lautoka municipal
market. At the third stage, 15 vegetable farmers per commodity from Sigatoka Valley
West Bank, feeding the municipal markets and exporters were randomly selected.
Considering the geographical condition of the area, out of 15 farmers per commodity,
5 each were selected from the lower valley, mid valley and upper valley of Sigatoka
West Bank.
The sample also included market functionaries of each category, viz. exporters and
local municipal retailers. Three (3) exporters were included in the sample. Five (5)
local municipal retailers each from secondary as well the three selected primary
markets were taken for the study. As such, a total of 20 local municipal retailers were
selected.
28
Figure 2 Multi-Stratified Sampling
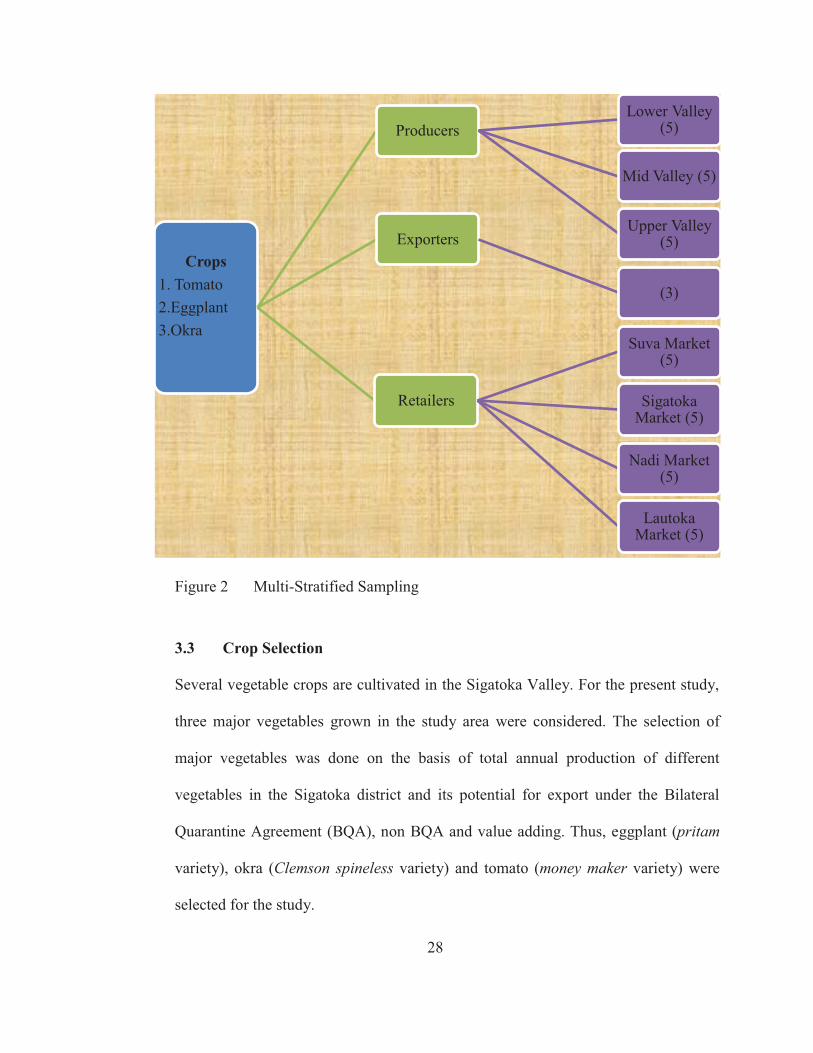
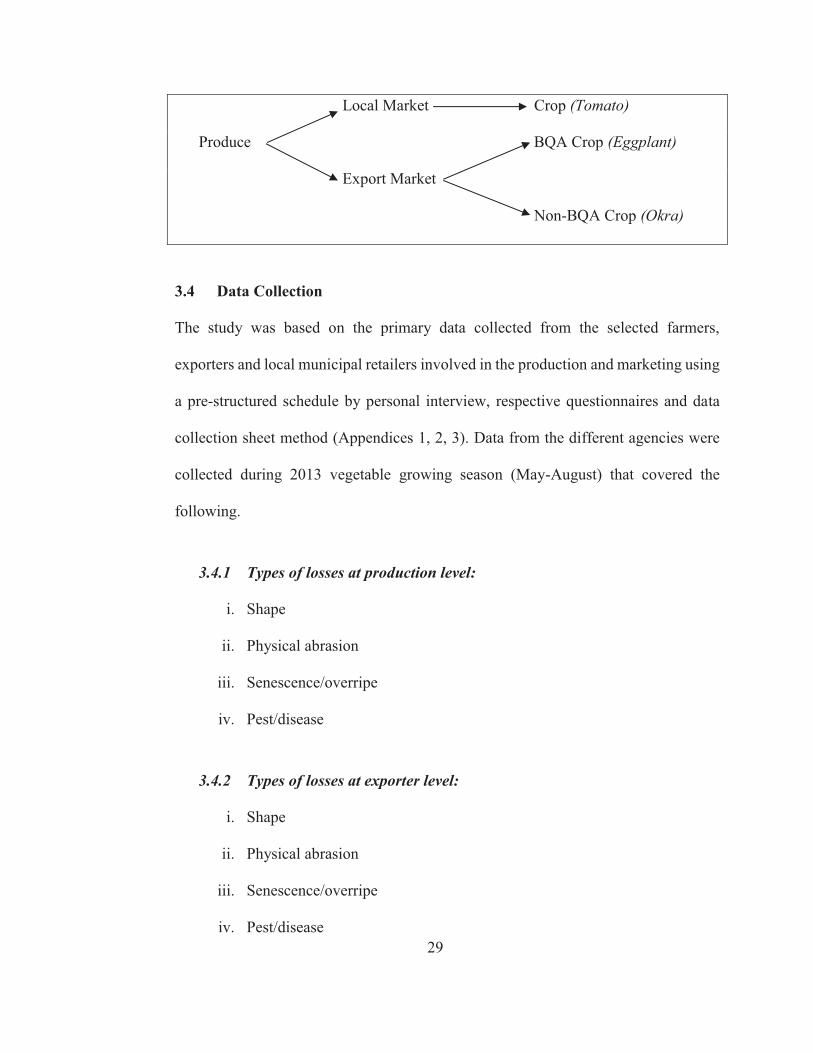
3.3 Crop Selection
Several vegetable crops are cultivated in the Sigatoka Valley. For the present study,
three major vegetables grown in the study area were considered. The selection of
major vegetables was done on the basis of total annual production of different
vegetables in the Sigatoka district and its potential for export under the Bilateral
Quarantine Agreement (BQA), non BQA and value adding. Thus, eggplant (pritam
variety), okra (Clemson spineless variety) and tomato (money maker variety) were
selected for the study.
Crops
1. Tomato 2.Eggplant 3.Okra
Producers Lower Valley
(5)
Mid Valley (5)
Upper Valley (5) Exporters
(3)
Retailers
Suva Market (5)
Sigatoka Market (5)
Nadi Market (5)
Lautoka Market (5)
29
Local Market Crop (Tomato)
Produce BQA Crop (Eggplant)
Export Market
Non-BQA Crop (Okra)
3.4 Data Collection
The study was based on the primary data collected from the selected farmers,
exporters and local municipal retailers involved in the production and marketing using
a pre-structured schedule by personal interview, respective questionnaires and data
collection sheet method (Appendices 1, 2, 3). Data from the different agencies were
collected during 2013 vegetable growing season (May-August) that covered the
following.
3.4.1 Types of losses at production level:
i. Shape
ii. Physical abrasion
iii. Senescence/overripe
iv. Pest/disease
3.4.2 Types of losses at exporter level:
i. Shape
ii. Physical abrasion
iii. Senescence/overripe
iv. Pest/disease

30
3.4.3 Types of losses at retailer level:
i. Shape
ii. Physical abrasion
iii. Senescence/overripe
iv. Pest/disease
3.4.4 General Data:
i. End use of rejected crops at each level i.e. home use, animal feed and
waste/throw away.
ii. Rejects from high temperature forced air (HTFA) at exporter level was
also recorded.
3.5 Quantitative Loss Assessment
The flow network of vegetables from farmers’ field to the consumers was studied to
identify the types of losses. The extent of loss was calculated using the equation given
below:
Loss in crops, % =
Where, Wdv = Weight of rejected and damaged vegetables sorted out
Wtv = Total weight of vegetables before sorting at any level
31
3.5.1 Percentage of rejected crops at different levels
The total weight (yield) of vegetables was recorded at production (farm gate),
local municipal retailer and exporter level. The vegetables were then sorted out
and weight of rejected vegetables was taken. From these weights, the percentage
loss was calculated using the above equation.
3.5.2 Types of rejected crops at different levels
The rejected vegetables were then sorted out into four categories i.e. shape,
physical abrasion, senescence/overripe and pest/disease and individual group
weights were recorded again. From these weights, the percentage losses for the
four categories were calculated using the above equation.
3.5.3 End use of rejected crops at different levels
The farmers, local municipal retailers and exporters were asked to quantify the end
use of rejected vegetables into home use, animal feed and waste. From these
weights, the percentage end use for the three categories was calculated using the
above equation.
The data from end use of rejected crops was further classified into two categories:
i. Non-trade loss – whereby the rejected vegetables had monetary value
attached to it in terms of domestic use and animal feed.
ii. Absolute loss – whereby no monetary gain can be realised from the rejected
vegetables i.e. waste.
32
3.5.4 Observed tomatoes
The postharvest loss of 500 tomatoes from each of the three production strata was also
observed after harvest at every four day intervals for 12 days to ascertain the actual
postharvest losses and further categorised into various types (causes).
3.6 Statistical Analysis
In the study, postharvest losses in vegetables were calculated at different stages. The
losses were calculated to find out at which level maximum loss was incurred.
Descriptive statistical tools like means and percentages were used to present the data
from the study. The data collected was subjected to analysis of variance to determine
any significant losses occurring between the three productions strata, during handling
between the three exporting facilities, between the three local municipal retail outlets
as well as between the four types (causes) of postharvest losses. The Discover Version
of the GENSTAT Statistical Software package was used.
33
CHAPTER 4
RESULTS AND DISCUSSIONS
This chapter is divided into five sections. Section 4.1, 4.2 and 4.3 discusses the
postharvest losses (PHL) and the end use of the rejected eggplant, okra and tomato
vegetable respectively. The perceived losses of these vegetables were ascertained first at
production level, then at local municipal retailer level and also at exporter level. The types
of loss at each level were also ascertained, viz. shape, physical abrasion,
senescence/over-mature and pest/disease along the postharvest chain. The total
postharvest loss has been further categorised into non-trade loss (monetary gains partially
realised) and absolute loss (wastage). The observed results of tomatoes from the three
production strata (lower valley, mid valley and upper valley) have been presented in
section 4.4. Section 4.5 elaborates the different operations practiced in selected vegetables
along the postharvest chain.
4.1 Eggplant
The postharvest losses and end use of rejected eggplants at different levels along the
postharvest chain are presented in sub-sections 4.1.1 and 4.1.2 respectively and at
aggregate level these are presented in sub-section 4.1.3. The total postharvest loss of
eggplant is further categorised into non-trade loss and absolute loss in sub-section 4.1.4.
4.1.1 Postharvest losses in eggplants at different levels
4.1.1.1 Postharvest losses in eggplants at production strata level
Five (5) farmers each from the lower, mid and upper valley were selected. A total of
1200kg, 1000kg and 680kg of eggplants from the respective strata were sampled. Table 4
34
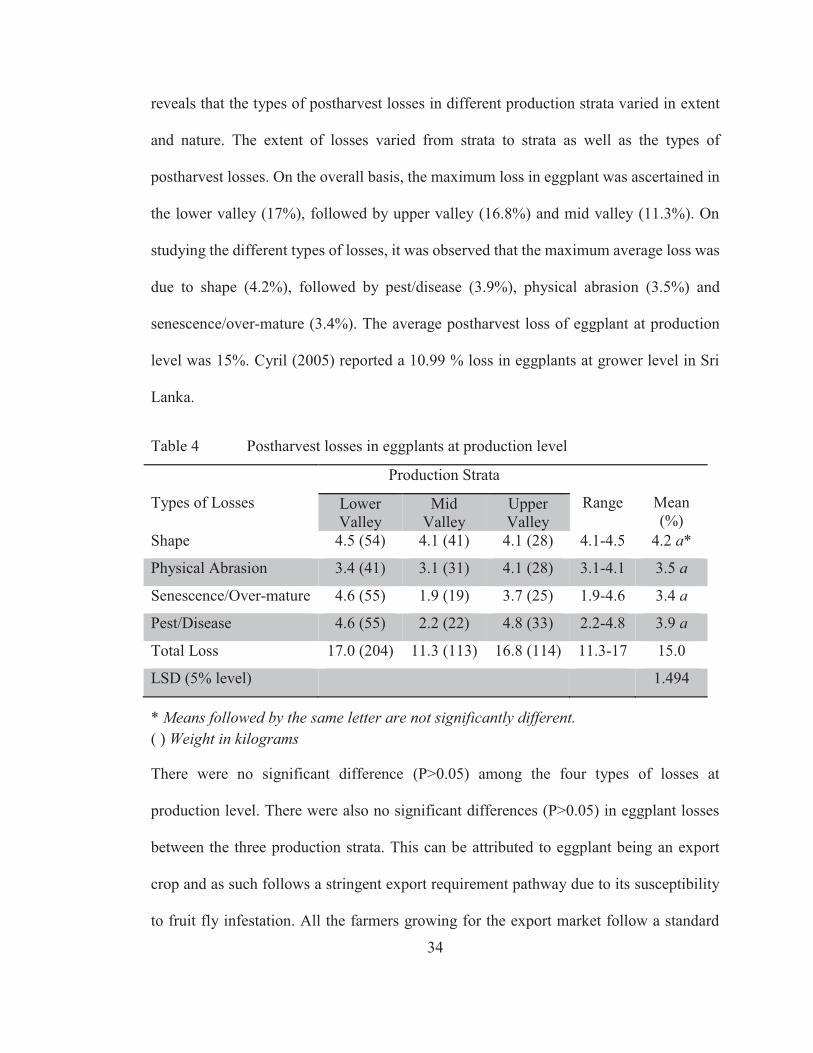
reveals that the types of postharvest losses in different production strata varied in extent
and nature. The extent of losses varied from strata to strata as well as the types of
postharvest losses. On the overall basis, the maximum loss in eggplant was ascertained in
the lower valley (17%), followed by upper valley (16.8%) and mid valley (11.3%). On
studying the different types of losses, it was observed that the maximum average loss was
due to shape (4.2%), followed by pest/disease (3.9%), physical abrasion (3.5%) and
senescence/over-mature (3.4%). The average postharvest loss of eggplant at production
level was 15%. Cyril (2005) reported a 10.99 % loss in eggplants at grower level in Sri
Lanka.
Table 4 Postharvest losses in eggplants at production level
Types of Losses
Production Strata
Range
Mean (%)
Lower Valley
Mid Valley
Upper Valley
Shape 4.5 (54) 4.1 (41) 4.1 (28) 4.1-4.5 4.2 a*
Physical Abrasion 3.4 (41) 3.1 (31) 4.1 (28) 3.1-4.1 3.5 a
Senescence/Over-mature 4.6 (55) 1.9 (19) 3.7 (25) 1.9-4.6 3.4 a
Pest/Disease 4.6 (55) 2.2 (22) 4.8 (33) 2.2-4.8 3.9 a
Total Loss 17.0 (204) 11.3 (113) 16.8 (114) 11.3-17 15.0
LSD (5% level) 1.494
* Means followed by the same letter are not significantly different. ( ) Weight in kilograms
There were no significant difference (P>0.05) among the four types of losses at
production level. There were also no significant differences (P>0.05) in eggplant losses
between the three production strata. This can be attributed to eggplant being an export
crop and as such follows a stringent export requirement pathway due to its susceptibility
to fruit fly infestation. All the farmers growing for the export market follow a standard
35
protocol of management practices as approved under the bilateral quarantine agreement
(Annex 4); therefore the types of losses are uniform among them.
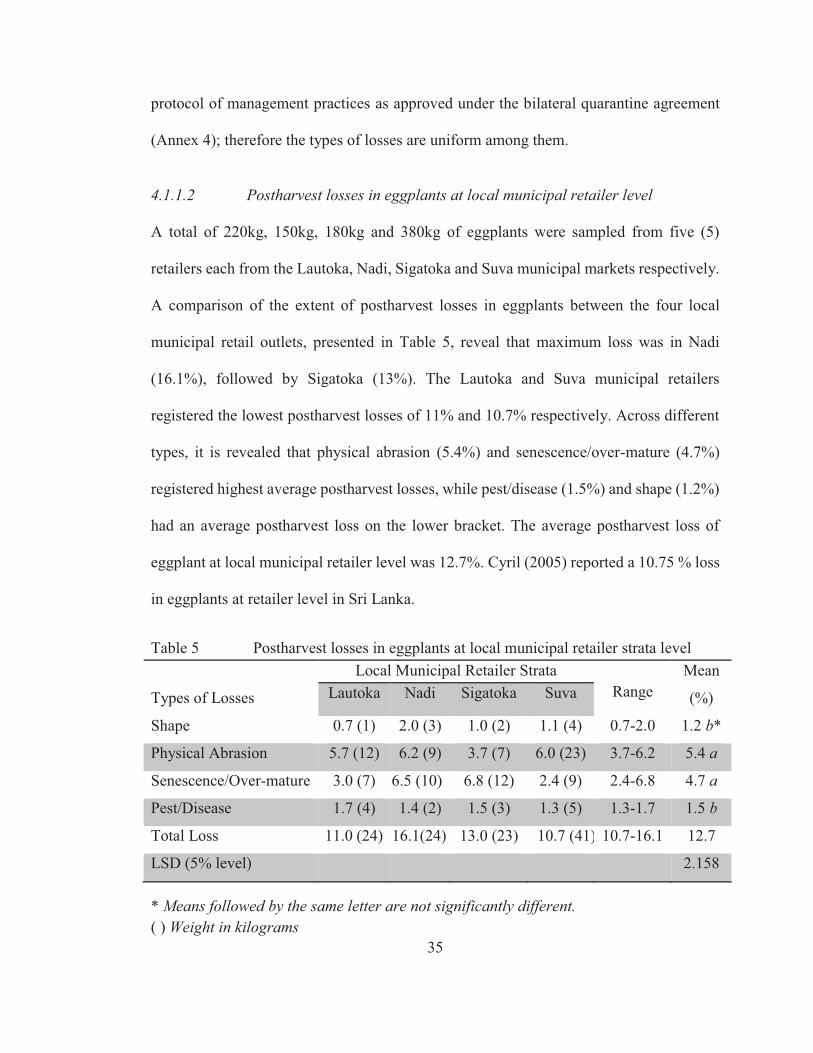
4.1.1.2 Postharvest losses in eggplants at local municipal retailer level
A total of 220kg, 150kg, 180kg and 380kg of eggplants were sampled from five (5)
retailers each from the Lautoka, Nadi, Sigatoka and Suva municipal markets respectively.
A comparison of the extent of postharvest losses in eggplants between the four local
municipal retail outlets, presented in Table 5, reveal that maximum loss was in Nadi
(16.1%), followed by Sigatoka (13%). The Lautoka and Suva municipal retailers
registered the lowest postharvest losses of 11% and 10.7% respectively. Across different
types, it is revealed that physical abrasion (5.4%) and senescence/over-mature (4.7%)
registered highest average postharvest losses, while pest/disease (1.5%) and shape (1.2%)
had an average postharvest loss on the lower bracket. The average postharvest loss of
eggplant at local municipal retailer level was 12.7%. Cyril (2005) reported a 10.75 % loss
in eggplants at retailer level in Sri Lanka.
Table 5 Postharvest losses in eggplants at local municipal retailer strata level
Types of Losses
Local Municipal Retailer Strata Range
Mean
(%) Lautoka Nadi Sigatoka Suva
Shape 0.7 (1) 2.0 (3) 1.0 (2) 1.1 (4) 0.7-2.0 1.2 b*
Physical Abrasion 5.7 (12) 6.2 (9) 3.7 (7) 6.0 (23) 3.7-6.2 5.4 a
Senescence/Over-mature 3.0 (7) 6.5 (10) 6.8 (12) 2.4 (9) 2.4-6.8 4.7 a
Pest/Disease 1.7 (4) 1.4 (2) 1.5 (3) 1.3 (5) 1.3-1.7 1.5 b
Total Loss 11.0 (24) 16.1(24) 13.0 (23) 10.7 (41) 10.7-16.1 12.7
LSD (5% level) 2.158
* Means followed by the same letter are not significantly different. ( ) Weight in kilograms
36
There were no significant difference (P>0.05) in the percentage losses of eggplant
between the four local municipal retail outlet. This can be partially explained by the
identical prevailing trading and storage conditions at the four outlets.
Significant differences (P<0.05) were found to exist between the types of postharvest
losses at local municipal retailer levels. Higher losses resulted from physical abrasion and
over-maturity compared to losses due to shape and pest and diseases. Increased physical
abrasion results from the crop undergoing additional handling during sorting and grading
as the premium crop from the harvest goes for the export market, where it fetches higher
prices and the rejects from the export grade enters the local municipal market.
Over-maturity results from physiological deterioration and enzymatic activity as the crop
still respires after harvest (Choudhary, 2004). Lower rejects were due to shape rejection
and pest and disease as optimum cultural practices were followed as per export
requirements. In addition, rejection of the crop due to these causes from the export market
may partially be acceptable at local outlets.
4.1.1.3 Postharvest losses in eggplants at exporter strata level
A total of 1500kg of eggplants were sampled from Exporter I, 5000kg from Exporter II
and 187kg from Exporter III. The postharvest losses at exporter level were also worked
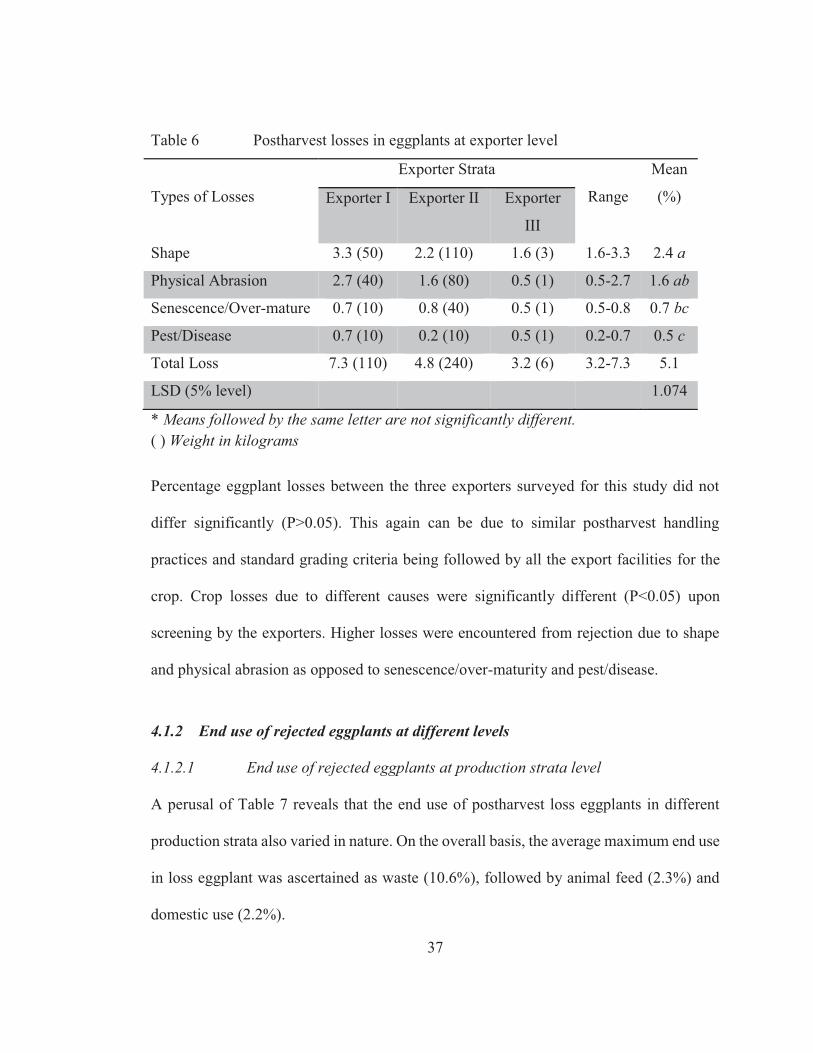
out and are presented in Table 6. It was found that types of maximum average loss was
registered by shape (2.4%), followed by physical abrasion (1.6%),
senescence/over-mature (0.7%) and pest/disease (0.5%). The average loss at exporter
level was registered as 5.1%.
37
Table 6 Postharvest losses in eggplants at exporter level
Types of Losses
Exporter Strata
Range
Mean
(%) Exporter I Exporter II Exporter
III
Shape 3.3 (50) 2.2 (110) 1.6 (3) 1.6-3.3 2.4 a
Physical Abrasion 2.7 (40) 1.6 (80) 0.5 (1) 0.5-2.7 1.6 ab
Senescence/Over-mature 0.7 (10) 0.8 (40) 0.5 (1) 0.5-0.8 0.7 bc
Pest/Disease 0.7 (10) 0.2 (10) 0.5 (1) 0.2-0.7 0.5 c
Total Loss 7.3 (110) 4.8 (240) 3.2 (6) 3.2-7.3 5.1
LSD (5% level) 1.074
* Means followed by the same letter are not significantly different. ( ) Weight in kilograms
Percentage eggplant losses between the three exporters surveyed for this study did not
differ significantly (P>0.05). This again can be due to similar postharvest handling
practices and standard grading criteria being followed by all the export facilities for the
crop. Crop losses due to different causes were significantly different (P<0.05) upon
screening by the exporters. Higher losses were encountered from rejection due to shape
and physical abrasion as opposed to senescence/over-maturity and pest/disease.
4.1.2 End use of rejected eggplants at different levels
4.1.2.1 End use of rejected eggplants at production strata level
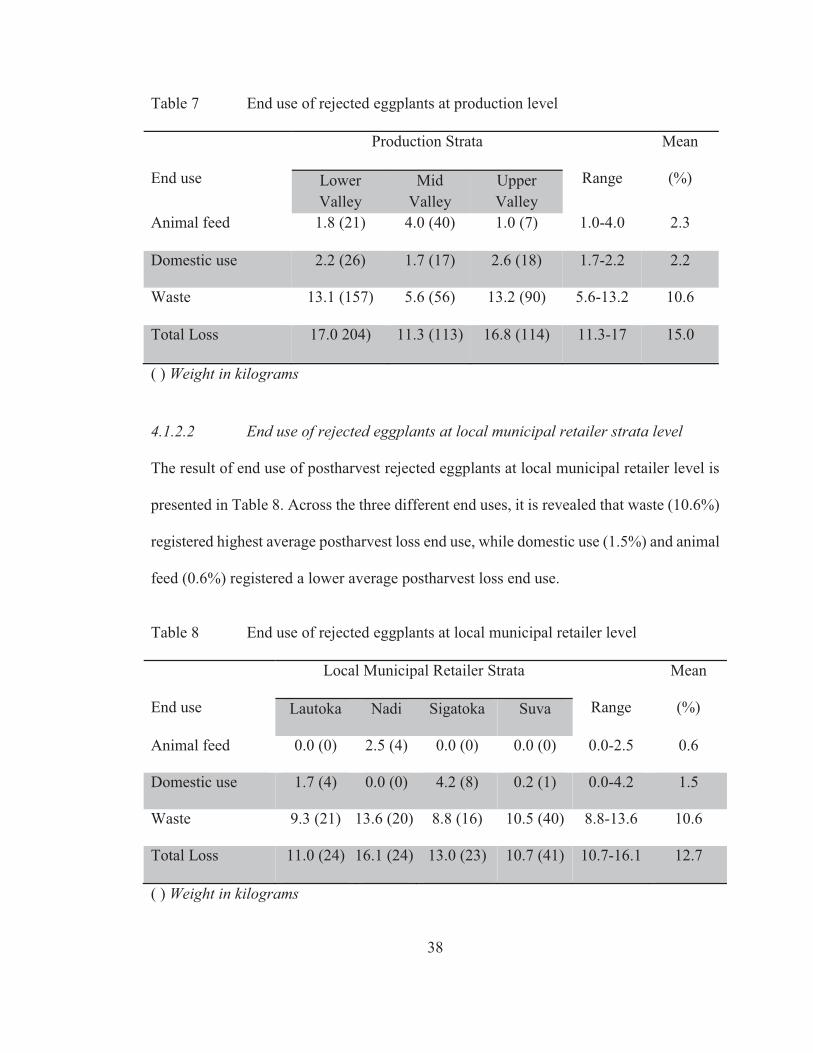
A perusal of Table 7 reveals that the end use of postharvest loss eggplants in different
production strata also varied in nature. On the overall basis, the average maximum end use
in loss eggplant was ascertained as waste (10.6%), followed by animal feed (2.3%) and
domestic use (2.2%).
38
Table 7 End use of rejected eggplants at production level
End use
Production Strata
Range
Mean
(%) Lower Valley
Mid Valley
Upper Valley
Animal feed 1.8 (21) 4.0 (40) 1.0 (7) 1.0-4.0 2.3
Domestic use 2.2 (26) 1.7 (17) 2.6 (18) 1.7-2.2 2.2
Waste 13.1 (157) 5.6 (56) 13.2 (90) 5.6-13.2 10.6
Total Loss 17.0 204) 11.3 (113) 16.8 (114) 11.3-17 15.0
( ) Weight in kilograms
4.1.2.2 End use of rejected eggplants at local municipal retailer strata level
The result of end use of postharvest rejected eggplants at local municipal retailer level is
presented in Table 8. Across the three different end uses, it is revealed that waste (10.6%)
registered highest average postharvest loss end use, while domestic use (1.5%) and animal
feed (0.6%) registered a lower average postharvest loss end use.
Table 8 End use of rejected eggplants at local municipal retailer level
End use
Local Municipal Retailer Strata
Range
Mean
(%) Lautoka Nadi Sigatoka Suva
Animal feed 0.0 (0) 2.5 (4) 0.0 (0) 0.0 (0) 0.0-2.5 0.6
Domestic use 1.7 (4) 0.0 (0) 4.2 (8) 0.2 (1) 0.0-4.2 1.5
Waste 9.3 (21) 13.6 (20) 8.8 (16) 10.5 (40) 8.8-13.6 10.6
Total Loss 11.0 (24) 16.1 (24) 13.0 (23) 10.7 (41) 10.7-16.1 12.7
( ) Weight in kilograms
39
4.1.2.3 End use of rejected eggplants at exporter strata level
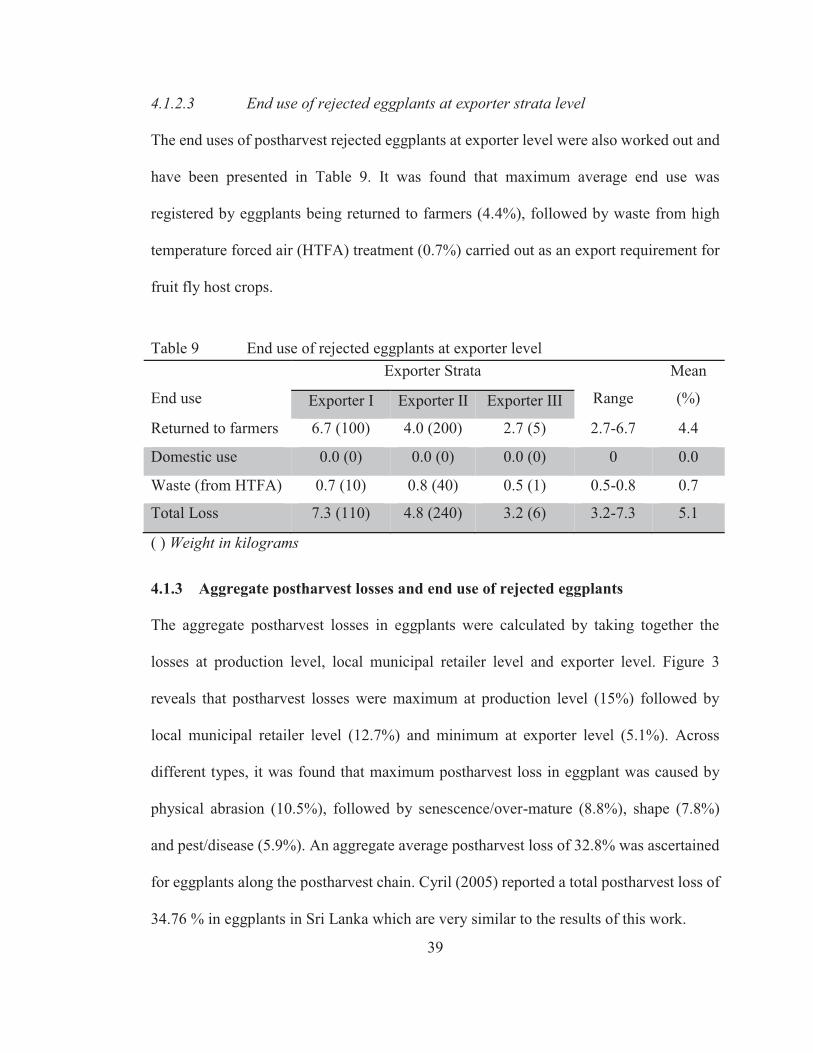
The end uses of postharvest rejected eggplants at exporter level were also worked out and
have been presented in Table 9. It was found that maximum average end use was
registered by eggplants being returned to farmers (4.4%), followed by waste from high
temperature forced air (HTFA) treatment (0.7%) carried out as an export requirement for
fruit fly host crops.
Table 9 End use of rejected eggplants at exporter level
End use
Exporter Strata
Range
Mean
(%) Exporter I Exporter II Exporter III
Returned to farmers 6.7 (100) 4.0 (200) 2.7 (5) 2.7-6.7 4.4
Domestic use 0.0 (0) 0.0 (0) 0.0 (0) 0 0.0
Waste (from HTFA) 0.7 (10) 0.8 (40) 0.5 (1) 0.5-0.8 0.7
Total Loss 7.3 (110) 4.8 (240) 3.2 (6) 3.2-7.3 5.1
( ) Weight in kilograms
4.1.3 Aggregate postharvest losses and end use of rejected eggplants
The aggregate postharvest losses in eggplants were calculated by taking together the
losses at production level, local municipal retailer level and exporter level. Figure 3
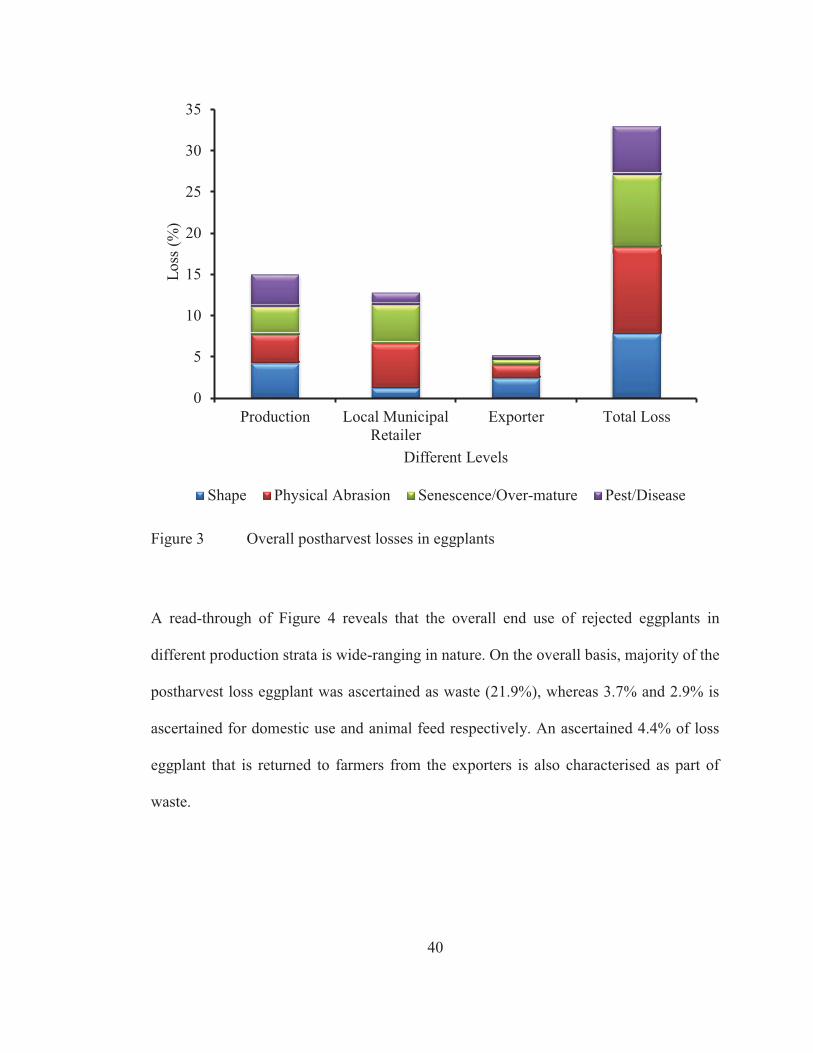
reveals that postharvest losses were maximum at production level (15%) followed by
local municipal retailer level (12.7%) and minimum at exporter level (5.1%). Across
different types, it was found that maximum postharvest loss in eggplant was caused by
physical abrasion (10.5%), followed by senescence/over-mature (8.8%), shape (7.8%)
and pest/disease (5.9%). An aggregate average postharvest loss of 32.8% was ascertained
for eggplants along the postharvest chain. Cyril (2005) reported a total postharvest loss of
34.76 % in eggplants in Sri Lanka which are very similar to the results of this work.
40
Figure 3 Overall postharvest losses in eggplants
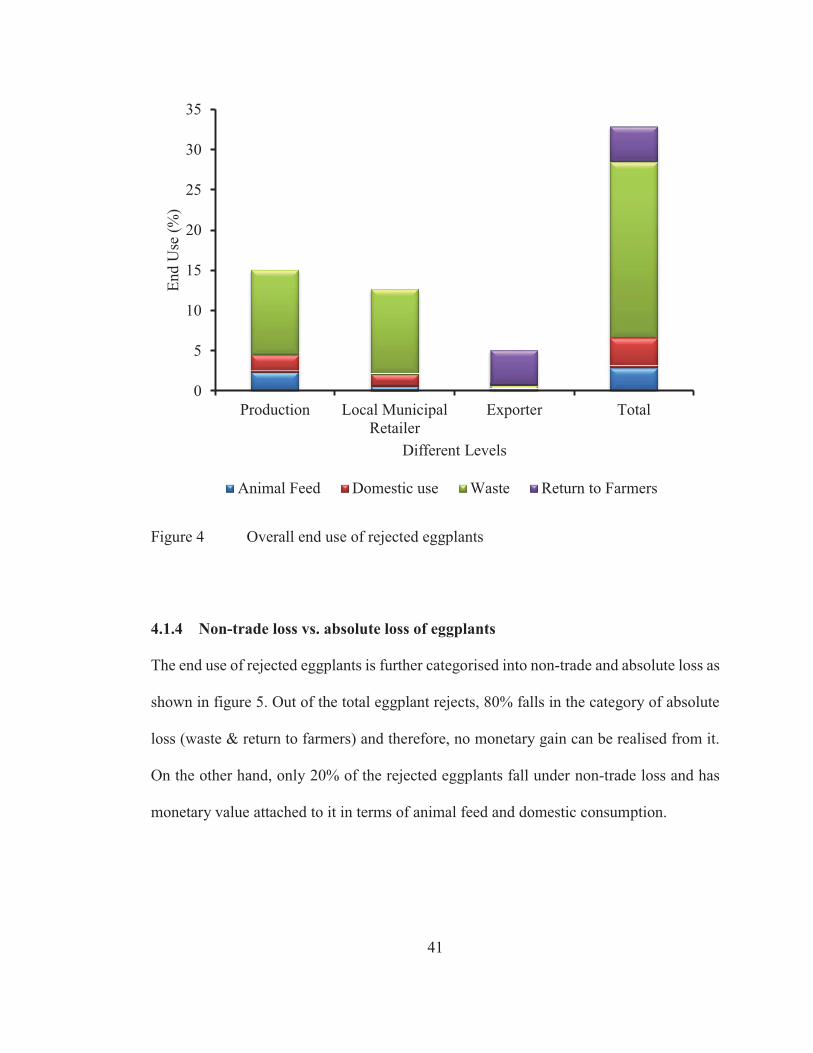
A read-through of Figure 4 reveals that the overall end use of rejected eggplants in
different production strata is wide-ranging in nature. On the overall basis, majority of the
postharvest loss eggplant was ascertained as waste (21.9%), whereas 3.7% and 2.9% is
ascertained for domestic use and animal feed respectively. An ascertained 4.4% of loss
eggplant that is returned to farmers from the exporters is also characterised as part of
waste.
0
5
10
15
20
25
30
35
Production Local MunicipalRetailer
Exporter Total Loss
Los
s (%
)
Different Levels
Shape Physical Abrasion Senescence/Over-mature Pest/Disease
41
Figure 4 Overall end use of rejected eggplants
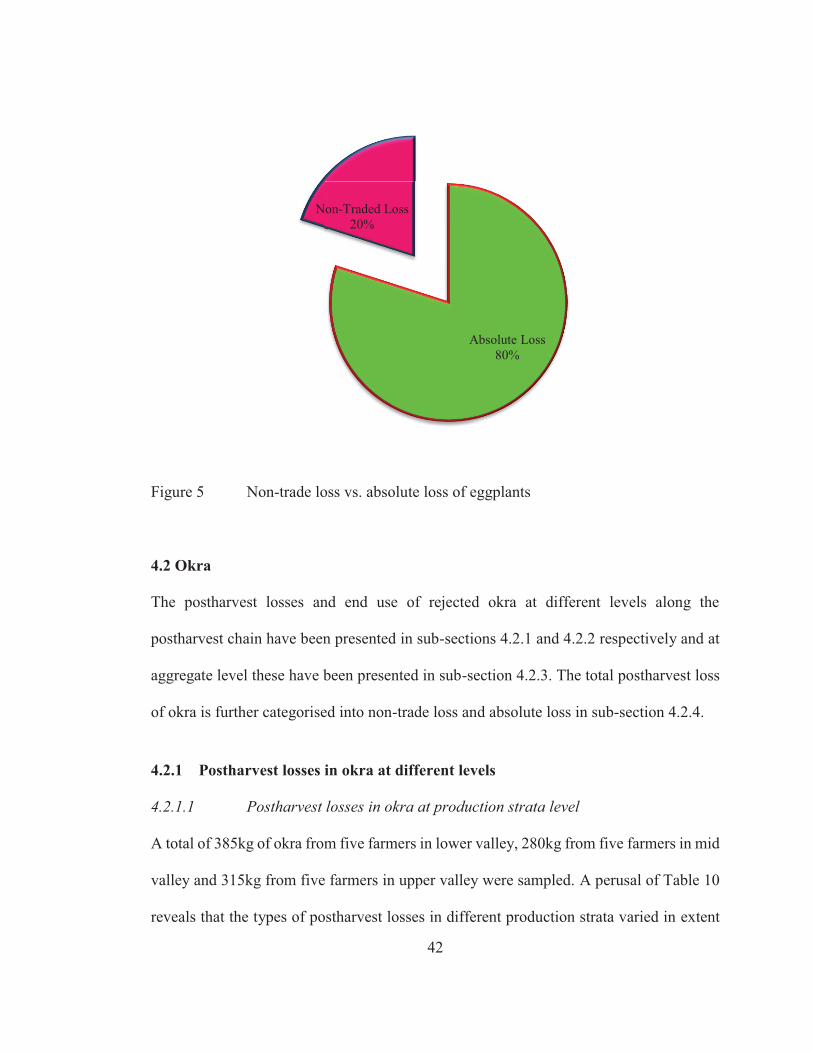
4.1.4 Non-trade loss vs. absolute loss of eggplants
The end use of rejected eggplants is further categorised into non-trade and absolute loss as
shown in figure 5. Out of the total eggplant rejects, 80% falls in the category of absolute
loss (waste & return to farmers) and therefore, no monetary gain can be realised from it.
On the other hand, only 20% of the rejected eggplants fall under non-trade loss and has
monetary value attached to it in terms of animal feed and domestic consumption.
0
5
10
15
20
25
30
35
Production Local MunicipalRetailer
Exporter Total
End
Use
(%)
Different Levels
Animal Feed Domestic use Waste Return to Farmers
42
Figure 5 Non-trade loss vs. absolute loss of eggplants
4.2 Okra
The postharvest losses and end use of rejected okra at different levels along the
postharvest chain have been presented in sub-sections 4.2.1 and 4.2.2 respectively and at
aggregate level these have been presented in sub-section 4.2.3. The total postharvest loss
of okra is further categorised into non-trade loss and absolute loss in sub-section 4.2.4.
4.2.1 Postharvest losses in okra at different levels
4.2.1.1 Postharvest losses in okra at production strata level
A total of 385kg of okra from five farmers in lower valley, 280kg from five farmers in mid
valley and 315kg from five farmers in upper valley were sampled. A perusal of Table 10
reveals that the types of postharvest losses in different production strata varied in extent
Absolute Loss 80%
Non-Traded Loss 20%
43
and nature. The extent of losses varied from strata to strata as well as the types of
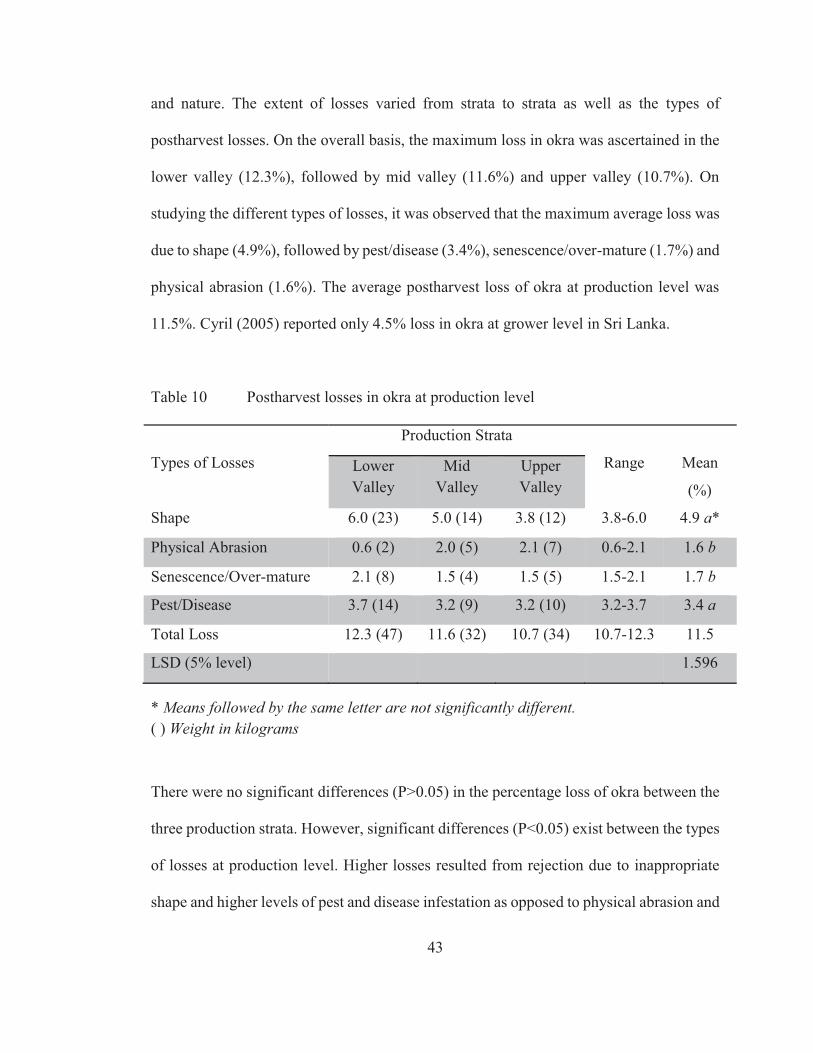
postharvest losses. On the overall basis, the maximum loss in okra was ascertained in the
lower valley (12.3%), followed by mid valley (11.6%) and upper valley (10.7%). On
studying the different types of losses, it was observed that the maximum average loss was
due to shape (4.9%), followed by pest/disease (3.4%), senescence/over-mature (1.7%) and
physical abrasion (1.6%). The average postharvest loss of okra at production level was
11.5%. Cyril (2005) reported only 4.5% loss in okra at grower level in Sri Lanka.
Table 10 Postharvest losses in okra at production level
Types of Losses
Production Strata
Range
Mean
(%) Lower Valley
Mid Valley
Upper Valley
Shape 6.0 (23) 5.0 (14) 3.8 (12) 3.8-6.0 4.9 a*
Physical Abrasion 0.6 (2) 2.0 (5) 2.1 (7) 0.6-2.1 1.6 b
Senescence/Over-mature 2.1 (8) 1.5 (4) 1.5 (5) 1.5-2.1 1.7 b
Pest/Disease 3.7 (14) 3.2 (9) 3.2 (10) 3.2-3.7 3.4 a
Total Loss 12.3 (47) 11.6 (32) 10.7 (34) 10.7-12.3 11.5
LSD (5% level) 1.596
* Means followed by the same letter are not significantly different. ( ) Weight in kilograms There were no significant differences (P>0.05) in the percentage loss of okra between the
three production strata. However, significant differences (P<0.05) exist between the types
of losses at production level. Higher losses resulted from rejection due to inappropriate
shape and higher levels of pest and disease infestation as opposed to physical abrasion and
44
over-maturity of the crop. This may be because management practices among growers are
highly variable as the crop is a non-bilateral quarantine agreement (non BQA) commodity
with no strict protocols being administered. It can also perhaps be due to higher degree of
water stress at critical times leading to deformations and increasing the susceptibility of
the crop to pest and disease infestation, particularly formation of galls and incidence of
pod borers. Losses resulting from physical abrasion and over-maturity are at a minimal as
regular harvesting of tender pods is done and crates are used for transportation.
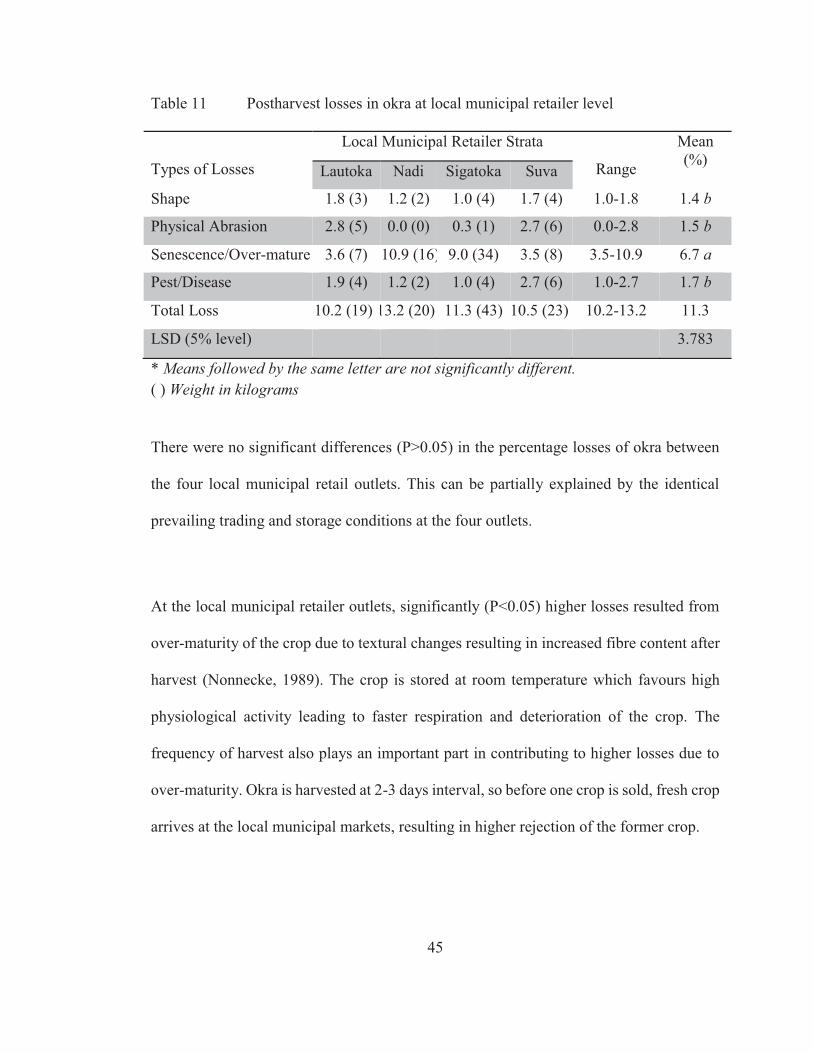
4.2.1.2 Postharvest losses in okra at local municipal retailer strata level
A total of 190kg of okra sampled from the Lautoka, 150kg from Nadi, 380kg from
Sigatoka and 220kg from Suva municipal markets were sampled. The comparison of
postharvest rejection in okra at local municipal retailer level, presented in Table 11, reveal
that maximum loss was in Nadi (13.2%), followed by Sigatoka (11.3%). The Lautoka and
Suva municipal retailer outlets registered the lowest postharvest losses of 10.2% and
10.5%, respectively. Across different types, it is revealed that senescence/over-mature
(6.7%) registered highest average postharvest loss, while pest/disease (1.7%), physical
abrasion (1.5%) and shape (1.4%) had average postharvest loss on the lower bracket. The
average postharvest loss of okra at local municipal retailer level was 11.3%. Cyril (2005)
reported a 4.64 % loss in okra at retailer level in Sri Lanka.
45
Table 11 Postharvest losses in okra at local municipal retailer level
Types of Losses
Local Municipal Retailer Strata
Range
Mean (%)
Lautoka Nadi Sigatoka Suva
Shape 1.8 (3) 1.2 (2) 1.0 (4) 1.7 (4) 1.0-1.8 1.4 b
Physical Abrasion 2.8 (5) 0.0 (0) 0.3 (1) 2.7 (6) 0.0-2.8 1.5 b
Senescence/Over-mature 3.6 (7) 10.9 (16) 9.0 (34) 3.5 (8) 3.5-10.9 6.7 a
Pest/Disease 1.9 (4) 1.2 (2) 1.0 (4) 2.7 (6) 1.0-2.7 1.7 b
Total Loss 10.2 (19) 13.2 (20) 11.3 (43) 10.5 (23) 10.2-13.2 11.3
LSD (5% level) 3.783
* Means followed by the same letter are not significantly different. ( ) Weight in kilograms
There were no significant differences (P>0.05) in the percentage losses of okra between
the four local municipal retail outlets. This can be partially explained by the identical
prevailing trading and storage conditions at the four outlets.
At the local municipal retailer outlets, significantly (P<0.05) higher losses resulted from
over-maturity of the crop due to textural changes resulting in increased fibre content after
harvest (Nonnecke, 1989). The crop is stored at room temperature which favours high
physiological activity leading to faster respiration and deterioration of the crop. The
frequency of harvest also plays an important part in contributing to higher losses due to
over-maturity. Okra is harvested at 2-3 days interval, so before one crop is sold, fresh crop
arrives at the local municipal markets, resulting in higher rejection of the former crop.
46
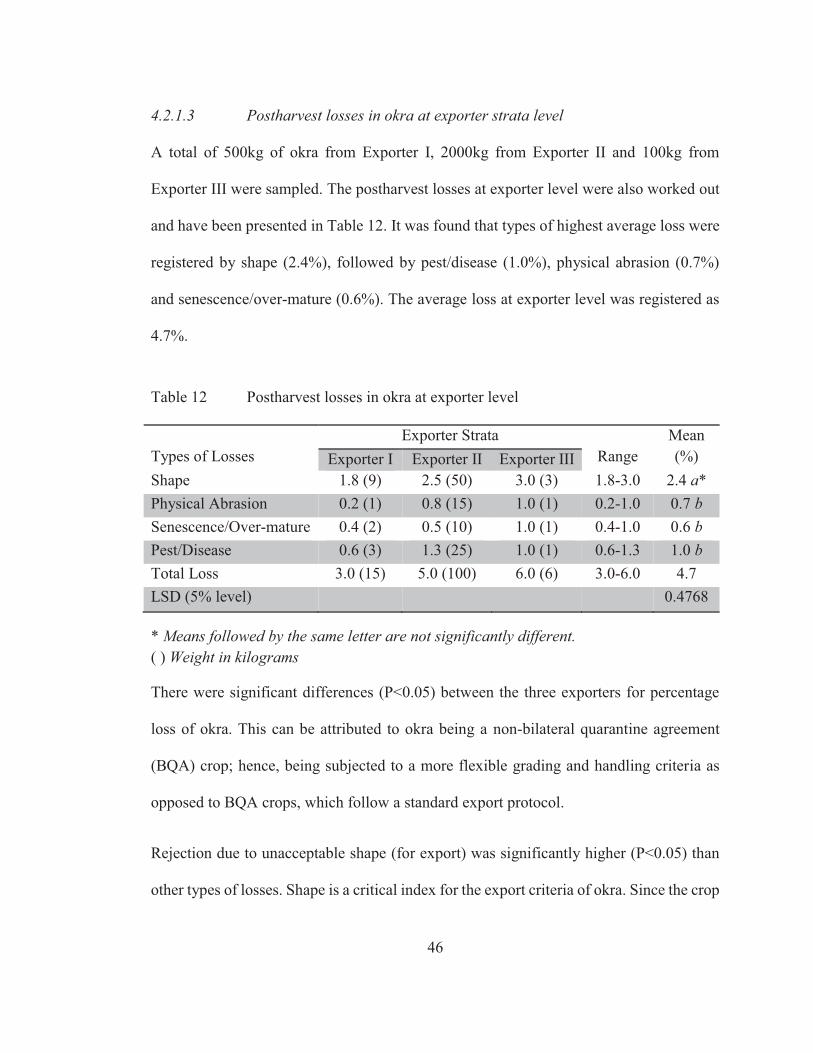
4.2.1.3 Postharvest losses in okra at exporter strata level
A total of 500kg of okra from Exporter I, 2000kg from Exporter II and 100kg from
Exporter III were sampled. The postharvest losses at exporter level were also worked out
and have been presented in Table 12. It was found that types of highest average loss were
registered by shape (2.4%), followed by pest/disease (1.0%), physical abrasion (0.7%)
and senescence/over-mature (0.6%). The average loss at exporter level was registered as
4.7%.
Table 12 Postharvest losses in okra at exporter level
Types of Losses
Exporter Strata Range
Mean (%) Exporter I Exporter II Exporter III
Shape 1.8 (9) 2.5 (50) 3.0 (3) 1.8-3.0 2.4 a* Physical Abrasion 0.2 (1) 0.8 (15) 1.0 (1) 0.2-1.0 0.7 b Senescence/Over-mature 0.4 (2) 0.5 (10) 1.0 (1) 0.4-1.0 0.6 b Pest/Disease 0.6 (3) 1.3 (25) 1.0 (1) 0.6-1.3 1.0 b Total Loss 3.0 (15) 5.0 (100) 6.0 (6) 3.0-6.0 4.7 LSD (5% level) 0.4768
* Means followed by the same letter are not significantly different. ( ) Weight in kilograms
There were significant differences (P<0.05) between the three exporters for percentage
loss of okra. This can be attributed to okra being a non-bilateral quarantine agreement
(BQA) crop; hence, being subjected to a more flexible grading and handling criteria as
opposed to BQA crops, which follow a standard export protocol.
Rejection due to unacceptable shape (for export) was significantly higher (P<0.05) than
other types of losses. Shape is a critical index for the export criteria of okra. Since the crop
47
is a non BQA commodity, management practices are highly variable as no strict
guidelines are imposed.
4.2.2 End use of rejected okra at different levels
4.2.2.1 End use of rejected okra at production strata level
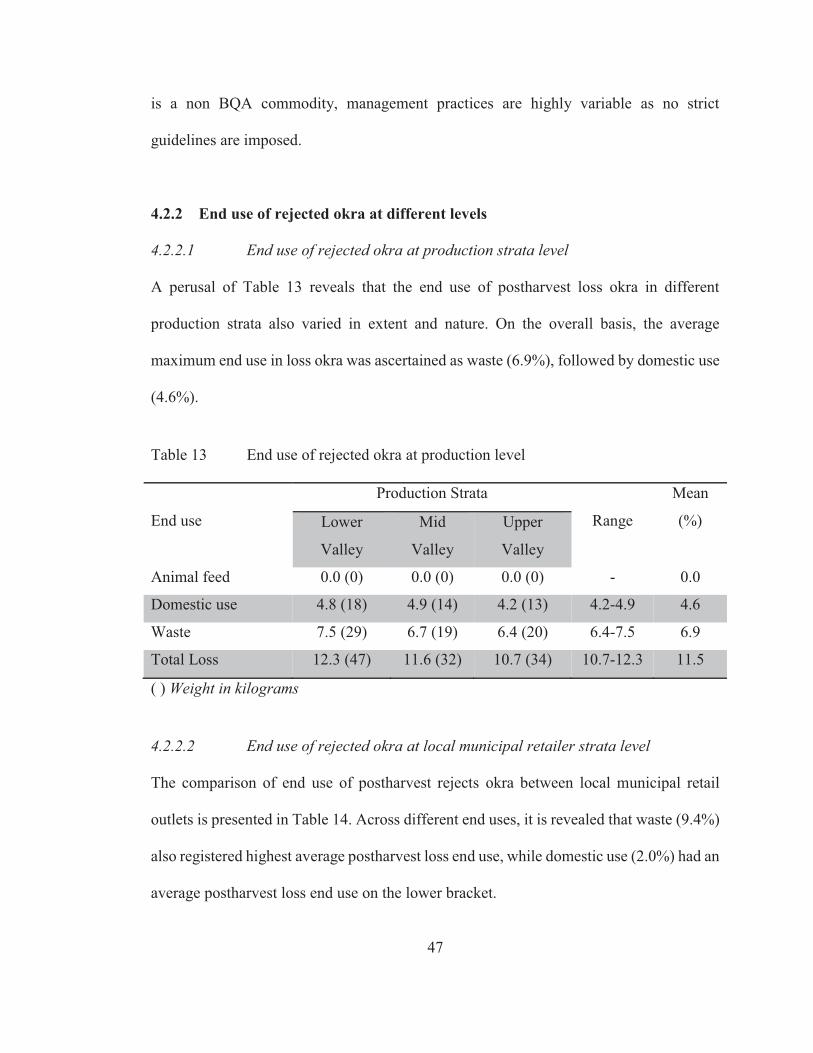
A perusal of Table 13 reveals that the end use of postharvest loss okra in different
production strata also varied in extent and nature. On the overall basis, the average
maximum end use in loss okra was ascertained as waste (6.9%), followed by domestic use
(4.6%).
Table 13 End use of rejected okra at production level
End use
Production Strata
Range
Mean
(%) Lower
Valley
Mid
Valley
Upper
Valley
Animal feed 0.0 (0) 0.0 (0) 0.0 (0) - 0.0
Domestic use 4.8 (18) 4.9 (14) 4.2 (13) 4.2-4.9 4.6
Waste 7.5 (29) 6.7 (19) 6.4 (20) 6.4-7.5 6.9
Total Loss 12.3 (47) 11.6 (32) 10.7 (34) 10.7-12.3 11.5
( ) Weight in kilograms
4.2.2.2 End use of rejected okra at local municipal retailer strata level
The comparison of end use of postharvest rejects okra between local municipal retail
outlets is presented in Table 14. Across different end uses, it is revealed that waste (9.4%)
also registered highest average postharvest loss end use, while domestic use (2.0%) had an
average postharvest loss end use on the lower bracket.
48
Table 14 End use of rejected okra at local municipal retailer level
End use
Local Municipal Retailer Strata
Range
Mean
(%) Lautoka Nadi Sigatoka Suva
Animal feed 0.0 (0) 0.0 (0) 0.0 (0) 0.0 (0) 0 0.0
Domestic use 3.8 (7) 0.5 (1) 1.1 (4) 2.3 (5) 0.5-3.8 2.0
Waste 6.3 (12) 12.7 (19) 10.2 (39) 8.2 (18) 6.3-12.7 9.4
Total Loss 10.2
(19)
13.2 (20) 11.3 (43) 10.5 (23) 10.2-13.2 11.3
( ) Weight in kilograms
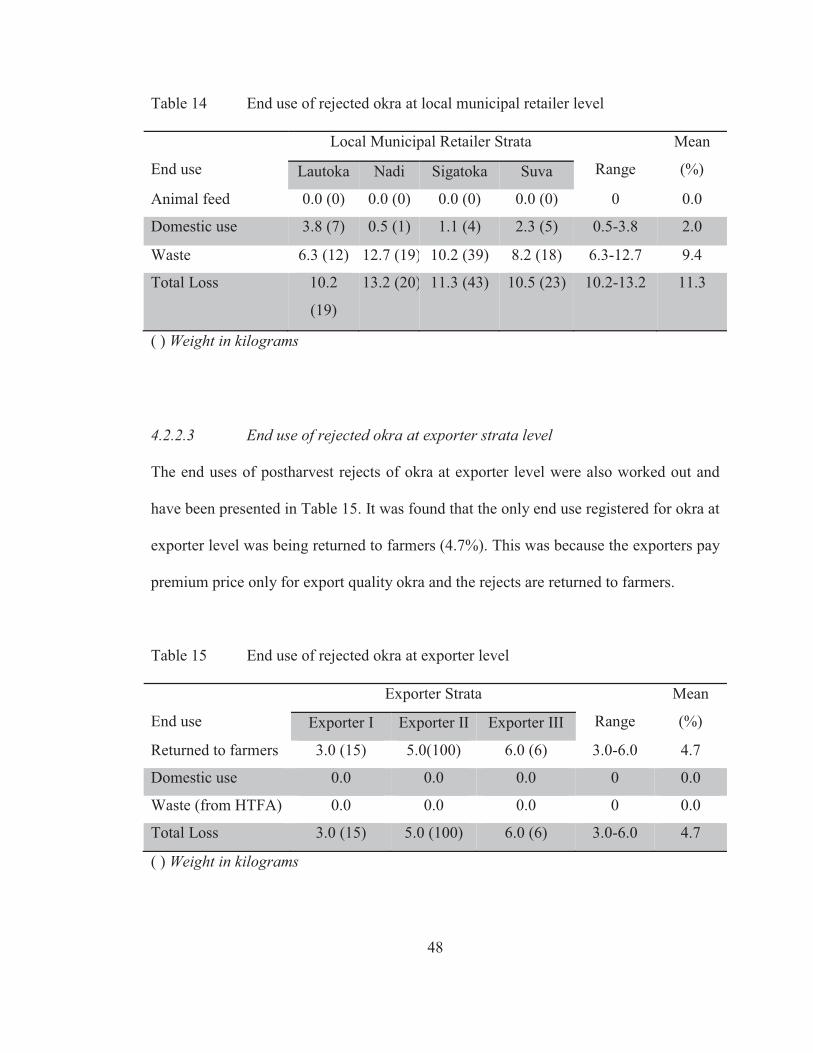
4.2.2.3 End use of rejected okra at exporter strata level
The end uses of postharvest rejects of okra at exporter level were also worked out and
have been presented in Table 15. It was found that the only end use registered for okra at
exporter level was being returned to farmers (4.7%). This was because the exporters pay
premium price only for export quality okra and the rejects are returned to farmers.
Table 15 End use of rejected okra at exporter level
End use
Exporter Strata
Range
Mean
(%) Exporter I Exporter II Exporter III
Returned to farmers 3.0 (15) 5.0(100) 6.0 (6) 3.0-6.0 4.7
Domestic use 0.0 0.0 0.0 0 0.0
Waste (from HTFA) 0.0 0.0 0.0 0 0.0
Total Loss 3.0 (15) 5.0 (100) 6.0 (6) 3.0-6.0 4.7
( ) Weight in kilograms
49
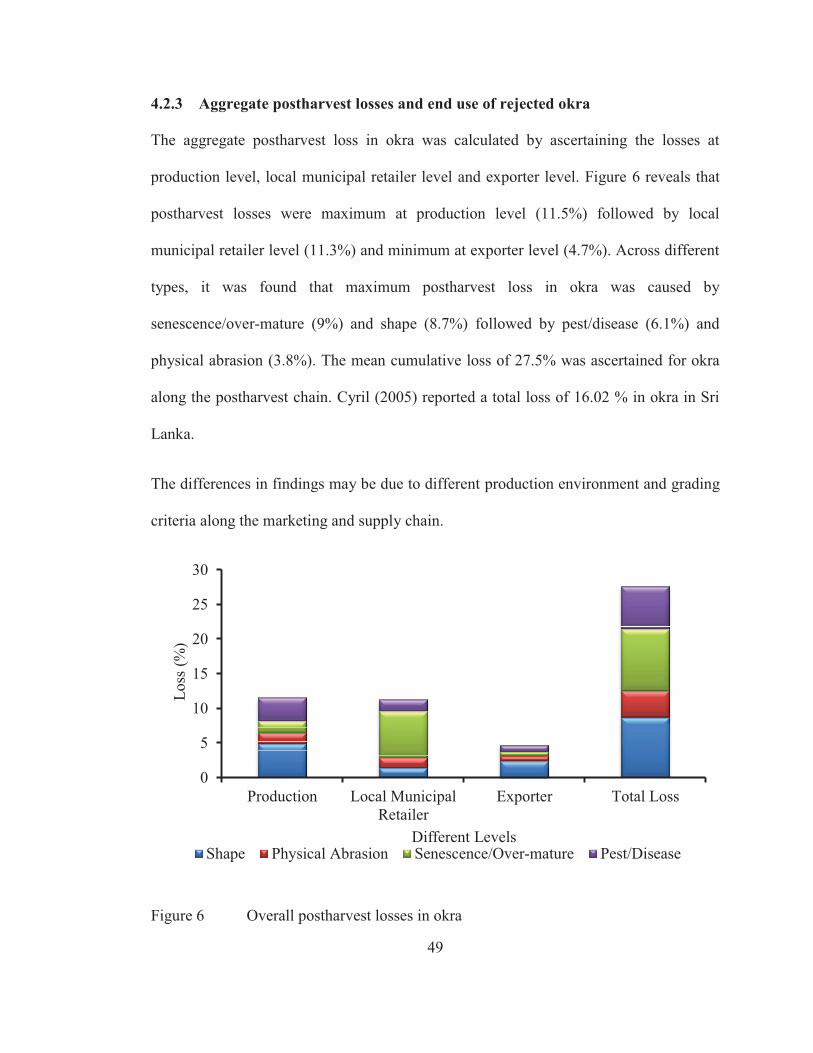
4.2.3 Aggregate postharvest losses and end use of rejected okra
The aggregate postharvest loss in okra was calculated by ascertaining the losses at
production level, local municipal retailer level and exporter level. Figure 6 reveals that
postharvest losses were maximum at production level (11.5%) followed by local
municipal retailer level (11.3%) and minimum at exporter level (4.7%). Across different
types, it was found that maximum postharvest loss in okra was caused by
senescence/over-mature (9%) and shape (8.7%) followed by pest/disease (6.1%) and
physical abrasion (3.8%). The mean cumulative loss of 27.5% was ascertained for okra
along the postharvest chain. Cyril (2005) reported a total loss of 16.02 % in okra in Sri
Lanka.
The differences in findings may be due to different production environment and grading
criteria along the marketing and supply chain.
Figure 6 Overall postharvest losses in okra
0
5
10
15
20
25
30
Production Local MunicipalRetailer
Exporter Total Loss
Los
s (%
)
Different Levels Shape Physical Abrasion Senescence/Over-mature Pest/Disease
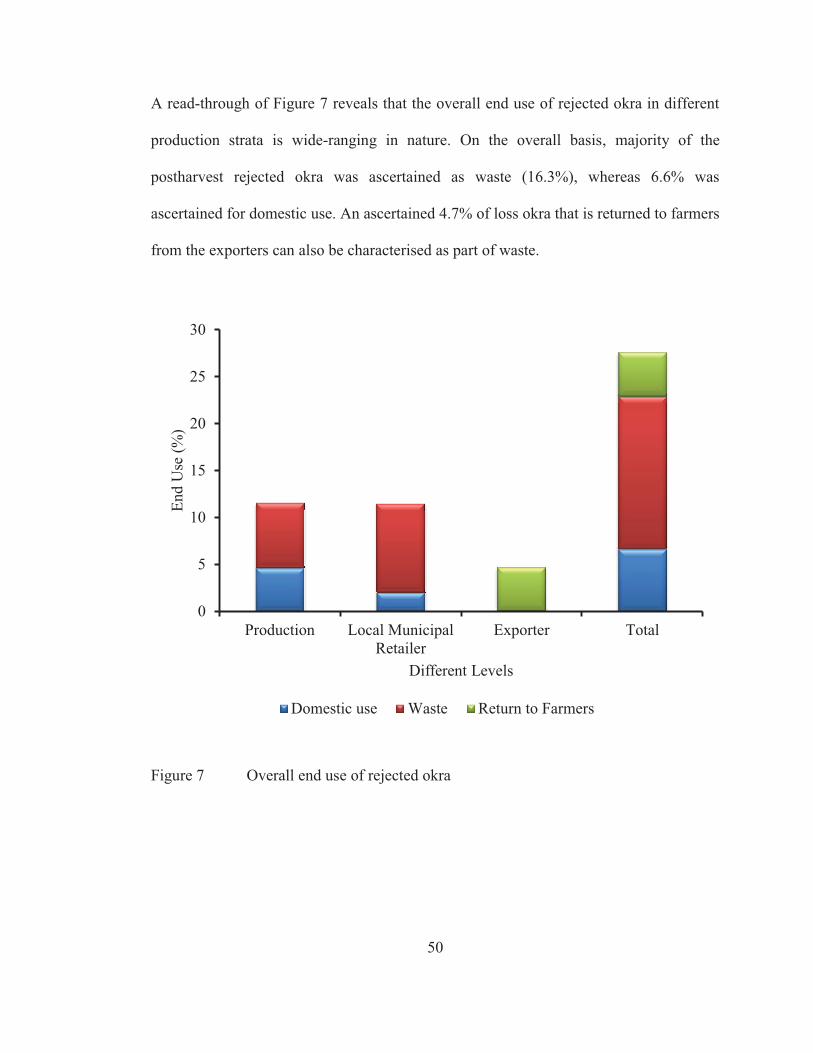
50
A read-through of Figure 7 reveals that the overall end use of rejected okra in different
production strata is wide-ranging in nature. On the overall basis, majority of the
postharvest rejected okra was ascertained as waste (16.3%), whereas 6.6% was
ascertained for domestic use. An ascertained 4.7% of loss okra that is returned to farmers
from the exporters can also be characterised as part of waste.
Figure 7 Overall end use of rejected okra
0
5
10
15
20
25
30
Production Local MunicipalRetailer
Exporter Total
End
Use
(%)
Different Levels
Domestic use Waste Return to Farmers

51
4.2.4 Non-trade loss vs. absolute loss of okra
The end use of rejected okra is further categorised into non-trade and absolute loss as
shown in figure 8. Out of the total okra rejects, 76% falls in the category of absolute loss
(waste and returned to farmers) and therefore, no monetary gain can be realised from it.
On the other hand, only 24% of the rejected okra fall under non-trade loss and has
monetary value attached to it in terms of domestic consumption.
Figure 8 Non-trade loss vs. absolute loss of okra
4.3 Tomato
The postharvest losses and end use of rejected tomatoes at different levels along the
postharvest chain have been presented in sub-sections 4.3.1 and 4.3.2 respectively and at
aggregate level these have been presented in sub-section 4.3.3. The total postharvest loss
is further categorised into non-trade loss and absolute loss in sub-section 4.3.4.
Absolute Loss 76%
Non-Traded Loss 24%
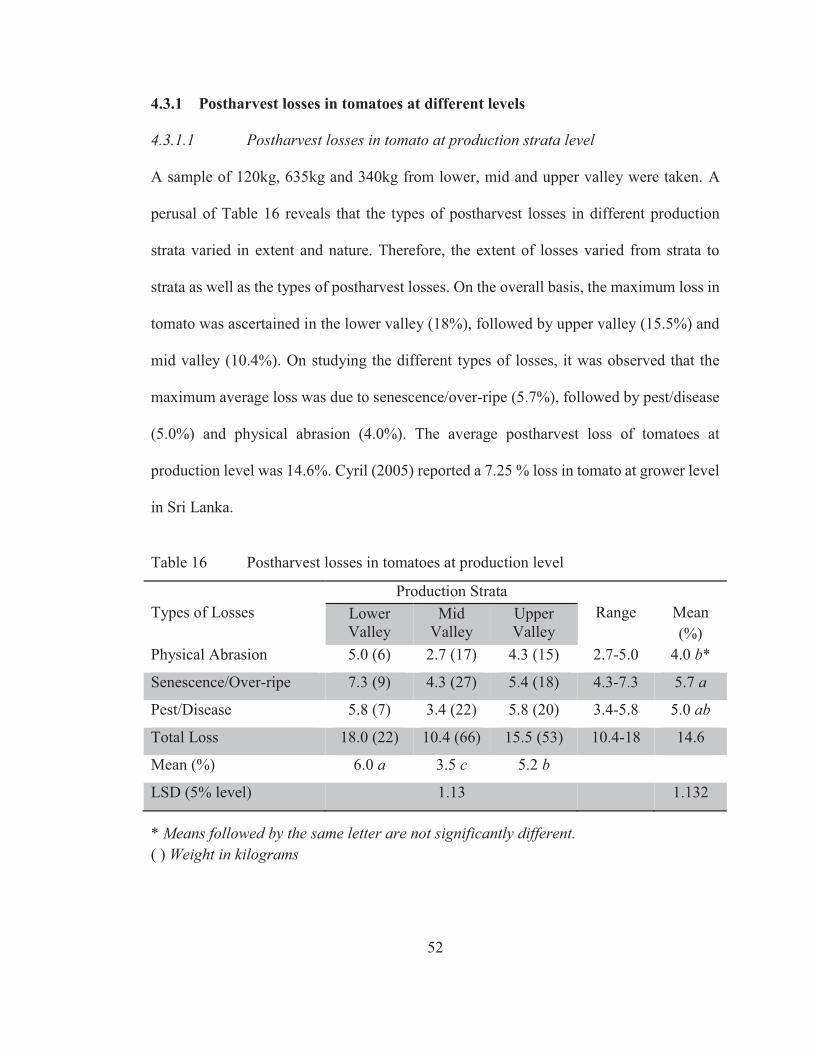
52
4.3.1 Postharvest losses in tomatoes at different levels
4.3.1.1 Postharvest losses in tomato at production strata level
A sample of 120kg, 635kg and 340kg from lower, mid and upper valley were taken. A
perusal of Table 16 reveals that the types of postharvest losses in different production
strata varied in extent and nature. Therefore, the extent of losses varied from strata to
strata as well as the types of postharvest losses. On the overall basis, the maximum loss in
tomato was ascertained in the lower valley (18%), followed by upper valley (15.5%) and
mid valley (10.4%). On studying the different types of losses, it was observed that the
maximum average loss was due to senescence/over-ripe (5.7%), followed by pest/disease
(5.0%) and physical abrasion (4.0%). The average postharvest loss of tomatoes at
production level was 14.6%. Cyril (2005) reported a 7.25 % loss in tomato at grower level
in Sri Lanka.
Table 16 Postharvest losses in tomatoes at production level
Types of Losses
Production Strata Range
Mean (%)
Lower Valley
Mid Valley
Upper Valley
Physical Abrasion 5.0 (6) 2.7 (17) 4.3 (15) 2.7-5.0 4.0 b*
Senescence/Over-ripe 7.3 (9) 4.3 (27) 5.4 (18) 4.3-7.3 5.7 a
Pest/Disease 5.8 (7) 3.4 (22) 5.8 (20) 3.4-5.8 5.0 ab
Total Loss 18.0 (22) 10.4 (66) 15.5 (53) 10.4-18 14.6
Mean (%) 6.0 a 3.5 c 5.2 b
LSD (5% level) 1.13 1.132 * Means followed by the same letter are not significantly different. ( ) Weight in kilograms
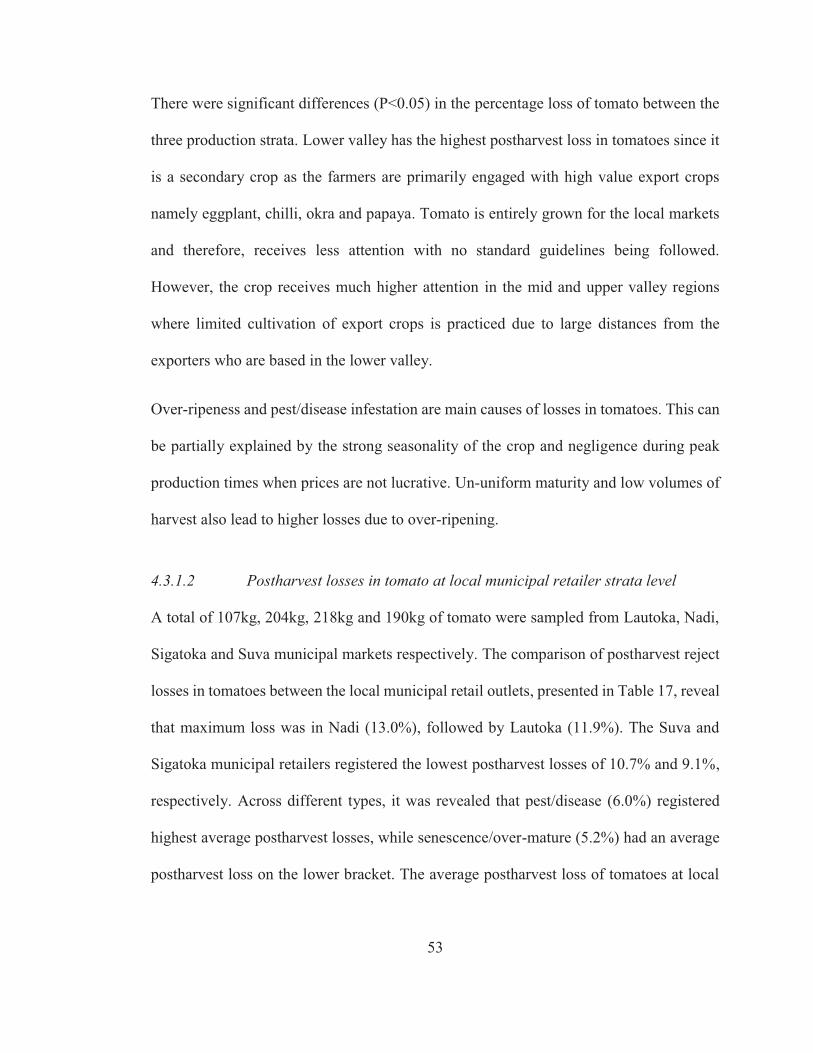
53
There were significant differences (P<0.05) in the percentage loss of tomato between the
three production strata. Lower valley has the highest postharvest loss in tomatoes since it
is a secondary crop as the farmers are primarily engaged with high value export crops
namely eggplant, chilli, okra and papaya. Tomato is entirely grown for the local markets
and therefore, receives less attention with no standard guidelines being followed.
However, the crop receives much higher attention in the mid and upper valley regions
where limited cultivation of export crops is practiced due to large distances from the
exporters who are based in the lower valley.
Over-ripeness and pest/disease infestation are main causes of losses in tomatoes. This can
be partially explained by the strong seasonality of the crop and negligence during peak
production times when prices are not lucrative. Un-uniform maturity and low volumes of
harvest also lead to higher losses due to over-ripening.
4.3.1.2 Postharvest losses in tomato at local municipal retailer strata level
A total of 107kg, 204kg, 218kg and 190kg of tomato were sampled from Lautoka, Nadi,
Sigatoka and Suva municipal markets respectively. The comparison of postharvest reject
losses in tomatoes between the local municipal retail outlets, presented in Table 17, reveal
that maximum loss was in Nadi (13.0%), followed by Lautoka (11.9%). The Suva and
Sigatoka municipal retailers registered the lowest postharvest losses of 10.7% and 9.1%,
respectively. Across different types, it was revealed that pest/disease (6.0%) registered
highest average postharvest losses, while senescence/over-mature (5.2%) had an average
postharvest loss on the lower bracket. The average postharvest loss of tomatoes at local
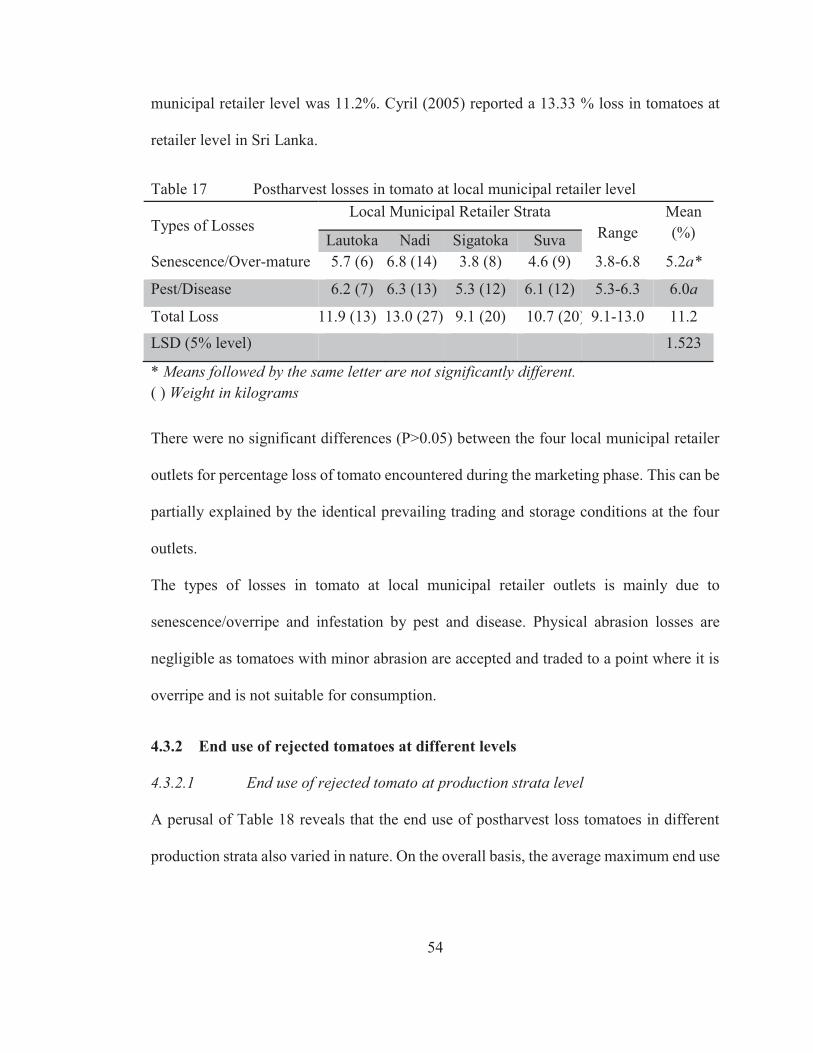
54
municipal retailer level was 11.2%. Cyril (2005) reported a 13.33 % loss in tomatoes at
retailer level in Sri Lanka.
Table 17 Postharvest losses in tomato at local municipal retailer level
Types of Losses Local Municipal Retailer Strata
Range Mean (%) Lautoka Nadi Sigatoka Suva
Senescence/Over-mature 5.7 (6) 6.8 (14) 3.8 (8) 4.6 (9) 3.8-6.8 5.2a*
Pest/Disease 6.2 (7) 6.3 (13) 5.3 (12) 6.1 (12) 5.3-6.3 6.0a
Total Loss 11.9 (13) 13.0 (27) 9.1 (20) 10.7 (20) 9.1-13.0 11.2
LSD (5% level) 1.523
* Means followed by the same letter are not significantly different. ( ) Weight in kilograms
There were no significant differences (P>0.05) between the four local municipal retailer
outlets for percentage loss of tomato encountered during the marketing phase. This can be
partially explained by the identical prevailing trading and storage conditions at the four
outlets.
The types of losses in tomato at local municipal retailer outlets is mainly due to
senescence/overripe and infestation by pest and disease. Physical abrasion losses are
negligible as tomatoes with minor abrasion are accepted and traded to a point where it is
overripe and is not suitable for consumption.
4.3.2 End use of rejected tomatoes at different levels
4.3.2.1 End use of rejected tomato at production strata level
A perusal of Table 18 reveals that the end use of postharvest loss tomatoes in different
production strata also varied in nature. On the overall basis, the average maximum end use
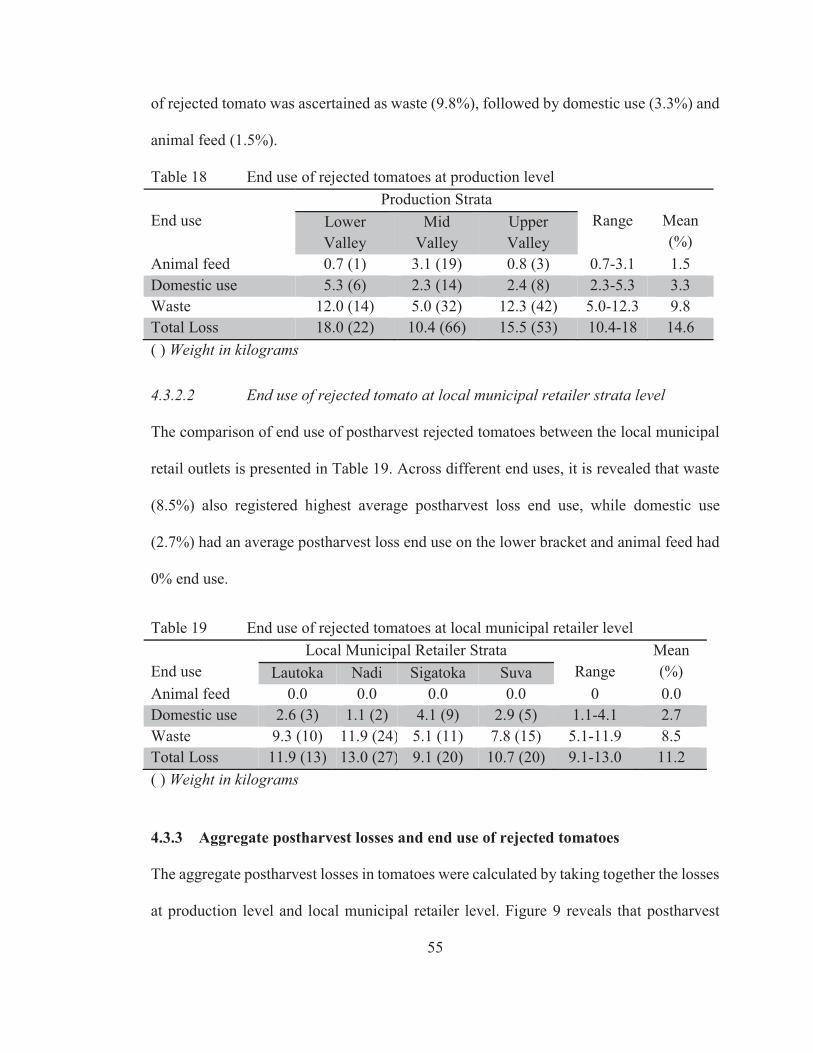
55
of rejected tomato was ascertained as waste (9.8%), followed by domestic use (3.3%) and
animal feed (1.5%).
Table 18 End use of rejected tomatoes at production level End use
Production Strata Range
Mean (%)
Lower Valley
Mid Valley
Upper Valley
Animal feed 0.7 (1) 3.1 (19) 0.8 (3) 0.7-3.1 1.5 Domestic use 5.3 (6) 2.3 (14) 2.4 (8) 2.3-5.3 3.3 Waste 12.0 (14) 5.0 (32) 12.3 (42) 5.0-12.3 9.8 Total Loss 18.0 (22) 10.4 (66) 15.5 (53) 10.4-18 14.6 ( ) Weight in kilograms
4.3.2.2 End use of rejected tomato at local municipal retailer strata level
The comparison of end use of postharvest rejected tomatoes between the local municipal
retail outlets is presented in Table 19. Across different end uses, it is revealed that waste
(8.5%) also registered highest average postharvest loss end use, while domestic use
(2.7%) had an average postharvest loss end use on the lower bracket and animal feed had
0% end use.
Table 19 End use of rejected tomatoes at local municipal retailer level End use
Local Municipal Retailer Strata Range
Mean (%) Lautoka Nadi Sigatoka Suva
Animal feed 0.0 0.0 0.0 0.0 0 0.0 Domestic use 2.6 (3) 1.1 (2) 4.1 (9) 2.9 (5) 1.1-4.1 2.7 Waste 9.3 (10) 11.9 (24) 5.1 (11) 7.8 (15) 5.1-11.9 8.5 Total Loss 11.9 (13) 13.0 (27) 9.1 (20) 10.7 (20) 9.1-13.0 11.2 ( ) Weight in kilograms
4.3.3 Aggregate postharvest losses and end use of rejected tomatoes
The aggregate postharvest losses in tomatoes were calculated by taking together the losses
at production level and local municipal retailer level. Figure 9 reveals that postharvest
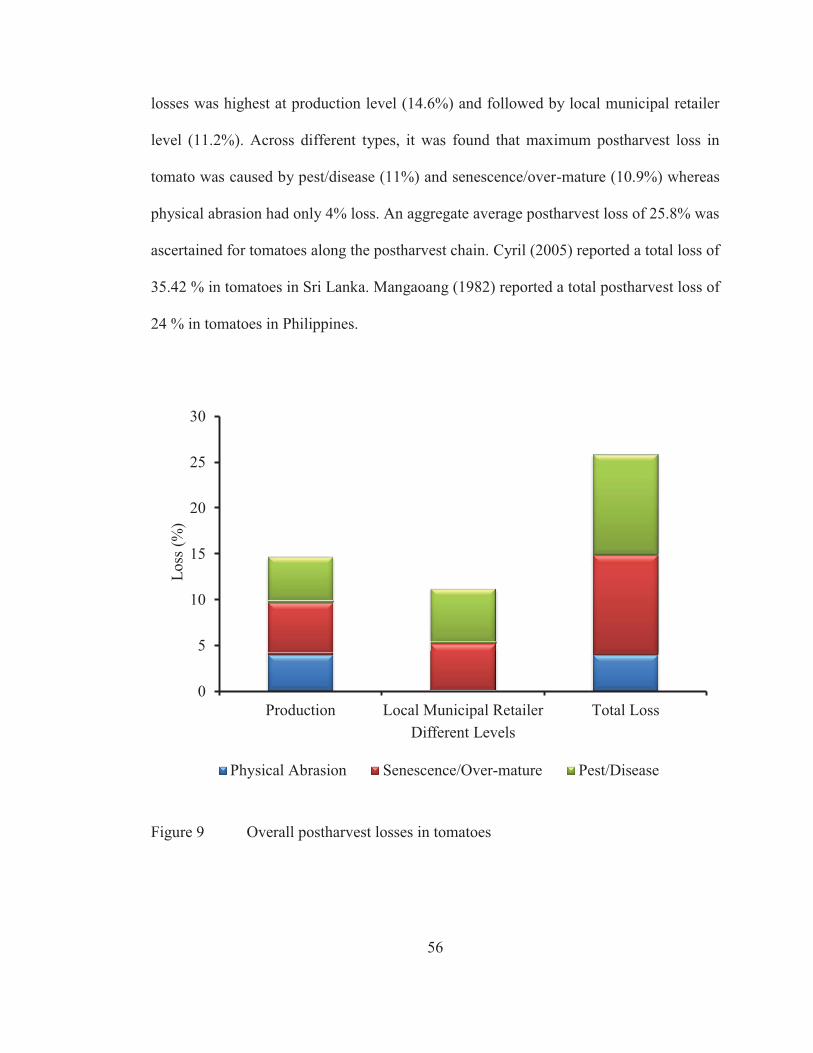
56
losses was highest at production level (14.6%) and followed by local municipal retailer
level (11.2%). Across different types, it was found that maximum postharvest loss in
tomato was caused by pest/disease (11%) and senescence/over-mature (10.9%) whereas
physical abrasion had only 4% loss. An aggregate average postharvest loss of 25.8% was
ascertained for tomatoes along the postharvest chain. Cyril (2005) reported a total loss of
35.42 % in tomatoes in Sri Lanka. Mangaoang (1982) reported a total postharvest loss of
24 % in tomatoes in Philippines.
Figure 9 Overall postharvest losses in tomatoes
0
5
10
15
20
25
30
Production Local Municipal Retailer Total Loss
Los
s (%
)
Different Levels
Physical Abrasion Senescence/Over-mature Pest/Disease
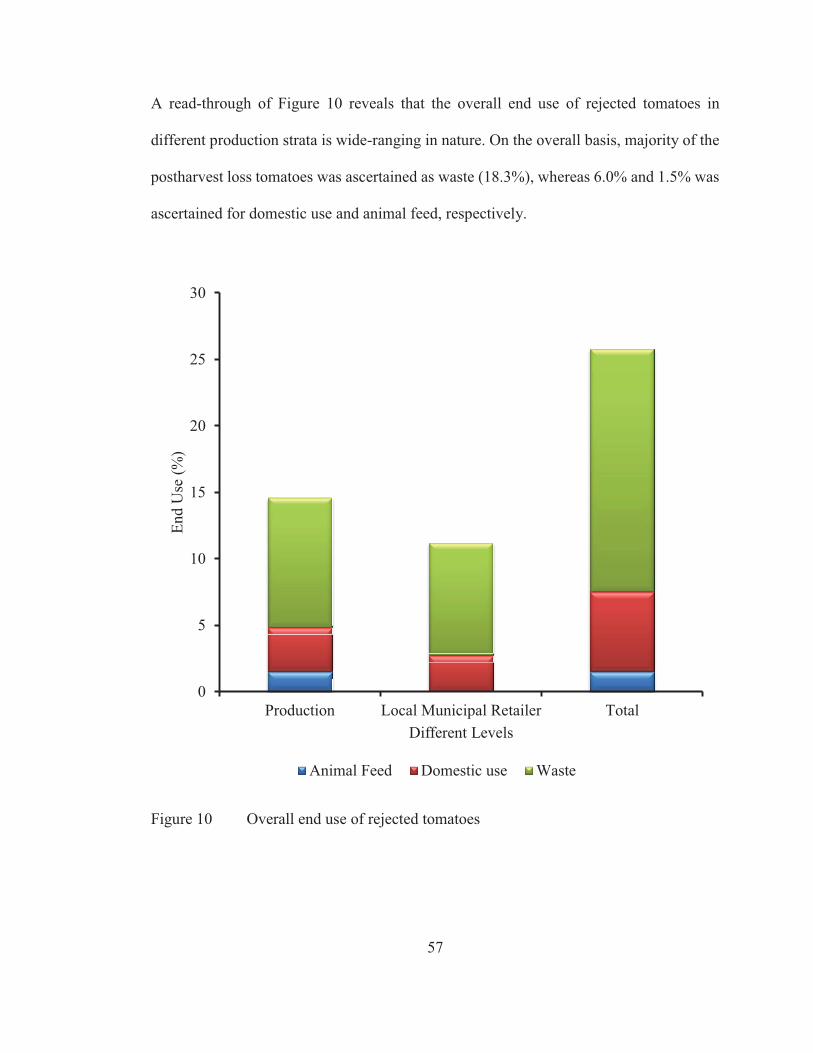
57
A read-through of Figure 10 reveals that the overall end use of rejected tomatoes in
different production strata is wide-ranging in nature. On the overall basis, majority of the
postharvest loss tomatoes was ascertained as waste (18.3%), whereas 6.0% and 1.5% was
ascertained for domestic use and animal feed, respectively.
Figure 10 Overall end use of rejected tomatoes
0
5
10
15
20
25
30
Production Local Municipal Retailer Total
End
Use
(%)
Different Levels
Animal Feed Domestic use Waste
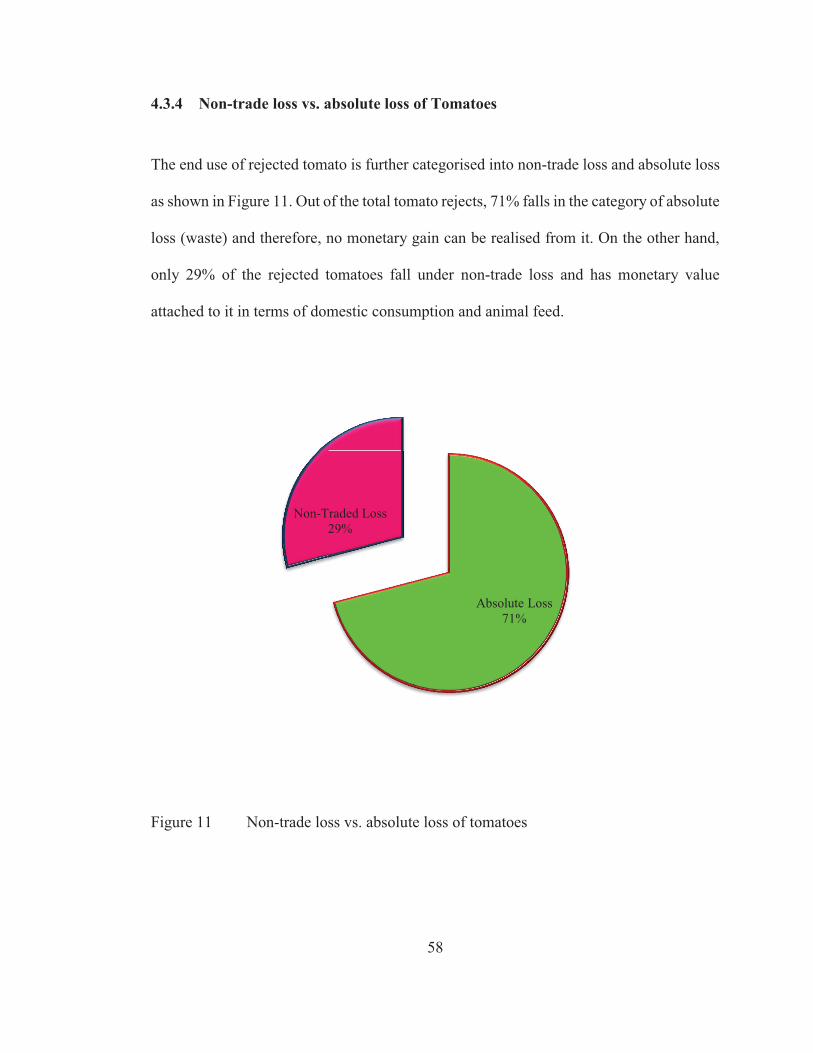
58
4.3.4 Non-trade loss vs. absolute loss of Tomatoes
The end use of rejected tomato is further categorised into non-trade loss and absolute loss
as shown in Figure 11. Out of the total tomato rejects, 71% falls in the category of absolute
loss (waste) and therefore, no monetary gain can be realised from it. On the other hand,
only 29% of the rejected tomatoes fall under non-trade loss and has monetary value
attached to it in terms of domestic consumption and animal feed.
Figure 11 Non-trade loss vs. absolute loss of tomatoes
Absolute Loss 71%
Non-Traded Loss 29%
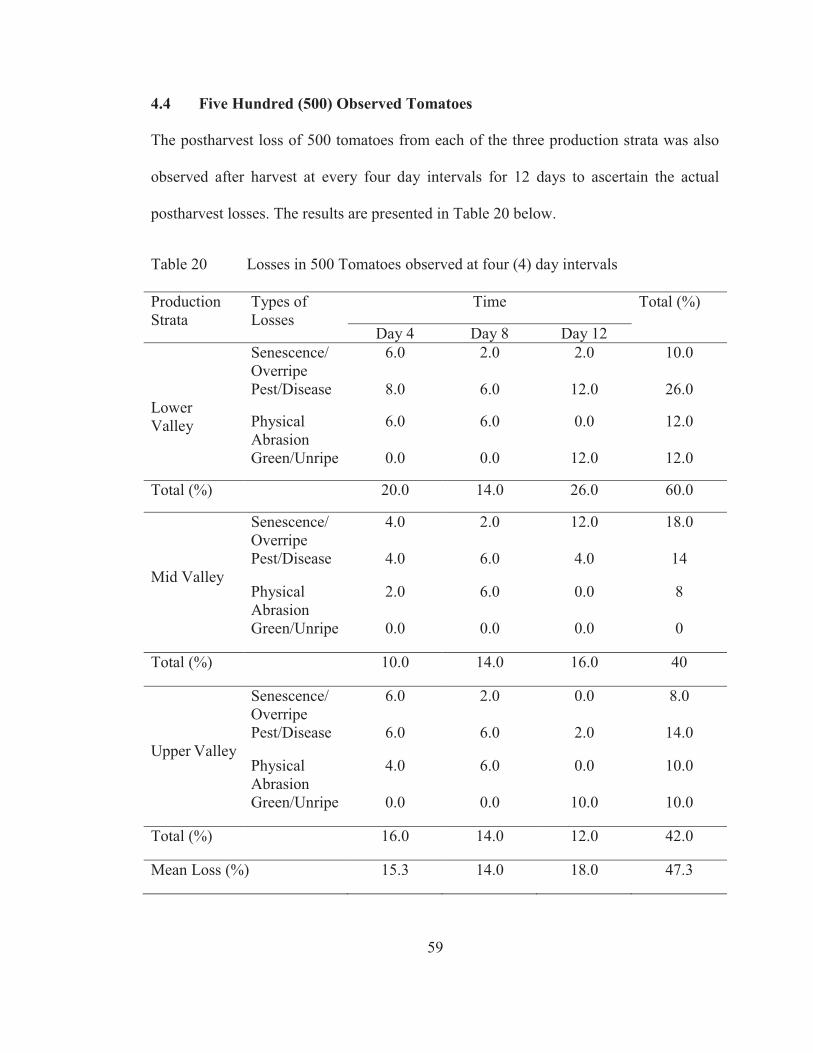
59
4.4 Five Hundred (500) Observed Tomatoes
The postharvest loss of 500 tomatoes from each of the three production strata was also
observed after harvest at every four day intervals for 12 days to ascertain the actual
postharvest losses. The results are presented in Table 20 below.
Table 20 Losses in 500 Tomatoes observed at four (4) day intervals
Production Strata
Types of Losses
Time Total (%)
Day 4 Day 8 Day 12 Lower Valley
Senescence/ Overripe
6.0 2.0 2.0 10.0
Pest/Disease 8.0 6.0 12.0 26.0
Physical Abrasion
6.0 6.0 0.0 12.0
Green/Unripe 0.0 0.0 12.0 12.0
Total (%) 20.0 14.0 26.0 60.0
Mid Valley
Senescence/ Overripe
4.0 2.0 12.0 18.0
Pest/Disease 4.0 6.0 4.0 14
Physical Abrasion
2.0 6.0 0.0 8
Green/Unripe 0.0 0.0 0.0 0
Total (%) 10.0 14.0 16.0 40
Upper Valley
Senescence/ Overripe
6.0 2.0 0.0 8.0
Pest/Disease 6.0 6.0 2.0 14.0
Physical Abrasion
4.0 6.0 0.0 10.0
Green/Unripe 0.0 0.0 10.0 10.0
Total (%) 16.0 14.0 12.0 42.0
Mean Loss (%) 15.3 14.0 18.0 47.3
60
A perusal of Table 20 reveals that the extent of actual losses in the 500 observed tomatoes
varied between production strata as well as the types of postharvest losses. On the overall
basis, the maximum loss in tomato after 4 days was ascertained in the lower valley (20%),
followed by upper valley (16%) and mid valley (10%). On studying the different types of
losses, it was observed that the maximum average loss was due to pest/disease (6.0%),
followed by senescence/over-mature (5.3%) and physical abrasion (4.0%). The average
actual postharvest loss of tomatoes after four (4) days was 15.3%.
The result of postharvest losses in tomatoes after eight (8) days, reveal that losses were the
same (14%) in the three strata. Across different types, it was revealed that pest/disease
(6.0%) and physical abrasion (6%) registered highest average postharvest losses, while
senescence/over-mature (2.0%) had an average postharvest loss on the lower bracket. The
average actual postharvest loss of tomatoes after eight (8) days was 14%.
The postharvest losses after 12 days were also worked out and it was found that the lower
valley had maximum loss (26%) in tomato, followed by mid-valley (16%) and upper
valley (12%). It was ascertained that even after 12 days, on average, 7.3% of tomatoes
were still green. Other average losses were registered by pest/disease (6.0%) and
senescence/over-mature (4.7%). The average loss in tomatoes after 12 days was registered
as 18%.
This was a very interesting data obtained about perceived and actual postharvest loss,
which is challenging the traditional view that Fiji farmers are often poorly connected with
market-based postharvest losses. The actual postharvest loss in tomatoes observed after
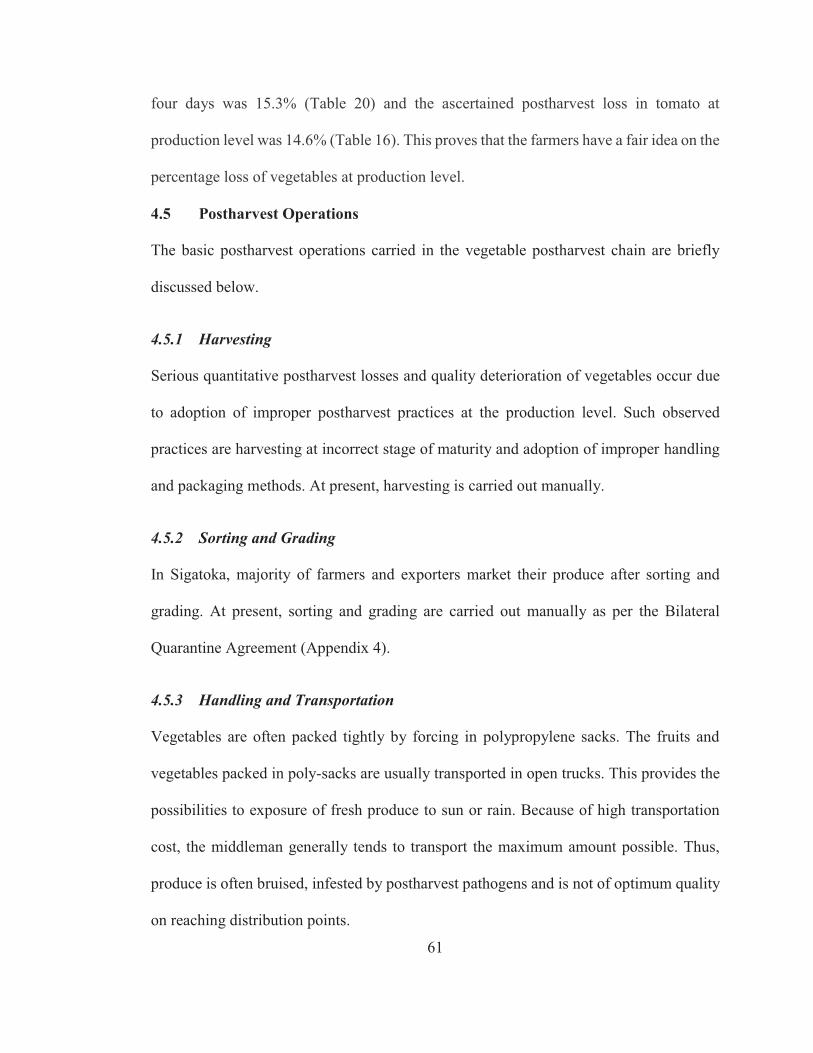
61
four days was 15.3% (Table 20) and the ascertained postharvest loss in tomato at
production level was 14.6% (Table 16). This proves that the farmers have a fair idea on the
percentage loss of vegetables at production level.
4.5 Postharvest Operations
The basic postharvest operations carried in the vegetable postharvest chain are briefly
discussed below.
4.5.1 Harvesting
Serious quantitative postharvest losses and quality deterioration of vegetables occur due
to adoption of improper postharvest practices at the production level. Such observed
practices are harvesting at incorrect stage of maturity and adoption of improper handling
and packaging methods. At present, harvesting is carried out manually.
4.5.2 Sorting and Grading
In Sigatoka, majority of farmers and exporters market their produce after sorting and
grading. At present, sorting and grading are carried out manually as per the Bilateral
Quarantine Agreement (Appendix 4).
4.5.3 Handling and Transportation
Vegetables are often packed tightly by forcing in polypropylene sacks. The fruits and
vegetables packed in poly-sacks are usually transported in open trucks. This provides the
possibilities to exposure of fresh produce to sun or rain. Because of high transportation
cost, the middleman generally tends to transport the maximum amount possible. Thus,
produce is often bruised, infested by postharvest pathogens and is not of optimum quality
on reaching distribution points.
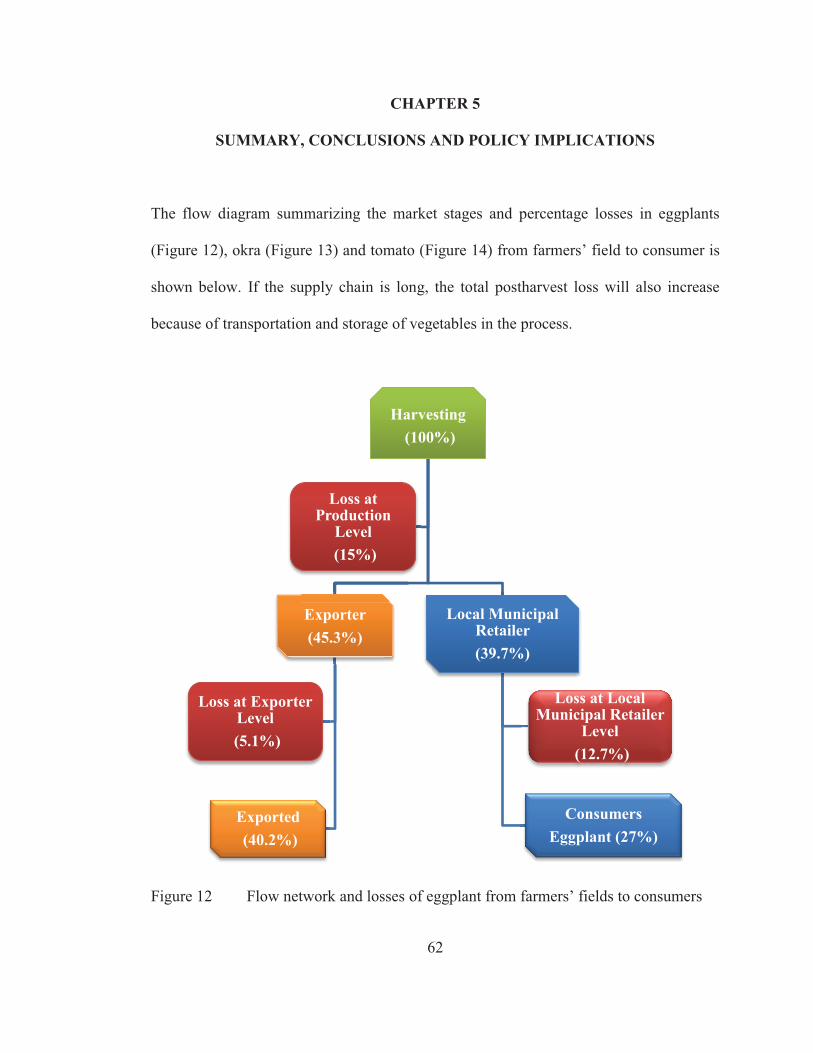
62
CHAPTER 5
SUMMARY, CONCLUSIONS AND POLICY IMPLICATIONS
The flow diagram summarizing the market stages and percentage losses in eggplants
(Figure 12), okra (Figure 13) and tomato (Figure 14) from farmers’ field to consumer is
shown below. If the supply chain is long, the total postharvest loss will also increase
because of transportation and storage of vegetables in the process.
Figure 12 Flow network and losses of eggplant from farmers’ fields to consumers
Harvesting
(100%)
Exporter
(45.3%)
Exported
(40.2%)
Loss at Exporter Level
(5.1%)
Local Municipal Retailer
(39.7%)
Consumers
Eggplant (27%)
Loss at Local Municipal Retailer
Level
(12.7%)
Loss at Production
Level
(15%)
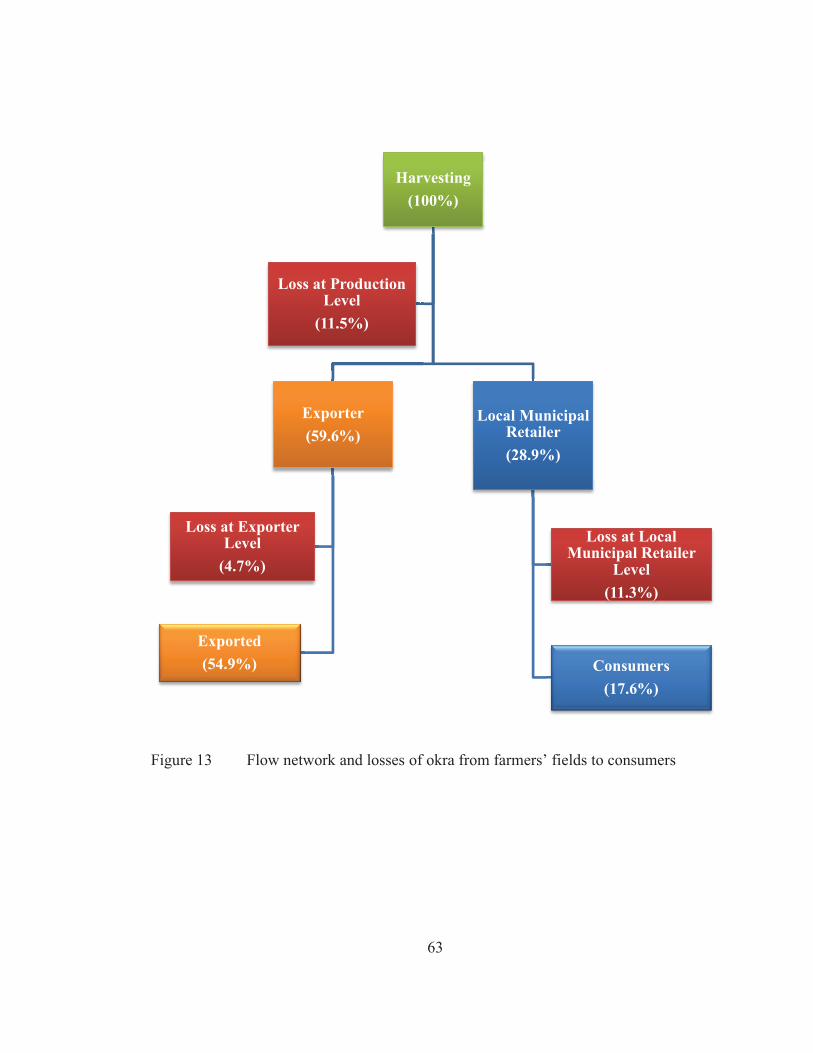
63
Figure 13 Flow network and losses of okra from farmers’ fields to consumers
Harvesting
(100%)
Exporter
(59.6%)
Exported
(54.9%)
Loss at Exporter Level
(4.7%)
Local Municipal Retailer
(28.9%)
Consumers
(17.6%)
Loss at Local Municipal Retailer
Level
(11.3%)
Loss at Production Level
(11.5%)
64
Figure 14 Flow network and losses of tomato from farmers’ fields to consumers
Harvesting
(100%)
Local Municipal Retailer
(85.4%)
Consumers
(74.2%)
Loss
(11.2%)
Loss at Production Level
(14.6%)
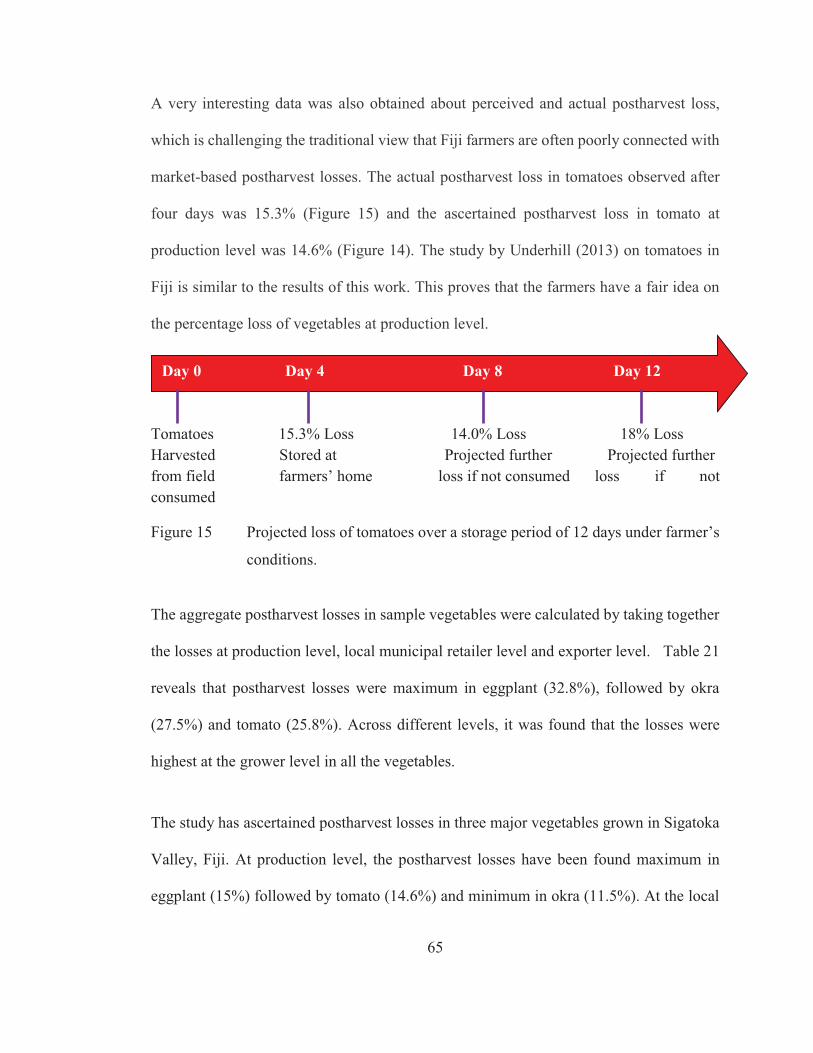
65
A very interesting data was also obtained about perceived and actual postharvest loss,
which is challenging the traditional view that Fiji farmers are often poorly connected with
market-based postharvest losses. The actual postharvest loss in tomatoes observed after
four days was 15.3% (Figure 15) and the ascertained postharvest loss in tomato at
production level was 14.6% (Figure 14). The study by Underhill (2013) on tomatoes in
Fiji is similar to the results of this work. This proves that the farmers have a fair idea on
the percentage loss of vegetables at production level.
Tomatoes 15.3% Loss 14.0% Loss 18% Loss Harvested Stored at Projected further Projected further from field farmers’ home loss if not consumed loss if not consumed
Figure 15 Projected loss of tomatoes over a storage period of 12 days under farmer’s
conditions.
The aggregate postharvest losses in sample vegetables were calculated by taking together
the losses at production level, local municipal retailer level and exporter level. Table 21
reveals that postharvest losses were maximum in eggplant (32.8%), followed by okra
(27.5%) and tomato (25.8%). Across different levels, it was found that the losses were
highest at the grower level in all the vegetables.
The study has ascertained postharvest losses in three major vegetables grown in Sigatoka
Valley, Fiji. At production level, the postharvest losses have been found maximum in
eggplant (15%) followed by tomato (14.6%) and minimum in okra (11.5%). At the local
Day 0 Day 4 Day 8 Day 12
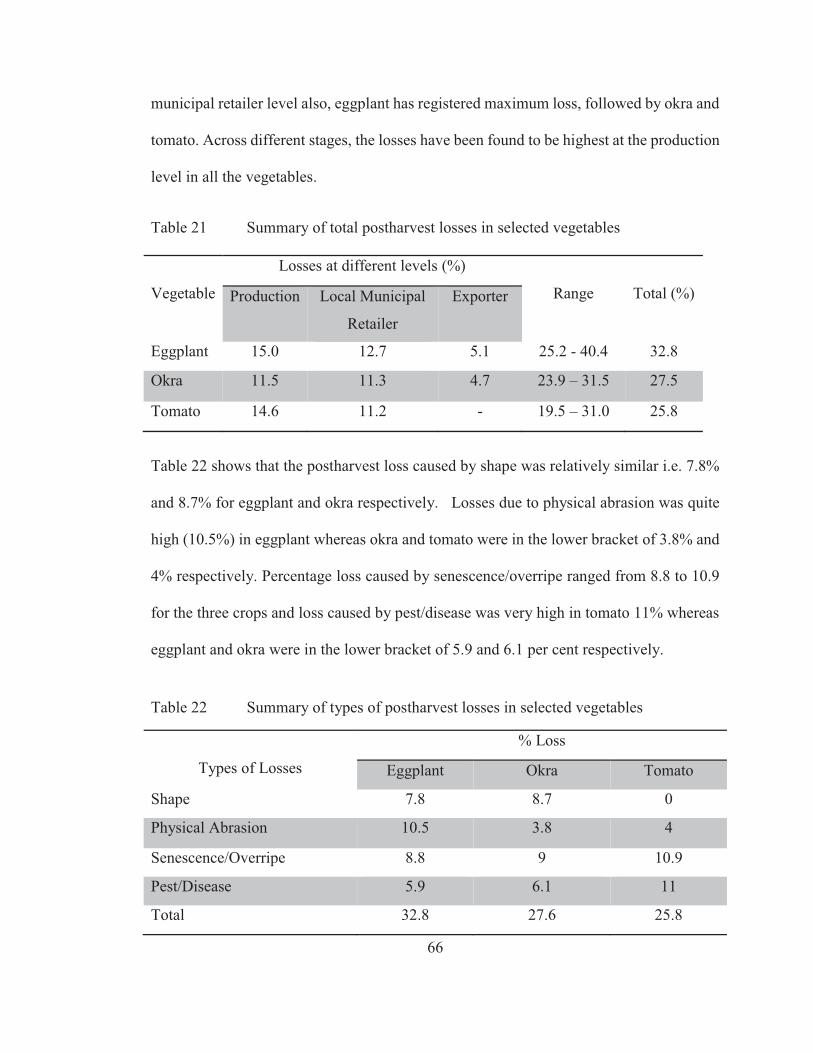
66
municipal retailer level also, eggplant has registered maximum loss, followed by okra and
tomato. Across different stages, the losses have been found to be highest at the production
level in all the vegetables.
Table 21 Summary of total postharvest losses in selected vegetables
Vegetable
Losses at different levels (%)
Range
Total (%) Production Local Municipal
Retailer
Exporter
Eggplant 15.0 12.7 5.1 25.2 - 40.4 32.8
Okra 11.5 11.3 4.7 23.9 – 31.5 27.5
Tomato 14.6 11.2 - 19.5 – 31.0 25.8
Table 22 shows that the postharvest loss caused by shape was relatively similar i.e. 7.8%
and 8.7% for eggplant and okra respectively. Losses due to physical abrasion was quite
high (10.5%) in eggplant whereas okra and tomato were in the lower bracket of 3.8% and
4% respectively. Percentage loss caused by senescence/overripe ranged from 8.8 to 10.9
for the three crops and loss caused by pest/disease was very high in tomato 11% whereas
eggplant and okra were in the lower bracket of 5.9 and 6.1 per cent respectively.
Table 22 Summary of types of postharvest losses in selected vegetables
Types of Losses
% Loss
Eggplant Okra Tomato
Shape 7.8 8.7 0
Physical Abrasion 10.5 3.8 4
Senescence/Overripe 8.8 9 10.9
Pest/Disease 5.9 6.1 11
Total 32.8 27.6 25.8
67
The reject loss of vegetables across the postharvest chain is thought to result from lack of
knowledge about proper postharvest management. Improper grading, packing, lack of
storage and inadequate transportation facilities contribute more to the problem. One of the
most important types of postharvest losses is harvest at inappropriate maturity, resulting
in erratic ripening and poor quality.
Based on the findings of this study, the following recommendations are made for policy
actions to reduce the postharvest losses in vegetables.
1) Provision of appropriate storage facilities, such as holding areas with adequate
ventilation, low temperatures, to store the produce at production level and also at
local municipal retailer level to reduce the losses that occur.
2) Training initiatives for the vegetable growers and local municipal retailers on
scientific postharvest techniques should be encouraged and follow ups, feedback
and adoption measurement should be conducted periodically for sustainability.
3) Roads linking farms to market should be improved to reduce physical abrasion.
4) Establishment of producer co-operatives to handle various activities relating to
production and marketing of vegetables. This will not only help reduce the
postharvest losses but will also increase the bargaining power of growers in
marketing. It will help them in adopting consumer-oriented approach to vegetable
marketing.
68
5) Promoting packaging methods and transportation – a national level project to
distribute plastic crates and to modify transportation vehicles on a subsidised rate
for the reduction of postharvest losses in vegetables.
6) Establishment of cottage industries such as vacuum packing, drying or canning of
vegetables should be encouraged.
7) Enhancing research capabilities of institutions engaged in postharvest research
and development activities.
A number of deficiencies currently exist in the postharvest management and processing of
vegetables in Fiji. Action must be taken in order to upgrade systems, in order to reduce the
levels of postharvest losses in Fiji. In a civilised world, when millions go hungry, it would
be a crime to allow postharvest losses to continue. It is unfortunate that in Fiji, policy
makers and planners set targets for increased production without making any effort to
reduce postharvest losses.
Expenditure on crop production is required on an annual basis, while the establishment of
infrastructural facilities for postharvest operations is a onetime capital investment which
must be undertaken and compensated for by the annual savings from reducing postharvest
losses. Proper infrastructure, logistics and management and human resources are essential
to improving postharvest management and marketing of fruits and vegetables.
69
It is not possible to survive in this era of globalisation by employing traditional farming
techniques only. Geographically, Fiji is a small country with limited land resources. The
availability of cultivable land is decreasing proportionately with increasing population.
The country must therefore increase its productivity, diversify its agricultural production
base and increase value addition through the processing of farm products.
Efforts must be made to strengthen the postharvest sector through intensive investment in
research and development. The food industry must focus on the production of quality
products for both the domestic and export markets. The economy of the country will be
strengthened through quality improvement, increased production, increased market share
and greater foreign exchange earnings derived from increased export of fresh and
processed fruits and vegetables.
70
REFERENCES
Abbott, J. A. (1999). Quality measurement of fruits and vegetables. Postharvest Biology
and Technology, 15(3), 207-225. Agra-Business and Trade Promotion Multi-Purpose Co-operative (ABTRACO, 2003). A
Summary of the Findings and Recommendations of the Study on Promotion of Marketing of Selected High Value Agricultural Commodities to Bangladesh and Tibet Markets, Anam Nagar, Kathmandu.
Agriculture Fiji (Online). Available at: http://www.un.org/esa/agenda21/natlinfo/countr/fiji/agriculture.pdf (Accessed, September 20, 2012)
Ahsan, H. (2005). India Country Paper. In: Proceedings of the APO seminar on Marketing and Food Safety: Challenges in Postharvest Management of Agricultural/ Horticultural Products in Islamic Republic of Iran, 23–28 July 2005, Asian Productivity Organization, 2006, Pp 131-134.
Anjum, M. I., Awan, I. A. (2005). Pakistan Country Paper. In: Proceedings of the APO
seminar on Marketing and Food Safety: Challenges in Postharvest Management of Agricultural/ Horticultural Products in Islamic Republic of Iran, 23–28 July 2005, Asian Productivity Organization, 2006, Pp 209-211.
Bajracharya, A. 2000. An Overview of Postharvest Handling Activities in MARD Project Areas. Budiastra I.W and H.K Purwadaria. (1995). Post Harvest Handling of Vegetable and Fruit
in Packing House. Training Material on Postharvest of Fruits and Vegetables, Bogor. (In Indonesian)
Castro, L. R., Vigneault, C., Charles, M. T. & Cortez, L. A. (2005). Effect of cooling delay and cold-chain breakage on ‘Santa Clara’ tomato. Journal of Food Agriculture and Environment, 3, 49-54.
Choudhury, M. L. (2004). Recent Developments in Reducing Postharvest Losses in the Asia Pacific Region. In: Proceedings of the APO seminar on Reduction of Postharvest Losses of Fruit and Vegetables, held in India, 5–11 October 2004, Asian Productivity Organization, 2006, Pp 15 - 22.
Cyril, S. D. P. (2004). Sri Lanka Country Paper. In: Proceedings of the APO seminar on
Reduction of Postharvest Losses of Fruit and Vegetables, held in India, 5–11 October 2004, Asian Productivity Organization, 2006, Pp 252-255.
De Lucia, M. & Assennato, D. (1994). Agricultural engineering in development: postharvest operations and management of food grains (Publication. Retrieved
71
August 25, 2012, from FAO: http://www.fao.org/inpho/pp-dr/pp-arch/full-doc/frame-e.htm)
Doza, A. F. B. (2005). Bangladesh Country Paper. In: Proceedings of the APO seminar on Marketing and Food Safety: Challenges in Postharvest Management of Agricultural/ Horticultural Products in Islamic Republic of Iran, 23–28 July 2005, Asian Productivity Organization, 2006, Pp 105-108.
FAO. World Hunger Statistics, (2010), Available at: http://www.fao.org (Accessed, March 25, 2013)
FAO. (2011). Global Food Losses and Waste. Extent, Causes and Prevention. (available at http://www.fao.org/docrep/014/mbo6oe/mbo6oeoo.pdf)
FAO. (2006, 30 January – 3 February). Enhancing the Competitiveness of Agriculture and Natural Resource Management under Globalisation and Liberalisation to Promote Economic Growth. Paper presented at the Twenty-Fourth Regional Conference for Africa, Bamako, Mali.
Gajana, T.M., Murthy, D. Sreenivasa, Sudha, M. And Dakshinamoorty, V. (2006), Marketing and estimation of postharvest losses of crop in Karnataka. Indian Journal of Agricultural Marketing, 20 (1): 1-7.
Getinet, H., Seyoum, T. & Woldetsadik, k. (2008). The effect of cultivar, maturity stage and storage environment on quality of tomatoes. Journal of Food Engineering, 87(4), 467-478.
Google earth. (2012). Fiji (Online). Available at: http://www.googleearth.com/Fiji (Accessed, October 01, 2012)
Google. (2013). Map of Fiji (Online). Available at: http://www.fijimaps.com/ (Accessed, March 10, 2013)
Haryanto, B., Rochani, A. (2004). Indonesia Country Paper. In: Proceedings of the APO seminar on Reduction of Postharvest Losses of Fruit and Vegetables, held in India, 5–11 October 2004, Asian Productivity Organization, 2006, Pp 158-161.
HMG/N and ADB/N, (1991). Master Plan for Horticulture Development. Nepal. Kaini, B. R. (2000). Country Paper on Postharvest Techniques for Horticultural Crops in
Nepal, In Report of the APO Seminar on appropriate Technologies for Horticultural Crops, held in Bangkok from 5–9 July 1999. Asian Productivity Organization, 2000, pp11– 218.
Karim, A. and Wee, M.M.B. (1996) Reducing post harvest losses in vegetables. In:
Proceedings of Workshop on Vegetable Crops Agribusiness, held at BARC, Farm Gate, Dhaka. 2-4 May.
72
Kumar, D. K, Basavaraja, H. and Mahajanshetti, S. B. (2006). An economic analysis of
postharvest losses in vegetables in Karnataka. Indian Journal of Agricultural Economics, 61 (1): 134-146.
Kumar, V. (2004). Fiji Country Paper. In: Proceedings of the APO seminar on Reduction
of Postharvest Losses of Fruit and Vegetables, held in India, 5–11 October 2004, Asian Productivity Organization, 2006, Pp 123 - 128.
La Gra, Jerry (1990). A Commodity System Assessment Methodology for Problem and Project Identification. Moscow, Idaho: University of Idaho, College of Agriculture, Postharvest Institute for Perishables.
Liu, F.W. (1999). Post harvest handling in Asia 2. Horticultural crops. Food and Fertilizer Technology Center, Taipei, Taiwan.
Lizada, MCC. (1990). Postharvest Losses in and Loss Assessment Methods for Fruits,
Vegetables and Cutflowers. Paper presented during the Forum – Workshop on Postharvest Losses and Loss Assessment Methods, 21 May 1990. DA-ATI Conference Room, Quezon City.
MAF-BAEcon. (1985). Statistical Handbook in Agriculture. Statistical Handbook No. 1. Mangaoang, C.C. (1982). Losses of selected fruits and vegetables. Report: Research
Division, Technical Research and Extension Directorate, National Food Authority, Quezon City.
Mao, M. (2004). Cambodia Country Paper. In: Proceedings of the APO seminar on
Reduction of Postharvest Losses of Fruit and Vegetables, held in India, 5–11 October 2004, Asian Productivity Organization, 2006, Pp 111-114.
Marketing Development Division (MDD, 1999/2000). Marketing System Including
Packaging of Apple from Jumla, Harihar Bhawan, Lalitpur. Moghaddasi, R., Elaheh, M., Shariati, S. (2005). Islamic Republic of Iran Country Paper.
In: Proceedings of the APO seminar on Marketing and Food Safety: Challenges in Postharvest Management of Agricultural/ Horticultural Products in Islamic Republic of Iran, 23–28 July 2005, Asian Productivity Organization, 2006, Pp 164-168.
MPI (2010), Annual Report, Ministry of Primary Industries, Government of Fiji.
Nonnecke I. L. (1989). Vegetable Production, New York. Van Nostrand Reinhold publishers.
73
Pantastico, Er.B. (1979). Postharvest losses of fruits and vegetables in developing countries – An action program. Paper delivered during the SEARCA Professorial Chair Lecture held at PHTRC, 23 October 1979.
Paudel, K. B. (2004). Nepal Country Paper. In: Proceedings of the APO seminar on
Reduction of Postharvest Losses of Fruit and Vegetables, held in India, 5–11 October 2004, Asian Productivity Organization, 2006, Pp 191-196.
Paull, R. E. (1999). Effect of temperature and relative humidity on fresh commodity quality. Postharvest Biology and Technology, 15(3), 263-277.
Rapusas, R. S. (2004). Philippine Country Paper (2). In: Proceedings of the APO seminar on Reduction of Postharvest Losses of Fruit and Vegetables, held in India, 5–11 October 2004, Asian Productivity Organization, 2006, Pp 227-239.
Rolle, R. S. (2004). Improving Postharvest Management and Marketing in the Asia
Pacific Region: Issues and Challenges. In: Proceedings of the APO seminar on Reduction of Postharvest Losses of Fruit and Vegetables, held in India, 5–11 October 2004, Asian Productivity Organization, 2006, Pp 23 - 26.
Sharma, G., and Singh, S. P. (2011), Economic analysis of postharvest losses in marketing
of vegetables in Uttarakhand. Agricultural Economics Research Review, vol. 24 July-December 2011: 309-315.
Sharma, N.K., (2001/2002). Vegetable and Fruit Postharvest Technology. India.
Serrano, E. P. (2004). Philippine Country Paper (1). In: Proceedings of the APO seminar on Reduction of Postharvest Losses of Fruit and Vegetables, held in India, 5–11 October 2004, Asian Productivity Organization, 2006, Pp 215-217.
Setiajit, Dimyati, Ahmad and Sinung Basuki, Rofik 2003. Vertical and Horizontal
Integration for National Horticulture Products Marketing. Sirivatanapa, S. (2004). Packaging and Transportation of Fruits and Vegetables for better
Marketing. In: Proceedings of the APO seminar on Reduction of Postharvest Losses of Fruit and Vegetables, held in India, 5–11 October 2004, Asian Productivity Organization, 2006, Pp 43-48.
Thapa, M.J. and M.B. Shrestha, (2001/02). Study on Grading, Packaging and
Transportation of Orange. In Annual Report, Food Research Unit (Postharvest Research Programme). Nepal Agriculture Research Council, Khumaltar, Lalitpur, Nepal.
74
Tridjaya, N. O. (2005). Growing Fruit Processing Centers to Stimulate Quality Improvement and Value Added. Technical Meeting of Horticulture Mechanization. Agricultural Research and Development Agency. Jakarta. (In Indonesian)
Underhill, S. J. R. (2013). Postharvest horticultural losses along a commercial tomato
supply chain in Fiji. Pacific Agricultural Research for Development Initiative (PARDI).
United States Department of Agriculture –USDA (1963), Agricultural Handbook No. 8.
Van Dijk, C. & Tijskens, L. M. M. (2000). Mathematical modeling of enzymatic reactions as related to texture after storage and mild preheat treatment: In S. M. Alzamora, M. S. Tapia, & A. Lopez-Malo (Eds.), Minimally processed fruits and vegetables. Maryland, USA: Aspen Publishers.
Verma, L. R. and Joshi, V. K. (2000). Post Harvest Technology of Fruits and Vegetables. An Overview. In: Post Harvest Technology of Fruits and Vegetables. 1:68.
Werner, R.A. and Subedi D.K., 1991. Postharvest Losses Assessment in Selected
Vegetables in Nepal: Tomato, Cabbage, and Cauliflower. FAO-VDD/DOH-GCP/NEP/046/SWI, Kathmandu, Nepal.
Wikipedia. (2012). Fiji (Online). Available at: http://en.wikipedia.org/wiki/Fiji (Accessed, August 25, 2012)
Wills R., McGlasson B., Graham D., & Joyce D. (1998). Postharvest: An Introduction to the Physiology & Handling of Fruit, Vegetables & Ornamentals. Fourth edition.CAB International.
Yeshida, O., Nakagaua, H., Ogura, N. & Sato. (1984). Effect of heat treatment on the development of polygalacturonase activity in tomato fruit ripening. Plant Cell Physiology, 25(3), 500-509.

75
APPENDICES
Appendix 1
Questionnaire and Data Collection Sheet
PRODUCTION LEVEL
A. PERSONAL DETAILS
1. Name: __________________________________________
2. Location: ________________________________________
3. Occupation: ______________________________________
4. What is your age? (Please tick only one):
i. Less than 18 years
ii. Between 18 and 25 years
iii. Between 26 and 35 years
iv. Between 36 and 45 years
v. Between 46 and 55 years
vi. More than 55 years
5. Gender (Please tick only one):
Male Female
6. Marital Status (Please tick only one):
Single Married Widowed Divorced
7. What is your Education Level? (Please tick only one):
i. No Education Level
ii. Primary School
iii. Secondary School
iv. Post-Secondary/University
v. Others
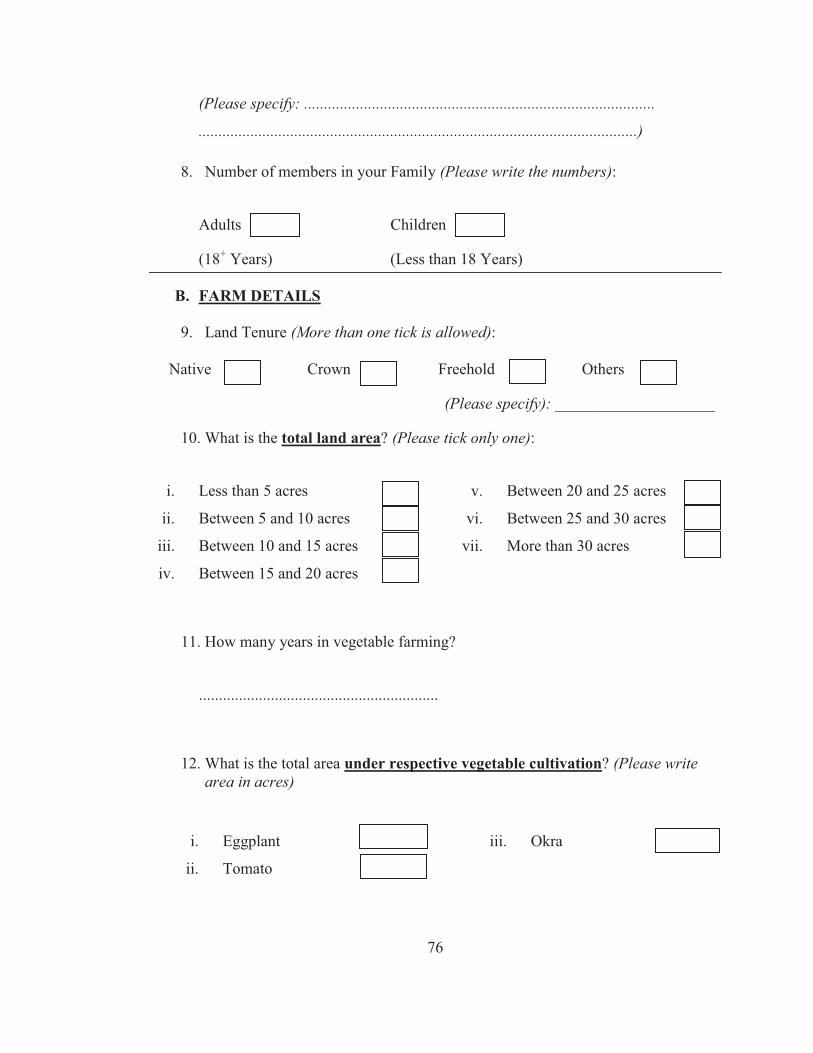
76
(Please specify: ........................................................................................
..............................................................................................................)
8. Number of members in your Family (Please write the numbers):
Adults Children
(18+ Years) (Less than 18 Years)
B. FARM DETAILS
9. Land Tenure (More than one tick is allowed):
Native Crown Freehold Others
(Please specify): ____________________
10. What is the total land area? (Please tick only one):
i. Less than 5 acres
ii. Between 5 and 10 acres
iii. Between 10 and 15 acres
iv. Between 15 and 20 acres
v. Between 20 and 25 acres
vi. Between 25 and 30 acres
vii. More than 30 acres
11. How many years in vegetable farming?
............................................................
12. What is the total area under respective vegetable cultivation? (Please write area in acres)
i. Eggplant
ii. Tomato
iii. Okra

77
13. What are some of the Problems faced by farmer? (Please tick)
a. Far off location of selling point
b. Transport facility (i) Inadequate (ii) Costly
c. Lack of Market Information
d. Malpractices of buyers
e. Lack of grading facility
f. Lack of packing facility
g. Lack of storage facility
h. Lack of cold shelf facility
i. Lack of financial assistance from any company or Government.
j. Delay in payment and sale proceeds
k. Others specify
…………………………………………………………………………………
…………………………………………………………………………………
…………………………………………………………………………………
…………………………………………………………………………………
14. What does your Marketing Agent tell you about your crop (i.e.any feedback on
postharvest quality)?
……………………………………………………………………………………
……………………………………………………………………………………
……………………………………………………………………………………
……………………………………………………………………………………
15. What are some suggestions for improvement?
……………………………………………………………………………………………
……………………………………………………………………………………………
……………………………………………………………………………………………
……………………………………………………………………………………………
……………………………………………………………………………………………
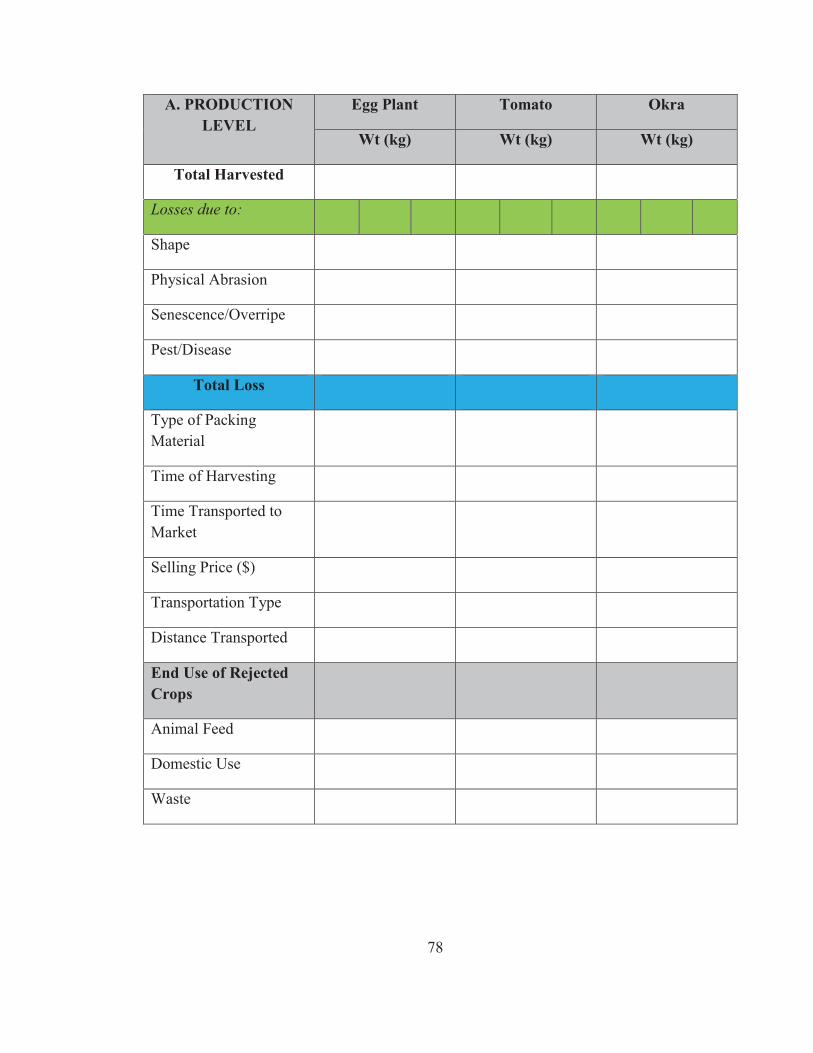
78
A. PRODUCTION
LEVEL
Egg Plant Tomato Okra
Wt (kg) Wt (kg) Wt (kg)
Total Harvested
Losses due to:
Shape
Physical Abrasion
Senescence/Overripe
Pest/Disease
Total Loss
Type of Packing Material
Time of Harvesting
Time Transported to Market
Selling Price ($)
Transportation Type
Distance Transported
End Use of Rejected
Crops
Animal Feed
Domestic Use
Waste

79
Appendix 2
Questionnaire and Data Collection Sheet
EXPORTER LEVEL
A. PERSONAL DETAILS
1. Name: __________________________________________
2. Location: ________________________________________
3. Occupation: ______________________________________
4. How many years in export business? __________________
5. What is your age? (Please tick only one):
i. Less than 18 years
ii. Between 18 and 25 years
iii. Between 26 and 35 years
iv. Between 36 and 45 years
v. Between 46 and 55 years
vi. More than 55 years
6. Gender (Please tick only one):
Male Female
7. Marital Status (Please tick only one):
Single Married Widowed Divorced

80
8. What is your Education Level? (Please tick only one):
i. No Education Level
ii. Primary School
iii. Secondary School
iv. Post-Secondary/University
v. Others
(Please specify: ........................................................................................
..............................................................................................................)
9. Number of members in your Family (Please write the numbers):
Adults Children
(18+ Years) (Less than 18 Years)

81
B. EXPORTER
LEVEL
Egg Plant Tomato Okra
Wt (kg) Wt (kg) Wt (kg)
Total Received
Losses due to:
Shape
Physical Abrasion
Senescence/Overripe
Pest/Disease
Total Loss
Type of Packing Material
Time Transported to Packing shed
Selling Price ($)
Transportation Type
Distance Transported
End Use of Rejected Crops
Animal Feed
Domestic Use
Waste

82
Appendix 3
Questionnaire and Data Collection Sheet
RETAILER LEVEL
A. PERSONAL DETAILS
1. Name: __________________________________________
2. Location: ________________________________________
3. Occupation: ______________________________________
4. How many years in retailing business? _________________
5. What is your age? (Please tick only one):
i. Less than 18 years
ii. Between 18 and 25 years
iii. Between 26 and 35 years
iv. Between 36 and 45 years
v. Between 46 and 55 years
vi. More than 55 years
6. Gender (Please tick only one):
Male Female
7. Marital Status (Please tick only one):
Single Married Widowed Divorced

83
8. What is your Education Level? (Please tick only one):
vi. No Education Level
vii. Primary School
viii. Secondary School
ix. Post-Secondary/University
x. Others
(Please specify: ........................................................................................
..............................................................................................................)
9. Number of members in your Family (Please write the numbers):
Adults Children
(18+ Years) (Less than 18 Years)

84
C. RETAILER
LEVEL
Egg Plant Tomato Okra
Wt (kg) Wt (kg) Wt (kg)
Total Purchased
Losses due to:
Shape
Physical Abrasion
Senescence/Overripe
Pest/Disease
Total Loss
Type of Storage Material
Selling Price ($)
End Use of Rejected Crops
Animal Feed
Domestic Use
Waste
85
Appendix 4
THE FIJI QUARANTINE PATHWAY
Bilateral Quarantine Agreement (BQA)
Following establishment of the High Temperature Forced Air (HTFA) treatment, a
Bilateral Quarantine Agreement (BQA) was signed by NZMAF. This agreement
necessitates that Fiji facilitate technical requirements of pest risk management in
accordance with requirements of the importing country. As a follow up to the establishment
of this BQA, an export pathway for fruits and vegetable destined for export to New Zealand
was developed.
Grower and Site Registration Growers who produce eggplants for export to New Zealand
are required to sign a declaration. These growers and their production sites are
subsequently registered by the Fijian Ministry of Agriculture, who provides them with a
grower number. Grower and exporter records are subsequently retained by the Extension
and Quarantine Division of the Ministry of Agriculture.
Field Control Measures
Field Hygiene Growers ensure that eggplants and other fruit fly hosts, crops that are ripe,
overripe (not needed for use), and that have fallen in the field, or discarded during
harvesting, are removed from the registered site and surrounding area and disposed off in
the proper manner.
86
Harvest Growers only harvest eggplants for export to New Zealand from the registered
sites. Only sound eggplants are harvested using proper techniques. Harvested eggplants are
taken to the exporter’s pack house for grading in well-secured grower numbered bins.
Exporter/Pack house All export pack houses are registered and licensed by Fiji’s
Agriculture Quarantine Division.
Grading and Selection Pack houses maintain daily records of growers who supply
eggplants for packing. All eggplants (100%) supplied by growers for export to New
Zealand are inspected for the presence of fruit fly eggs, larvae and pupa and for symptoms
of their presence. Eggplants which are bruised or which contain soft-spots, skin punctures,
stings, infestation from other quarantine pests, and decay are rejected for export to New
Zealand. All records are maintained by the exporter and made available for inspection to
the Fiji Agriculture Quarantine Division.
Inspection Procedures Staff of the Quarantine section of the Ministry of Agriculture
undertakes thorough inspection of eggplants supplied on a grower basis after the pack
house staff have completed their inspection and grading. Eggplants with bruises, soft spots,
skin punctures, stings, infections and infestation by pests, signs of decay and suspect fruits
are rejected. The exporter ensures that the eggplants are transferred promptly to the High
Temperature Forced Air Chamber with a complete transfer slip/form. Fruit fly surveillance
and monitoring is carried out in the production area.
87
Treatment Facility/Quarantine Inspection & Post Treatment Security Eggplants graded by
HTFA staff are further inspected by Agriculture Quarantine staff, following which they are
treated in the chamber in accordance with the Quarantine Procedures Manual for the
operation of the chamber.
Phytosanitary Certificate On completion of the treatment a further inspection is carried out
prior to the issuance of an International Phytosanitary Certificate.
(Source: Ministry of Agriculture Sugar and Land Resettlement, “Fiji commodity pathway procedures for New Zealand”, Technical paper, Fiji.)
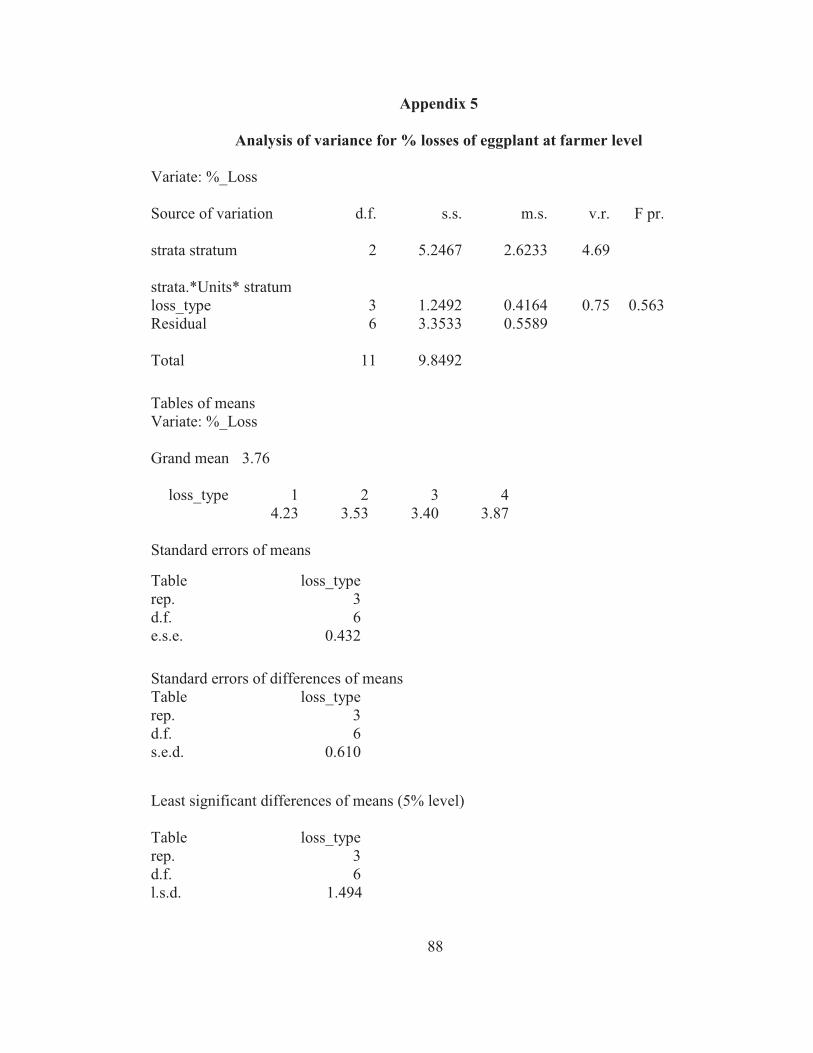
88
Appendix 5
Analysis of variance for % losses of eggplant at farmer level
Variate: %_Loss Source of variation d.f. s.s. m.s. v.r. F pr. strata stratum 2 5.2467 2.6233 4.69 strata.*Units* stratum loss_type 3 1.2492 0.4164 0.75 0.563 Residual 6 3.3533 0.5589 Total 11 9.8492 Tables of means Variate: %_Loss Grand mean 3.76 loss_type 1 2 3 4 4.23 3.53 3.40 3.87 Standard errors of means Table loss_type rep. 3 d.f. 6 e.s.e. 0.432 Standard errors of differences of means Table loss_type rep. 3 d.f. 6 s.e.d. 0.610 Least significant differences of means (5% level) Table loss_type rep. 3 d.f. 6 l.s.d. 1.494
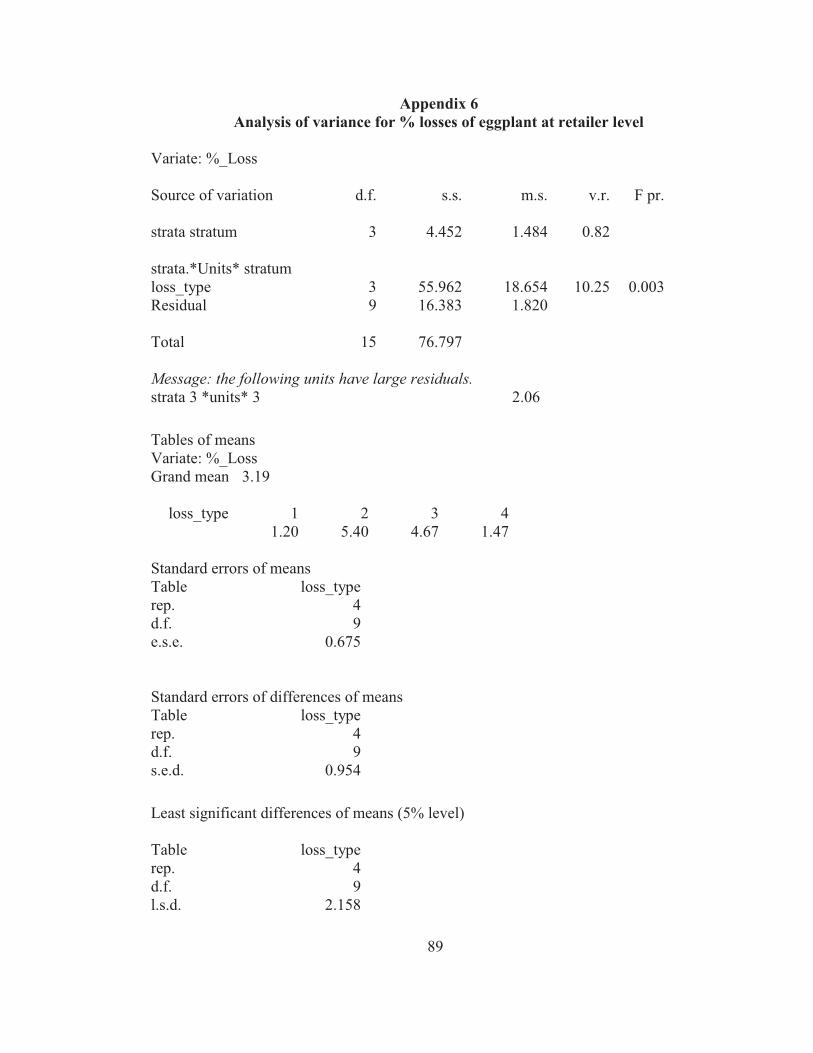
89
Appendix 6
Analysis of variance for % losses of eggplant at retailer level
Variate: %_Loss Source of variation d.f. s.s. m.s. v.r. F pr. strata stratum 3 4.452 1.484 0.82 strata.*Units* stratum loss_type 3 55.962 18.654 10.25 0.003 Residual 9 16.383 1.820 Total 15 76.797 Message: the following units have large residuals. strata 3 *units* 3 2.06 Tables of means Variate: %_Loss Grand mean 3.19 loss_type 1 2 3 4 1.20 5.40 4.67 1.47 Standard errors of means Table loss_type rep. 4 d.f. 9 e.s.e. 0.675 Standard errors of differences of means Table loss_type rep. 4 d.f. 9 s.e.d. 0.954 Least significant differences of means (5% level) Table loss_type rep. 4 d.f. 9 l.s.d. 2.158
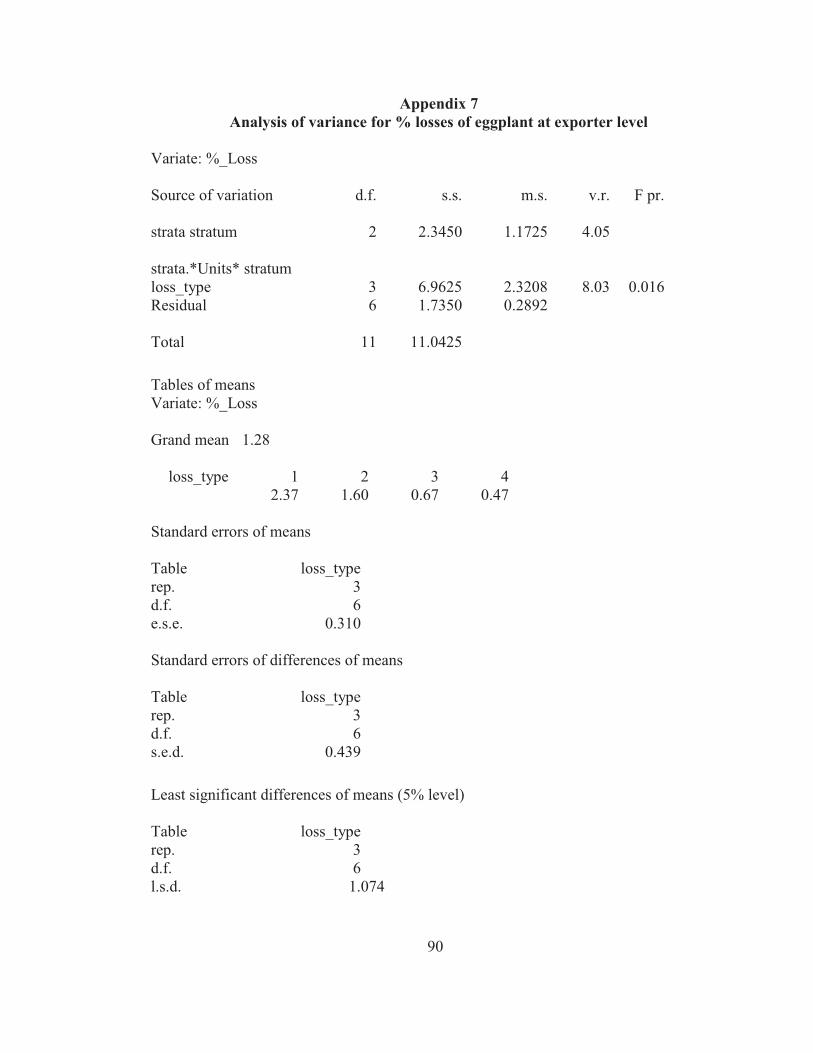
90
Appendix 7
Analysis of variance for % losses of eggplant at exporter level
Variate: %_Loss Source of variation d.f. s.s. m.s. v.r. F pr. strata stratum 2 2.3450 1.1725 4.05 strata.*Units* stratum loss_type 3 6.9625 2.3208 8.03 0.016 Residual 6 1.7350 0.2892 Total 11 11.0425 Tables of means Variate: %_Loss Grand mean 1.28 loss_type 1 2 3 4 2.37 1.60 0.67 0.47 Standard errors of means Table loss_type rep. 3 d.f. 6 e.s.e. 0.310 Standard errors of differences of means Table loss_type rep. 3 d.f. 6 s.e.d. 0.439 Least significant differences of means (5% level) Table loss_type rep. 3 d.f. 6 l.s.d. 1.074
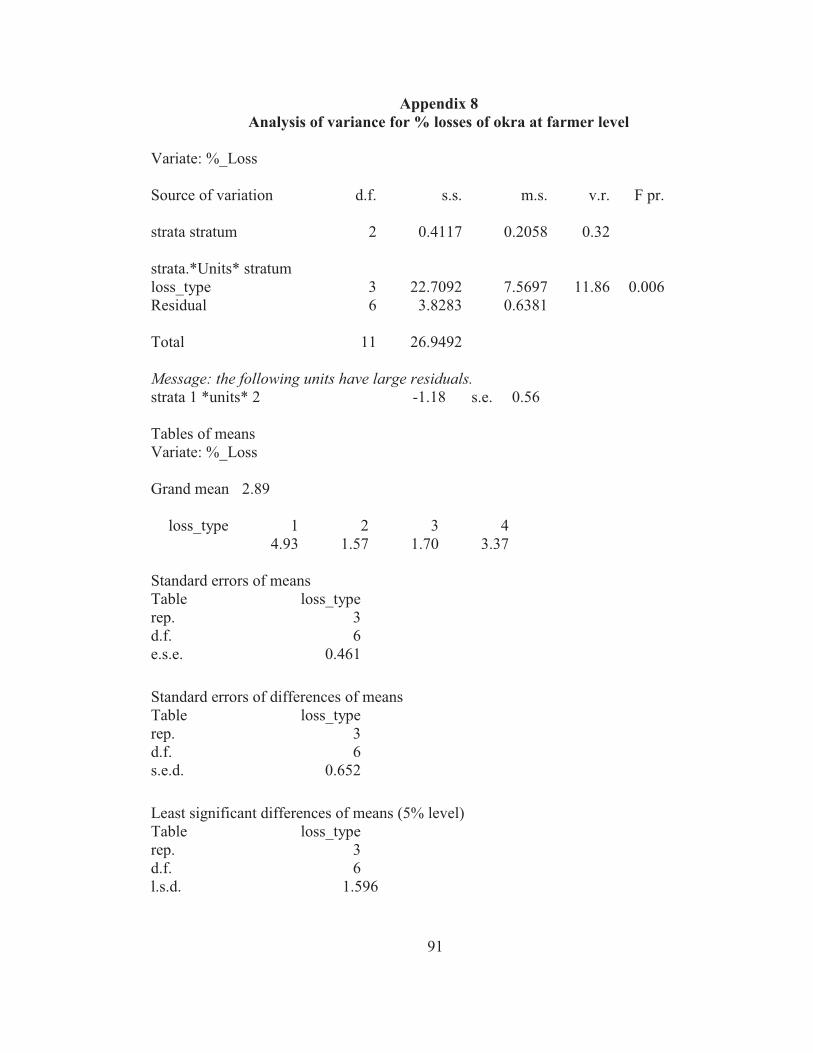
91
Appendix 8
Analysis of variance for % losses of okra at farmer level
Variate: %_Loss Source of variation d.f. s.s. m.s. v.r. F pr. strata stratum 2 0.4117 0.2058 0.32 strata.*Units* stratum loss_type 3 22.7092 7.5697 11.86 0.006 Residual 6 3.8283 0.6381 Total 11 26.9492 Message: the following units have large residuals. strata 1 *units* 2 -1.18 s.e. 0.56 Tables of means Variate: %_Loss Grand mean 2.89 loss_type 1 2 3 4 4.93 1.57 1.70 3.37 Standard errors of means Table loss_type rep. 3 d.f. 6 e.s.e. 0.461 Standard errors of differences of means Table loss_type rep. 3 d.f. 6 s.e.d. 0.652 Least significant differences of means (5% level) Table loss_type rep. 3 d.f. 6 l.s.d. 1.596
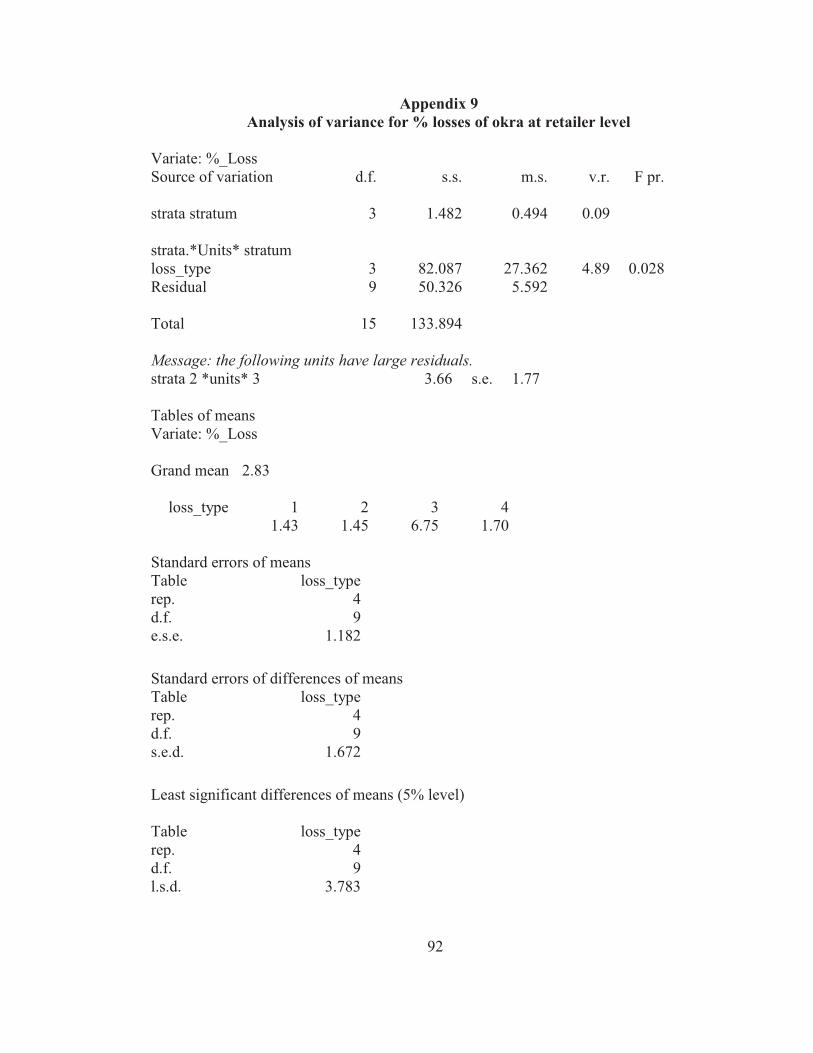
92
Appendix 9
Analysis of variance for % losses of okra at retailer level
Variate: %_Loss Source of variation d.f. s.s. m.s. v.r. F pr. strata stratum 3 1.482 0.494 0.09 strata.*Units* stratum loss_type 3 82.087 27.362 4.89 0.028 Residual 9 50.326 5.592 Total 15 133.894 Message: the following units have large residuals. strata 2 *units* 3 3.66 s.e. 1.77 Tables of means Variate: %_Loss Grand mean 2.83 loss_type 1 2 3 4 1.43 1.45 6.75 1.70 Standard errors of means Table loss_type rep. 4 d.f. 9 e.s.e. 1.182 Standard errors of differences of means Table loss_type rep. 4 d.f. 9 s.e.d. 1.672 Least significant differences of means (5% level) Table loss_type rep. 4 d.f. 9 l.s.d. 3.783
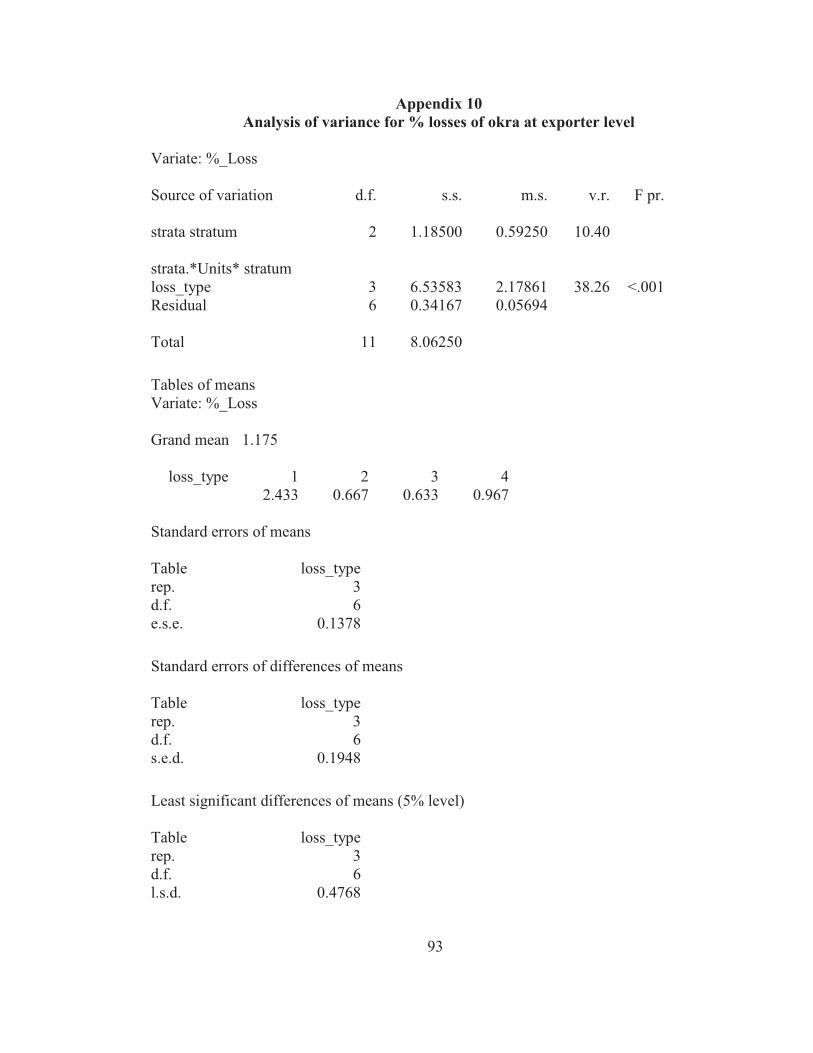
93
Appendix 10
Analysis of variance for % losses of okra at exporter level
Variate: %_Loss Source of variation d.f. s.s. m.s. v.r. F pr. strata stratum 2 1.18500 0.59250 10.40 strata.*Units* stratum loss_type 3 6.53583 2.17861 38.26 <.001 Residual 6 0.34167 0.05694 Total 11 8.06250 Tables of means Variate: %_Loss Grand mean 1.175 loss_type 1 2 3 4 2.433 0.667 0.633 0.967 Standard errors of means Table loss_type rep. 3 d.f. 6 e.s.e. 0.1378 Standard errors of differences of means Table loss_type rep. 3 d.f. 6 s.e.d. 0.1948 Least significant differences of means (5% level) Table loss_type rep. 3 d.f. 6 l.s.d. 0.4768
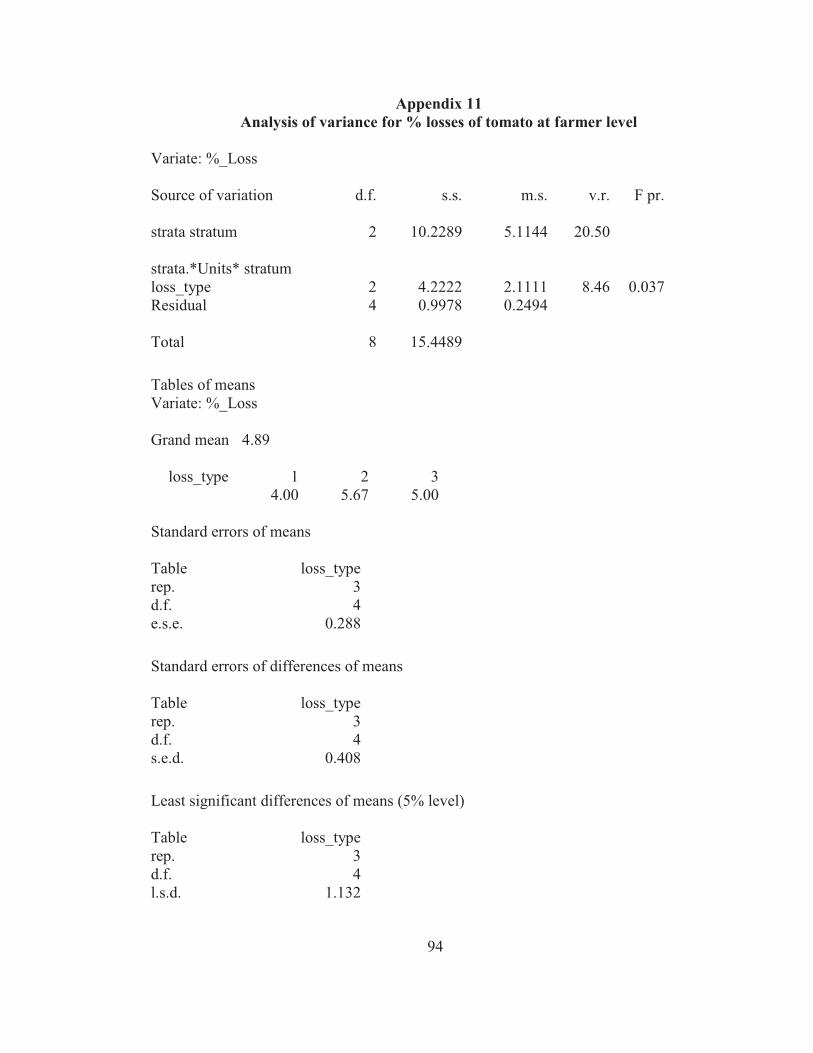
94
Appendix 11
Analysis of variance for % losses of tomato at farmer level
Variate: %_Loss Source of variation d.f. s.s. m.s. v.r. F pr. strata stratum 2 10.2289 5.1144 20.50 strata.*Units* stratum loss_type 2 4.2222 2.1111 8.46 0.037 Residual 4 0.9978 0.2494 Total 8 15.4489 Tables of means Variate: %_Loss Grand mean 4.89 loss_type 1 2 3 4.00 5.67 5.00 Standard errors of means Table loss_type rep. 3 d.f. 4 e.s.e. 0.288 Standard errors of differences of means Table loss_type rep. 3 d.f. 4 s.e.d. 0.408 Least significant differences of means (5% level) Table loss_type rep. 3 d.f. 4 l.s.d. 1.132
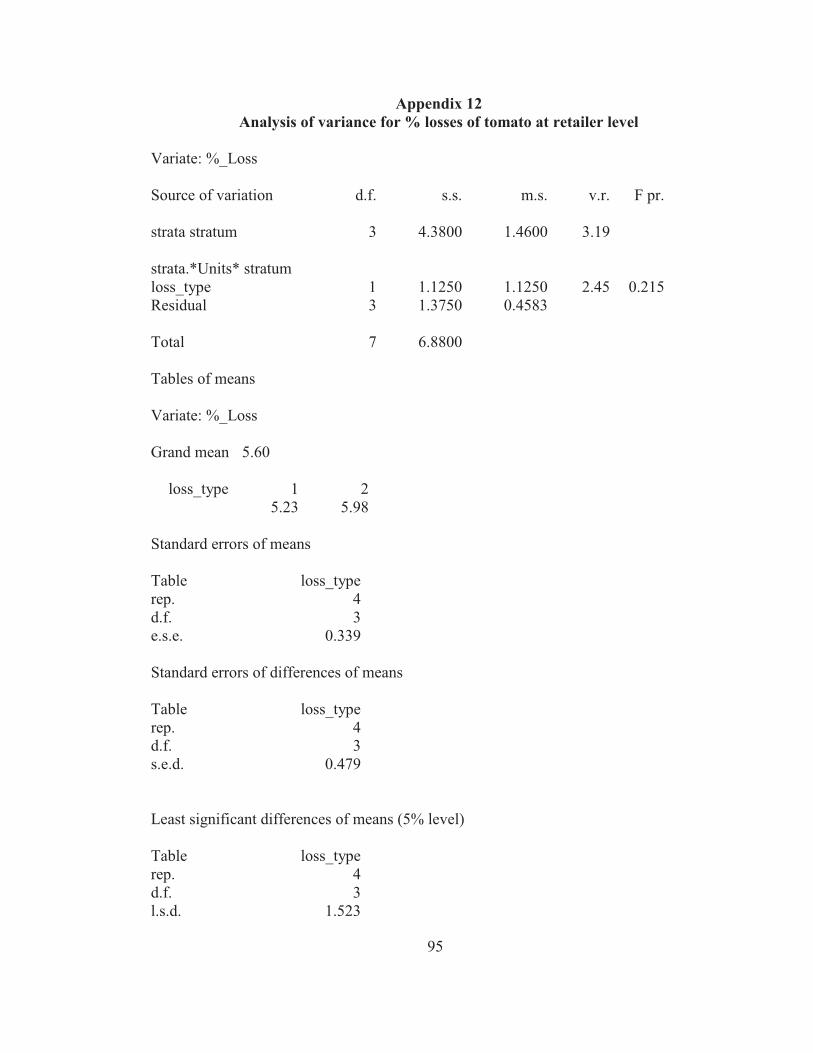
95
Appendix 12
Analysis of variance for % losses of tomato at retailer level
Variate: %_Loss Source of variation d.f. s.s. m.s. v.r. F pr. strata stratum 3 4.3800 1.4600 3.19 strata.*Units* stratum loss_type 1 1.1250 1.1250 2.45 0.215 Residual 3 1.3750 0.4583 Total 7 6.8800 Tables of means Variate: %_Loss Grand mean 5.60 loss_type 1 2 5.23 5.98 Standard errors of means Table loss_type rep. 4 d.f. 3 e.s.e. 0.339 Standard errors of differences of means Table loss_type rep. 4 d.f. 3 s.e.d. 0.479 Least significant differences of means (5% level) Table loss_type rep. 4 d.f. 3 l.s.d. 1.523