Post-Retirement Experiences of Individuals 85+ Years Old...Post-Retirement Experiences of...
137
Post-Retirement Experiences of Individuals 85+ Years Old: A Report of Surveys of Individuals Ages 85 and Over and Adult Children with Parents 85 and Over May 2018
Transcript of Post-Retirement Experiences of Individuals 85+ Years Old...Post-Retirement Experiences of...

Post-Retirement Experiences of Individuals 85+ Years Old: A Report of Surveys of Individuals Ages 85 and Over and Adult Children with Parents 85 and Over
May 2018

2
2
Post-Retirement Experiences of Individuals 85+ Years Old: A Report of Surveys of Individuals Ages 85 and Over and Adult Children with Parents 85 and Over
Caveat and Disclaimer The opinions expressed and conclusions reached by the authors are their own and do not represent any official position or opinion of the Society of Actuaries or its members. The Society of Actuaries makes no representation or warranty to the accuracy of the information Copyright © 2018 by the Society of Actuaries. All rights reserved.
AUTHOR
Greenwald & Associates, Inc.
SPONSOR Society of Actuaries

3
3
CONTENTS
EXECUTIVE SUMMARY .......................................................................................................... 4
IMPLICATIONS AND PERSPECTIVES ................................................................................... 8
BACKGROUND .......................................................................................................................... 14
OVERVIEW OF SURVEY FINDINGS ...................................................................................... 18
SURVEY FINDINGS ................................................................................................................... 23
Feelings about Adequacy of Finances ................................................................................... 23
Income and Spending ............................................................................................................. 34
Housing .................................................................................................................................. 45
Health and Family Support ................................................................................................... 50
Long-Term Care .................................................................................................................... 68
PROFILE OF SURVEY RESPONDENTS .................................................................................. 81
APPENDIX A: TABLE OF CHARTS ......................................................................................... 86
APPENDIX B: POSTED QUESTIONNAIRES .......................................................................... 92

4
4
EXECUTIVE SUMMARY
The Society of Actuaries’ (SOA) Post-Retirement Experiences of Individuals 85+ Years Old provides insights into how the retirement experience unfolds in the later years of life, surveying those ages 85 and over and their adult children. Research has involved both quantitative and in-depth interview studies of these respondents and builds on prior work to examine the financial and life journeys that retirees have experienced. Because of the advanced age of these respondents this research studied a combination of the elderly and adult children of elderly so that those who were not well enough to participate in the research could be represented. Since its inception almost 20 years ago, the SOA’s Committee on Post-Retirement Needs and Risks has studied the issues that middle-income Americans deal with the objective of improving the management of issues older Americans face. The results of this research have been communicated to the public, actuaries, public policy makers, plan sponsors, financial planners and other influential groups with the aim of raising awareness of retirement risk and educating the audience to strengthen financial security.
This research along with prior studies done by SOA provides insights into the experiences, challenges and uncertainties of the retirement period, the likelihood of decline and the financial strategies used to address these issues. One of the key findings of the SOA program of research, including the current study, is that retirement is not a static financial event, but one that evolves over time. Retirees define financial security in different ways, but often it is a short-term cash flow perspective rather than a focus on the rest of life. The Retirement Risk Study, conducted shortly before the current study with somewhat younger respondents, lays some important ground work for the current work.
The current work offers important contributions to this body of knowledge because it examines a population that has not been surveyed often and provides insights into how the retirement experience evolved over the years.
This report focuses on the quantitative portion of the research that involved surveys of 201 Americans ages 85 and over done by telephone and 202 adult children of Americans in this age group surveyed online, who were asked about their finances and health. While the results of the qualitative research—in-depth interviews with 62 people 85 years old or older—were presented in an earlier report, parallels are drawn throughout this report between the findings of the current quantitative undertaking and the qualitative study. All of the ages 85 and over participants in the quantitative study were selected to have wealth of less than $400,000,1 so the focus is on what might be referred to as resource-constrained retirees.*
1 Hereafter in this report we will use “K” as shorthand for thousands; e.g., $400K = $400,000.

5
5
*More extensive in-depth findings can be found in the SOA’s “Post-Retirement Experiences of Individuals 85+ Years Old: A Report on Sixty-two In-Depth Interviews in the United States and Canada,” appearing on the SOA website.
Overall, many of the study’s findings contribute to a better understanding of the financial and health issues faced by the elderly. Some of the most significant findings are as follows:
• Composition of elderly population. Most of the sample ages 85 and over in this study are female, and most of these women are widowed. While not a surprising finding, the circumstances of these women have profound impact on the need for family support, living arrangements and financial acumen in a generation where men often took the lead when it came to finances.
• Elderly perspective on finances. Most of those ages 85 and over in the survey are comfortable with their finances for a couple of reasons. They have a shorter time horizon than at an earlier stage of retirement and no longer think about longevity as a big factor in their finances. They also tend to be frugal and don’t have a large amount of expense to cover. This may be largely generation-driven, that is, as a result of being raised by Depression-era parents, or it may be a result of the lower activity level that comes with old age.
• Financial management and cash flow. While the Retirement Risk Survey and the in-depth interviews conducted in this research suggest that retirees have not done a great deal of financial planning, these older Americans have learned to balance income and spending in the short run, and this has become integral to their financial management process. Even though most are living primarily on Social Security and most have incomes of less than $2K per month, they usually do not spend more than their income. These results strongly confirm the qualitative research. Most report spending less now than they did in the past, especially on travel and entertainment. While most retirees in this study have far fewer assets than might be recommended, they use these assets as an emergency fund that they don’t tap often at their current age except to take the required minimum distribution, which they don’t necessarily spend.
• Financial management support. Most of the participants ages 85 and over in this research, who were screened to have limited assets, do not require help with their finances. When they do need assistance, they are far more likely to get it from a family member than from a professional financial advisor. About half the time, the need for help arises from a precipitating health event. In-depth interviews also suggested that the death of the husband may require children to step in and take over some financial management for the female survivor. There was some evidence that adult children might work with an advisor to manage their parent’s assets, but many of those ages 85 and over tend to make

6
6
daily financial decisions on their own, often paying their own bills and keeping track of their checking accounts.
• Financial shocks. While the 2015 Retirement Risk study research with younger retirees uncovered several financial shocks they faced, findings from the surveys of and about older retirees suggest that the impact of shock among the elderly is far less pervasive. Those 85 and over do not often report that expenses such as home repairs, medical bills, car repairs or dental bills have a major impact on their finances. In the case of medical expenses, in-depth interviews suggest that they have long since adjusted to paying for Medicare and Medigap premiums and don’t experience a great deal of unexpected expense. While long-term care can be a looming threat, most people in the survey do not find the assistance they currently receive to have a significant impact on their finances.
• Housing. A large majority of those who took the phone survey own their own homes and most still live in them. In contrast, only half of adult children reported that their parents were still residing in their homes. Most of the parents who moved did find other arrangements that involved some support due to poorer health. In fact, close to six in ten adult children report that their parents had moved at least once since retirement.
• Support from children. Most of those ages 85 and over respondents and parents of adult children at these ages have close family (other than spouses) living near them. While they do not get a great deal of financial support from their children, they do receive physical support such as assistance with shopping and household chores. This is particularly the case for widows. Based on differences in the surveys of those 85 and over and the adult children of people in this age group, more children are willing to step in and offer their time as their parents’ needs increase than parents realize.
• Long-term care preparation. The survey data suggest that those ages 85 and over and their adult children often lack a sense of reality when it comes to financing long-term care. Despite the relatively modest asset levels of the 85 and over population sampled, a significant number feel that they can save for long-term care by cutting back on spending and putting money away. Given the current age and income of the sample, this seems unlikely for those who will experience a major long-term care event unless they rely on Medicare. Unlike what is found with the younger sample in the Retirement Risk survey, very few have plans to sell or borrow from their house to pay for long-term care. The home is more likely to offer a substantial source of revenue.
• Long-term care plans versus reality. Some of the unrealistic financial expectations of this population may stem from a lack of acceptance of what long-term care may involve some day. As discussed earlier, a significant number of those ages 85 and over receive

7
7
some type of physical support from their children. The in-depth interviews suggest that many understand that the level of support will have to increase as they age—they simply don’t understand how extensive the help needed would be in the event of a major physical or mental decline. While most people would prefer to be cared for at home, among adult children who have parents requiring care, most of those parents ended up in assisted living or a nursing home. It seems that the care pieced together by aides/home health workers and children eventually falls apart. Thus, while most of those 85 and over can manage financially while healthy, they are not prepared for the financial burden of intensive care.
• Lessons learned. More than one-quarter of adult children say that caring for an adult parent has taught them to better prepare financially, a number likely to go higher as those currently with healthy parents face new challenges in the future.
These findings, along with those from the qualitative research, tell a compelling and consistent story of the financial views of people late in life and provides an important road map to understanding and supporting a segment of the population that has been little examined in prior research.
The following sections examine the study’s implications, provide an introduction to the research, explain the methodology and present an overview of the survey findings. The report concludes with the full report of findings.

8
8
IMPLICATIONS AND PERSPECTIVES
For many years, financial experts have warned about the implications of an American public that is inadequately prepared for retirement. Experts have cautioned that with growing life expectancies, Americans run the risk of depleting their assets over their retirement years. Studying the financial experiences of individuals ages 85 and over provides key insights into how people successfully manage the key risks of retirement from inflation to long-term care.
One of the main takeaways of this study is that retirement is far from a uniform event and that the experiences of people ages 85 and over are very different from those who are approaching retirement or who have entered it within the past 10 to 15 years. The findings of this study remind us that things change during retirement; as a result, the expected paradigms may not hold up later in life. As part of these revelations, it is important to remember that most of the current population ages 85 and over are women and widowed, often coming from households where men were the primary breadwinners who managed the finances before they died or became ill.
While financial planners have focused on the importance of retirement planning, respondents in this study were not apt to have sophisticated financial plans, and few had used financial planners. Rather, over time, through scaling back and budgeting, many of those ages 85 and over have achieved a short-term balance between cash inflow and outflow likely to ensure that assets can last indefinitely, barring events that upset the balance. Unlike what financial professionals and younger retirees worry about, long life alone has not created a financial crisis for most of the respondents in this study.
Of course, the experience of future generations depends not only on the cohort experiences of future retirees but also on the availability of Social Security and Medicare and the size of those benefits. Cuts would potentially change this balance. It is also worth keeping in mind that some of those ages 85 and over surveyed in this study—about one-quarter—said they worry about finances, but the qualitative research suggests that these individuals tend to have worried about finances throughout their lives. They did not suddenly notice that they might not have sufficient resources in retirement.
Furthermore, later in life, people have made changes in their lives and activities so that while events that affect finances still happen, they do not happen at the same frequency as earlier in life. Those ages 85 and over are less likely to have cars that break down and less likely to experience a divorce. Acute medical expenses are for the most part covered by Medicare and supplemental policies, and the beneficiaries have long since adjusted to paying the premiums for the health coverage. While 2015 research conducted with people who had been retired for up to 15 years or more showed that dental expenses, prescriptions and housing expenses were

9
9
relatively common big financial “shocks,” they did not appear to be so prevalent among those ages 85 and over.
Although many of the respondents have lost or will lose a spouse, the death of a spouse on balance was not reported to have a big long-term financial impact. Other SOA research indicates that the financial impact of the death of a spouse varies greatly, with some households losing substantial income, but in others there are assets that now support one person instead of two. In addition, if the spouse was sick for a long time, the need to provide and/or finance care ends at death.
The study also suggests that many of those ages 85 and over are often cushioned by having family support as they decline. The study showed a reluctance on the part of this age group to receive significant amounts of money from family members, as well as a parallel reluctance on the part of children to provide such support, but family helps with a variety of tasks that make life easier and more affordable. The findings suggest that children are more willing to give this support than those ages 85 and over realize, and that this support is widespread and multifaceted. An important implication of this work is that individuals who have no source of family or other informal support may well need to find much more paid help, which they should consider in their planning.
The exigencies that those ages 85 and over are not prepared for are assisted living and long-term care. Results suggest that neither this age group nor adult children truly understand the cost and impact of needing regular, often extensive, paid personal care. They commonly overestimated how much of this cost would be covered by Medicare and/or health insurance. As often happens throughout life, people are generally myopic and only see the next life phase. Thus, those ages 85 and over and adult children of those in this age group focus on taking care of their or their parents’ residences or being able to get places easily. They appear to equate the assistance needed for these tasks to the assistance needed for true long-term care, which is far more extensive. In some situations, people need help with the activities of daily living (ADLs) such as getting dressed, bathing, toileting, eating and getting in and out of bed. Care can be required every day, several times a day, or even continuously, whereas other forms of assistance are much more sporadic. The situation is very different when an individual is able to get in and out of bed, go to the toilet and be left alone for a period of several hours than when care is needed continuously or help is needed with those tasks.
Furthermore, a review of the responses from those ages 85 and over and those from the adult children with parents needing long-term care indicates that expectations often don’t match reality. Most of the people who do not yet need extensive care think that when they need long-term care they will stay at home and string together aides and family support. However, most of the adult children of those needing paid long-term care report that their parents are in nursing

10
10
homes or assisted living. The study shows inadequate planning for long-term care with both financing and delivery. While the study did not explore the path from independence to total dependence, the researchers believe that in many cases it is gradual, moving from occasional support with some tasks to support with more tasks and then to more care. This is likely to start while the individual is in his or her own home; however, as the needs become more extensive, a change in living arrangements is often required. The differences in the living arrangements of those ages 85 and over and the parents in the survey of adult children are an example of this progression.
We also observe that few in this age range and adult children of this age group report that they have had a family discussion about plans for long-term care. This is not surprising considering the general absence of longer term and risk-focused planning.
Findings suggest several important lessons for actuaries, financial and other advisors, children with older parents and the elderly themselves:
• While conventional financial planning for retirement is about money over a long period of time, that period is not that important an element for late in life adults. The short-term year-by-year balance that the elderly achieve works for them, and planners need to respect this.
• Conventional planning focuses on maintaining life style, but many retirees are resilient and flexible and willing to make substantial changes in life style until they reach a point at which they can no longer make such choices. There may be more tolerance for cutting back than planners see with other types of clients.
• The findings make it very clear that many retirees depend on informal support, often provided by family, and that individuals without such support have a gap to fill in their planning. Work is needed to help them identify ways to deal with this.
• When advisors talk with couples earlier in retirement, they should reflect on the fact that the female is more likely to be the survivor and begin to prepare the client for this eventuality. In this generation ages 85 and over, the female often has less financial acumen and experience than the male spouse.
• One of the planning challenges is that few retirees buy long-term care policies or focus on a plan for long-term care financing, and the findings suggest that many households are not receptive to confronting the issue of needing care, confirming what advisors are experiencing.
• The findings here suggest that one way for advisors to approach this lack of attention is to focus on intergenerational family discussions. Perhaps in this context more realistic planning can occur as both the elderly and their family confront plans together.

11
11
• The role of family is an important dynamic in financial wellness in general as the elderly begin to lose physical and mental capacity and need assistance with chores and transportation. Findings here suggest that a minority discuss mutual plans for support and care in advance and that this is something a planner could initiate. Furthermore, those ages 85 and over underestimate how much children are willing to step in without threatening their independence, and it could be comforting for them to know. People without access to such family support have a gap to fill.
• Part of the impetus for an advisor-guided family discussion is to help not only the elderly parent but also the child. Findings here suggest that the baby boom generation can learn from observing their parent’s experience and advisors can reinforce this learning.
• Few in this group are using financial advisors. (This of course may be different with a more affluent group.) This is not surprising given the day-to-day routine and short-term focus the elderly have established. Family members are much more likely to be the ones assisting the elderly who are getting help with financial management, although these family members might consult financial planners.
• For the actuarial community, this research suggests that for those ages 85 and over, morbidity may be as or more important than mortality in determining risk. Many in this generation can sustain their finances over time but are not prepared for the expense of needing extensive care beyond what can be provided for by family.
Finally, one of the issues that needs to be considered when thinking about this study and its lessons for the future is that the participants in this research came mostly from “the silent generation.” While they did not live through the Great Depression as wage-earning adults, in-depth interviews often suggested that they were the children of parents who did, which likely led them to value and practice frugality. They are also far more likely to have pensions from work (although many, especially widows, did not have significant ones, and pensions typically lose ground to inflation).
In the future, public benefits including Social Security, Medicare and Medicaid may well be reduced. Furthermore, social roles have changed: Study participants came from a more male-dominated culture where men took care of the finances. Many women in this study did not have significant careers. They married earlier, were less likely to divorce and had more children than many of those following. The retiring baby boom generation and generations to follow will have had different lifestyle expectations and financial experiences. It is important in interpreting the findings in this study to keep in mind that there is a “cohort” issue that makes it hard to determine which findings are driven by age and which reflect the life history, demographic and benefit pattern that applies to a particular generation.

12
12
It is important to remember that while the implications provide insights from individuals ages 85 and over and their adult children, this is not a representative sample of the entire U.S. over-85 population:
• The research group was selected among resource-constrained individuals, and financial assets were limited to $400K. Wealthier respondents are not represented. Also, sample quotas were set to have half of the sample have less than $50K in assets, which underrepresents the lower asset population.
• One sample in this study are those who are mentally and physically healthy enough to participate in in-person and telephone interviews. The need to be healthy enough to take part in this research essentially screens out segments of the population not healthy enough to do these activities.
• Another sample of this study was adult children who answered questions regarding their parents. It is important to point out that those who do not have children, or do not have children familiar with their financial situation, are not represented in this group.
Furthermore, it is also important to remember that this research focuses on today’s elderly, and, as discussed earlier, future generations could be different.
Areas for Further Research
Elder orphans. The survey of children includes only situations where the adult child is very knowledgeable about a person age 85 and over. There are many people today who do not have children, or who do not live near children or other relatives who are willing to help them. It is clear that the welfare of the people in this study was greatly enhanced by family support. Work is needed to understand the situation of groups that lack this source of support, their numbers and the alternative sources available for them.
Blended families and the experience of the elderly. Few of the participants in this study reported being part of a blended family (those with stepchildren from another marriage), and little data are at hand to help assess the impact of blended families on the well-being of the elderly late in life. Because of the importance of family support at upper ages, more research on changing family patterns and the care and support of the very old may help us better understand how many older people in the future may fare.
The role of Medicaid. While the study clearly showed many gaps in planning for long-term care and while Medicaid is a major payer of nursing home care, the study did not provide any insight into how Medicaid fits in. How often is there a plan to use Medicaid, and how often do people just “fall into” using it? How did a family’s plans to use Medicaid turn out—is it something that

13
13
they expected and accepted or something they regretted? These complex issues are worthy of further research.
Pathways through retirement. The study shows us how different the lives of those at ages 85 and over are from those who are 20 years younger, and it also shows many individual differences among them. Further work is needed to understand the changes people undergo as they age and how they cope with them.
Family discussions. Given the important role that family support plays, what discussions are family members having, how long ago did they start and what has been discussed regarding how to handle the declining health of a parent? How effective is the communication process, and do parent and child agree on its effectiveness? Are there areas that need more discussion, or do parent and child see eye to eye on these? How much discussion goes on with siblings, and how effective is it?
Lessons learned. What have adult children learned from their elderly parents, and how will they apply these lessons to themselves in the future? What lessons are intuitive, and what are surprising? What else should the children know more about?

14
14
BACKGROUND
For more than 20 years, the Society of Actuaries (SOA) has been actively involved in understanding the approach pre-retirees and retirees take to risk management, financial planning and decision making surrounding retirement and retirement-related issues. This research has involved both quantitative and qualitative studies of respondents from the time of retirement to age 80 years old and has examined the financial and life journeys that elderly consumers have experienced.
This research, together with prior studies done by SOA, indicates the great financial and emotional challenges of the retirement period and the uncertainties faced during this time and the probability of a decline in health. One of the key findings of the SOA program of research including the current study is that retirement is not a static financial event, but one that evolves over time as does the definition of financial security. The 2017 Society of Actuaries Retirement Risk Survey, conducted shortly before the current study with somewhat younger respondents, and the eight prior surveys in the series lay some important ground work for the current study.
Retirement Risk Survey
The 2017 Retirement Risk study, conducted with pre-retired and retired Americans younger than those used for the current study, was done around the same time as this study. Both pre-retirees and retirees worry about their quality of life, inflation, having enough money to pay for long-term care and health care, and being able to stay in their homes as they age, among other issues. The survey series has showed consistency in the top concerns over nearly 20 years.
Those entering retirement prepared for it by eliminating debt and reducing spending, but many have not prepared for the long term. They have not, for example, worked with a financial professional or secured a lifetime income with their investments, and half of pre-retirees feel that they are behind schedule in their savings. Some of those about to enter retirement plan for a more secure financial picture by paying off their mortgage, making less risky investments and postponing receipt of Social Security.
Most pre-retired and retired respondents in the Retirement Risk survey feel financially secure but are more secure about the present than they are in the future. Most pre-retirees expect to live on less income in retirement, leading them to feel unprepared for substantial, but common, financial shocks that tend to occur in retirement, including health care and especially long-term care.
The concern that pre-retirees and retirees express about long-term care is partially driven by the large number who currently give care to their parents. Furthermore, many have unrealistic expectations that Medicare will cover long-term care costs and lack the financial resources to fund such care themselves.

15
15
Part of the reason for concern about long-term care appears to be that many have not conducted basic financial planning steps, such as the preparation of a comprehensive financial plan or purchasing insurance policies that could help them deal with financial risks.
Most pre-retirees and retirees are committed to staying in their homes for as long as they live. They do not want to live with children or move to a continuing care community. For most, mortgage payments are low or paid off, and most have significant equity in their home. The factors in remaining in current residences include quality of services and being near children. Pre-retirees and retirees are split on whether they will tap their home equity to help fund retirement. Most do not understand or have an interest in reverse mortgages.
Prior Focus Groups
In 2013, the Society of Actuaries conducted focus groups with people retired less than 10 years and in 2015 with people retired 15 years or more. These focus groups reinforced the common use of shorter-term cash-flow based planning and provided an approach for dealing with shocks and the unexpected of “I will deal with it when it happens.” At the same time, they showed a great deal of resilience on the part of retirees and a desire to hold onto and not spend down assets. Many are frugal. Together with the risk surveys, they tell the story of the path through retirement.
In-Depth Interviews with Late-in-Life Retirees
In this current research the Society of Actuaries examines the next chapter of the story—the lives of those ages 85 years and older. The purpose of this study was to find out how the habits and behaviors from earlier in life play out in the final years. In what ways do the concerns of pre-retirees and early retirees change as people age? How similar and how different is the perspective of people ages 85 and over compared to people ages 60 to 80, and what leads to any change?
The first phase of this project has already been completed and reported. It consisted of a series of 62 in-depth interviews with people ages 85 and over. This report presents the second phase of the research project, separate surveys with people ages 85 and over and with adult children who have parents ages 85 and over.
The first phase of this project, in-person in-depth interviews, uncovered a great deal of interesting information about the elderly:
• Most Americans and Canadians ages 85 and over live a sustainable lifestyle. Many have practiced frugality for much of their lives, and in their later years have made peace with the need for continued frugality. While some experience financial stress, in most cases

16
16
this stress had existed for much of their lives, so it is nothing new. Overall, they continue to balance short-term finances; they are less worried about longevity-related long-term issues.
• Because they manage to balance expenses and income, they do not require sizable assets to protect against most unforeseen expenses. Most do not express regrets about not saving more.
• One factor behind the lower level of concern about finances is that at some point older people begin to see their lives as finite. In the research done here many people ages 85 and over realize that they have a limited number of years left; they are no longer planning for a highly uncertain life expectancy.
• Americans ages 85 and over in this study are less concerned about unexpected financial shocks compared to younger retirees in the retirement risk survey and participants in the 2015 focus groups retired 15 years or more.
• Most participants in this study live month to month, even if they have assets. They spend relatively little.
• One area where there is concern and where the elderly do not appear prepared financially is with respect to assisted living and long-term care. The interviews for this study suggest that this could become a problem.
• Because of the financial impact of assisted living and long-term care, family attention and assistance are vital once those ages 85 and over experience decline.
• Most prefer to stay in their current living situation as long as possible, although a few would like to move to an environment where there is more social interaction—if they can afford to do so.
• Most do not like the idea of reverse mortgages. • The level of desired and actual social interaction varies greatly. Many of those ages 85
and over have lost most of their lifelong friends and rely more on family or acquaintances living nearby for social interaction.
• While respondents are far more likely to come from traditional male wage earner households, roles change when the husband loses cognitive capacity or passes away and the wife must perform the responsibilities the husband has taken care of, often having to learn about finances or depend on children.
This phase of the research consisted of a small number qualitative interviews in two U.S. and two Canadian locations. The goal of next phase of the research, the subject of this report, is to corroborate some of these findings with a larger and more representative sample. To accomplish this objective, we conducted 201 telephone interviews with Americans ages 85 and over and 202 online interviews with adult children of parents ages 85 and over using Research Now’s online panel.

17
17
The questionnaires for the study were designed by Greenwald & Associates, in cooperation with the SOA Committee on Post-Retirement Needs and Risks and its Project Oversight Group. Interviews averaged 23 minutes for ages 85 and over respondents and 19 minutes for adult children of this age group. Telephone interviews with those ages 85 and over were conducted in October 2017, and online interviews were done with adult children in December 2017.
To qualify for the telephone survey, potential respondents needed to be at least 85 years old with less than $400K in assets; at least 45% had to have incomes of less than $50K. To qualify for the online survey, adult children needed to have at least one living parent or stepparent who was age 85 or older and be close enough to that person to have some knowledge of their finances, health status and cognitive ability. Forty percent of the online sample had to have a living parent or stepparent age 90 or over. The parent or stepparent had to have less than $400K in financial assets with at least 40% having less than $50K.
It is important to keep in mind that the sample ages 85 and over is likely healthier than the parents of the adult children sample since half or more of the latter sample report their parents have limitations that require assistance with personal care (56%) or hearing issues (49%) and four in ten (42%) have parents with moderate to severe cognitive decline. These issues would likely have precluded participation in a telephone study. Also, the study required that children be knowledgeable about their parents’ financial situation, and this might not have been the case for children of parents living independently without their support. Less than 10% of the telephone sample required a great deal of assistance in daily living. Also, because of the advanced age of the sample, most were female, and most were widowed.

18
18
OVERVIEW OF SURVEY FINDINGS
Feelings about Adequacy of Finances
Despite the focus that retirement experts place on longevity risk and the inadequacy of retirement savings, findings here are consistent with what was seen in the in-depth interviews—that most Americans ages 85 and over do not appear that concerned about their finances in their late retirement years. Most report that they do not worry that much about their finances, and a large percentage report being at least somewhat financially secure. Like the qualitative research, very few Americans ages 85 and over express regrets about the decisions they made in life regarding their finances, and most of the regrets they have stem from the years before they retired. Most adult children confirm that their parents do not worry that much about their finances and are not concerned about supporting themselves for a long time to come.
Furthermore, as with the qualitative research, there is little evidence of many retirees experiencing recent financial events that impact them greatly. When asked what events have had a major impact in the past five years, a small percentage mention home repairs or car repairs. A small percentage of those ages 85 and over report medical expenses as having a major impact; these are primarily low-asset respondents. Adult children with parents this age confirm that their parents can handle health care expenses with Medicare and Medigap. Interestingly, slightly more elderly, especially those with lower incomes, report that utility bill increases have a major impact than report this for medical expenses.
Only one in five of those ages 85 and over and adult children of those in this age range report that the death of a spouse has had a major impact on their or their parents’ lives, although adult children are more likely to cite it as a major source of financial loss if it happened five to 20 years ago. The one area that adult children more frequently cite as a source of financial shock is the need for assistance in daily living. Again, some of this may have been due to those participating in the phone survey are healthier and less likely to need this support than the parents of the adult children interviewed. Children with parents needing care or having cognitive decline or hearing impairments are more likely to say that assisted living expenses have had a major impact on finances.
One factor that may contribute to feelings of financial adequacy is that debt does not play that big of a role on the finances of those ages 85 and over as it may with younger retirees. A majority say that debt has little or no impact on their finances, and only one in ten claims that it affects them a great deal.
Most of those ages 85 and over report having had little or no family discussion on issues such as investing assets, the type of lifestyle that they want, how long their assets will last or how to

19
19
budget their money. The data here support the findings of the qualitative research that the financial planning of elderly Americans has a very short-term focus.
Most of those 85 and over in this study have life insurance, but it is primarily for funeral expenses and not intended to provide significant support to heirs. This may be a function of the low asset level of the sample.
Income and Spending
In the qualitative research, one of the reasons that those ages 85 and over report not being concerned about their finances is that they had adapted to spending at a level that is appropriate for their income. The current survey confirms this finding. When asked about how their spending habits compared to their financial resources, only about one in eight report spending more than they should, and in most cases, just a little more. A large majority of adult children also report that their parents spend less than their income consistent with the qualitative research. Those ages 85 and over and adult children of this age group concur that they or their parents spend the same or less than they did ten years ago.
As in the qualitative research, larger majorities report being at least somewhat frugal, with about half saying they have been this way for the last 20 years. When asked what advice they would give to their children and grandchildren, almost half would advise them to save and more than a third would advise them to be frugal. This advice seems to stem from the habits that the elderly practice—to balance income and spending. Very few advise their children or grandchildren to enjoy life and spend more money. A large majority of adult children agree that their parents are frugal.
The effort to balance income and spending also appears to give the elderly some confidence in their money management. A large majority claim to be at least somewhat knowledgeable about knowing what they need to do to have a secure retirement. Most children concur that their parents are knowledgeable, although very few would describe them as very knowledgeable. A majority agree that their parents are managing their finances well.
Almost all respondents receive Social Security, and about half report receiving a pension. More than a third of those with $50K or more in assets report having an IRA, but only one in five of those with fewer assets have one. Far fewer have a 401(k) or 403(b), which is not surprising given that many had retired not long after these plans were introduced. Most households get less than $2K per month from these sources. Findings from the adult children are similar.
Compared to ten years ago, most respondents say they spend the same or less in several key areas. A large majority report spending less on travel, and a majority report spending less on entertainment. Even when it comes to medical costs, only somewhat more than one-third report

20
20
spending more. Most spend about the same or less on housing than they did ten years ago. Only about one in five claims to spend more for assistance in their daily lives. Findings are similar among the adult children, although they are more apt to believe that their parents spend more on medical costs than those ages 85 and over report.
Housing
A large majority of those 85 and over, particularly those with $50K or more in financial assets, report that they own their home free and clear, and about two-thirds live in this home alone. A larger majority have been in their homes for more than ten years. However, half of adult children report that only half of their parents ages 85 and over own their own home, and a majority report that their parents have moved at least once since retirement for reasons that include moving to a residential community with services, being unable to manage in their previous house or to be close to family.
Those who live with others are just as likely to live with children as they are with a spouse. One in five reports living in some type of continuing care community or a facility that provides activities and meals. Adult children more commonly report that their parents live in some type of community setting, but this could be a function of the fact that their parents are less healthy than the elderly sample participating in the survey.
Health
Because the telephone survey was done with people ages 85 and over, respondents were likely healthier, that is, in need of less care, without cognitive issues and able to hear well enough, than those who could not be sampled by phone. When asked about their health, only one in four report being in fair or poor condition. More than seven in ten can manage their daily lives with at most minor support from others. A large majority report being at least semiactive.
Adult children report very different levels of health for their parents, with a majority claiming that their parents are in fair or poor health, although much of this comes from children of parents not healthy enough to have done a telephone survey. Almost half of adult children report that their parents are inactive. These findings suggest that health and vitality issues are a big driver of family support.
Role of Family
A majority of those ages 85 and over and adult children report that close family members other than a spouse or partner live within 50 miles of that elderly person. In a little more than one in

21
21
ten cases, this includes blended family, those with stepchildren from another marriage. In the case of blended families, respondents have mixed viewpoints on whether they would seek support from those family members.
In an overwhelming majority of cases, respondents ages 85 and over report receiving no financial support from family. Some type of support with physical activities such as providing transportation, meals or support with household chores is more common. More than half of the respondents ages 85 and over report getting some support with physical activities from family. About half of the elderly respondents indicate they need to be driven places, about one-third need help with shopping or their residences, about one-fourth need help with housekeeping and less than 10% need help with the activities of daily living. Adult children, especially daughters, also report providing various types of support to parents. These findings suggest the extensiveness and importance of family support.
Very few of those ages 85 and over expect to receive a great deal of support from their family if their health declines, and close to half expect to receive little or none. However, one of the most enlightening findings of this study is that adult children do not respond the same way. A majority of adult children claim that their parents can count on them if their health fails, which is very different from the expectations of those ages 85 and over. One reason for this gap may be that the elderly tend not to discuss these issues with their children. It is also noteworthy that the support adult children intend to provide is not financial, with most providing little or no financial support.
Long-Term Care
Consistent with earlier findings, a significant portion of those ages 85 and over do need some physical support, most commonly transportation. This need is most common among those with assets less than $50K, who may not have the financial resources to seek other means of getting around.
About one-third report that their spouse does or did need nursing home care or in-home care, roughly split between being in a nursing home, having the spouse provide the care or having aides provide or share the care.
In most cases, respondents, especially those with less than $50K in assets, report using their own money to pay all or most of the costs of caring for a spouse. About a quarter use Medicaid, and more than a quarter claim care was provided at no cost, which might in some cases involve Medicaid without the respondent’s knowledge or admission. Few receive the support of other family members. A large majority claim to have been at least somewhat well prepared for taking care of a spouse.

22
22
Consistent with the findings of the qualitative research, there are some major gaps in how those ages 85 and over are preparing for their own potential need for long-term care.
Two in three claim to be at least somewhat well prepared for the potential expense long-term care for themselves, but only one in four reports being very well prepared. When asked how they will or did prepare for this potential expense, a majority claim they have saved or intend to save on their own to do so, which may not be realistic given the cost of long-term care. About half say they have or intend to cut down on other expenses, and close to half intend to have a family discussion about the issue. Adult children agree that this is how their parents will prepare.
Given the expense of long-term care and the assets of this sample, it does not seem that these elderly respondents have the means of paying for the care themselves, and earlier data suggest that most do not intend to seek financial support from their family. Thus, there is some doubt that the approach they are taking to long-term care finances will be sufficient. Furthermore, means that might better fund long-term care—for example, long-term care insurance or a reverse mortgage—are not being sought by most retirees.
Further data suggest that respondents may be underestimating the cost of long-term care. A majority claim that it would have no or a minor impact on their family. Furthermore, a quarter have not thought about how they would be taken care of if they needed long-term care. The most common way that those ages 85 and over believe they will be taken care of is to have an aide or family provide support in the home. However, results from adult children suggest that elderly parents are far more apt to be in a nursing home than have an aide come in. Furthermore, while a significant minority of those 85 or over either own or plan to buy long-term care insurance, very few adult children report it as a source of funding for the nursing care of their parents.

23
23
SURVEY FINDINGS
Feelings about Adequacy of Finances
As found in the qualitative research, most of the elderly ages 85 and over do not report a high level of concern or regret with their finances and feel relatively secure about their financial situation. Some of this may be driven by relatively little debt, but, as well, those 85 and over do not report a high level of financial shock recently impacting them, including medical expenses that aren’t covered by Medicare and supplemental policies. Feelings about finances tend to be driven by the current financial situation, and the elderly may not be taking future long-term care needs into account. Adult children also have positive views about their parents’ finances, and both those ages 85 and over and the adult children of this age group feel that this group has at least some level of knowledge of how to manage their finances. A significant number of adult children mention that the need for assistance has had an impact on their parents’ finances, but their parents are more likely to have impairments than the ages 85 and over sample studied.
Elderly Ages 85 and Over
When asked how financially secure they feel, close to eight in ten respondents (78%) say that they are at least somewhat secure, with one-third (33%) claiming to be very secure. Among those with $50K or more in assets, more than half (53%) report being very secure. Those with monthly incomes of $2K and over (89%) are more apt to report being secure than those with incomes less than $2K (70%).
No, I can afford everything I need. There are lot of things that I wish I could do, but they are not hindered by finances. They are more hindered by my physical capability.
—Dyad, elderly parent, over-$50K-asset male, Baltimore2
2 The source of this and all following quotations is the qualitative research.

24
24
Furthermore, ages 85 and over respondents do not show a great deal of worry or regret about their finances. When asked how much they worry about their finances, only slightly more than one in ten (13%) claim to worry a great deal, and seven in ten (70%) report worrying little or none about them. Those with incomes less than $2K are more apt to worry a great deal than those with incomes more than $2K (20% versus 4%). Fewer than one in ten (8%) claim to have a lot of regret about the financial decisions they made in their lives, all of these comprising those with less than $50K in assets. Among those expressing any regrets at all, more than half claim that these decisions occurred before they retired. Three in four (75%) claim that they are not concerned about having to support themselves in retirement for a long time to come.

25
25
I get a pension and it’s satisfactory. Mostly [I can afford everything I need]. I don’t need that much because I live here with my children. I’m very satisfied with what I have here.
—Elderly, under-$50K-asset female, Chicago
Based on prior research with somewhat younger respondents, this survey also asked ages 85 and over respondents about how big of an impact various events have had on their finances in the past five years. For none of the shocks mentioned do more than a quarter (23%) claim that the shock had a major impact. Interestingly, the most common event to have a major impact among this 23% is an increase in utility bills, especially among those with less than $50K in assets

26
26
(26%). Other events experienced by a small minority of elderly in the past five years that have had a major impact include death of a spouse (21%) and medical expenses (19%), with the impact being much larger for those with less than $2K of income. Even fewer experience a major financial impact from dental expenses or home repairs (13% each) or an increase in real estate taxes (12%). Car repairs have had a major financial impact in few instances (5%). Those with $50K or more in assets are far less likely to report that events such as increases in utilities (14%), death of a spouse (12%), medical expenses (8%) or home repairs have had a major impact.
Few report that giving gifts to children and grandchildren has a major impact (7%), but males are more apt to say that it has a minor impact than are females (46% versus 27%).
[Getting worse] The taxes, yes. The taxes and water bill. The city of Baltimore is going to send me a water bill every month. No, we pay more. My water bill might be $125 a month. In Baltimore County, they pay $15.
—Elderly, $50K+-asset male, Baltimore

27
27
In fact, more than two in three (69%) are at least somewhat confident that they have the financial resources to cover unexpected events such as medical care or long-term care or the death of a spouse. However, as discussed later, it is not clear that those ages 85 and over have the resources to pay for long-term care.

28
28
Debt is apparently not a major concern, which may help account for feelings of financial adequacy. A majority say that debt has little (17%) or no (43%) impact on their finances, and only one in ten claim that it affects them a great deal. For those with $50K or more in assets, the numbers are even more striking, with more than three-quarters (77%) saying that debt has little or no impact.
Those ages 85 and over report being knowledgeable about their finances with over eight in ten (83%) reporting that they are at least somewhat knowledgeable about what they need to do to have a secure retirement. Close to half (47%) of those with $50K or more in assets report being

29
29
very knowledgeable. Those with no children (50%) are far more likely to be very knowledgeable.
In this study, 62% of those ages 85 and over have assets of less than $25K, with women (68%) far more likely to report this than men (49%).
Savings and Investments Total (n=201)
<$50K (n=152)
$50K+ (n=49)
Less than $25,000 62% 82% — $25,000–$49,999 14 18 — $50,000–$99,999 12 — 49% $100,000–$199,999 6 — 27 $200,000–$299,999 4 — 16 $300,000–$399,999 2 — 8 $400,000 or more — — —
Adult Children
Results from the adult children survey are consistent with those from the survey of Americans ages 85 and over, although some of the questions differ. When asked about the extent to which their elderly parents worry about their finances, only 16% say that their parents worry a great deal, and six in ten say (59%) say that their parents worry little or not at all about them. More

30
30
than seven in ten (71%) claim that their parents do not worry about having to support themselves for a long time to come, consistent with what those ages 85 and over reported.
He feels he can afford everything he needs. No concerns about not being able to afford things or making money last through retirement.
—Dyad, adult child, under-$50K-asset female, Chicago
She was pretty much growing her assets at the time, and her expenses weren’t that much at that point. She got what she wanted, was able to pay her monthly bills without a problem. She was fine.
—Adult child, $50K-or-more-asset female, Baltimore

31
31
When asked about the impact of various events on their parents in the past five years and the past five to 20 years, adult children provide some results that are consistent with the responses that those ages 85 and over gave: one in five claim that medical expenses had a major impact in the past five years (22%) and the past five to 20 years (20%). As those ages 85 and over note for themselves, adult children report that home repairs have had a minimal impact in the past five years (9%) and the past five to 20 years (14%). Other areas that have not had a major impact in the past five years include gift giving to children (4%), death of a spouse (15%) and investment losses (0%). Interestingly, adult children are not as apt to cite increases in monthly bills as having a major impact on their parents’ finances in the past five (16%) or five to 20 years (12%) as parents reported. Female respondents (36%) are more likely to report that the death of a spouse had an impact than males (23%) on their parent.
Consistent with these findings, almost three in four (74%) are at least somewhat confident that their parents can handle a major medical event, with a quarter being very confident.
She’s got Medicare and an HMO through Kaiser. Luckily she’s been healthy, so we really haven’t run into a lot of medical expenses. She had a back problem and she had an MRI and this and that. But all that, financially, we were able to take care of with no problem.
—Adult child, $50K-or-more-asset female, Los Angeles

32
32
However, one big area where the findings from adult children are different from those obtained directly from those ages 85 and over is the impact of needing assistance in daily living. Thirty percent of children claim that this has had a major impact on their parents in the past five years, far more than reported by the elderly themselves. One in five (19%) report that it has had a major impact in the past five to 20 years. Some of the difference may be a function of the differences in the sample for these surveys discussed earlier. It could also be a function of what children know and don’t know about their parents’ finances.
More than one-third (36%) of adult children claim that the death of a parent had a major impact on the other parent’s finances in the past five to 20 years. However, only 15% claim that this event had a major impact if it happened in the past five years—lower than those ages 85 and over reported (21%).

33
33
Adult children confirm that debt has minimal impact on their parents’ finances. Eight in ten (80%) claim that it has no (69%) or little (11%) impact.
Adult children are mixed on how knowledgeable their parents are about being financially secure throughout retirement. Only one in six (16%) claim that their parents are very knowledgeable, but more than half (57%) believe that they are at least somewhat knowledgeable. Those with parents who would have been able to take the telephone survey (without various limitations) are

34
34
much more likely to say that their parents were very knowledgeable (36%). Females more frequently see their parents as knowledgeable than males do (23% versus 9%). Close to two-thirds (65%) feel that their parents do not have trouble managing their finances.
I would guess between five years ago and two years ago she kind of has eased out of having responsibility for her own finances.
—Adult child, $50K-or-more-asset female, Los Angeles
My father took full charge of things and he didn’t consult me, but he was very knowledgeable. And then, when he died, Mom started asking me, I guess, gradually about different things and to tabulate the different sources of money, help invest, and to research the insurance. But Mom still did, I guess, most of it herself. I guess it wasn’t until about maybe about seven or eight years ago that I become the primary financial decision maker.
—Dyad, adult child, $50K-or-more-asset female, Baltimore
Income and Spending
As observed in the qualitative research, one of the big factors behind the levels of financial comfort found among the ages 85 and over population is their ability to live within their means. This group reports being frugal, and adult children agree with this as far as their own parents go. A majority of those ages 85 and over in this study live on less than $2K per month, with Social Security being the most common source of income, and adult parents agree that this is the case. Few spend more than their income, which, combined with qualitative insights, suggests that there

35
35
is little evidence of asset drawdown. Overall, the elderly are living within their means for the moment, although this does not account for future long-term care expenses.
Elderly Ages 85 and Over
When asked about how their spending habits compare to their income, only about one in eight (12%) report spending more than they should, and only 3% report spending a lot more than they should. About a quarter (23%) report spending less than they should, with females (28%) far more likely to say this than males (13%).
I have a checking account. When I have excess money, I’ll put it in the checking account, so sometimes I have to fall back on that, right?
—Dyad, elderly parent, $50K-or-more-asset female, Baltimore
The biggest factor behind these findings is that most respondents considered themselves to be at least somewhat frugal—a quarter very frugal (25%) and a half (51%) somewhat frugal. Widows (80%) are more likely to be frugal than others (64%). Furthermore, frugal behaviors seem to have lasted a long time, with close to half (48%) reporting being just as frugal as they were 20 years ago and only one-third (34%) reporting being more frugal. Widows (80%) more often say they are at least somewhat frugal than others (64%).
I’ve been somewhat frugal, yes. Because when you’re a child in the Depression days, my parents were very frugal, and I saw how it happened for them that they were all right when they did retire. — Elderly, $50K-or-more-asset female, Vancouver

36
36
The frugality of respondents is further borne out when they are asked about spending relative to income. As found in the qualitative research, very few spend more than the income they receive—in fact, only 3% report spending a lot more, and more than eight in ten (83%) report spending their income or less than their income. Men (25%) are more likely to spend more than their income than are women (10%). These findings suggest little evidence of asset drawdown
I think we’re satisfied with what we’ve got. Her income isn’t that great, but she doesn’t have that much expense. Her expenses are basically just utilities and the phone and cable and stuff like that. She doesn’t have any other bills.
—Dyad, adult child, under-$50K-asset female, Baltimore

37
37
Almost all respondents (96%) report receiving Social Security, and about half (53%) report receiving a pension, with widows less likely to have one (47%) than others (69%). More than a third of those with $50K or more in assets report having an IRA, but fewer than one in five (17%) of those with less than this amount have one. Far fewer report having a 401(k) or 403(b).. A quarter (25%) report receiving other sources of income.
Most households (55%) report getting less than $2K per month in income, six in ten (61%) of those with less than $50K in assets, and four in ten of those with $50K or more in assets. Women (64%) are far more likely to have less than $2K in income than are men (39%). Almost half of those with $50K or more in assets report receiving $2K to $4K a month in income. Very few of the total sample (4%) report having more than $4K per month in income.
Right now I am getting $1,158 from Social Security … from my first husband’s Social Security. Then I have annuitized two small annuities. One is $658 a month, and one is $184 a month. With the total amount, it is a little under $20,000 a year.
—Elderly, under-$50K-asset male, Chicago
Most report spending the same (34%) or less (38%) than they did ten years ago, with women (44%) more often saying that they spend less than men (28%). When compared to 10 years ago, most respondents report spending the same or less in several key areas. A large majority (74%) report spending less on travel, and a majority (60%) report spending less on entertainment. Even when it comes to medical costs, only a little more than one-third report spending more (37%),

38
38
with those with less than $50K in assets more likely to spend more (41%) than those with more assets (27%). A plurality report spending about the same on housing (44%), but more than one-third claim to spend less (35%). Only about one in five claims to spend more on getting assistance in their daily lives.
Honestly, no [she does not feel she has the money she needs]. She doesn’t really. The house is paid for, and the basic bills I pay for. At the end of the month, she doesn’t have a whole lot of savings left.
—Adult child, $50K-or-more-asset female, Baltimore

39
39
When asked what advice about money they would give to their children and grandchildren, almost half of the elderly sample (47%) would advise their offspring to save more, and, on a related note, somewhat more than one-third (36%) would advise them to be more frugal.
Adult Children
When asked the extent to which their parents’ assets have declined, consistent with what those ages 85 and over report for themselves, adult children report that there has not been that much of a decline. Close to half (49%) claim that their parents’ assets have stayed the same or increased, and only one in four (25%) claim that they have declined a lot. Very few (12%) with parents not in cognitive decline or experiencing hearing loss claim that their parents’ assets have declined a lot.

40
40
Consistent with what those ages 85 and over report, most of the children of this age group also report that their parents are very (33%) or somewhat (45%) frugal. Fewer than one in ten (7%) claim that their parents are not at all frugal. Also, similar to how the elderly describe themselves, more than half of the adult children claim that their parents are as frugal as they were 20 years ago (55%), and close to four in ten (38%) claim that their parents are more frugal. Children with assets of $50K or more are more likely to describe their parents as frugal that those with fewer assets.
A lot of times we were the ones who had to say, “No mom, you can spend that much for a dress. No mom, you can get those other pair of shoes. You can afford that.” —Adult child, under-$50K-asset female, Chicago She’s been pretty frugal. She never really overspends or feels the need to overspend. —Adult child, $50K-or-more-asset female, Los Angeles

41
41
As found among those ages 85 and over, 96% of adult children claim that their parents have Social Security benefits, and more than half (55%) say they have a pension. Close to one-third (29%) claim that their parents have an IRA, and fewer than one in ten (9%) report that their parents have a 401(k) or 403(b) plan. Consistent with what the elderly report, more than half (51%) claim that their parents have incomes of less than $2K per month, and very few (12%) report that they have incomes of more than $4K per month.

42
42
Findings from the survey of adult children confirm what those 85 and over report—that a large majority of the elderly live within their means. Close to nine in ten adult children (84%) report that their parents spend less (58%) or about what or no more than (26%) the income they receive. Close to eight in ten (78%) report that their parents spend less (46%) or the same (32%) as they did 10 years ago. Not surprisingly, most adult children report that their parents spend less on travel (74%) and entertainment (65%) and the same (46%) or less (24%) on housing. Pluralities report that their parents spend more on medical care (54%) and getting assistance with ADLs,

43
43
including house cleaning, transportation and personal care (47%). Most of those receiving such assistance are parents who could not have participated in the survey themselves due to physical limitations.

44
44
Most adult children (73%) report that their parents do not provide support to children or grandchildren. Only one in ten (11%) reports that they spend 10% or more of their income this way.

45
45
Housing
Most of the elderly ages 85 and over interviewed in this study own their own residence, and most of these live alone. Only a small minority live in a community setting. Adult children are more likely to report parents living in a community setting, which may be a function of the healthier respondents taking part in the phone survey.
Elderly Ages 85 and Over
A majority (68%), especially those with $50K or more in financial assets (82%), own their home free and clear, and about two-thirds (66%) live in this home alone, women (74%) more so than men (49%). Among those who live with others, somewhat more live with children (52%) than with a spouse or partner (45%). Those with higher asset levels are more likely to live with a spouse or partner (69%), a factor that might account for their higher level of assets. One in five (18%) report living in some type of continuing care community or one that provides activities and meals, but these are respondents without limitations that prevent them from taking a telephone survey. A larger majority have been in their homes for more than ten years (82%).
This is her home. She’s always said that. She’s lived here all her life, and she wants to end it here. That’s the one thing that we’re adamant about … She’s got five children, and between the five of us, we take turns. Whatever it takes to keep her in her own home.
—Adult child, $50K-or-more-asset female, Los Angeles

46
46
(Note that 88% of those widowed and not living alone live with children.)

47
47
Adult Children
A majority of adult children (59%) report that their ages 85 and over parents have moved once (39%) or more (20%) during retirement. For those that did move, the primary reasons were to be in a residential community with services (39%), to be able to manage better physically (34%) or to be close to a child or other relatives (32%). Some also moved because upkeep on the old house was too hard (25%) or because the house was no longer safe (18%).

48
48
Half of adult children (50%) report that their ages 85 and over parents live in their own residence, while close to half (43%) report that their parents live in some type of community setting. Irrespective of the setting, a large majority of adult children (88%) report that their parents own their home free and clear, consistent with findings from those ages 85 and over. The small number of adult children living with elderly parents are far more likely to say they subsidize the finances (57%) of the parents than do those whose parents have their own homes (20%).

49
49
Half of adult children with parents living independently report that their parents either live alone (36%) or with a spouse (15%), and close to half (47%) report that they live with children (39%) or grandchildren (8%).

50
50
(Note that 46% of adult children with a widowed parent report that one or more of their children live with them.)
Health and Family Support
Not surprisingly, elderly respondents ages 85 and over respondents taking part in the phone survey report fairly high levels of health and self-sufficiency. Most adult children describe their parents as having fair or poor health.
A large majority of those ages 85 and over and adult children of this age group report that they have a close relationship with family living nearby. A large majority of both samples confirm that the elderly do not receive financial support from the family, although they claim to receive some physical support such as transportation, home cleaning or meals.
Interestingly, the elderly are not counting on their children to support them when their health declines, but most adult children say that their parent can count on it, although most of this support would not likely be financial. Some of this gap may be due to a lack of discussion on the issue.
As found in the qualitative research, the death of a spouse has not had major negative financial consequences at this stage of life.

51
51
Elderly Ages 85 and Over
Because the telephone survey was done directly with those over ages 85, it did likely achieve a healthier sample of this age group—those not in care, without cognitive issues and who could hear well enough. When asked about their health, only one in four report being in fair (17%) or poor (8%) condition. More than four in ten (43%) described their health as excellent or very good. More than seven in ten (71%) were able to manage their daily lives with at most minor support from others.
Almost eight in ten respondents (79%) report having a semiactive (38%), active (24%) or very active (17%) social life, with those having more than $2K in income more apt to report being active or very active than those with less than $2K (51% versus 36%).
I can’t feel there has been a drastic change. When I walk for a long distance, I get short of breath, but outside of that and my leg—I have nerve damage. I live with it. It doesn’t keep me from doing anything I want to do.
—Elderly, $50K-or-more-asset female, Los Angeles

52
52
Close to three in four (73%) say that parents have insurance to cover any of the costs that Medicare does not cover, which may explain why out-of-pocket medical costs are not big concerns for the elderly.

53
53
A large majority of respondents (86%) report having family members other than a spouse or partner with whom they have a close relationship and who live within 50 miles of them. In a plurality of cases (39%), it is one or two family members, although 46% report having three or more close family members living within 50 miles.
In a little more than one in ten cases (13%), this includes blended families, and, in these situations, respondents are mixed as to whether they would seek support from nonbiologically related family. Men (25%) are far more likely than women (8%) to report coming from such a family. Widows (9%) are less likely to report being part of a blended family than others (24%). Those ages 85 and over are mixed as to whether they would be less comfortable seeking support from this type of family—44% say no and 52% say yes.

54
54
Financial Aid and Support. In an overwhelming majority of cases (86%), elderly respondents over age 85 report receiving no financial support from family. However, it is more common for them to receive some type of support with physical activities such as providing transportation, meals or support with household chores. About one-third (32%) report receiving this support at least to some extent, although it is far less common for this to occur among those having $50K or more in assets (20% reporting at least to some extent than those with less). More than half (54%) get at least a little help.
That is the last thing I ever want to do is ask my children for money. If we go out for dinner, they pay for my dinner and I reciprocate. My son has a dog, and if he goes out of town, I take care of the dog. My daughter has two dogs, and I’ll take care of them. —Elderly, under-$50K-plus-asset male, Chicago
We pay our own bills. We use Visa because we like to have some points that maybe we can use for travel. One of the main things that was very important is that we are not dependent on the children. We have a daughter. She is on and off. She’s a person that she likes art, she likes music, not too much about making a living. That’s a different story. We are always there to help her.
—Elderly, $50K-or-more-asset male, Vancouver

55
55
However, those ages 85 and over do count on family to provide other types of support. About half of these elderly (49%) report the need to be driven places, women (58%) more so than men (33%). This is far more common among those with less than $50K in assets (55%) than it is with

56
56
those with greater assets (33%). Only about one-third (35%) report needing support in taking care of their residence or assistance in shopping (34%: 39% women and 23% men). Fewer than a quarter (23%) require assistance with housekeeping activities.
We had to take her license away. We had to go to DMV [Department of Motor Vehicles], and we got one of the identification cards instead of the license. I remember going. I don’t remember how many years ago that was. It was at least four years ago, I believe. So she was probably 81-ish at the time. Then, when we did that, my younger sister just took her car, because she needed a car at the time anyway. And my sister became like her chauffeur if she needed to go somewhere.
—Adult child, $50K-or-more-asset female, Baltimore
I have a washing machine, and my nephew comes over, or when my granddaughters come over and I have clothes to wash, they say, “Do you need anything?” I say that I’ve got some clothes in the hamper. They take the clothes out of the hamper.
—Elderly, $50K-or-more-asset male, Baltimore
Very few elderly ages 85 and over are counting on their family to provide entire (5%) or a great deal (19%) of support if their health declines, and close to half (49%) expect to receive little or no support.

57
57
Jill [daughter] takes care of my finances. She has told me I’m fine, and I’m going to be able to live here for I don’t know how long, you know. A long time. —Elderly, $50K-or-more-asset female, Los Angeles
Thought and Discussion Given to Finances. Most elderly ages 85 and over have not given thought to or had a family discussion on finances. Roughly one in ten report a great deal of thought or discussion with family on investing (10%), the type of lifestyle they want (11%), how long their assets will last in retirement (13%) or how to budget their money (9%).

58
58
Adult Children
In contrast, more than half of adult children (57%) claim that their parents are in either fair or poor health, while close to half (48%) say that their parents have a very inactive or inactive lifestyle. Many of these differences are a function of the sample—adult children are more apt to have parents in physical or cognitive decline.
Basically, the aging process, like she doesn’t walk as well. She used to walk good, and just starting now, once in a while she has to use the wheelchair because she couldn’t even walk properly. She’s just too weak.
—Adult child, under-$50K-asset female, Toronto

59
59
A large majority of adult children (91%) also report that their parents have close relatives living within 50 miles, and half (50%) report that there are three or more nearby relatives. Male children (57%) are more likely than female children (43%) to report that there are three or more relatives within 50 miles.
Respondents in the qualitative study were asked about the financial impact of the death of one parent on the other. Consistent with what we heard in this study, close to seven in ten (69%) claim that the surviving parent is either the same (55%) or better off financially (14%) as before the death.

60
60
Most adult children (54%), especially women, say that they are very close to their parents (61% of women compared to 48% of men).
Consistent with what the elderly ages 85 and over report, most adult children claim that they or their siblings provide no (50%) or little (21%) financial support. Only one in ten (11%) reports that they or their siblings provide a great deal of support. Close to half (46%) of those providing support say that they have done so for at least six years. About half (49%) report that support comes from a combination of them and siblings, and four in ten (39%) report that they alone

61
61
provide the support. Where more than one child are providing the support, half (51%) of the respondents maintain that they provide the most support, while a few report that it is a brother (15%) or sister (16%). Male children are more likely to subsidize their parents to at least some extent (36% versus 23% for female children). Adult children are least likely to subsidize parents living in their own homes (only 8% do so a great deal).

62
62
Adult children are most apt to report that they provide transportation to and from places (62%) or shopping (61%) for their elderly parents, especially widowed parents (68% and 66%, respectively). This is somewhat less common for parents of the of those ages 85 and over who could have taken the telephone survey, that is, older people who were not in cognitive decline or without hearing impairment. Widowed parents are more likely to receive such support. More than four in ten (44%) adult children manage medications or medical care for their parents, and

63
63
four in ten (40%) help clean their parents’ residence, do laundry (38%) or prepare meals (37%). Close to four in ten (38%) report that their parents have paid help to clean their residence, and close to one-third of the parents have paid help to prepare meals (32%), assist with personal care (31%) or do laundry (28%).
Eight in ten (80%) adult children report that their parents started receiving help within the last five years. Females (67%) are far more likely than males (42%) to say that they are the ones who provide hands-on help.

64
64
Adult children are far more likely to believe that their parents can count on family support than the elderly ages 85 and over were about themselves. Close to two-thirds believe that their parents can count on support either entirely (30%) or to a great extent (34%). Fewer than one in ten (7%) feel that their parents cannot count on this support at all.

65
65
More than one-third (35%) feel that their parents have difficulty managing their finances; of these, most (63%) say that they are helping their parents manage, and half (49%) say that other children do. More than half (55%) say that they started providing this help in the past five years. In half of these instances (49%) it is due to illness, cognitive decline or some other event. Children are much more likely to get involved than financial professionals or others. Only 12% report that they gradually got involved. In the qualitative research we saw instances where female elderly had relied on their husbands before children took over.
I guess when Mom moved to Sunrise, like I said, about five years, Mom’s expenses went way up. And at that point Mom had a little over $400,000 and we made some money in stocks and things, but the money has steadily I guess declined.
—Dyad, adult child, $50K-or-more-asset female, Baltimore

66
66

67
67
Although close to half (46%) of adult children report that their parents have an attorney, fewer than one-third claim that they have an accountant (31%) or a financial planner or advisor (28%). Fewer than one-third (29%) report that their parents have a social worker, counselor or care manager. Forty percent of the time the elderly parent alone interacts with the accountant, while more than half of the time the accountant meets with an adult child (35%) or together with an adult child and the elderly client (18%). Male children (56%) are more apt to report that their parent has an attorney than are female children (35%).

68
68
He keeps us in touch with our finances and … He recommends. And he buys and sells what he thinks is necessary.
—Elderly, $50K-or-more-asset male, Baltimore
Long-Term Care
Most elderly ages 85 and over with a spouse requiring long-term care either pay for the care themselves or rely on Medicaid, which requires a depletion of assets. Most elderly claim to be at least somewhat well prepared for the future expense of nursing care. However, adult children are not nearly as optimistic about their parents and often see the costs having a big impact. Furthermore, elderly ages 85 and over report that they will prepare for nursing home expenses by saving or cutting back. However, given the economic situation of most respondents, it is not likely that they can come close to paying for care this way. While the elderly and adult children are most likely to intend to handle future care needs by having by an aide or home health worker come to the home, the reality is that those requiring such care are far more likely to be in nursing homes than receiving in-home care.
Elderly Ages 85 and Over
About one-third (34%) report that their spouse does or did need nursing home care or in-home care, which is roughly split between being in a nursing home (31%), having the spouse provide

69
69
the care (30%) or having aides providing or sharing in providing the care (26%). Surprisingly, there is little difference between those with $50K or more in assets and those with less than this amount.
In a majority of cases (56%), respondents report paying for all or most of the costs of caring for a spouse with their own finances. Those with less than $50K in assets say this (62%) more often than those with higher assets (40%). More than a quarter (28%) say the care is provided at no cost, which could imply Medicaid. Another 22% say it is provided by Medicaid, including, surprisingly, 40% of those with $50K or more in assets. Few report receiving the support of other family members (6%), although those with $50K or more in assets are likely to report this.
If I needed long-term care, I really don’t know what I would do. I have wonderful children, and I know that they would help me out if needed.
—Elderly, under-$50K-asset female, Chicago
For example, if I cannot take care of myself and I need to go into, say, assisted living, I don’t think I can afford to go into assisted living at this point.
—Elderly, under-$50K-asset female, Chicago

70
70
A large majority claim (80%) to have been at least somewhat well prepared for taking care of a spouse, with almost four in ten (38%) saying they were very prepared. Those with $50K or more in assets were far more likely to report being very prepared (61%).
Two in three (64%) claim to be at least somewhat well prepared for the potential expense of needing long-term care for themselves, but only one in four (24%) report being very well

71
71
prepared. Those with assets of $50K or more are more likely to report being very well prepared (39%).
When asked how they will or did prepare for this potential expense, a majority, especially those with more than $2K in monthly income (69%), claim they intend to save on their own or already do so (59%). About half (48%) say they have or intend to cut down on other expenses, and close to half have had or intend to have a family discussion about the issue (46%). Surprisingly, far fewer (18%) have sold or intend to sell their home or get a reverse mortgage to pay such costs. Three in ten (30%) claim to have purchased or will purchase long-term care insurance; this is more often reported by those with more than $2K in income (39%). A majority claim that the cost of long-term care would have no burden (26%) or a minor burden (31%) on their family.
I have no concern about needing long-term care because I know my son would do everything. I know that Medicaid, my mother had to go on Medicaid when she was very, very ill. But I’m hoping that doesn’t happen to me.
—Elderly, $50K-or-more-asset female, Los Angeles

72
72
The most common way that the elderly ages 85 and over believe they will be taken care of is to have an aide or support in the home (25% say this), especially those with more than $50K in assets (45%). Fewer (14%) claim that they would move to a nursing home, and far fewer (3%) say that they would move in with family and have a home health worker would come to the family’s home to help them.

73
73
Most elderly ages 85 and over have life insurance, but this insurance tends to be used to cover funeral expenses (60%) rather than to provide significant amounts to take care of spouse or children (13%).

74
74
Adult Children
Close to four in ten (39%) report that at least one of their parents has required nursing home care or equivalent home support, with one-third (33%) requiring it now. The cause of this need is split between general frailty (41%) and cognitive decline (38%) and less often a chronic illness (28%). Children with $50K or more in assets are far more likely to have parents in a nursing home due to general physical frailty (50% of those with $50K or more in assets report this versus only 18% of those with less than $50K in assets).
Some of this care is not for ongoing chronic situations—27% report that the care is for recovery from surgery or from a fall (26%).

75
75
One-third of adult children say that their parents would have an aide come to the home if their parents required nursing care. Only one-quarter (26%) say that the parent would go to a nursing home, and one in five say that the parent would move in with them (17%) or do so with an aide (6%).
However, the reality is very different among parents reported to need care. Close to half (46%) are in a nursing home 24/7, and only close to three in ten get this level of care in an assisted living facility. Fewer than one in five (19%) report that full- or part-time aides come to the home.

76
76
She did make a call recently to a place called “A Place for Mom.” [Mother] Just to give me an idea of what it is. But I will fight for the death to just stay right here. I just think that it is time that I take some responsibility.
—Dyad, adult child, under-$50K-asset female, Los Angeles
Adult children report that parents typically bear responsibility for their own nursing home costs either through paying it themselves (62%) or Medicaid (44%), which requires them to have minimal assets. It is far rarer for the adult child (10%) or other siblings (8%) to have this responsibility. Very few (6%) use long-term care insurance.

77
77
Very few adult children (11%) report that their parents are very well prepared for the potential expense of needing nursing home care. The remaining are mixed on whether parents are somewhat well prepared (45%) or not well prepared (44%). Close to half (47%) say that these costs will be a major burden (38%) or catastrophic (9%).

78
78
The nursing home that she is in was part of the decision. Not every nursing home, so we found out after visiting quite a few, will accept Medicaid … They accept Medicaid and they will not turn anybody out who has outlived their money.
—Adult child, under-$50K-asset female, Chicago
About half the adult children (47%) say that their parents have cut down on expenses to pay for the cost of nursing care, and fewer than four in ten (37%) say that their parents have saved to cover these costs. More than four in ten (42%) report that they have or had a family discussion about how long-term care will be provided and paid for.

79
79
Only about one in five (19%) adult children not providing support to parents today say that they would be at least somewhat likely to provide financial support to care for their parents in the future.

80
80
As was the case among the elderly respondents, six in ten (60%) adult children say that their parents have a small life insurance policy to cover the cost of funeral expenses. Very few (12%) have purchased substantial coverage to provide for spouse or children.
When asked what impact supporting an elderly parent had on them, only a little more than one in four (27%) claim that it motivated them to take constructive financial action like getting their own finances in better order. A small group (7%) would also take better care of their health.

81
81
PROFILE OF SURVEY RESPONDENTS
Elderly Profile Total (n=201)
<$50K (n=152)
$50K+ (n=49)
Age 85–87 36% 36% 37% 88–89 28 28 29 90–94 28 28 31 95 or older 7 9 4 Gender Male 34% 30% 47% Female 66 70 53 Marital status Widowed 71% 70% 73% Married 17 16 20 Separated or divorced 8 9 6 Single, never married 3 4 — Not married, living with a partner — — — Education High school graduate or less 61% 68% 37% Some college/trade or vocational school 22 19 33 Bachelor’s degree 9 7 16 Graduate or professional degree 6 5 12 Postgraduate work 1 1 2 Savings and investments Less than $25,000 62% 82% — $25,000–$49,999 14 18 — $50,000–$99,999 12 — 49% $100,000–$199,999 6 — 27 $200,000–$299,999 4 — 16 $300,000–$399,999 2 — 8 $400,000 or more — — —

82
82
Elderly Profile Total (n=201)
<$50K (n=152)
$50K+ (n=49)
Number of Children Living None 10% 10% 10% One 13 13 14 Two 27 28 27 Three 22 20 31 Four 11 10 14 Five 7 9 2 Six or more 9 12 2 Number of Stepchildren Living None 82% 82% 82% One 5 6 4 Two 4 5 4 Three 3 2 6 Four <0.5 1 — Five 2 3 — Six or more 1 1 2 Don’t know/Refused 1 1 2 Number of Times Married (n=195) (n=146) (n=49) Once 73% 71% 80% Twice 19 22 12 Three times or more 8 8 8

83
83
Adult Children Profile Total (n=202)
Age Under 55 2% 55–59 24 60–64 30 65–69 30 70–74 14 Gender Male 50% Female 50 Employment Status Employed full-time 29% Employed part-time 8 Not working 10 Retired from your primary occupation 53 Education High school graduate or less 11% Some college/trade or vocational school 32 Bachelor’s degree 26 Graduate or professional degree 25 Postgraduate work 6 Savings and Investments Less than $25,000 10% $25,000–$49,999 16 $50,000–$99,999 22 $100,000–$199,999 13 $200,000–$299,999 11 $300,000–$499,999 7 $500,000–$999,999 8 $1,000,000 or more 12 Number of Siblings Living None 9% 1 31 2 25 3 17 4 or more 19 Number of Stepsiblings Living None 88%

84
84
1 5 2 3 3 or more 4
Adult Children Profile Total (n=202)
Age of [RELATION] 85–89 51% 90–94 37 95 or older 11 Marital Status of [RELATION] Widowed 75% Married to your mother 6 Divorced or separated 5 Married to your mother-in-law 4 Married to someone else 4 Married to your father 3 Married to your father-in-law 1 In a long-term relationship with his/her partner <0.5 Never married — Number of Times [ELDERLY REFERENCE] Married Once 75% Twice 19 Three times or more 6 Education of [RELATION] High school graduate or less 55% Some college/trade or vocational school 25 Bachelor’s degree 10 Graduate or professional degree 9 Postgraduate work 1 Savings and Investments of [RELATION] Less than $25,000 38% $25,000–$49,999 13 $50,000–$99,999 16 $100,000–$199,999 13 $200,000–$299,999 12 $300,000–$399,999 8 $400,000 or more —

85
85
Adult Children Profile Total (n=202)
Number of Parents or In-Laws Living and 85 or Older 1 72% 2 23 3 4 4 or more <0.5 Living Parent (has only one living parent 85 or older) (n=146) Mother 50% Mother-in-law 28 Father 13 Father-in-law 4 Stepmother 2 Stepfather 1 Stepmother-in-law 1 Stepfather-in-law 1 Parent Adult Child Knows Most About Mother 43% Father 27 Mother-in-law 13 Father-in-law 13 Stepmother 2 Stepfather 2 Stepfather-in-law 2 Stepmother-in-law —

86
86
APPENDIX A TABLE OF CHARTS
Elderly Questions
Q8. How financially secure do you feel currently? .................................................................... 24
Q9. How much do you worry about your finances? .................................................................. 24
Q10. How many regrets do you have about decisions you made in life as they relate to your
finances? .............................................................................................................................. 25
Q13. Are you concerned about having to support yourself in retirement for a
long time to come? .............................................................................................................. 25
Q14. How big an impact has each of the following had on your finances in the past five years? 27
Q15. Overall, how confident are you that you [and your spouse/partner] have the financial
resources you need to cover unexpected events such as needing major medical care
or long-term care or the death of a spouse? ........................................................................ 28
Q16. Thinking about your current financial resources and spending habits, would you say that
you spend …? ...................................................................................................................... 35
Q17. Overall, when it comes to spending your money, would you say that you are …? ............. 36
Q18. Compared to how you approached spending money 20 years ago, are you now …? ......... 36
Q19. Retirees rely on many different sources to provide them with the money they need to
cover their expenses. Which of the following are sources of income for your (and your
spouse’s/partner’s) retirement? .......................................................................................... 37
Q20. About how much income would you say your household gets each month from these
sources? ............................................................................................................................... 37
Q21. Thinking about your spending each month, would you say that you spend …? ................. 36
Q22. Do you think that you spend …? ......................................................................................... 38
Q23. Compared to ten years ago, do you think that you spend more or less now
on the following? ................................................................................................................. 38
Q24. To what extent, if at all, has debt negatively impacted your ability to maintain your
desired lifestyle? Would you say …? .................................................................................. 28
Q25. If you had to pass along advice to your children and grandchildren/the next generation
about money, what would you tell them? .......................................................................... 39

87
87
Q27. How knowledgeable would you say are when it comes to what you need to do to be
financially secure throughout retirement? ........................................................................... 29
Q28. Do you currently …? ............................................................................................................ 45
Q30. Who else lives with you in your home? ............................................................................... 46
Q31. Is your residence part of a continuing care community or some other type of
community setting that offers activities and some meals? .................................................. 46
Q32. For how many years have you resided in your current residence? ...................................... 47
Q34. In general, would you say your health is …? ....................................................................... 51
Q36. Not counting your spouse/partner, how many family members do you have with whom
you currently have a close relationship and live within 50 miles of you? .......................... 53
Q37. To what extent do you rely on your family to support you financially today? .................... 55
Q38. To what extent do you count on your family to support you with physical activities
such as driving you places, providing meals, cleaning your house, doing your laundry
or other activities? ............................................................................................................... 55
Q39. To what extent are you counting on your family to provide you with support if your
health and ability to function declines? ............................................................................... 57
Q40. Are you part of a blended family that includes children from previous marriages or
relationships of either you or your spouse? ......................................................................... 54
Q41. Would you be less comfortable seeking help, either financial or otherwise, from adult
children with whom you are not biologically related? Would you say …? ........................ 54
Q42. Given your current health and energy, what kind of lifestyle do you have? ....................... 52
Q43. Do you currently require any of the following? ................................................................... 56
Q44. Does/did your spouse partner require nursing home care or in-home care? ........................ 69
Q45. How is/was the care primarily provided to your spouse? .................................................... 69
Q46. Who pays/paid for all or most of the care for your spouse? ............................................... 70
Q49. In general, how well prepared were you for the expense of taking care of your spouse?
Would you say …? .............................................................................................................. 70
Q50. In general, how well prepared are you for the potential expense of needing long-term
care for yourself or your spouse/partner in the future? Are you …? .................................. 71
Q51. What have you and your spouse/partner done, or do you plan to do, to help prepare for
the costs of nursing home care or having a home aide? ...................................................... 72

88
88
Q52. If you needed to have nursing home care or to have a home aide provide care, what
would likely be the financial impact on your household? ................................................... 72
Q53. If you or your spouse/partner were to require care for the activities of daily living,
which of the following would you be most likely to do? .................................................... 73
Q54. How much thought or family discussion have you had about each of the following? ....... 57
Q55. Are you currently covered by either of the following? ........................................................ 73
Adult Children Questions
Q13. How much [does/do] your [ELDERLY REFERENCE] worry about their finances? ......... 30
Q14. Is/Are your [ELDERLY REFERENCE] concerned about having to support
himself/herself/themselves in retirement for a long time to come? .................................... 31
Q15. How big an impact has each of the following had on your [ELDERLY REFERENCE’S]
finances in the past five years? ............................................................................................ 33
Q16. How big an impact has each of the following had on your [ELDERLY REFERENCE’S]
finances in the past five to 20 years? ................................................................................... 33
Q17. Overall, how confident are you that your [ELDERLY REFERENCE] has/have the
financial resources [he/she needs]/[they need] to cover unexpected events such as for
major medical care or long-term care or the death of a spouse? Are you …? .................... 32
Q18. To the best of your knowledge, since retirement, has/have your [ELDERLY
REFERENCE’S] assets …? ................................................................................................ 40
Q19. After your [ELDERLY REFERENCE’S spouse/partner] passed away, was your
[ELDERLY REFERENCE] …? ........................................................................................ 60
Q20. Overall, when it comes to spending [his/her/their] money, would you say that your
[ELDERLY REFERENCE] is/are …? ................................................................................ 41
Q21. Compared to how your [ELDERLY REFERENCE] approached spending money
20 years ago, [is he/she]/[are they] now …? ....................................................................... 41
Q22. Retirees rely on many different sources to provide them with the money they need to
cover their expenses. Which of the following are sources of income for your
[ELDERLY REFERENCE’S] retirement? ........................................................................ 42
Q23. About how much income, in total, would you say your [ELDERLY REFERENCE’S]
household gets each month from these sources? ................................................................. 42

89
89
Q24. Thinking about your [ELDERLY REFERENCE’S] spending each month, would
you say that [he/she spends]/[they spend] …? .................................................................... 43
Q25. Do you think [he/she spends]/[they spend] …? ................................................................... 44
Q26. Compared to ten years ago and adjusting for changes in the cost of living, [does he/she]/
[do they] think that [he/she spends]/[they spend] more or less on the following? .............. 43
Q27. To what extent do [you or your siblings] subsidize your [ELDERLY REFERENCE’S]
finances? .............................................................................................................................. 61
Q28. For how long have [you or your siblings] been doing that? ................................................ 61
Q29. Who provides the financial support your [ELDERLY REFERENCE] receive(s)? ............. 62
Q31. Who provides the most financial support your [ELDERLY REFERENCE] receive(s)? .... 62
Q32. About what proportion of your [ELDERLY REFERENCE’S] income, if any, do/does
they/he/she use to provide financial support to a child or grandchild who is not doing
well financially? .................................................................................................................. 44
Q33. To what extent, if at all, has debt negatively impacted your [ELDERLY REFERENCE’S]
ability to maintain [his/her/their] desired lifestyle? Would you say …? ............................ 33
Q34. How knowledgeable would you say your [ELDERLY REFERENCE] is/are when it comes
to what [he/she needs]/[they need] to do to be financially secure throughout retirement? . 34
Q35. Does/do your [ELDERLY REFERENCE] have difficulty managing
his/her/their finances? ......................................................................................................... 66
Q36. Who, if anyone is helping him/her/them manage [his/her/their] finances? ......................... 66
Q37. When did your [ELDERLY REFERENCE] start receiving help with
his/her/their finances? ......................................................................................................... 67
Q38. Did your [ELDERLY REFERENCE] …? ........................................................................... 67
Q39. Since your [ELDERLY REFERENCE] retired, has/have he/she/they moved to a
different residence? ............................................................................................................. 47
Q40. What are the main reasons your [ELDERLY REFERENCE] moved/moved
most recently? ..................................................................................................................... 48
Q41. Do/does your [ELDERLY REFERENCE] currently live in:............................................... 49
Q42. Does/do your [ELDERLY REFERENCE] currently …? .................................................... 49
Q43. Who else, if anyone, lives with your [ELDERLY REFERENCE] in the home? ................ 50
Q45. In general, is/are your [ELDERLY REFERENCE’S] health …? ........................................ 58

90
90
Q46. Do/does your [ELDERLY REFERENCE] have someone who is his/her/their …? ............ 68
Q48. Not counting themselves, how many family members do/does your [ELDERLY
REFERENCE] have with whom there is a close relationship, and who live
within 50 miles? .................................................................................................................. 59
Q50. Does your [ELDERLY REFERENCE] receive help from any combination of family,
friends or paid help to do each of the following: ................................................................ 63
Q51. When did one of them first start/[ELDERLY REFERENCE] start receiving
hands-on help? ..................................................................................................................... 64
Q52. Who provides the hands-on help one or both receive/your [ELDERLY REFERENCE]
receives? .............................................................................................................................. 64
Q56. To what extent do/does your [ELDERLY REFERENCE] count on receiving help from
each of the following if his/her/their health and ability to function declines in
the future? ........................................................................................................................... 65
Q58. Given his/her/their current health and energy, is your [ELDERLY REFERENCE’S]
lifestyle …? ......................................................................................................................... 59
Q59. Has your /Have any of your [ELDERLY REFERENCE] ever required care in a nursing
home or paid in-home care that would otherwise be provided in a nursing home? ............ 74
Q60. What triggered their need for care or support? .................................................................... 75
Q64. How is the care primarily provided to your [ELDERLY REFERENCE REQUIRING
CARE]? .............................................................................................................................. 76
Q65. Who pays for all of most of the care for your [ELDERLY REFERENCE REQUIRING
CARE]? ............................................................................................................................... 77
Q67. In general, how well prepared is/are your [ELDERLY REFERENCE] for the potential
expense of needing long-term care for themselves in the future? Would you say [he/she
is]/[they are] …? .................................................................................................................. 78
Q68. Has/have your [ELDERLY REFERENCE] done, or plan to do, any of the following to
help prepare for the costs of nursing home care or having a home aide? ........................... 79
Q70. If your [ELDERLY REFERENCE] were to require care for the activities of daily living,
which of the following would they be most likely to do? ................................................... 75
Q71. Is/are your [ELDERLY REFERENCE] currently covered by any of the following? .... 52/80

91
91
Q72. How likely do you think it is that you will provide financial support to care for your
[ELDERLY REFERENCE] in the future? .......................................................................... 79
Q73. How has the support you have been providing for your elderly [ELDERLY
REFERENCE] affected your own thinking about aging? ................................................... 80
Q74. How emotionally close or connected do you feel you are to your [ELDERLY
REFERENCE]? ................................................................................................................... 60

92
92
APPENDIX B POSTED QUESTIONNAIRES
SOCIETY OF ACTUARIES 2017 LATE IN LIFE RETIREMENT SURVEY
ELDERLY Posted Questionnaire 10/23/17
1. In what year were you born? (Ages calculated) Total <$50K $50K+ (n=201) (n=152) (n=49) 85–87...................................................................................... 36% 36% 37% 88–89...................................................................................... 28 28 29 90–94...................................................................................... 28 28 31 95 or older ................................................................................ 7 9 4 Don’t know/Refused .............................................................. — — — 2. Gender Total <$50K $50K+ (n=201) (n=152) (n=49) Male ....................................................................................... 34% 30% 47% Female .................................................................................... 66 70 53 Don’t know/Refused .............................................................. — — — 3. Are you currently … Total <$50K $50K+ (n=201) (n=152) (n=49) Widowed ................................................................................ 71% 70% 73% Married ................................................................................... 17 16 20 Separated or divorced .............................................................. 8 9 6 Single, never married ............................................................... 3 4 — Unmarried and living with a partner in a permanent relationship ........................................................................ — — — Refused .................................................................................. — — —

93
93
4. [IF Q3=1–4] How many times have you been married in your life?
Total <$50K $50K+ (n=195) (n=146) (n=49) Once ....................................................................................... 73% 71% 80% Twice...................................................................................... 19 22 12 Three times or more ................................................................. 8 8 8 Never ...................................................................................... — — — Don’t know/Refused .............................................................. — — — 5. How many children do you have who are still living? Total <$50K $50K+ (n=201) (n=152) (n=49) None ....................................................................................... 10% 10% 10% One ......................................................................................... 13 13 14 Two ........................................................................................ 27 28 27 Three ...................................................................................... 22 20 31 Four ........................................................................................ 11 10 14 Five .......................................................................................... 7 9 2 Six or more ............................................................................... 9 12 2 Don’t know/Refused .............................................................. — — — 5a. How many stepchildren do you have who are still living? Total <$50K $50K+ (n=201) (n=152) (n=49) None ....................................................................................... 82% 82% 82% One ........................................................................................... 5 6 4 Two .......................................................................................... 4 5 4 Three ........................................................................................ 3 2 6 Four .......................................................................................... * 1 — Five .......................................................................................... 2 3 — Six or more ............................................................................... 1 1 2 Refused .................................................................................... 1 1 2 _______________________ *=<0.5% 6. What is the highest level of education you completed? Total <$50K $50K+ (n=201) (n=152) (n=49) High school graduate or less .................................................. 61% 68% 37% Some college/technical school ............................................... 22 19 33 Bachelor’s degree..................................................................... 9 7 16 Graduate or professional degree .............................................. 6 5 12 Postgraduate work .................................................................... 1 1 2 Refused .................................................................................. — — —

94
94
7. How much money do you have in savings and investments, not counting equity in your
home? Would you say … Total <$50K $50K+ (n=201) (n=152) (n=49) Less than $25,000 .................................................................. 62% 82% — $25,000 to less than $50,000 ($49,999) ................................. 14 18 — $50,000 to less than $100,000 ($99,999) ............................... 12 — 49% $100,000 to less than $200,000 ($199,999) ............................. 6 — 27 $200,000 to less than $300,000 ($299,999) ............................. 4 — 16 $300,000 to less than $400,000 ($399,999) ............................. 2 — 8 $400,000 or more ................................................................... — — — Don’t know/Refused .............................................................. — — — Views on Finances 8. [Risk Survey] How financially secure do you feel currently?
Total <$50K $50K+ (n=201) (n=152) (n=49) Very secure ............................................................................ 33% 27% 53% Somewhat secure ................................................................... 45 47 37 Not too secure ........................................................................ 10 10 10 Not at all secure ..................................................................... 11 14 — Don’t know/Refused ................................................................ 1 1 — 9. How much do you worry about your finances? Total <$50K $50K+ (n=201) (n=152) (n=49) A great deal ............................................................................ 13% 15% 6% To some extent ....................................................................... 16 16 16 A little .................................................................................... 32 30 39 Not at all ................................................................................. 38 38 39 Don’t know/Refused ................................................................ 1 1 — 10. How many regrets do you have about decisions you made in life as they relate to your
finances? Would you say … Total <$50K $50K+ (n=201) (n=152) (n=49) A lot ......................................................................................... 8% 11% — A fair amount ......................................................................... 14 17 6% A few ...................................................................................... 37 35 45 None ....................................................................................... 38 35 49 Don’t know/Refused ................................................................ 2 3 —

95
95
11. [IF 2–4] When you think about the regrets you have about decisions you made in life,
would you say that … Total <$50K $50K+ (n=120) (n=95) (n=25) All these decisions were made before you retired ................. 27% 24% 36% Most of these decisions were made before you retired .......... 28 25 36 An equal number of these decisions were made before and after retirement ........................................................... 16 16 16 Most of these decisions were made after you retired ............. 23 27 8 Don’t know/Refused ................................................................ 7 7 4 12. Until what age do you think that you can expect to live?
Total <$50K $50K+ (n=201) (n=152) (n=49) 85–89........................................................................................ 3% 4% 2% 90–94...................................................................................... 19 16 31 95–99...................................................................................... 12 11 16 100 or older ............................................................................ 16 15 18 Not sure/No way of knowing ................................................. 49 55 33
13. Are you concerned about having to support yourself in retirement for a long time to come?
Total <$50K $50K+ (n=201) (n=152) (n=49) Yes ......................................................................................... 24% 25% 20% No .......................................................................................... 75 73 80 Don’t know/Refused ................................................................ 1 2 — 14. How big an impact has each of the following had on your finances in the past five years?
Has [RANDOMIZE A–J] had a major, minor or no impact?
Total (n=201); <$50K (n=152); $50K+ (n=49) Major Impact
Minor Impact
No Impact
Not Applicable
Don’t Know/Refused
a. Repairs on your home or condo fee assessments
Total 13% 35% 45% 7% — <$50K 15 34 43 8 — $50K+ 8 37 51 4 —

96
96
Total (n=201); <$50K (n=152); $50K+ (n=49) Major Impact
Minor Impact
No Impact
Not Applicable
Don’t Know/Refused
b. Car repairs Total 5% 24% 60% 10% — <$50K 7 23 58 13 — $50K+ 2 29 65 4 — c. Dental expenses Total 13% 27% 58% 2% — <$50K 14 28 55 3 — $50K+ 10 22 65 2 — d. Medical expenses Total 19% 32% 47% 1% — <$50K 22 32 44 1 — $50K+ 8 33 57 2 — e. Death of a spouse Total 21% 8% 54% 16% — <$50K 24 9 51 17 — $50K+ 12 8 65 14 — f. Increases in real estate taxes Total 12% 22% 59% 7% — <$50K 14 22 55 9 — $50K+ 8 22 69 — — g. Increases in utilities Total 23% 27% 45% 4% — <$50K 26 30 39 6 — $50K+ 14 20 65 — — h. An adult child in need of financial
support
Total 7% 17% 69% 7% — <$50K 9 18 67 7 — $50K+ 2 16 73 8 — i. Needing assisted living Total 4% 18% 67% 10% — <$50K 6 22 61 12 — $50K+ — 8 86 6 — j. Giving gifts to children and
grandchildren
Total 7% 34% 52% 7% — <$50K 7 32 53 7 — $50K+ 6 39 49 6 —

97
97
15. Overall, how confident are you that you [IF MARRIED/PARTNER: and your spouse/partner] have the financial resources you need to cover unexpected events such as needing major medical care or long-term care, or the death of a spouse? Are you …
Total <$50K $50K+ (n=201) (n=152) (n=49) Very confident ....................................................................... 27% 24% 39% Somewhat confident............................................................... 41 39 47 Not too confident ................................................................... 15 15 14 Not at all confident................................................................. 11 15 — Don’t know/Refused ................................................................ 5 7 — 16. [Risk Survey] Thinking about your current financial resources and spending habits,
would you say that you spend …? Total <$50K $50K+ (n=201) (n=152) (n=49) Much more than you should .................................................... 3% 5% — Somewhat more than you should ............................................. 9 9 8% About what you should .......................................................... 59 54 73 Somewhat less than you should ............................................. 14 16 8 Much less than you should ....................................................... 9 11 4 Don’t know/Refused ................................................................ 6 6 6 17. Overall, when it comes to spending your money, would you say that you are …
Total <$50K $50K+ (n=201) (n=152) (n=49) Very frugal ............................................................................. 25% 26% 20% Somewhat frugal .................................................................... 51 48 59 Not too frugal ........................................................................... 9 10 6 Not at all frugal ...................................................................... 10 11 8 Don’t know/Refused ................................................................ 5 5 6 18. Compared to how you approached spending money 20 years ago, are you now …
Total <$50K $50K+ (n=201) (n=152) (n=49) More frugal ........................................................................... 34% 36% 27% About the same ...................................................................... 48 43 65 Less frugal .............................................................................. 15 18 4 Don’t know/Refused ................................................................ 3 3 4

98
98
19. Retirees rely on many different sources to provide them with the money they need to cover their expenses. Which of the following are sources of income for your (and your spouse’s/partner’s) retirement?
Total (n=201); <$50K (n=152); $50K+ (n=49) Source of Income
Not a Source of Income
Don’t Know/Refused
a. Social Security benefits Total 96% 4% — <$50K 96 4 — $50K+ 94 6 — b. A defined benefit pension plan, with benefits typically
based on salary and years of service. This is sometimes called a traditional pension plan.
Total 53% 43% 4% <$50K 51 45 4 $50K+ 61 35 4 c. An IRA or Roth IRA Total 21% 74% 4% <$50K 17 78 5 $50K+ 35 63 2 d. 401(k) or 403(b) Total 8% 86% 6% <$50K 5 88 7 $50K+ 18 78 4 e. Other sources of income Total 25% 74% 1% <$50K 20 78 2 $50K+ 41 59 —
20. About how much income would you say your household gets each month from these
sources?
Total <$50K $50K+ (n=201) (n=152) (n=49) Less than $2,000 per month ................................................... 55% 61% 39% $2,000 to $4,000 per month ................................................... 33 28 47 More than $4,000 per month .................................................... 4 5 4 Don’t know/Refused ................................................................ 7 7 10

99
99
21. Thinking about your spending each month, would you say that you spend …
Total <$50K $50K+ (n=201) (n=152) (n=49) A lot more than your income ................................................... 3% 4% 2% A little more than your income .............................................. 11 13 8 All of your income but no more ............................................. 19 20 16 A little less than your income ................................................ 47 47 49 A lot less than your income ................................................... 16 14 24 Don’t know/Refused ................................................................ 2 3 — 22. Do you think that you spend … Total <$50K $50K+ (n=201) (n=152) (n=49) Less than you did 10 years ago .............................................. 38% 38% 41% About the same ...................................................................... 34 30 47 More than you spent 10 years ago ......................................... 25 29 12 Don’t know/Refused ................................................................ 2 3 — 23. Compared to ten years ago, do you think that you spend more or less now on the
following?
Total (n=201); <$50K (n=152); $50K+ (n=49) More About the
Same Less Don’t
Know/Refused a. Housing Total 17% 44% 35% 3% <$50K 18 41 36 5 $50K+ 14 53 33 — b. Entertainment, such as going out to
dinner or the theater
Total 10% 26% 60% 3% <$50K 9 24 63 4 $50K+ 12 35 51 2 c. Travel costs Total 6% 14% 74% 5% <$50K 6 13 75 7 $50K+ 8 18 71 2 d. Medical costs Total 37% 43% 18% 1% <$50K 41 39 18 1 $50K+ 27 55 16 2

100
100
Total (n=201); <$50K (n=152); $50K+ (n=49) More About the
Same Less Don’t
Know/Refused e. Getting assistance in your daily life,
such as house cleaning, meals, personal care or transportation
Total 21% 47% 25% 7% <$50K 21 42 28 9 $50K+ 20 61 16 2 24. [Risk Survey] To what extent, if at all, has debt negatively impacted your ability to
maintain your desired lifestyle? Would you say … Total <$50K $50K+ (n=201) (n=152) (n=49) A great deal ............................................................................ 11% 14% 2% Somewhat ............................................................................... 25 27 18 A little .................................................................................... 17 18 16 Not at all/do not have debt ..................................................... 43 38 61 Don’t know/Refused ................................................................ 3 4 2

101
101
25. If you had to pass along advice to your children and grandchildren/the next generation about money, what would tell them?
Total <$50K $50K+ (n=201) (n=152) (n=49) Net: Save ................................................................................ 47% 46% 49% Save ................................................................................... 25 23 31 Save all you can, as much as you can ................................. 8 10 4 Start saving early, save now................................................ 7 7 6 Save 5% to 10% of income, save from every paycheck ..... 6 7 6 Save for emergencies/rainy day .......................................... 4 4 6 Net: Spend wisely/Live within means/Be frugal ................... 36 36 37 Spend wisely/carefully, don’t waste money ..................... 16 18 12 Live within your means, don’t spend more than you have, don’t go into debt, need not want ....................... 14 13 18 Be frugal/conservative ...................................................... 11 11 12 Invest: annuity, life insurance, 401(k) ..................................... 8 7 12 Plan/Prepare for future/retirement ........................................... 6 5 8 Pay off debt/bills ...................................................................... 5 5 6 Enjoy yourself, save some spend some, money isn’t the most important thing ........................................................... 4 5 2 Have a budget .......................................................................... 4 5 2 Get a job ................................................................................... 2 3 2 Take care of your things, buy quality ...................................... 2 2 2 No need for advice, children are doing well ............................ 2 1 6 I don’t give advice, they are grown, won’t listen .................... 3 3 4 Other ........................................................................................ 4 5 4 Don’t know .............................................................................. 5 7 — 26. Would you be more inclined to tell your children and grandchildren/the next generation
to …
Total <$50K $50K+ (n=201) (n=152) (n=49) Save more now because it takes more money than you think to make it through retirement .................................. 89% 89% 88%
OR Spend more now and enjoy life ............................................... 5 5 4 Don’t know/Refused ................................................................ 6 6 8

102
102
27. How knowledgeable would you say you are when it comes to what you need to do to be financially secure throughout retirement?
Total <$50K $50K+ (n=201) (n=152) (n=49) Very knowledgeable .............................................................. 32% 28% 47% Somewhat knowledgeable ..................................................... 50 51 47 Not too knowledgeable ............................................................ 9 12 2 Not at all knowledgeable ......................................................... 3 4 — Don’t know/Refused ................................................................ 5 5 4 Housing 28. [Risk Survey] Do you currently … Total <$50K $50K+ (n=201) (n=152) (n=49) Own your primary home free and clear ................................. 68% 63% 82% Own your primary home but owe money on a mortgage ...... 13 14 10 Rent your primary home .......................................................... 9 11 4 Have some other primary living arrangement ........................ 9 11 4 Don’t know/Refused ................................................................ * 1 —
29. Do you live alone or with others? Total <$50K $50K+ (n=201) (n=152) (n=49) Alone ...................................................................................... 66% 63% 73% With other people ................................................................... 34 37 27 Don’t know/Refused .............................................................. — — —
30. [IF LIVE WITH OTHERS] Who else lives with you in your home?
Total <$50K $50K+ (n=69) (n=56) (n=13) One or more of your children................................................. 52% 57% 31% Spouse or partner ................................................................... 45 39 69 One or more of your grandchildren ....................................... 14 14 15 Another relative ....................................................................... 6 5 8 A paid caregiver ..................................................................... — — — Someone else who is not related to you ................................... 6 7 — Don’t know/Refused ................................................................ 1 2 —
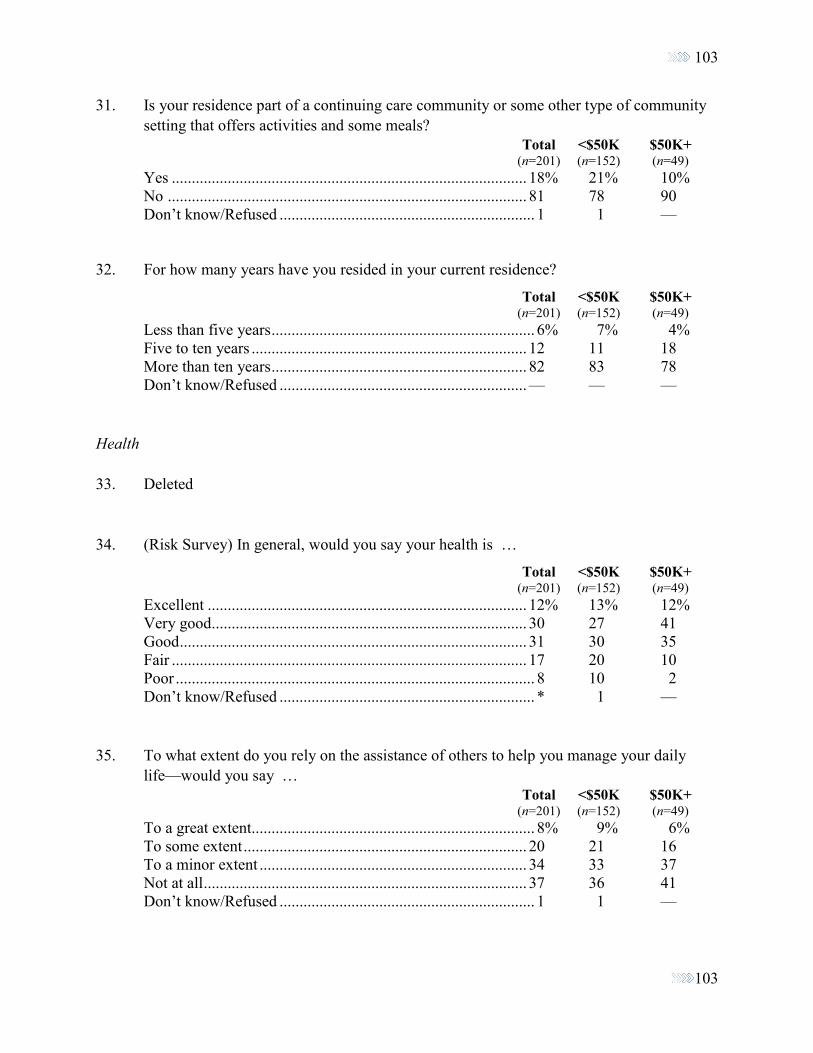
103
103
31. Is your residence part of a continuing care community or some other type of community setting that offers activities and some meals?
Total <$50K $50K+ (n=201) (n=152) (n=49) Yes ......................................................................................... 18% 21% 10% No .......................................................................................... 81 78 90 Don’t know/Refused ................................................................ 1 1 — 32. For how many years have you resided in your current residence?
Total <$50K $50K+ (n=201) (n=152) (n=49) Less than five years .................................................................. 6% 7% 4% Five to ten years ..................................................................... 12 11 18 More than ten years ................................................................ 82 83 78 Don’t know/Refused .............................................................. — — — Health 33. Deleted 34. (Risk Survey) In general, would you say your health is …
Total <$50K $50K+ (n=201) (n=152) (n=49) Excellent ................................................................................ 12% 13% 12% Very good............................................................................... 30 27 41 Good ....................................................................................... 31 30 35 Fair ......................................................................................... 17 20 10 Poor .......................................................................................... 8 10 2 Don’t know/Refused ................................................................ * 1 — 35. To what extent do you rely on the assistance of others to help you manage your daily
life—would you say … Total <$50K $50K+ (n=201) (n=152) (n=49) To a great extent....................................................................... 8% 9% 6% To some extent ....................................................................... 20 21 16 To a minor extent ................................................................... 34 33 37 Not at all ................................................................................. 37 36 41 Don’t know/Refused ................................................................ 1 1 —

104
104
Role of Family 36. [IF MARRIED/PARTNER] Not counting your spouse/partner] How many family
members do you have with whom you currently have a close relationship, and live within 50 miles of you?
Total <$50K $50K+ (n=201) (n=152) (n=49) None ....................................................................................... 14% 14% 14% 1 or 2 ...................................................................................... 39 39 41 3–5.......................................................................................... 26 28 18 6–10.......................................................................................... 9 9 10 11–15........................................................................................ 7 7 8 More than 15 ............................................................................ 3 2 8 Don’t know/Refused .............................................................. — — — 37. To what extent do you rely on your family to support you financially today? Would you
say …
Total <$50K $50K+ (n=201) (n=152) (n=49) A great deal .............................................................................. 1% 2% — To some extent ......................................................................... 4 5 4% A little ...................................................................................... 8 11 2 Not at all ................................................................................. 86 83 94 Don’t know/Refused .............................................................. — — — 38. To what extent do you count on your family to support you with physical activities such
as driving you places, providing meals, cleaning your house, doing your laundry or other activities? Would you say …
Total <$50K $50K+ (n=201) (n=152) (n=49) A great deal ............................................................................ 15% 18% 4% To some extent ....................................................................... 17 17 16 A little .................................................................................... 24 22 33 Not at all ................................................................................. 44 43 47 Don’t know/Refused .............................................................. — — —

105
105
39. To what extent are you counting on your family to provide you with support if your health and ability to function declines?
Total <$50K $50K+ (n=201) (n=152) (n=49) Entirely ..................................................................................... 5% 6% 4% A great deal ............................................................................ 19 20 18 To some extent ....................................................................... 21 23 14 A little .................................................................................... 22 22 22 Not at all ................................................................................. 26 23 37 Don’t know/Refused ................................................................ 5 6 4 40. Are you part of a blended family that includes children from previous marriages or
relationships of either you or your spouse? Does your family include stepchildren from either partner?
Total <$50K $50K+ (n=201) (n=152) (n=49) Yes ......................................................................................... 13% 13% 14% No ........................................................................................... 87 87 86 Don’t know/Refused .............................................................. — — — 41. [IF YES] Would you be less comfortable seeking help, either financial or otherwise, from
adult children with whom you are not biologically related? Would you say …
Total <$50K $50K+ (n=27) (n=20) (n=7) Definitely yes ......................................................................... 30% 30% 29% Probably yes ........................................................................... 22 15 43 Probably no ............................................................................ 15 15 14 Definitely no .......................................................................... 30 40 — Don’t know/Refused ................................................................ 4 — 14

106
106
Social Life 42. Given your current health and energy, what kind of lifestyle do you have?
Total <$50K $50K+ (n=201) (n=152) (n=49) Very active ............................................................................. 17% 16% 20% Active ..................................................................................... 24 22 29 Semiactive .............................................................................. 38 38 37 Inactive ................................................................................... 14 14 12 Very inactive ............................................................................ 6 8 2 Don’t know/Refused ................................................................ * 1 ____________________ *=<0.5%
Long-Term Care 43. Do you currently require any of the following? Total <$50K $50K+ (n=201) (n=152) (n=49)
The need to be driven places .................................................. 49% 55% 33% Support with taking care of your residence ........................... 35 36 31 Assistance with shopping ....................................................... 34 39 18 Support with daily or weekly housekeeping activities such as laundry or cooking ........................................................ 23 25 16 Care for the activities of daily living such as getting in and out of bed, getting dressed, toileting, bathing or feeding.... 8 11 2
None ....................................................................................... 36 33 45 Don’t know/Refused .............................................................. — — — 44. [IF MARRIED/PARTNER/WIDOWED]: Does/did your spouse partner require nursing
home care or in-home care? Total <$50K $50K+ (n=178) (n=132) (n=46) Yes ......................................................................................... 34% 33% 39% No ........................................................................................... 63 64 61 Don’t know/Refused ................................................................ 3 4 —

107
107
45. [IF YES] How is/was the care primarily provided to your spouse?
Total <$50K $50K+ (n=61) (n=43) (n=18) 24/7 care in a nursing home ................................................... 31% 30% 33% You provide the care .............................................................. 30 28 33 Part-time aides come to the home .......................................... 26 26 28 Family or friends provide the care ........................................... 8 9 6 Full time aides come to the home ............................................ 3 5 — Don’t know/Refused ................................................................ 2 2 — 46. [IF CARE PROVIDED BY AIDES] Who pays/paid for all or most of the care for your
spouse?
Total <$50K $50K+ (n=18) (n=13) (n=5) You do .................................................................................... 56% 62% 40% It was provided at no cost ...................................................... 28 31 20 Medicaid ................................................................................ 22 15 40 Long-term care insurance ...................................................... 11 15 — One or more children do .......................................................... 6 8 — Other family do ........................................................................ 6 — 20 One or more grandchildren do ............................................... — — — Don’t know/Refused .............................................................. — — —
47. [IF MEDICAID IS SOURCE OF PAYMENT] Did Medicaid start as soon as your spouse required the care, or did your household have to spend down their assets before Medicaid kicked in?
Total <$50K $50K+ (n=4) (n=2) (n=2) Medicaid started right away ................................................... 50% — 100% You had to spend down assets first ........................................ — — — Don’t know/Refused .............................................................. 50 100% — 48. [IF ANY SPENT DOWN ASSETS] What impact has your need to spend down assets
had on your finances? Has it been … Total <$50K $50K+ (n=0) (n=0) (n=0) Catastrophic ........................................................................... — — — Major ...................................................................................... — — — Minor...................................................................................... — — — No impact ............................................................................... — — — Don’t know/Refused .............................................................. — — —

108
108
49. [IF PROVIDING OR PROVIDED CARE/SUPPORT TO SPOUSE IN NURSING
HOME, Q44=1] In general, how well prepared were you for the expense of taking care of your spouse? Would you say …
Total <$50K $50K+ (n=61) (n=43) (n=18) Very well prepared ................................................................. 38% 28% 61% Somewhat well prepared ........................................................ 43 47 33 Not too well prepared............................................................... 8 12 — Not at all well prepared .......................................................... 10 12 6 Don’t know/Refused ................................................................ 2 2 — 50. In general, how well prepared are you for the potential expense of needing long-term care
for yourself/you or your spouse/partner in the future? Are you …
Total <$50K $50K+ (n=201) (n=152) (n=49) Very well prepared ................................................................. 24% 19% 39% Somewhat well prepared ........................................................ 40 38 49 Not too well prepared............................................................. 17 20 8 Not at all well prepared .......................................................... 12 16 — Don’t know/Refused ................................................................ 6 7 4 51. What have you/and your spouse/partner done, or do you plan to do, to help prepare for
the costs of nursing home care or having a home aide, starting with …
Total (n=201); <$50K (n=152); $50K+ (n=49)
Already Done
Intend to Do
Have Not Done and
Don't Intend to Do
Don’t Know/Refused
a. Purchase long-term care insurance Total 25% 4% 65% 5% <$50K 23 6 64 7 $50K+ 33 — 65 2 b. Save on your own Total 50% 9% 35% 5% <$50K 48 10 35 7 $50K+ 55 8 37 — c. Sell your home or get a reverse
mortgage Total 10% 8% 72% 10% <$50K 11 6 70 14 $50K+ 8 14 78 —

109
109
Total (n=201); <$50K (n=152); $50K+ (n=49)
Already Done
Intend to Do
Have Not Done and
Don't Intend to Do
Don’t Know/Refused
d. Cut down on other expenses Total 40% 7% 48% 4% <$50K 40 8 47 5 $50K+ 41 6 51 2 e. Having a family discussion about how
long-term care will be provided and paid for
Total 34% 11% 49% 5% <$50K 31 13 52 4 $50K+ 45 6 39 10
52. If you needed to have nursing home care or to have a home aide provide care, what
would likely be the financial impact on your household? Would those costs be …
Total <$50K $50K+ (n=201) (n=152) (n=49) Catastrophic ............................................................................. 5% 7% — A major burden ...................................................................... 22 25 12% A minor burden ...................................................................... 31 26 45 Not a burden ........................................................................... 26 25 29 Don’t know/Refused .............................................................. 16 16 14 53. [IF 43=6 (NONE)] If you or your spouse/partner were to require care for the activities of
daily living, which of the following would you be most likely to do? Activities of daily living (ADLs) can include getting in and out of bed, getting dressed, toileting, bathing or eating.
Total <$50K $50K+ (n=72) (n=50) (n=22) Have an aide and/or support in your home ............................ 25% 16% 45% Move to a nursing home ....................................................... 14 16 9 Move in with family............................................................... 14 14 14 Have a family member move in with you .............................. 13 16 5 Move in with family and have an aide come in to that home .. 3 4 — Would stay in house, not sure of arrangement ......................... 3 2 5 Move to assisted living ............................................................ 3 2 5 Don’t know/Refused .............................................................. 26 30 18

110
110
54. How much thought or family discussion have you had about each of the following? Starting with [RANDOMIZE AND READ LIST]—would you say you have discussed that a great deal, some, a little or none?
Total (n=201); <$50K (n=152); $50K+ (n=49) A Great
Deal Some A Little None Don’t
Know/Refused a. [IF Q7>1] How you should invest your
financial assets
Total (n=77) 10% 18% 13% 57% 1% <$50K (n=28) 7 14 18 61 — $50K+ (n=49) 12 20 10 55 2 b. The type of lifestyle you want for the rest
of your life
Total 11% 22% 21% 46% — <$50K 11 22 20 46 — $50K+ 10 20 24 45 — c. [IF Q7>1] How long your assets will last
in retirement
Total (n=77) 13% 18% 14% 52% 3% <$50K (n=28) 21 11 14 50 4 $50K+ (n=49) 8 22 14 53 2 e. How you need to budget your money Total 9% 17% 16% 57% * <$50K 11 16 17 57 — $50K+ 6 20 12 59 2 _______________________________ *=<0.5%
55. Are you currently covered by either of the following?
Total (n=201); <$50K (n=152); $50K+ (n=49) Yes No
Don’t Know/Refused
f. A large life insurance policy that would provide significant amounts to take care of your spouse or children
Total 13% 84% 3% <$50K 13 85 3 $50K+ 14 82 4 g. A small life insurance policy that would mostly cover
funeral expenses
Total 60% 40% — <$50K 59 41 — $50K+ 61 39 —

111
111
56. Do you have insurance to cover all or most of the costs that Medicare doesn’t cover?
Total <$50K $50K+ (n=201) (n=152) (n=49) Yes ......................................................................................... 70% 67% 78% No ........................................................................................... 27 28 22 Don’t know/Refused ................................................................ 3 5 —

112
112
SOCIETY OF ACTUARIES 2017 LATE IN LIFE RETIREMENT SURVEY
ADULT CHILDREN Posted Questionnaire 12/13/17
1. How many of your parents (including stepparents), or in-laws who are parents of your spouse
(including step-in-laws), are currently still living and age 85 or older?
Total (n=202) 1....................................................................................................................................72%
2....................................................................................................................................23 3......................................................................................................................................4 4 or more ..................................................................................................................... <0.5% None .............................................................................................................................—
2. [IF Q1=1] Is that individual your …
Total (n=146) Mother ..........................................................................................................................50% Father ...........................................................................................................................13 Mother-in-law ..............................................................................................................28 Father-in-law ..................................................................................................................4 Step relationships: Stepmother ...............................................................................................................2 Stepfather .................................................................................................................1 Stepmother-in-law....................................................................................................1 Stepfather-in-law......................................................................................................1
3. [IF Q1=1] Are you close enough to your [RESPONSE IN Q2] to have some knowledge of
[his/her] health status, financial situation and cognitive ability?
Total (n=146)
Yes .............................................................................................................................100% No ................................................................................................................................—

113
113
4. [IF Q1>1] Which of your parents or in-laws age 85+ do you know the most about, in terms of their health status, financial situation and cognitive ability?
Total (n=56) Mother ..........................................................................................................................43% Father ...........................................................................................................................27 Mother-in-law ..............................................................................................................13 Father-in-law ................................................................................................................13 Step relationships: Stepmother ...............................................................................................................2 Stepfather .................................................................................................................2 Stepmother-in-law..................................................................................................— Stepfather-in-law......................................................................................................2 Not close enough to any of them to have some knowledge
about those issues ......................................................................................................— 5. Exactly how old is your [Q2/Q4 RELATION]?
Total (n=202) 85–89............................................................................................................................51% 90–94............................................................................................................................37 95 or older ....................................................................................................................11
6. Does your [Q2/Q4 RELATION] have any of the following conditions:
Total (n=202) Yes No a. Moderate to severe cognitive decline 42% 58% b. Hearing impairment that makes communication difficult 49 51 c. Blind or legally blind 8 92 d. Limitations that require daily assistance with personal care 56 44

114
114
7. Is your [Q2/Q4 RELATION] currently …
Total (n=202)
[IF MOTHER/STEPMOTHER] Married to your father ...............................................3% [IF FATHER/STEPFATHER] Married to your mother ................................................6 [IF MOTHER-IN-LAW/STEPMOTHER-IN-LAW] Married to your father-in-law ....1 [IF FATHER-IN-LAW/STEPFATHER-IN-LAW] Married to your mother-in-law .....4 Married to someone else ................................................................................................4 In a long-term relationship with his/her partner ......................................................... <0.5 Widowed ......................................................................................................................75 Divorced or separated ....................................................................................................5 Never married ..............................................................................................................—
8. What is the total amount your [ELDERLY REFERENCE] has/have in savings and investments, not counting the equity in their home? Total (n=202)
Less than $25,000 ........................................................................................................38% $25,000–$49,999..........................................................................................................13 $50,000–$99,999..........................................................................................................16 $100,000–$199,999......................................................................................................13 $200,000–$299,999......................................................................................................12 $300,000–$399,999........................................................................................................8 $400,000 or more .........................................................................................................— Don’t know ..................................................................................................................—
9. How many times was/were your [ELDERLY REFERENCE] married or in long-term
relationships in their life? [IF Q7=1–6] Please include the number of marriages and long-term relationships, in total, for your [ELDERLY REFERENCE].
Total (n=202)
Once .............................................................................................................................75% Twice............................................................................................................................19 Three times or more .......................................................................................................6

115
115
10. How many brothers or sisters do you have who are still living?
Total (n=202) None ...............................................................................................................................9% 1....................................................................................................................................31 2....................................................................................................................................25 3....................................................................................................................................17 4 or more ......................................................................................................................19
11. How many stepbrothers or stepsisters do you have who are still living?
Total (n=202) None .............................................................................................................................88% 1......................................................................................................................................5 2......................................................................................................................................3 3 or more ........................................................................................................................4
12. What is the highest level of education your [Q2/Q4 RESPONSE] completed?
Total (n=202)
High school graduate or less ........................................................................................55% Some college/technical school .....................................................................................25 Bachelor’s degree.........................................................................................................10 Graduate or professional degree ....................................................................................9 Postgraduate work ..........................................................................................................1
Views on Finances 13. How much [does/do] your [ELDERLY REFERENCE] worry about their finances?
Total (n=202)
A great deal ..................................................................................................................16% To some extent .............................................................................................................23 A little ..........................................................................................................................29 Not at all .......................................................................................................................30 Don’t know ....................................................................................................................2

116
116
14. Is/are your [ELDERLY REFERENCE] concerned about having to support himself/herself/themselves in retirement for a long time to come?
Total (n=202)
Yes ...............................................................................................................................29% No ................................................................................................................................71
15. How big an impact has each of the following had on your [ELDERLY REFERENCE’S] finances in the past five years?
Total (n=202) Major Impact
Minor Impact
No Impact
Not Applicable
Don’t Know
a. Repairs on [his/her/their] home or condo fee assessments 9% 23% 40% 28% <0.5%
b. Medical expenses 22 45 28 5 — c. Death of a spouse 15 14 31 40 — d. An adult child in need of financial support 5 11 43 40 <0.5 e. Needing assisted living/help at home 30 31 19 19 <0.5 f. Giving gifts to children and grandchildren 4 22 53 18 3 g. Fraud 2 8 50 39 1 h. Investment losses 1 11 50 36 2 i. Increases in [his/her/their] regular monthly
bills, e.g., utilities, condo fees 16 34 37 13 —
16. .. Thinking back further in time, how big an impact has each of the following had on your
[ELDERLY REFERENCE’S] finances in the past five to 20 years?
Total (n=202) Major Impact
Minor Impact
No Impact
Not Applicable
Don’t Know
a. Repairs on [his/her/their] home or condo fee assessments 14% 47% 28% 10% 1%
b. Medical expenses 20 52 25 2 — c. Death of a spouse 36 19 22 22 <0.5 d. An adult child in need of financial support 5 21 43 30 — e. Needing assisted living/help at home 19 27 33 21 <0.5 f. Giving gifts to children and grandchildren 2 23 58 16 <0.5 g. Fraud 2 9 50 37 1 h. Investment losses 5 12 50 31 2 i. Increases in [his/her/their] regular monthly
bills, e.g., utilities, condo fees 12 49 32 7 —

117
117
17. Overall, how confident are you that your [ELDERLY REFERENCE] has/have the financial
resources [he/she needs]/[they need] to cover unexpected events such as for major medical care or long-term care, or the death of a spouse? Are you …
Total (n=202)
Very confident .............................................................................................................26% Somewhat confident.....................................................................................................48 Not too confident .........................................................................................................15 Not at all confident.......................................................................................................11
18. To the best of your knowledge, since retirement, has/have your [ELDERLY
REFERENCE’S] assets:
Total (n=202)
Declined a lot ...............................................................................................................25% Declined a little ............................................................................................................26 Stayed about the same ..................................................................................................35 Increased ......................................................................................................................14
19. [IF WIDOWED] After your [ELDERLY REFERENCE’S spouse/partner] passed away, was
your [ELDERLY REFERENCE]:
Total (n=152)
Better off financially ....................................................................................................14% About the same ............................................................................................................55 Worse off financially ...................................................................................................31
20. Overall, when it comes to spending [his/her/their] money, would you say that your
[ELDERLY REFERENCE] is/are … Total (n=202)
Very frugal ...................................................................................................................33% Somewhat frugal ..........................................................................................................45 Not too frugal ...............................................................................................................15 Not at all frugal ..............................................................................................................7

118
118
21. Compared to how your [ELDERLY REFERENCE] approached spending money 20 years
ago, [is he/she]/[are they] now …
Total (n=202)
More frugal .................................................................................................................38% About the same ............................................................................................................55 Less frugal ......................................................................................................................7
22. Retirees rely on many different sources to provide them with the money they need to cover
their expenses. Which of the following are sources of income for your [ELDERLY REFERENCE’S] retirement?
Total (n=202) Source of Income
Not a Source of Income
a. Social Security benefits 96% 4% b. A defined benefit pension plan, with benefits typically based
on salary and years of service. This is sometimes called a traditional pension plan. 55 45
c. An IRA or Roth IRA 29 71 d. 401(k) or 403(b) 9 91 e. Other sources of income 41 59
23. [RECEIVES INCOME FROM AT LEAST ONE SOURCE IN Q22] About how much
income, in total, would you say your [ELDERLY REFERENCE’S] household gets each month from these sources?
Total (n=201)
Less than $2,000 per month .........................................................................................51% $2,000–$4,000 per month ............................................................................................37 More than $4,000 per month ........................................................................................12

119
119
24. Thinking about your [ELDERLY REFERENCE’S] spending each month, would you say that [he/she spends]/[they spend] …
Total (n=202)
A lot less than his/her/their income .............................................................................24% A little less than his/her/their income ..........................................................................34 All of his/her/their income but no more .......................................................................26 A little more than his/her/their income ..........................................................................9 A lot more than his/her/their income .............................................................................7
25. Do you think [he/she spends]/[they spend] …
Total (n=202)
Less than he/she/they did 10 years ago ........................................................................46% About the same as 10 years ago ...................................................................................32 More than he/she/they did 10 years ago ......................................................................23
26. Compared to 10 years ago and adjusting for changes in the cost of living, [does he/she]/[do
they] think that [he/she spends]/[they spend] more or less on the following?
Total (n=202) More About the
Same Less a. Housing 30% 46% 24% b. Entertainment, such as going out to dinner or
the theater 4 31 65
c. Travel 1 24 74 d. Medical care 54 42 3 e. Getting assistance in [his/her/their] daily life,
such as house cleaning, meals, personal care or transportation
47 40 13

120
120
27. To what extent do you or your siblings subsidize your [ELDERLY REFERENCE’S] finances?
Total (n=202)
A great deal ..................................................................................................................11% To some extent .............................................................................................................18 A little ..........................................................................................................................21 Not at all .......................................................................................................................50
28. [IF ANY FINANCIAL SUPPORT PROVIDED(Q27>1)] For how long have you or your
siblings been doing that?
Total (n=101)
Just started recently ........................................................................................................7% For the past 1–2 years ..................................................................................................16 For the past 3–5 years ..................................................................................................32 For the past 6–10 years ................................................................................................28 For more than 10 years ................................................................................................18
29. [IF PROVIDES FINANCIAL HELP AND HAS SIBLINGS (Q27>1) (Q10>0 or Q11>0)]
Who provides the financial support your [ELDERLY REFERENCE] receive(s)?
Total (n=101)
You (and your spouse/partner).....................................................................................39% [IF HAS SIBLINGS] You in combination with 1 or more of your siblings ...............49 [IF HAS SIBLINGS] 1 or more of your siblings, but not you ....................................13
30. [IF SIBLING(S) PROVIDES FINANCIAL HELP (Q29=2 or 3)] Are the siblings that provide financial help your …
Total (n=62)
Brother(s) or stepbrother(s)..........................................................................................27% Sister(s) or stepsister(s) ................................................................................................31 Both brother(s)/stepbrother(s) and sister(s)/stepsister(s) .............................................42

121
121
31. [IF PROVIDING FINANCIAL HELP IN Q27] Who provides the most financial support your [ELDERLY REFERENCE] receive(s)? Total (n=101)
You ...............................................................................................................................51% A brother(s) or stepbrother(s) ......................................................................................15 A sister(s) or stepsister(s).............................................................................................16 Don’t know ..................................................................................................................18
32. About what proportion of your [ELDERLY REFERENCE’S] income, if any, do/does they/he/she use to provide financial support to a child or grandchild who is not doing well financially?
Total (n=202)
None .............................................................................................................................73% 1%–9% .........................................................................................................................16 10%–24% .......................................................................................................................8 25%–49% .......................................................................................................................2 50% or more ................................................................................................................ <0.5
33. To what extent, if at all, has debt negatively impacted your [ELDERLY REFERENCE’S]
ability to maintain [his/her/their] desired lifestyle? Would you say …
Total (n=202)
A great deal ....................................................................................................................9% Somewhat .......................................................................................................................9 A little ..........................................................................................................................11 Not at all/do not have debt ...........................................................................................69 Don’t know ....................................................................................................................1
34. How knowledgeable would you say your [ELDERLY REFERENCE] is/are when it comes to
what [he/she needs]/[they need] to do to be financially secure throughout retirement?
Total (n=202)
Very knowledgeable ....................................................................................................16% Somewhat knowledgeable ...........................................................................................42 Not too knowledgeable ................................................................................................23 Not at all knowledgeable .............................................................................................19

122
122
35. Does/do your [ELDERLY REFERENCE] have difficulty managing his/her/their finances?
Total (n=202)
Yes ...............................................................................................................................35% No .................................................................................................................................65
36. [IF YES (Q35=1)] Who, if anyone is helping him/her/them manage [his/her/their] finances? Check all that apply.
Total (n=70)
You ...............................................................................................................................63% Other children ..............................................................................................................49 Financial professional ....................................................................................................7 Grandchildren ................................................................................................................4 Other relatives ................................................................................................................3 Friend or neighbor..........................................................................................................1 Paid caregiver...............................................................................................................— Someone else .................................................................................................................1 No one is helping ...........................................................................................................1
37. [IF YES TO GETTING HELP WITH MANAGINGFINANCES (Q35=1)] When did your [ELDERLY REFERENCE] start receiving help with his/her/their finances?
Total (n=69)
Within the past 1–2 years .............................................................................................23% 3–5 years ago ...............................................................................................................32 6–10 years ago .............................................................................................................29 11–15 years ago .............................................................................................................6 More than 15 years ago ................................................................................................10

123
123
38. [IF YES TO GETTING HELP WITH FINANCES (Q35=1)] Did your [ELDERLY REFERENCE] …
Total (n=69)
End up being forced to make a major shift in responsibility because of illness, cognitive change or some other precipitating event ................................................49%
Gradually let others start helping with [his/her/their] finances ...................................39 Decide on his/her/their own to make a major shift in responsibility at one time ........12
Housing 39. Since your [ELDERLY REFERENCE] retired, has/have he/she/they moved to a different
residence?
Total (n=202)
Yes, just once ...............................................................................................................39% Yes, multiple times ......................................................................................................20 No .................................................................................................................................41
40. [IF YES] What are the main reasons your [ELDERLY REFERENCE] moved/[IF MOVED
MULTIPLE TIMES: moved most recently]? Check all that apply.
Total (n=119)
To be in a residential community with more services and help provided .................. 39% Unable to manage in house given physical limitations (e.g., cannot do stairs) ...........34 To be closer to a child or other relative .......................................................................32 Too much or too difficult upkeep required ..................................................................25 No longer a safe environment ......................................................................................18 Too expensive ..............................................................................................................13 Wanted to live in better climate .................................................................................. 10 Too socially isolated ......................................................................................................8 Needed the money from selling home to pay for care ...................................................7 Access to transportation was too limited .......................................................................4 Downsizing ....................................................................................................................2 Other ..............................................................................................................................6

124
124
41. [Do/does your [ELDERLY REFERENCE] currently live in:
Total (n=202)
Own residence (or partner’s residence) .......................................................................50% Assisted living that offers activities and some meals, plus some caregiving ..............14 Household of children or other family member other than spouse or partner .............10 A nursing home ............................................................................................................10 Independent living that offers activities and some meals ..............................................5 A continuing care retirement community (CCRC) that offers several levels
of health care on one campus ..................................................................................3 A different living situation .............................................................................................7
42. [Risk Survey, modified] [IF LIVES IN OWN RESIDENCE (Q41=1)] Do/does your
[ELDERLY REFERENCE] currently …
Total (n=101)
Own their primary home free and clear .......................................................................88% Own their primary home but owe money on a mortgage ..............................................8 Rent their primary home ................................................................................................4
43. [IF LIVES IN OWN RESIDENCE OR WITH FAMILY (Q41=1 or 2)] Who else, if anyone,
lives with your [ELDERLY REFERENCE] in the home?
Total (n=122)
One or more of his/her/their children ...........................................................................39% [IF Q7=7–8] He/she lives alone ...................................................................................36 [IF Q7=1–6] They only live with each other ...............................................................15 One or more of his/her/their grandchildren ...................................................................8 Another relative .............................................................................................................4 A paid caregiver .............................................................................................................2 Someone else who is not related to him/her/them .........................................................2

125
125
44. For how many years has/have your [ELDERLY REFERENCE] resided in [his/her/their] current residence?
Total (n=202)
Less than five years ......................................................................................................31% Five to ten years ...........................................................................................................21 More than ten years ......................................................................................................48
Health 45. In general, is/are your [ELDERLY REFERENCE’S] health …
Total (n=202)
Excellent ........................................................................................................................5% Very good.....................................................................................................................12 Good .............................................................................................................................25 Fair ...............................................................................................................................37 Poor ..............................................................................................................................20
Role of Family and Other Support 46. Do/does your [ELDERLY REFERENCE] have someone who is his/her/their …
Total (n=202) Yes No Don’t Know
a. Attorney 46% 46% 8% b. Accountant 31 64 5 c. Financial planner or advisor 28 66 5 d. Social worker, counselor or care
manager 29 65 6

126
126
47. [FOR EACH YES IN Q46] Who primarily interacts with that professional?
Your [ELDERLY
REFERENCE]
You or One of Your
Siblings
Jointly: You/Siblings
and Your [ELDERLY
REFERENCE] Someone
Else Don’t Know
a. Attorney (n=92) 38% 34% 21% 4% 3% b. Accountant (n=62) 40 35 18 3 3 c. Financial planner or advisor
(n=57) 35 42 19 4 —
d. Social worker, counselor or care manager (n=58) 22 50 24 3 —
48. Not counting themselves, how many family members do/does your [ELDERLY
REFERENCE] have with whom there is a close relationship, and who live within 50 miles?
Total (n=202)
None ...............................................................................................................................9% 1–2................................................................................................................................41 3–5................................................................................................................................23 6–10..............................................................................................................................15 11–15..............................................................................................................................3 More than 15 ..................................................................................................................8
49. To what extent do/does your [ELDERLY REFERENCE] rely on family to support him/her/them financially today? Would you say … Total (n=202)
A great deal ....................................................................................................................8% To some extent .............................................................................................................12 A little ..........................................................................................................................25 Not at all .......................................................................................................................54

127
127
50. [IF Q7=1–6: Does either of them]/[IF Q7=7–8: Does your [ELDERLY REFERENCE]] receive help from any combination of family, friends or paid help to do each of the following: Please mark all that apply for each activity. Count if hands-on help is being provided, but not if it is only financial support.
Total (n=202)
Family (Excluding
Their Spouse/Partner) Friends Paid Help
Don’t Know N/A
a. Personal care, such as getting in and out of bed, getting dressed, toileting, bathing or feeding
25% 2% 31% 1% 48%
b. Management of medications and medical care 44 2 26 2 30
c. Transportation to and from places 62 8 16 2 23 d. Shopping 61 7 11 2 27 e. Preparing meals 37 1 32 1 34 f. Doing laundry 38 <0.5 28 2 35 g. General upkeep and cleaning of
their residence 40 1 38 1 25
51. [IF ANY HANDS-ON HELP BEING PROVIDED] When did [IF Q7=1–6: one of them first
start] [IF Q7=7–8: your [ELDERLY REFERENCE] start] receiving hands-on help?
Total (n=177)
Within the past 1–2 years .............................................................................................35% 3–5 years ago ...............................................................................................................45 6–10 years ago .............................................................................................................16 11–15 years ago .............................................................................................................3 More than 15 years ago ..................................................................................................1

128
128
52. [IF ANY FAMILY PROVIDES HANDS-ON HELP(Q59>1)] Who provides the hands-on help [IF Q7=1–6: one or both receive?] [IF Q7=7–8: your [ELDERLY REFERENCE] receives]? Please mark all that apply.
Total (n=152)
You ...............................................................................................................................55% One or more of your siblings .......................................................................................49 Your spouse/partner .....................................................................................................28 Grandchildren ..............................................................................................................18 Your siblings’ spouse/partner ......................................................................................11 Other relatives ..............................................................................................................13
53. [IF SIBLINGS PROVIDES HANDS-ON HELP (Q52=2)] Are the siblings that provide hands-on help your …
Total (n=74)
Both brother(s)/stepbrother(s) and sister(s)/stepsister(s) .............................................45% Sister(s) or stepsister(s) ................................................................................................32 Brother(s) or stepbrother(s)..........................................................................................23
54. [IF ANY FAMILY PROVIDES HANDS ON HELP] Who provides the most hands-on help your [ELDERLY REFERENCE] receive(s) from family?
Total (n=152)
You ...............................................................................................................................37% A sister(s) or stepsister(s).............................................................................................26 Your spouse/partner .......................................................................................................9 A brother(s) or stepbrother(s) ........................................................................................8 Your siblings’ spouse/partner ........................................................................................4 Other relatives ..............................................................................................................13 Not sure ..........................................................................................................................4

129
129
55. [IF HAS SIBLINGS WHO PROVIDE FINANCIAL OR HANDS ON HELP] To what extent do you cooperate and work together with your siblings on providing financial or hands-on support to your [ELDERLY REFERENCE]?
Total (n=92)
A great deal ..................................................................................................................45% Somewhat .....................................................................................................................30 Just a little ....................................................................................................................17 Not at all .........................................................................................................................8
56. To what extent do/does your [ELDERLY REFERENCE] count on receiving help from each
of the following if his/her/their health and ability to function declines in the future?
Total (n=202) Entirely
A Great Deal
To Some Extent
Not at All
Don’t Know
a. Family 30% 34% 29% 7% <0.5% b. Friends 1 5 23 67 3 c. Paid help 11 24 25 33 6
57. Is/are your [ELDERLY REFERENCE] part of a blended family that includes children from
previous marriages or relationships of either spouse?
Total (n=202)
Yes ...............................................................................................................................14% No .................................................................................................................................86
Social Life 58. Given his/her/their current health and energy, is your [ELDERLY REFERENCE’S] lifestyle
…?
Total (n=202)
Very active .....................................................................................................................4% Active .............................................................................................................................9 Semiactive ....................................................................................................................38 Inactive .........................................................................................................................28 Very inactive ................................................................................................................20

130
130
Long-Term Care 59. Has /have any of your [ELDERLY REFERENCE] ever required care in a nursing home or
paid in-home care that would otherwise be provided in a nursing home?
Total (n=202)
Yes ...............................................................................................................................39% No .................................................................................................................................61
60. [IF YES (Q59=1)] What triggered their need for care or support? Select all that apply.
Total (n=78)
General physical frailty ................................................................................................41% Cognitive decline, Alzheimer’s, dementia or other mental confusion.........................38 A chronic or debilitating illness ...................................................................................28 Recovering from surgery .............................................................................................27 An accident, such as a fall............................................................................................26 Loneliness, depression or other emotional/mental health issue ...................................13 Something else ...............................................................................................................3
61. [IF Q7=1–6] Do one or both require it now?
Total (n=15)
Yes, one........................................................................................................................47% Yes, both ......................................................................................................................33 Neither..........................................................................................................................20
62. [IF ONE IN Q61] Is that your [Q2/Q4 RESPONSE] or their spouse/partner?
Total (n=7) [Q2/Q4 RESPONSE] ................................................................................................ n=4 Spouse/partner........................................................................................................... n=3

131
131
63. [IF Q7=7-8] Does your [ELDERLY REFERENCE] require it now?
Total (n=63)
Yes ...............................................................................................................................67% No .................................................................................................................................33
64. [IF YES IN Q61/Q63] How is the care primarily provided to your [ELDERLY
REFERENCE-SPECIFIC ONE]?
Total (n=54)
24/7 care in a nursing home .........................................................................................46% 24/7 care in an assisted living facility ..........................................................................28 Part-time aides come to the home ................................................................................11 Full time aides come to the home ..................................................................................7 Family or friends provide the care .................................................................................7 Your [ELDERLY REFERENCE] provides the care ...................................................—
65. [IF IN FACILITY OR CARE PROVIDED BY AIDES (Q64=1, 2, 3, 4)] Who pays for all or most of the care for your [ELDERLY REFERENCE-SPECIFIC ONE]?
Total (n=50)
Your [ELDERLY REFERENCE] does/do ..................................................................62% Medicaid ......................................................................................................................44 You do with other siblings ...........................................................................................14 You do ..........................................................................................................................10 Other siblings do primarily ............................................................................................8 Long-term care insurance ..............................................................................................6 Other family do ..............................................................................................................2 One or more grandchildren do .....................................................................................— It was provided at no cost ............................................................................................—

132
132
66. [IF SPOUSE PROVIDED CARE OR FINANCIAL SUPPORT IN Q64/Q65] In general, how well prepared was your [ELDERLY REFERENCE—SPECIFIC ONE (INSERTED IN Q64/Q65)] for the expense of taking care of your [ELDERLY REFERENCE—SPECIFIC ONE]? Would you say …
Total (n=7)
Very well prepared .......................................................................................................— Somewhat well prepared ........................................................................................... n=4 Not too well prepared................................................................................................ n=2 Not at all well prepared ............................................................................................. n=1
67. [IF Q59/Q61/Q63 DO NOT EQUAL YES] In general, how well prepared is/are your [ELDERLY REFERENCE] for the potential expense of needing long-term care for themselves in the future? Would you say [he/she is]/[they are] …. Total (n=148)
Very well prepared .......................................................................................................11% Somewhat well prepared ..............................................................................................45 Not too well prepared...................................................................................................25 Not at all well prepared ................................................................................................19
68. Has/have your [ELDERLY REFERENCE] done, or plan to do, any of the following to help
prepare for the costs of nursing home care or having a home aide?
Total (n=202) Already
Done Intend to Do
Have Not Done and
Don't Intend to Do
a. Purchase long-term care insurance 16% 6% 78% b. Save to cover the costs of long-term care 37 8 55 c. Sell the home 30 14 56 d. Cut down on other expenses 47 13 40 e. Have a family discussion about how long-term
care will be provided and paid for 42 16 42

133
133
69. [IF NOT VERY WELL PREPARED IN Q67] If your [ELDERLY REFERENCE] needed nursing home care or a home aide to provide care, what would the financial impact on the household likely be? Would those costs be …
Total (n=132)
Catastrophic ...................................................................................................................9% A major burden ............................................................................................................38 A minor burden ............................................................................................................42 Not a burden .................................................................................................................11
70. [IF NOT RECEIVING ANY HELP FOR PERSONAL CARE IN Q50] If your [ELDERLY
REFERENCE] were to require care for the activities of daily living, which of the following would they be most likely to do? Activities of daily living (ADLs) can include getting in and out of bed, getting dressed, toileting, bathing or eating.
Total (n=99)
Have an aide and/or support in their home ..................................................................33% Move to a nursing home .............................................................................................26 Move in with family.....................................................................................................17 Have a family member move in with them ..................................................................13 Move in with family and have an aide come in to that home ........................................6 Other ..............................................................................................................................4
71. Is/are your [ELDERLY REFERENCE] currently covered by any of the following?
Total (n=202) Yes No
a. A large life insurance policy that would provide significant amounts to take care of spouse or children 12% 88%
b. A small life insurance policy that would mostly cover funeral expenses 60 40
c. Employer-sponsored health insurance 22 78 d. Insurance to cover all or most of the costs that Medicare
doesn’t cover 73 27

134
134
72. [IF NOT ALREADY PROVIDING FINANCIAL SUPPORT(Q29=3)] How likely do you think it is that you will provide financial support to care for your [ELDERLY REFERENCE] in the future?
Total (n=114)
Very likely .....................................................................................................................4% Somewhat likely...........................................................................................................15 Not too likely ...............................................................................................................49 Not at all likely.............................................................................................................32
73. [IF PROVIDING SUPPORT(Q29=1, 2)] How has the support you have been providing for
your elderly [ELDERLY REFERENCE] affected your own thinking about aging? [IF NOT PROVIDING SUPPORT(Q29=3)] How have your experiences with your elderly [ELDERLY REFERENCE] affected your own thinking about aging?
Total (n=202) Be better prepared financially/Need to plan—get finances in order ............................27% No, it has not affected how I think about aging ...........................................................23 Yes, it has affected how I think about aging ................................................................13 Afraid of getting old/Worry about getting old/Don’t want to get old ..........................10 Take better care of myself (physical and mental health) ...............................................3 Other ............................................................................................................................23 Don’t know/Refused ......................................................................................................1
Now Just a Few More Questions about You …
74. How emotionally close or connected do you feel you are to your [ELDERLY REFERENCE]?
Total (n=202)
Very close ...................................................................................................................54% Somewhat close ...........................................................................................................32 Not too close ................................................................................................................10 Not at all close ...............................................................................................................3

135
135
75. [IF HAS SIBLINGS] How emotionally close or connected do you feel you are to your siblings?
Total (n=186)
Very close ...................................................................................................................35% Somewhat close ...........................................................................................................42 Not too close ................................................................................................................16 Not at all close ...............................................................................................................6
76. What is your current age?
Total (n=202) Under 55.........................................................................................................................2% 55–59............................................................................................................................24 60–64............................................................................................................................30 65–69............................................................................................................................30 70–74............................................................................................................................14
77. Are you …
Total (n=202)
Male ............................................................................................................................50% Female ..........................................................................................................................50
78. What is the highest level of education you completed?
Total (n=202)
High school graduate or less ........................................................................................11% Some college/technical school .....................................................................................32 Bachelor’s degree.........................................................................................................26 Graduate or professional degree ..................................................................................25 Postgraduate work ..........................................................................................................6

136
136
79. Are you currently …?
Total (n=202)
Employed full-time .....................................................................................................29% Employed part-time .......................................................................................................8 Not working .................................................................................................................10 Retired from your primary occupation ........................................................................53
80. What is the total amount your household has in savings and investments, not counting the
equity in your home?
Total (n=202)
Less than $25,000 ........................................................................................................10% $25,000–$49,999..........................................................................................................16 $50,000–$99,999..........................................................................................................22 $100,000–$199,999......................................................................................................13 $200,000–$299,999......................................................................................................11 $300,000–$499,999........................................................................................................7 $500,000–$999,999........................................................................................................8 $1,000,000 or more ......................................................................................................12

137
137
About The Society of Actuaries
The Society of Actuaries (SOA), formed in 1949, is one of the largest actuarial professional organizations in the world dedicated
to serving 30,000 actuarial members and the public in the United States, Canada and worldwide. In line with the SOA Vision
Statement, actuaries act as business leaders who develop and use mathematical models to measure and manage risk in support
of financial security for individuals, organizations and the public.
The SOA supports actuaries and advances knowledge through research and education. As part of its work, the SOA seeks to
inform public policy development and public understanding through research. The SOA aspires to be a trusted source of
objective, data-driven research and analysis with an actuarial perspective for its members, industry, policymakers and the
public. This distinct perspective comes from the SOA as an association of actuaries, who have a rigorous formal education and
direct experience as practitioners as they perform applied research. The SOA also welcomes the opportunity to partner with
other organizations in our work where appropriate.
The SOA has a history of working with public policymakers and regulators in developing historical experience studies and
projection techniques as well as individual reports on health care, retirement and other topics. The SOA’s research is intended
to aid the work of policymakers and regulators and follow certain core principles:
Objectivity: The SOA’s research informs and provides analysis that can be relied upon by other individuals or organizations
involved in public policy discussions. The SOA does not take advocacy positions or lobby specific policy proposals.
Quality: The SOA aspires to the highest ethical and quality standards in all of its research and analysis. Our research process is
overseen by experienced actuaries and nonactuaries from a range of industry sectors and organizations. A rigorous peer-review
process ensures the quality and integrity of our work.
Relevance: The SOA provides timely research on public policy issues. Our research advances actuarial knowledge while
providing critical insights on key policy issues, and thereby provides value to stakeholders and decision makers.
Quantification: The SOA leverages the diverse skill sets of actuaries to provide research and findings that are driven by the best
available data and methods. Actuaries use detailed modeling to analyze financial risk and provide distinct insight and
quantification. Further, actuarial standards require transparency and the disclosure of the assumptions and analytic approach
underlying the work.
Society of Actuaries 475 N. Martingale Road, Suite 600
Schaumburg, Illinois 60173 www.SOA.org