Post Modification of Liquid Polybutadienes and Their ...
111
Post Modification of Liquid Polybutadienes and Their Rheological Properties Dissertation with the aim of achieving the doctoral degree at the Faculty of Mathematics, Informatics and Natural Sciences submitted to the Department of Chemistry University of Hamburg by Hannes Jürgens Hamburg 2018
Transcript of Post Modification of Liquid Polybutadienes and Their ...

Post Modification of Liquid Polybutadienes
and Their Rheological Properties
Dissertation
with the aim of achieving the doctoral degree at the Faculty of Mathematics, Informatics and
Natural Sciences
submitted to the
Department of Chemistry
University of Hamburg
by
Hannes Jürgens
Hamburg 2018


Date of oral defense: 22.02.2019
Approval for printing: 22.02.2019
The experimental work described in this thesis has been carried out between May 2012 and July
2016 at the Institute of Technical and Macromolecular Chemistry, University of Hamburg in
the research group of Professor Dr. Gerrit A. Luinstra


The following evaluators recommend the admission of the dissertation:
1. Evaluator: Professor Dr. Gerrit A. Luinstra
2. Evaluator: Professor Dr. Hans-Ulrich Moritz


I
Table of Contents
List of Abbreviations .................................................................................................................. 1
1 Abstract .............................................................................................................................. 5
2 Zusammenfassung .............................................................................................................. 7
3 Introduction and Background ............................................................................................. 9
3.1 Synthetic Rubber ........................................................................................................ 9
3.2 Polybutadiene ........................................................................................................... 10
3.2.1 Introduction .......................................................................................................... 10
3.2.2 Anionic Polymerization of Polybutadiene ........................................................... 11
3.2.3 Radical Polymerization of Polybutadiene ............................................................ 12
3.2.4 Coordinative Polymerization of Polybutadiene ................................................... 12
3.2.5 Liquid Polybutadiene ........................................................................................... 14
3.2.6 Post Modification of Polybutadiene ..................................................................... 15
3.3 Rheology and Viscoelasticity ................................................................................... 18
3.3.1 Cox-Merz Relation ............................................................................................... 20
3.3.2 Small Amplitude Oscillatory Shear (SAOS) ........................................................ 20
3.3.3 Time Temperature Superposition ......................................................................... 21
4 Motivation ........................................................................................................................ 23
5 Results and Discussion ..................................................................................................... 24
5.1 Scalable Semi-Batch Process for Epoxidation of Polybutadienes ........................... 24
5.1.1 Epoxidation with Hydrogen Peroxide Feed ......................................................... 29
5.1.2 Larger Scale Reactions ......................................................................................... 36
5.1.3 Higher molecular weight polybutadienes ............................................................. 37
5.1.4 Material Properties ............................................................................................... 39
5.1.5 Summary .............................................................................................................. 42
5.2 Rheological Properties of Epoxidized Liquid Rubber in Bulk and Solution ........... 43

II
5.2.1 Molecular Weight Dependance ............................................................................ 44
5.2.2 Concentration Dependance .................................................................................. 45
5.2.3 Functionality dependence ..................................................................................... 46
5.2.4 Interim Conclusion ............................................................................................... 47
5.2.5 Temperature Dependence ..................................................................................... 48
5.2.6 Conclusion ............................................................................................................ 50
5.3 Aminolysis of Epoxidized Polybutadienes Catalyzed by Lithium Bromide ............ 52
5.3.1 Reaction Mechanism ............................................................................................ 52
5.3.2 Analysis of a Model System ................................................................................. 52
5.3.3 Progression of Aminolysis with Butyl Amine ..................................................... 54
5.3.4 Intramolecular Cyclization ................................................................................... 58
5.3.5 Higher Molecular Mass Epoxidized Polybutadienes ........................................... 62
5.3.6 Material Properties ............................................................................................... 62
5.3.7 Summary .............................................................................................................. 64
5.4 Quaternization of aminated polybutadienes ............................................................. 66
5.4.1 Reaction Mechanism ............................................................................................ 66
5.4.2 Analysis of a Model System ................................................................................. 66
5.4.3 Progression of Quaternization with Iodomethane ................................................ 68
5.4.4 Material properties ............................................................................................... 70
6 Summary .......................................................................................................................... 72
7 Experimental Part ............................................................................................................. 74
7.1 Materials ................................................................................................................... 74
7.2 Nuclear Magnetic Resonance (NMR) ...................................................................... 74
7.3 Matrix Assisted Laser Desorption (Time of Flight) Mass Spectrometry (MALDI) 74
7.4 Rheometry ................................................................................................................ 75
7.5 Differential Scanning Calorimetry (DSC) ................................................................ 75
7.6 Gel Permeation Chromatography (GPC) ................................................................. 75
7.7 Titration of Epoxidized Polybutadienes ................................................................... 75
III
7.8 Epoxidation of Polybutadienes ................................................................................. 76
7.8.1 Reaction Setup ...................................................................................................... 76
7.8.2 General Procedure of Epoxidation with in-situ Formed Performic Acid ............. 76
7.8.3 Degree of Epoxidation ......................................................................................... 77
7.8.4 Titration of Epoxide Groups ................................................................................ 78
7.9 Rheological Characterization of Epoxidized Polybutadienes .................................. 79
7.9.1 Materials ............................................................................................................... 79
7.10 Oscillatory Rheology measurements ........................................................................ 79
7.11 Aminolysis of Epoxidized Polybutadienes .............................................................. 80
7.11.1 Process .............................................................................................................. 80
7.11.2 Degree of Aminolysis ....................................................................................... 80
7.12 Quaternization of aminated polybutadienes ............................................................. 84
7.12.1 Process .............................................................................................................. 84
7.12.2 Degree of Quaternization ................................................................................. 84
8 Safety Data ....................................................................................................................... 87
9 Bibliography ..................................................................................................................... 91
10 Acknowledgements .......................................................................................................... 99
11 Declaration of Oath ........................................................................................................ 101

IV

List of Abbreviations
1
List of Abbreviations
|η*| Complex Oscillatory Viscosity
ABR Aminated Butadiene Rubber
aq. Aqueous
bp Boiling Point
BR Butadiene Rubber
c Concentration
cat. Catalyst
CR Chloroprene Rubber
DSC Dynamic Scanning Calorimetry
EA Activation Energy
EBR Epoxidated Butadiene Rubber
EP-value Epoxidation Value (Titration)
EPDM Ethylene Propylene Diene Rubber
eq. Equivalents
E-SBR Emulsion Styrene Butadiene Rubber
f Epoxidation Ratio
FA Formic Acid
g Structural Factor
G’ Oscillatory Shear Storage Modulus

List of Abbreviations
2
G’’ Oscillatory Shear Loss Modulus
GPC Gel Permeation Chromatography
HP Hydrogen Peroxide
I-Gated Inverse Gated Decoupling Experiment
IIR Isobutylene Isoprene Rubber
IR Isoprene Rubber
k reaction rate constant
LiBr Lithium Bromide
M Molecular Weight
m Mass
MALDI-Tof Matrix Assisted Laser Desorption Ionisation – Time of Flight
Mn Number Average Molecular Weight
Mw Mass Average Molecular Weight
NBR Acrylonitrile Butadiene Rubber
NMR Nuclear Magnetic Resonance
PBu Polybutadiene
PFA Performic Acid
ppm Parts per Million
PTFE Polytetrafluorethylene (Teflon®)
R Universal Gas Constant
SBR Styrene-Butadiene-Rubber
SBC Styrenic Block Copolymer Thermoplastic Elastomer

List of Abbreviations
3
SEC Size Exclusion Chromatography
SN2 Bimolecular Nucleophilic Substitution
S-SBR Solution Styrene Butadiene Rubber
T Temperature
T0 Reference Temperature
Tg Glass Transition Temperature
Tm Melting Point
THF Tetrahydrofurane
tKOH Titer
TTS Time Temperature Superposition
V Volume
w Weight Fraction
X Conversion
αT Shift Factor
δ Chemical Shift
η0 Zero Shear Viscosity
ξ Fiction Factor
φ Volume Fraction
ω Angular Frequency

List of Abbreviations
4

Abstract
5
1 Abstract
Polymers carrying functional groups for specific applications are accessible through two
different routes. The polymerization of monomers showing the desired functionality or the
post modification with the functional groups of existing polymers.[1] The former route
requires a polymerization environment that is tolerating the functional group. The process
often has limited versatility, because a monomer specific process is used. Post modification
on the other hand poses additional process steps increasing the production costs, especially
if expensive catalysts have to be used. In this thesis a versatile post modification process is
shown with easy accessible catalytic systems for the functionalization of polybutadienes.
The modification was done using low vinyl polybutadienes of molecular weights between
1500 and 26000 g/mol.
A two-phase semi batch epoxidation process using in-situ formed performic acid gave access
to a versatile intermediate which could be further functionalized. Continuous addition of
aqueous hydrogen peroxide to a toluene solution of polybutadiene, catalyzed by formic acid
gave a controllable, safe and scalable reaction. The reaction progress could be monitored by 1H-NMR spectroscopy or titration. The kinetics of the reaction were investigated and the
formation of performic acid was identified as rate determining step. The activation energy
using an Arrhenius-plot was determined and its value of 29 kJ/mol is in the range of those,
shown in the literature.[2,3]
The glass transition temperature of the epoxidated polybutadienes rose with increasing
epoxide content following the fox-equation. The bulk viscosity increased about one order of
magnitude by epoxidation of about 50%.
The versatile epoxidized polybutadienes described above were characterized by oscillatory
rheology. The change in viscosity by introduction of epoxide groups makes it necessary to
predict the product properties for optimal process design. Using the model introduced here
the final viscosity can be calculated based on conversion, molecular weight of
polybutadiene, concentration in toluene and reaction temperature.
The epoxide groups on the polymer backbone can be opened by nucleophiles of which
amines were investigated as an example in this thesis. A one step process with high
conversion using n-butylamine catalyzed by lithium bromide was developed. The kinetics

Abstract
6
of the reaction were looked at and a cyclization side reaction competing with the addition of
n-butylamine was identified.
The introduction of polar amine groups further increased the glass transition temperature to
about -20 °C at 30% amine content relative to initial double bond concentration. Signs of
conformational changes in the polymer chain could be observed using SEC measurements.
The secondary amine groups in aminated polybutadienes were methylated using
iodomethane and potassium carbonate to introduce ammonium ions. The reaction proceeded
at room temperature with an excess of iodomethane. The resulting polymer was a hard and
brittle material with a glass transition temperature of about 45 °C at 30% ammonium ion
content relative to initial double bond concentration. The solubility in polar solvents like
methanol increased significantly.

Zusammenfassung
7
2 Zusammenfassung
Polymere mit funktionellen Gruppen sind auf zwei verschiedenen Wegen zugänglich.
Funktionelle monomere können polymerisiert werden oder existierende Polymere können in
einer Post-Modifikation nachträglich funktionalisiert werden.[1] Die erste Route erfordert
eine Polymerisationsumgebung, welche die funktionelle Gruppe toleriert. Dieser Prozess ist
oft nur bedingt flexibel, da ein monomerspezifischer Prozess verwendet wird. Post-
Modifikation hat andererseits den Nachteil, dass zusätzliche Prozessschritte erforderlich
werden, was die Produktionskosten erhöht. Das gilt insbesondere, wenn teure
Katalysatorsysteme verwendet werden. In dieser Arbeit wird ein variabler Prozess gezeigt,
der die Post-Modifikation von Polybutadienen unter Verwendung von leicht zugänglichen
Katalysatorsystemen ermöglicht. Die Modifikationen wurden durchgeführt an
Polybutadienen mit niedrigem Vinylgehalt der Molmassen 1500 bis 26000 g/mol.
Ein zweiphasiger Semi-Batch-Prozess unter Verwendung von in-situ hergestellter
Perameisensäure machte ein variables Intermediat zugänglich, welches weiter
funktionalisiert werden konnte. Wässriges Wasserstoffperoxid wurde kontinuierlich zu einer
toluolischen Polybutadienlösung gegeben, welche Ameisensäure als Katalysator enthielt.
Dadurch wurde ein kontrollierbarer, sicherer und skalierbarer Prozess geschaffen. Der
Reaktionsfortschritt konnte per 1H-NMR und per Titration verfolgt werden. Die Kinetik der
Reaktion wurde untersucht und die Bildung der Perameisensäure als
geschwindigkeitsbestimmender Schritt identifiziert. Die Aktivierungsenergie wurde mit
Hilfe einer Arrheniusauftragung bestimmt. Der ermittelte Wert der Aktivierungsenergie von
29 kJ/mol liegt im Bereich der literaturbekannten Werte.[2,3]
Die Glassübergangstemperatur der epoxidierten Polybutadiene erhöhte sich mit steigendem
Epoxidgehalt und der Verlauf folgte der Fox-Gleichung. Die Viskosität erhöhte sich um etwa
eine Größenordnung bei einem Epoxidgehalt von 50%.
Die oben beschriebenen epoxidierten Polybutadiene wurden mit Hilfe von
Oszillationsmessungen rheologisch untersucht. Die Viskositätsänderung durch die
Einführung von Epoxidgruppen macht eine Abschätzung der Produkteigenschaften
unabdingbar für eine industrielle Prozessentwicklung. Das Modell, welches hier vorgestellt
wird, erlaubt es, die Viskosität des Produktes zu berechnen bei Kenntnis des Umsatzes, des

Zusammenfassung
8
Molekulargewichtes des eingesetzten Polybutadiens, dessen Konzentration in Toluol und
der Reaktionstemperatur.
Die Epoxidgruppen an dem Polymerbackbone können durch Nukleophile geöffnet werden.
In dieser Arbeit wurde die Reaktion mit Aminen als Beispiel gängiger Nukleophile genauer
untersucht. Ein einstufiger Prozess wird vorgestellt, welcher einen hohen Umsatz unter
Verwendung von n-Butylamin und Lithiumbromid als Katalysator verspricht. Die Kinetik
der Reaktion wurde betrachtet und eine Cyclisierung als Nebenreaktion identifiziert, welche
mit der n-Butylaminaddition konkurriert.
Die Einführung polarer Amingruppen erhöhte die Glassübergangstemperatur weiter auf
etwa -20 °C bei 30% Amingehalt bezogen auf die Konzentration an Doppelbindungen des
Ausgangspolybutadiens. Außerdem konnten Hinweise auf eine Konformationsänderung
durch GPC-Messungen beobachtet werden.
Die sekundären Amine der funktionalisierten Polybutadiene wurden methyliert unter
Verwendung von Iodmethan und Kaliumcarbonat. Mit einem Überschuss an Iodmethan lief
die Reaktion bei Raumtemperatur bis zu quartären Ammoniumionen ab. Das so erhaltene
Polymer war ein hartes sprödes Material mit einer Glassübergangstemperatur von etwa
45 °C bei einem Gehalt an quartären Ammoniumionen von 30% bezogen auf die
Doppelbindungskonzentration der eingesetzten Polybutadiene. Die Löslichkeit in polaren
Lösungsmitteln wie Methanol stieg signifikant.
Introduction and Background
9
3 Introduction and Background
3.1 Synthetic Rubber
Rubber is a material used in many industries like automotive, tires, medical applications and
everyday life. Apart from natural rubber, synthetic rubbers are a growing field with
increasing production capacities worldwide. Butadiene Rubber (BR) and butadiene
containing copolymers like styrene-butadiene-rubber (SBR) made over 75% of the global
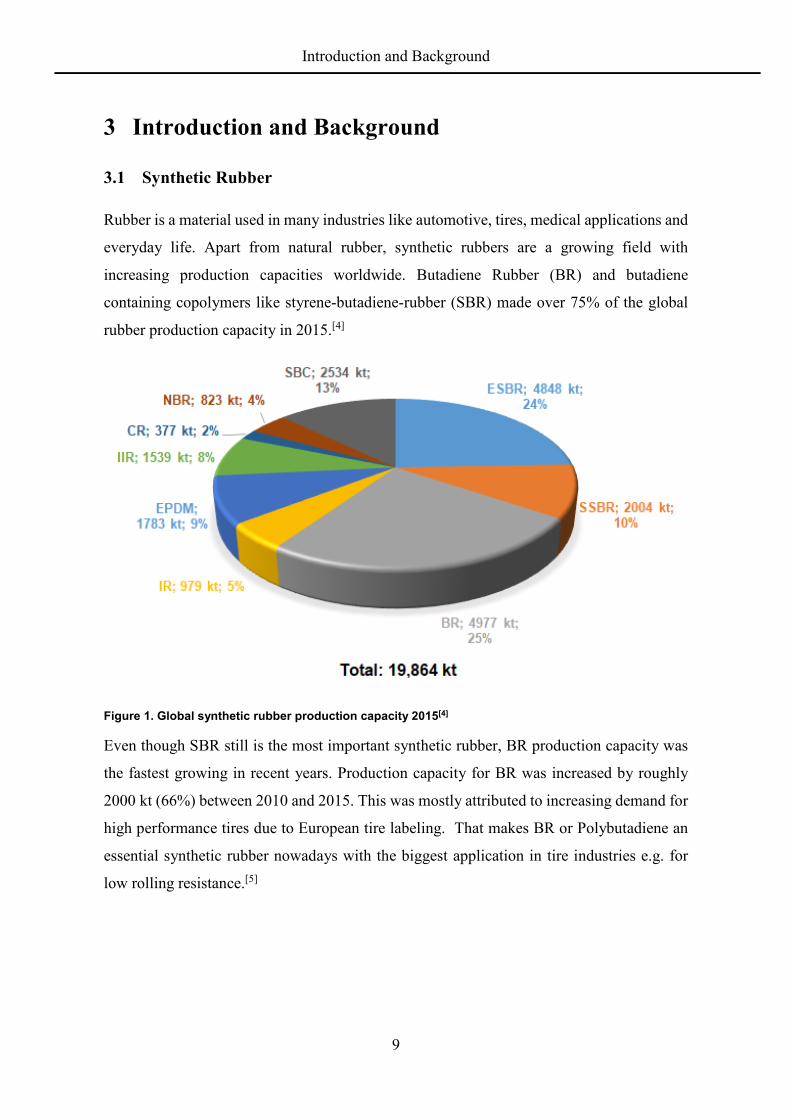
rubber production capacity in 2015.[4]
Figure 1. Global synthetic rubber production capacity 2015[4]
Even though SBR still is the most important synthetic rubber, BR production capacity was
the fastest growing in recent years. Production capacity for BR was increased by roughly
2000 kt (66%) between 2010 and 2015. This was mostly attributed to increasing demand for
high performance tires due to European tire labeling. That makes BR or Polybutadiene an
essential synthetic rubber nowadays with the biggest application in tire industries e.g. for
low rolling resistance.[5]

Introduction and Background
10
3.2 Polybutadiene
3.2.1 Introduction
The alkali metal catalyzed polymerization of butadiene was first described in the year
1910.[6–8] It was commercialized with the brand name BUNA in the 1920ies.[9] Stereoregular
polybutadienes (PBu) were introduced after the advances of Ziegler-Nata-Catalysts in the
1950ies.[10] The most important polymerization method today is the Ziegler-Natta-process
in solution. The largest quantities of polybutadiene today are used in tire industry.[5]
The properties of polybutadiene depend on the polymer microstructure. The butadiene can
be inserted in 1,4 or 1,2 (≡ 3,4) addition. The 1,4 isomers can be present in cis or trans form.
Additionally, a cyclic group can be formed out of two butadiene units carrying a terminal
double bond (Figure 2):
Figure 2. Polybutadiene isomers
Industrial scale polymerization of butadiene follows one of three different processes.
Anionic polymerization, radical polymerization or coordinative insertion polymerization.[11]
The microstructure of the polybutadiene depends on the method used.
Table 1. Microstructure and glass transition temperatures of polybutadienes[5]
Catalyst cis-1,4-content trans-1,4-content 1,2-content Tg [°C]
Nd – BR 97% 2% 1% -109
Co – BR 95% 3% 2% -107
Ni – BR 96% 2% 2% -107
Ti – BR 92% 4% 4% -105
Introduction and Background
11
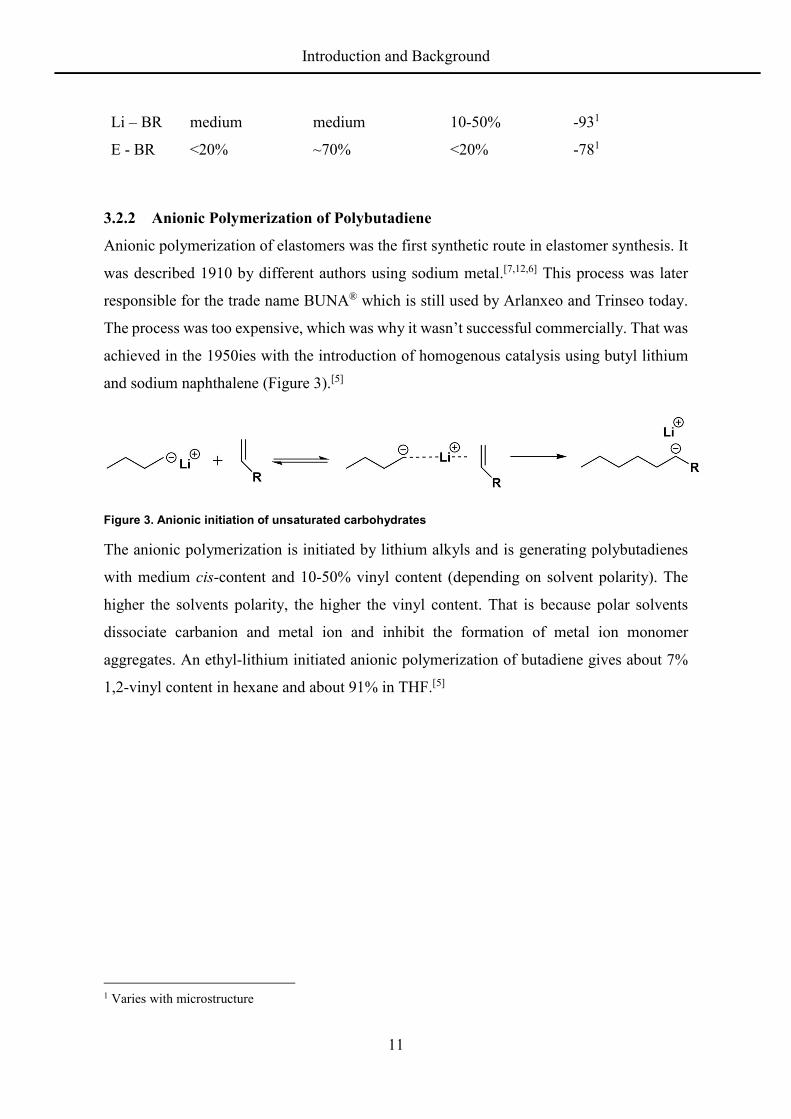
Li – BR medium medium 10-50% -931
E - BR <20% ~70% <20% -781
3.2.2 Anionic Polymerization of Polybutadiene
Anionic polymerization of elastomers was the first synthetic route in elastomer synthesis. It
was described 1910 by different authors using sodium metal.[7,12,6] This process was later
responsible for the trade name BUNA® which is still used by Arlanxeo and Trinseo today.
The process was too expensive, which was why it wasn’t successful commercially. That was
achieved in the 1950ies with the introduction of homogenous catalysis using butyl lithium
and sodium naphthalene (Figure 3).[5]
Figure 3. Anionic initiation of unsaturated carbohydrates
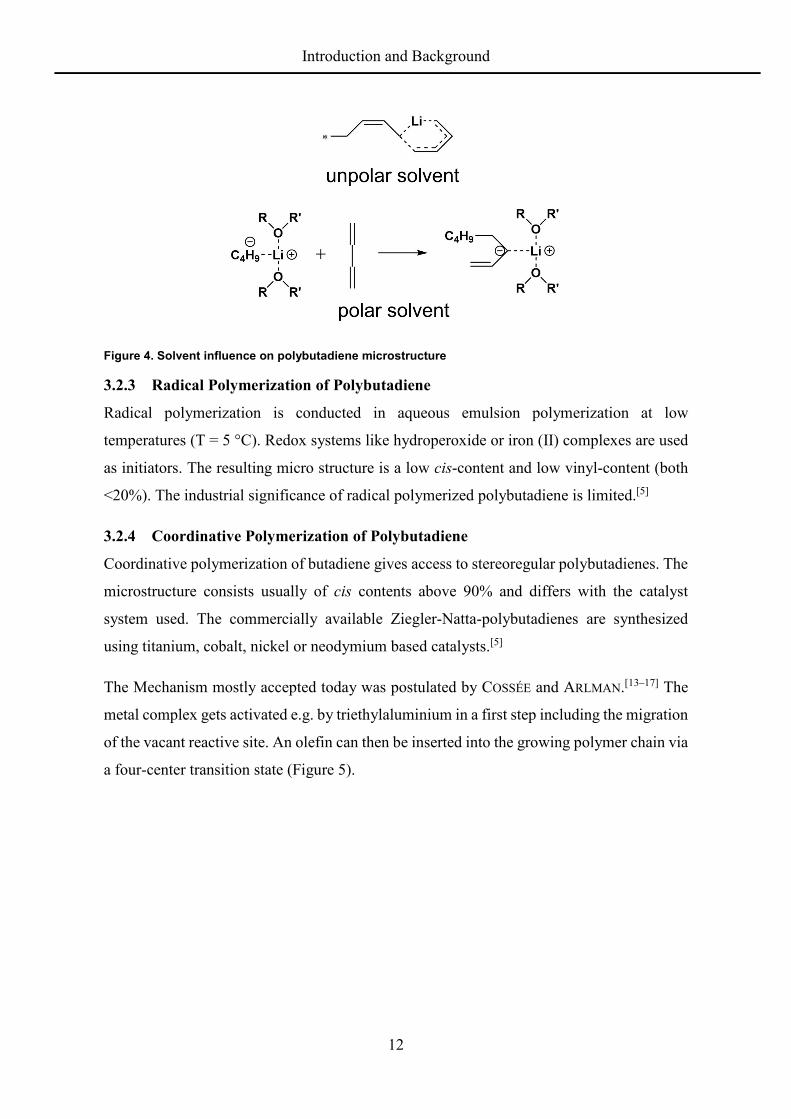
The anionic polymerization is initiated by lithium alkyls and is generating polybutadienes
with medium cis-content and 10-50% vinyl content (depending on solvent polarity). The
higher the solvents polarity, the higher the vinyl content. That is because polar solvents
dissociate carbanion and metal ion and inhibit the formation of metal ion monomer
aggregates. An ethyl-lithium initiated anionic polymerization of butadiene gives about 7%
1,2-vinyl content in hexane and about 91% in THF.[5]
1 Varies with microstructure
Introduction and Background
12
Figure 4. Solvent influence on polybutadiene microstructure
3.2.3 Radical Polymerization of Polybutadiene
Radical polymerization is conducted in aqueous emulsion polymerization at low
temperatures (T = 5 °C). Redox systems like hydroperoxide or iron (II) complexes are used
as initiators. The resulting micro structure is a low cis-content and low vinyl-content (both
<20%). The industrial significance of radical polymerized polybutadiene is limited.[5]
3.2.4 Coordinative Polymerization of Polybutadiene
Coordinative polymerization of butadiene gives access to stereoregular polybutadienes. The
microstructure consists usually of cis contents above 90% and differs with the catalyst
system used. The commercially available Ziegler-Natta-polybutadienes are synthesized
using titanium, cobalt, nickel or neodymium based catalysts.[5]
The Mechanism mostly accepted today was postulated by COSSÉE and ARLMAN.[13–17] The
metal complex gets activated e.g. by triethylaluminium in a first step including the migration
of the vacant reactive site. An olefin can then be inserted into the growing polymer chain via
a four-center transition state (Figure 5).

Introduction and Background
13
Figure 5. Mechanism of propene polymerization by Ziegler-Natta-Catalyst postulated by COSSEE and ARLMAN
1,3-Butadiene gets inserted almost exclusively in cis-1,4 position because of a lower energy
transition state of the cis-1,4-insertion (Figure 6).[18]
Figure 6. 1,3-Butadiene insertion by Ziegler-Natta Catalysts
The Polymerization of Butadiene with Ziegler-Natta Catalysts is done in solution with
monomer concentrations of 10-15% to avoid high viscosities. The Ziegler-Natta catalyzed
polymerization is the commercially most important process today for polybutadiene.[5]

Introduction and Background
14
High-cis-polybutadienes can crystallize and usually have melting points below room
temperature. Polybutadienes made by radical or anionic polymerization are amorphous.
Melting points and crystallization half-life at -20 °C highly correlate with cis-1,4-content
and are listed in Table 2.[5]
Table 2. Melting points and crystallization half-life of different types of polybutadiene
Type cis-1,4-content Tm [°C] crystallization half-life at -20 °C [min]
Nd-BR 97 -7 7
Co-BR 95 -11 40
Ni-BR 96 -10 25
Ti-BR 92 -23 360
Li-BR 38 amorph -
E-BR 14 amorph -
3.2.5 Liquid Polybutadiene
The viscosity of polymers is, apart from other factors like microstructure, dependent on their
molecular weight. Since this dependency is continuous there is no sharp differentiation
between a solid and liquid possible. Polybutadienes here are considered liquid at molecular
weights below 50000 g/mol (for low vinyl content), since their flowability at room
temperature then is easily visible to the naked eye. Since the term liquid polybutadiene is
vague the grades used in this thesis are named low molecular weight polybutadienes, which
all have a molecular weight below 50000 g/mol.
The synthesis of liquid polybutadienes mainly follows two methods: 1) a “telomerisation”
system where e.g. toluene not only acts as a solvent but also as a transmetallating and chain
transfer agent or 2) “living polymerization”. Anionic polymerization is used for both routes
with n-butyl lithium as iniator. In route 1) in addition to the initiator, a promoter is used and
the active chain end can be transferred to toluene to form benzyl lithium, which itself can
initiate new chains. This CH exchange reaction is responsible for the benzyl end group of
the vast majority of polymer chains made by this process. Lithene ultra® PM4 is made via
route 1, e.g. Lithene ultra® N4 5000 is made via route 2.[19]

Introduction and Background
15
Low molecular weight polybutadiene (PBu) is a relatively cheap and readily available
material. It represents a technically useful class of polymers with a variety of applications.
It is equally applied as (reactive) plasticizer[20,21], binder for varnish colors[22], adhesive[23]
and stabilizer[24].
3.2.6 Post Modification of Polybutadiene
Functionalized rubber is of high interest for some years now e.g. to improve the SBR filler
interaction in tire rubber compounds.[25] The range of applications for low molecular
polybutadienes can further be increased e.g. by introduction of epoxide groups on the
polymer backbone.[26–32] Epoxidation changes the polarity of the material and transforms it
into a reactive compatibilizer.[33–35] Epoxidized PBu could also function as a base polymer
for reactive functionalization processes, and as access to functionalized polyolefins, i.e. after
hydrogenation.[36,37] Epoxidation of PBu may be achieved by a variety of routes[36]; the
epoxidation with carboxylic peracids is one of the most convenient processes concerning the
availability of chemicals and experimental effort[38,39]. Latter may be provided as a
presynthesized peracid[39–45] or by an in-situ formation from a carboxylic acid and hydrogen
peroxide.[38,46,47,2,48–51,3] The in-situ procedure has the advantage of using smaller (final)
amounts of acid and has better economics. A lower acid concentration has a positive effect
on the rate of side reactions.[39,50] Formic acid as carboxylic acid has additional advantages
as it combines the function of carboxylic acid for providing performic acid with toluene
solubility with a pKs value that is low enough to catalyze the reaction. It is also used in this
study.
The biphasic system of Scheme 1, comprising an organic phase holding the PBu and an
aqueous phase with performic acid, is useful for preparing partly epoxidized PBu. The major
part of the performic acid is formed in water by an (acid catalyzed) esterification of formic
acid with hydrogen peroxide. It subsequently transfers into the toluene phase, where the
double bonds in PBu are epoxized and formic acid is regenerated. Formic acid is thus an
effective catalyst for the net oxidation of PBu with hydrogen peroxide.

Introduction and Background
16
Scheme 1. Biphasic epoxidation of polybutadiene by in-situ formed performic acid
Several side reactions may occur, in particular ring opening of the formed epoxide groups
by reaction with formic acid. Formation of hydroxyl-formyl functionalized polybutadiene is
favored at higher formic acid concentration and at elevated temperatures[50]. Hydroxyl
groups on epoxidized PBu may crosslink the polymer by reaction with further epoxy entities.
Low concentrations of formic acid are therefore favored. Hydrogen peroxide may also be
decomposed in a redox disproportionation reaction, a reaction that is also faster at higher
concentrations of hydrogen peroxide. It is most commonly added to the reactor in one batch
because of the ease of handling.[38,2,52] The downside of the procedure next to the lower
efficiency (oxygen formation) is the lower safety in comparison to a semi-batch procedure,
the smaller control over the extent of epoxidation and the risk of epoxide ring opening
reactions especially at elevated temperatures. Therefore, a robust procedure has been
developed allowing to adjust the epoxide content to a desired level, and to provide kg scale
of material. The protocol uses the principle depicted in Scheme 1 with low formic acid
concentrations and the semi-batch operation in hydrogen peroxide.
These epoxidized polybutadienes represent a reactive intermediate for further
functionalization reactions. The functionalization also opens new application possibilities

Introduction and Background
17
such as electrolytes[53] or gas separation[54]. The addition of amines is therefore an interesting
field of research in which many possible reaction pathways are reported[36].
A simple and straightforward method to add amines to the polymers backbone is the
nucleophilic ring opening of epoxides[36]. Epoxide groups in the polybutadiene backbone,
however, show a markedly low reactivity towards nucleophiles such as amines, compared
to asymmetrically substituted epoxides[55]. Various catalysts were proposed over time for the
ring opening of small molecular epoxides. Metal halides[56–58], metal triflates[59–62], solid
phase fixed catalysts[63] and metal free catalysts[64,65] were studied for their activity in
epoxide ring opening. Most of these studies however used asymmetric epoxides or
cyclohexene oxide, which show a considerably higher reactivity towards the ring opening
compared to epoxides on the polybutadiene backbone.
Very few studies cover the ring opening of epoxidized polybutadienes with amines and those
published show low conversions of epoxide groups in the backbone.[36] In this study lithium
bromide was used in a solvent free process for the nucleophilic ring opening of epoxides in
low molecular weight polybutadiene with amines. A simple synthetic pathway is presented
to quantitatively open the epoxide groups in the backbone of polybutadiene. Aditionally the
kinetics of the ring opening, side reactions and changes in properties of the functionalized
polybutadienes were studied.
Amines can be alkylated with alkylating agents like iodomethane or dimethyl sulfate in the
presence of a base.[66–69] The methylation, if allowed, is proceeding until ammonium ion
formation. Amines are very reactive towards alkylation because of their high nucleophilicity.
The Alkylation with iodomethane usually is proceeding at room temperature without any
additional catalysts. The quaternization of polybutadienes was reported before using
modified initiators in anionic polymerization[70] or post modification reactions[71]. These
examples include either intervention in the polymerization process or precious metal
catalysts. A straight forward reaction scheme is presented here to introduce ammonium ions
into the polybutadiene backbone using simple reaction steps without precious metal
catalysts.
Ammonium ion carrying polymers can be used as ion exchanger[72] or antistatics[73].
Introduction and Background
18
3.3 Rheology and Viscoelasticity
Rheology is the science of flow and deformation. The correlation between the deformation
ε of an ideal spring induced by a force F can be described by Hooke’s law:
= ∗
E in this case is a material constant describing its elasticity. This can be transferred to the
uniaxial deformation of an ideal solid where the force is replaced by the stress (force per
area).[74]
In ideal fluids a correlation can be drawn between stress and deformation with time. In shear
deformation these values are shear stress σ and shear rate :
= ∗
The constant of proportionality is the viscosity η, which is independent on the shear rate.
Real materials are neither ideal solids nor ideal fluids which makes the dynamic viscosity η
dependent on the shear rate . The observed behavior can be e.g. shear thinning or shear
thickening. Shear thinning is observed with most polymer melts, where entanglements are
influencing the behavior at higher shear rates. They show newtonian behavior at low shear
rates, at higher shear rates the loosening of entanglements predominates, and the viscosity
decreases. The opposite behavior (shear thickening) can be observed e.g. due to the
formation of strain induced crystallization (Figure 7).

Introduction and Background
19
Figure 7. Newtonian, shear thinning (pseudo plastic) and shear thickening (dilatant) behavior
The range of shear rates in everyday life applications is very broad. Typical shear rates of
some applications are depicted in Figure 8.[75]
Figure 8. Shear rate and some applications

Introduction and Background
20
3.3.1 Cox-Merz Relation
Usual plate-plate rheometers cover a shear rate range of 10-2 to 102 s-1. Capillary viscometers
cover shear rate ranges between 10-1 s-1 and 104 s-1. Combined both methods can cover a
broad range of shear rate but requires extensive analytical effort and material.[1] An easy
empirical method was introduced 1958 by W. P. COX AND E. H. MERZ.[76] They postulated
the dynamic viscosity η( ) at a constant shear rate equals the absolute complex viscosity
|η*(ω)| at constant angular frequency ω if = . With this relation a broad range of shear
rate can be covered by simple oscillatory shear experiments. This relation is valid for most
unfilled polymer solution and melts and it makes the oscillatory shear experiment a powerful
tool in analyzing polymer melts.[77]
3.3.2 Small Amplitude Oscillatory Shear (SAOS)
In oscillatory shear experiments the deformation is not continuously increasing but is applied
sinusoidal. This sinusoidal deformation γ generates a stress response σ which is also
sinusoidal as long as the amplitude does not exceed the linear viscoelastic region of the
material.
Figure 9. Applied amplitude and stress response in an oscillatory shear experiment
In ideal solids the response comes without delay and the phase angle δ is 0 °. Ideal fluids
respond with a phase angle of 90 °. Viscoelastic materials like polymer melts have phase
angles somewhere in between. This complex stress response G* can be divided into elastic

Introduction and Background
21
and viscous contribution to the stress response and are represented by the storage modulus
G’ and the loss modulus G’’ which are defined as follows:
= ∗
= ∗
∗ = + ∗ ′′ The absolute complex viscosity can be determined from the absolute complex stress
response and the angular frequency
| ∗| = | ∗|
The range of frequency in rheometers is limited to around 10-3 to 103 rad/s.[75] It is also very
time consuming to measure at low frequencies. With time-temperature superposition the
range of frequency can be expanded.
3.3.3 Time Temperature Superposition
The time temperature superposition (TTS) usually is applied to non-crosslinked, unfilled
materials. Additionally, the following requirements for the investigated materials need to be
met for the applied temperature range:[77]
The investigated materials mustn’t follow erratic change in structural character
The material mustn’t undergo strain crystallization
The glass transition temperature of the material should be significantly below the
temperature of measurement
The principle of TTS states a comparable influence on rheological properties for the time
frame of shear stress and the temperature. A decrease in temperature has a similar influence
on shear moduli like the increase in frequency. Several measurements in a certain range of
frequency at different temperatures can therefore be shifted to a master curve with an
expanded range of frequency. Frequency sweeps measured at higher temperatures compared
to the reference temperature are shifted to lower frequencies and vice versa (Figure 10).

Introduction and Background
22
Figure 10. Schematic shifting of temperature sweep measurements to a master curve

Motivation
23
4 Motivation
The aim of this work is the development of a reaction process for post modification of
polybutadienes. The idea is to use the cheap and readily available polybutadiene and
introduce polar groups to the polymer backbone to widen the range of application.
The identified pathway includes the epoxidation of double bonds to get a reactive
intermediate. This intermediate can be further functionalized with various nucleophiles of
which amines as an example are considered in detail. Additionally, the amine groups are
alkylated towards ammonium ions to widen the range of possible applications even further.
Since the functionalization is expected to have an influence on the polybutadiene properties,
the rheological behavior is also of interest, and has been studied too.
Low molecular weight polybutadienes are used as model materials for better processing and
analytical evaluation.
IV. Introduction of ions through alkylation
Alkylation of amine groups towards ammonium ions
III. Functionalization of intermediate with nucleophile
Epoxide opening by amines as example for functionalization
with nucleophilesRealization of significant conversion
II. Rheological evaluation of intermediate
Estimation of large scale processing feasability
I. Access to a reactive polybutadiene based intermediate
Modification of polybutadiene double bonds by epoxidation Developement of scaleable process

Results and Discussion
24
5 Results and Discussion
5.1 Scalable Semi-Batch Process for Epoxidation of Polybutadienes
Various commercially available polybutadienes with relatively low molecular weights were
used in this study. They have a similar microstructure with a vinyl content below 20% and
almost no cyclic groups (Table 3; Figure 11). They appear as low to medium viscous oils.
The PBus were dissolved in toluene to a weight percentage of 10-15%, being in the range of
concentration in a typical PBu production facility.[5] The resulting viscosity of the solutions
guarantees a sufficient fast mass transport between the phases (vide infra). The phase
relationships of the liquid-liquid system were kept in the range of 5-35 for Vorg/Vaq.
Table 3. Low molecular weight polybutadienes
PBu molecular mass (Mn)
[g/mol]
1,4-DB
[%]
1,2-DB
[%]
cyclic-DB
[%]
cis:trans
ratio2
Lithene PM4 1500 80 19 <1 40:60
Lithene N4-5000 5000 88 12 0 40:60
LBR-307 8000 86 14 0 40:60
LBR-305 26000 91 9 0 40:60
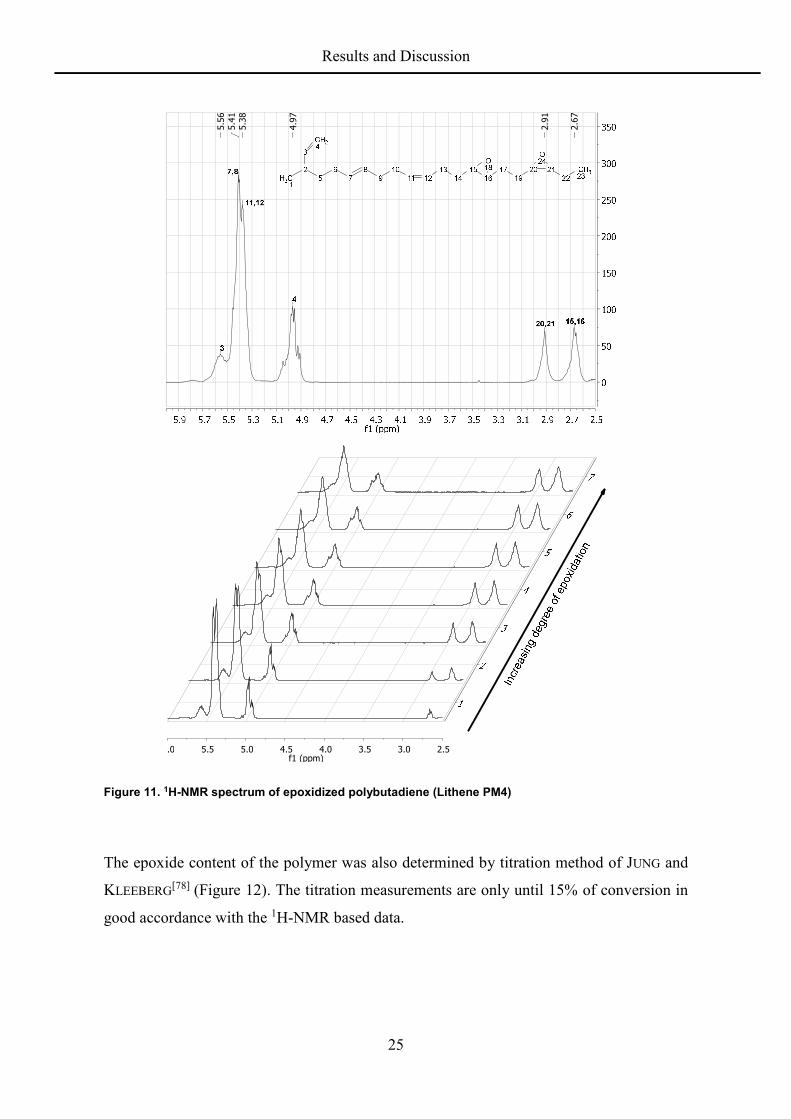
The progress of the epoxidation was analyzed offline from samples taken during the reaction.
Proton NMR spectroscopy is useful to analyze the mixture with respect to conversion of the
double bonds. The 1H-NMR was used as the main method to determine the degree of
functionalization because of its quick and easy operability and its congruence with results
from elemental analyses (vide infra). A typical spectrum with the assignments is shown in
Figure 11. The stacked spectra of the samples show the course of an epoxidation with
samples taken hourly from the reaction mixture.
2 Due to overlapping peaks, the ratios are just approximate values
Results and Discussion
25
Figure 11. 1H-NMR spectrum of epoxidized polybutadiene (Lithene PM4)
The epoxide content of the polymer was also determined by titration method of JUNG and
KLEEBERG[78] (Figure 12). The titration measurements are only until 15% of conversion in
good accordance with the 1H-NMR based data.
2.6
7
2.9
1
4.9
7
5.3
8
5.4
1
5.5
6
2.53.03.54.04.55.05.56.0f1 (ppm)

Results and Discussion
26
Figure 12. Titration of epoxidized polybutadiene (Lithene PM4) samples with different degrees of conversion
MALDI-Tof spectra show the expected mass separation of 54 (butadiene; Figure 13) and 70
(butadiene oxide; Figure 14) between the individual signals. The molecular weight of
Lithene PM4 calculated from the distribution in the MALDI-Tof spectrum is 1458 g/mol,
close to the producers provided value of 1500 g/mol. The spectrum of an epoxidized sample
(43.4% by NMR) has many more signals and the intensity of the individual masses is much
lower as expected from a random epoxidation of the double bonds. The differences of 16 Da
in mass corresponding to the consecutive addition of oxygen atoms between signals are
nevertheless recognizable and the signals can be assigned to chains with different degrees of
epoxidation around 40% to 50%. Signals of higher mass seem of lower intensity, possibly
because of instability of the ionized species.[79]

Results and Discussion
27
Figure 13. MALDI-TOF Analysis of Lithene PM4
Figure 14. MALDI-TOF analysis of an epoxidized polybutadiene sample
The kinetics of the epoxidation of unsaturated rubbers with peracids has been reported upon
for batch reactions.[80–82,3,83] The formation of performic acid is much slower than the
epoxidation of the double bonds, and thus the concentration of formic acid (FA) and hence
performic acid (PFA) will have a quasi steady state. The phase exchange process of
performic acid is presumed fast under the conditions. Reactions at various stirrer frequencies
Results and Discussion
28
above 300 rpm indeed showed no difference in conversion of the double bonds. It is thus not
necessary to consider the rate of phase transfer. The actual concentration of FA in the
aqueous phase however is of high relevance, and the distribution of FA over the organic and
aqueous phase is complex and needs consideration[84–86] The major reactions are (I) the
general, acid catalyzed, formation of PFA from FA and hydrogen peroxide (HP) in the
aqueous phase (and probably partially in the organic phase), (II) the hydrolysis of PFA to
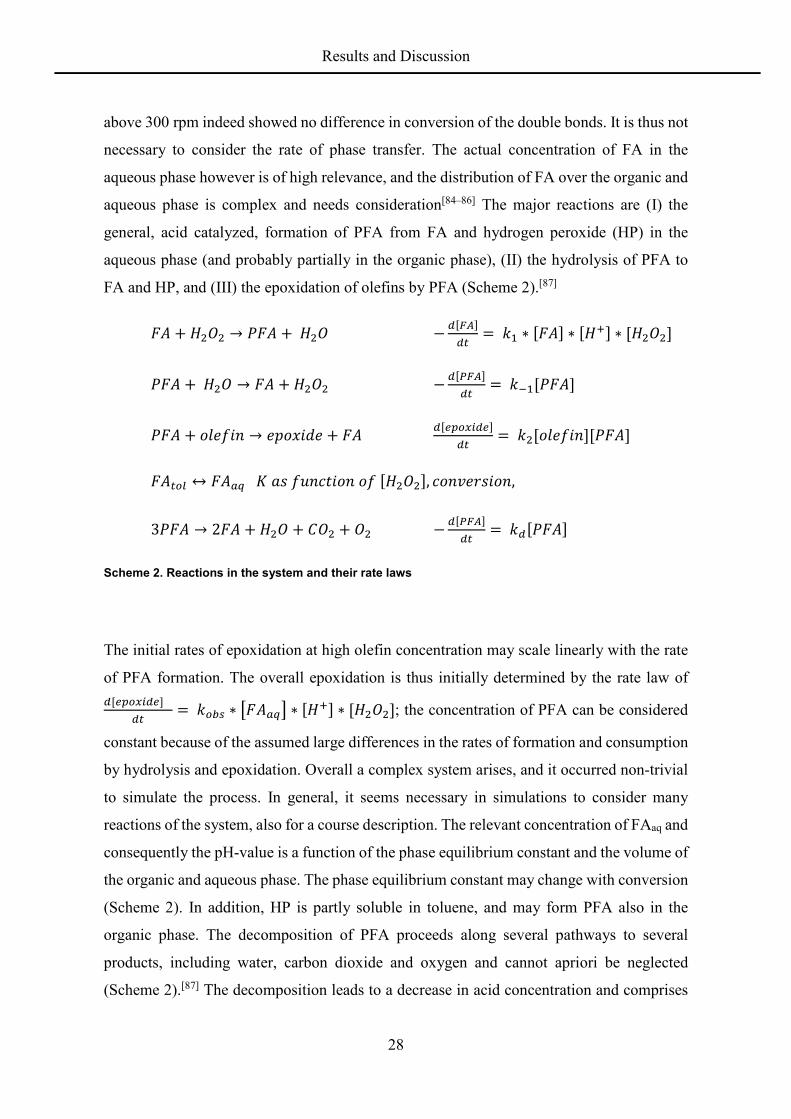
FA and HP, and (III) the epoxidation of olefins by PFA (Scheme 2).[87]
+ → + − = ∗ ∗ ∗
+ → + − =
+ → + =
↔ , ,
3 → 2 + + + − = Scheme 2. Reactions in the system and their rate laws
The initial rates of epoxidation at high olefin concentration may scale linearly with the rate
of PFA formation. The overall epoxidation is thus initially determined by the rate law of
= ∗ ∗ ∗ ; the concentration of PFA can be considered
constant because of the assumed large differences in the rates of formation and consumption
by hydrolysis and epoxidation. Overall a complex system arises, and it occurred non-trivial
to simulate the process. In general, it seems necessary in simulations to consider many
reactions of the system, also for a course description. The relevant concentration of FAaq and
consequently the pH-value is a function of the phase equilibrium constant and the volume of
the organic and aqueous phase. The phase equilibrium constant may change with conversion
(Scheme 2). In addition, HP is partly soluble in toluene, and may form PFA also in the
organic phase. The decomposition of PFA proceeds along several pathways to several
products, including water, carbon dioxide and oxygen and cannot apriori be neglected
(Scheme 2).[87] The decomposition leads to a decrease in acid concentration and comprises

Results and Discussion
29
a loss of oxidizing equivalents. Both effects may be relevant to the rate of reaction and
conversion, and become more apparent at higher reaction temperatures, longer reaction times
and higher conversion, in particular at high acid and hydrogen peroxide concentrations. Also
dependencies of the epoxidation rate on olefin conversion have been observed.[3]
5.1.1 Epoxidation with Hydrogen Peroxide Feed
The semi-batch epoxidation of PBu was investigated with a feed of hydrogen peroxide,
maintaining the initial amount of FA. The concentration of FA is therefore consequently
decreasing with reaction time. This is advantageous for preventing side reactions, in
particular for precluding the addition of FA to the epoxidized double bonds, which is also
an acid catalyzed reaction. Thus, the acid concentration is decreasing by conversion and by
dilution as the concentration of the epoxide entities increases. It would consequently allow
a higher initial amount of FA at the start of the PBu functionalization and thus to have higher
initial rates. The conversion of double bonds during an epoxidation reaction in semi-batch
mode with respect to hydrogen peroxide shows an about linear dependency with time up to
a conversion of 15% of the double bonds under the conditions used by DILCHER[88] (Figure
15; Table 4). Performing the reaction in semi-batch mode thus gives a high predictability up
to that level of epoxidation. FA related ring opening reactions leading to hydroxyl carbonyl
entities could not be detected. The initial rate increases linearly with the HP feeding rate to
a rate of 7.23 mL/h. Higher H2O2 (30% in H2O) feeding rates lead to a less than linear
increase. This indicates that the conversion of HP is slower than the feeding rate or a
saturation in PFA sets in. The initial about linear rate of epoxidation continuously decreases
at conversions above 10-15 mol% (Figure 16), in particular noticeable for higher feeding
rates. Course simulations show that this is majorly explainable by the decrease in [FAaq] and
concomitantly the [H+], as has been observed by different HP concentrations in batch
reactions.[3] The concentration of HP increases steadily as the rate of conversion to epoxides
is lower than the feeding rate.

Results and Discussion
30
Figure 15. Double bond conversion and reaction rates in a semi-batch process (56.6 g Lithene PM4) with various feeds of hydrogen peroxide at 65 °C with 2.03 mL FA in 369 mL toluene (Table 6)[88]
Table 4. Conversion and reaction rates of semi-batch-epoxidations – conditions: 2.03 mL FA, 369 mL toluene at 65 °C[88]
# time [h] final conversion [%] H2O2 feeding rate [ml/h] reaction rate
[mol/L*s]
1 4 14.7 10.19 3.13·10-5
2 5 15.6 7.23 2.64·10-5
3 7 17.1 5.00 1.91·10-5
4 8.5 16.0 2.39 1.35·10-5

Results and Discussion
31
Figure 16. Double bond conversion of a typical epoxidation of 35.6 g Lithene PM4 in a semi-batch process - conditions: 10 mL/h HP at 64 °C, 3 mL FA and 255 mL toluene
The initial rates were consequently determined in dependence of the FA amounts at a feeding
rate of 0.0981 mol/h HP (Figure 17, Table 5). The rate again shows an initial linear course
followed by a continuously decrease in rate. The initial rates scale in a complex manner with
the amount of FA as expected for the system of reactions in Scheme 2.
Figure 17: Double bond conversion for different amounts of formic acid and 14 wt% of Lithene PM4 in
toluene with 10 mL/h HP at 65 °C (Table 6 entry 33-50)

Results and Discussion
32
Table 5. Conversion and reaction rates of epoxidation as a function of the FA concentration.
# FA [mol/L] Conversion (6 h) [%] initial reaction rate [mol/L*s]
1 0.11 13.4 3.25·10-5
2 0.22 29.8 5.35·10-5
3 0.44 46.4 6.46·10-5
Table 6: Semi-batch epoxidations of Lithene PM4 in a 1 L steel and glass and 10 L steel reactor at 65 °C
# PBu [g] toluene
[mL]
FA [mL] feeding rate
H2O2 [mL/h]
time [h] conversion
[%]
15 56.6 369 2.03 2.39 1 1.7
16 56.6 369 2.03 2.39 2.5 4.8
17 56.6 369 2.03 2.39 4 8.0
18 56.6 369 2.03 2.39 5.5 10.6
19 56.6 369 2.03 2.39 7 13.3
20 56.6 369 2.03 2.39 8.5 16.0
21 56.6 369 2.03 5.00 2 5.0
22 56.6 369 2.03 5.00 4 10.2
23 56.6 369 2.03 5.00 6 14.9
24 56.6 369 2.03 5.00 7 17.1
25 56.6 369 2.03 7.23 1 3.1
26 56.6 369 2.03 7.23 2 6.7
27 56.6 369 2.03 7.23 3 10.1
28 56.6 369 2.03 7.23 5 15.6
29 56.6 369 2.03 10.19 1 3.2
30 56.6 369 2.03 10.19 2 7.6
31 56.6 369 2.03 10.19 3 11.5
32 56.6 369 2.03 10.19 4 14.7
33 35.6 255 3.00 10.0 1 7.2
34 35.6 255 3.00 10.0 2 14.7
35 35.6 255 3.00 10.0 3 19.5
36 35.6 255 3.00 10.0 4 24.1
37 35.6 255 3.00 10.0 5 27.1

Results and Discussion
33
# PBu [g] toluene
[mL]
FA [mL] feeding rate
H2O2 [mL/h]
time [h] conversion
[%]
38 35.6 255 3.00 10.0 6 29.8
39 37.1 263 1.55 10.0 1 2.9
40 37.1 263 1.55 10.0 2 6.2
41 37.1 263 1.55 10.0 3 8.6
42 37.1 263 1.55 10.0 4 10.3
43 37.1 263 1.55 10.0 5 11.8
44 37.1 263 1.55 10.0 6 13.4
45 35.5 255 6.00 10.0 1 9.8
46 35.5 255 6.00 10.0 2 19.4
47 35.5 255 6.00 10.0 3 29.8
48 35.5 255 6.00 10.0 4 36.5
49 35.5 255 6.00 10.0 5 41.4
50 35.5 255 6.00 10.0 6 46.4
51 679 4480 48.8 50.0 1.67 3.2
52 679 4480 48.8 50.0 3 6.2
53 679 4480 48.8 50.0 4.5 9.2
54 679 4480 48.8 50.0 6 12.1
55 679 4480 48.8 50.0 7.5 15.0
56 679 4480 48.8 60.0 1.5 3.8
57 679 4480 48.8 60.0 3 8.3
58 679 4480 48.8 60.0 4.5 11.8
59 679 4480 48.8 60.0 6 15.0
60 679 4480 48.8 60.0 7.5 18.1
The temperature dependence of the rate of epoxidation of Lithene PM4 was determined
between 54 and 80 °C at higher temperatures than reported upon in the literature [2,44,50,3,83]
The initial concentration of FA was 0.27 mol/L and the rate of feeding HP was 18 mol%/h
in relation to 1,4-double bonds. The conversion of PBu after 6 h increases with temperatures
up to 75°C (Figure 18). The observed rate constants as function of the temperature are
indicating an overall activation energy for the process of about 29 kJ/mol. The somewhat

Results and Discussion
34
lower activation energy compared to published numbers might be attributed to the lower
molecular weight of the polybutadienes used in this study.[3],[3] Higher temperatures lead to
a lower conversion. Evidence for epoxide opening reactions could not be found in any of the 1H-NMR spectra of the samples. It has been reported that the decomposition rate of PFA has
a stronger temperature dependence than the in-situ formation of the same[89]. Thus the
decrease in the degree of epoxidation could be related to the increasing rate of decomposition
of PFA or H2O2, due to a resulting decrease of PFA and FA concentration in the system
(Scheme 2).[87] The progress of conversion was monitored at four of the eight reactions
(Figure 18) of which the maximum rate constants are listed in Table 7.
Figure 18. Temperature dependency of epoxidation degree with Arrhenius-plot – conditions: 16 wt% Lithene PM4 in toluene and 1.5 wt% FA, 18 mol% HP in relation to 1,4-double bonds per hour (Table 8)
Table 7. Rate constants and conversions of epoxidations at various temperatures
temperature [°C] final conversion [%] rate constant k [L/mol*s]
54 21.2 9.67·10-5
64 29.8 1.38·10-4
75 45.9 1.83·10-4
80 36.7 1.54·10-4

Results and Discussion
35
Table 8. Semi-batch epoxidations of Lithene PM4 in a 1 L glass reactor at different temperatures
# PBu [g] Temper-
ature [°C]
toluene [mL] FA [mL] feeding rate
H2O2 [mL/h]
time [h] conver-
sion [%]
61 35.4 54 256 3 10 1 3.7
62 35.4 54 256 3 10 2 8.8
63 35.4 54 256 3 10 3 12.4
64 35.4 54 256 3 10 4 15.8
65 35.4 54 256 3 10 5 18.3
66 35.4 54 256 3 10 6 21.2
67 35.6 64 255 3 10 1 7.2
68 35.6 64 255 3 10 2 14.7
69 35.6 64 255 3 10 3 19.5
70 35.6 64 255 3 10 4 24.1
71 35.6 64 255 3 10 5 27.1
72 35.6 64 255 3 10 6 29.8
73 64.6 70 475 6 18 6 37.3
74 65.2 73 474 6 18 6 42.0
75 61.6 75 450 5.5 17 1 11.4
76 61.6 75 450 5.5 17 2 21.9
77 61.6 75 450 5.5 17 3 30.1
78 61.6 75 450 5.5 17 4 37.3
79 61.6 75 450 5.5 17 5 42.1
80 61.6 75 450 5.5 17 6 45.9
81 64.8 77 495 6 18 6 40.3
82 65.3 80 477 6 18 1 7.1
83 65.3 80 477 6 18 2 18.5
84 65.3 80 477 6 18 3 25.5
85 65.3 80 477 6 18 4 30.6
86 65.3 80 477 6 18 5 34.0
87 65.3 80 477 6 18 6 36.7
88 64.1 80 484 6 18 6 35.8

Results and Discussion
36
5.1.2 Larger Scale Reactions
The reaction conditions of the semi-batch operation in form of polybutadiene concentration,
formic acid concentration and the relative feeding rate of hydrogen peroxide were transferred
to larger scale. A temperature of 65 °C was chosen for the scale up reactions, somewhat
below the maximum rate at 75 °C where the decomposition of PFA becomes noticeable. It
was found, that reactions in a 10 L reactor are very comparable to those in a 1 L steel reactor
(Figure 19).[88] Again, a linear increase of double bond conversion was found with time and
feeding rate. The observed rate constants are basically the same even though a higher
concentration in FA is needed. The process is thus easily scaled up.
Figure 19. Double bond conversion of 56.6 g and 679 g Lithene PM4 in a 1 L (top) and 10 L (bottom) steel reactor respectively with various dosing rates - conditions: 65 °C and 2.03 mL and 48.8 mL in 369 mL
and 4482 mL toluene respectively[88]

Results and Discussion
37
5.1.3 Higher molecular weight polybutadienes
The process described was also applied to the other polybutadiene samples (Table 3). The
differences in microstructure and molecular mass of the PBus of this study are of minor
importance for the rate of conversion in the range considered here (Figure 20; Table 9). The
higher viscosity of the toluene solution of PBu with a higher molecular mass is not
influencing the reaction rate. The formation of PFA remains the rate determining step of the
reactions in Scheme 2.[87] Likewise, the cis/trans ratio of the 1,4-double bonds is not
substantially changed by the epoxidation. Former studies revealed a rate of epoxidation
descending in the order cis-1,4 > trans-1,4 > vinyl-1,2.[2] Indeed the cis-1,4 entities are
somewhat faster epoxidized than trans-1,4 units (Table 10). None of the polybutadienes in
this work showed an epoxidation of vinyl groups within the degrees of epoxidation reached.
The vinyl double bond content of maximum 19% might be too low to detect epoxidation,
which will be negligibly.
Figure 20. Double bond conversion of different polybutadienes in a 10 L steel reactor - conditions: 75 °C, 18 wt% PBu in toluene and 1.5 wt% FA, 0.3 mol% HP in relation to double bonds per hour (Table 11)
Table 9. Reaction rates of different molecular weight polybutadienes.
molecular mass [g/mol] conversion (7h) [%] initial reaction rate [L/mol*s]
1500 43.4 4.73·10-5
5000 40.9 4.79·10-5
8000 40.6 4.77·10-5
26000 41.1 4.75·10-5

Results and Discussion
38
Table 10. Cis:trans selectivity of 1,4-epoxidation
PBu degree of epoxidation [%] cis:trans ratio
Lithene PM4 22.5 48:52
Lithene PM4 33.8 48:52
Lithene PM4 43.4 47:53
Lithene N4-5000 21.2 51:49
Lithene N4-5000 32.1 50:50
Lithene N4-5000 40.9 49:51
LBR-307 20.9 50:50
LBR-307 32.5 49:51
LBR-307 40.6 48:52
LBR-305 20.6 51:49
LBR-305 32.4 50:50
LBR-305 41.1 49:51
Table 11. Semi-batch epoxidations of different polybutadienes in a 10 L steel reactor at 75 °C
# PBu PBu [g] toluene
[mL]
FA
[mL]
feeding rate
H2O2 [mL/h]
time [h] conversion
[%]
89 PM4 1002 6514 82 200 3 22.5
90 PM4 1002 6514 82 200 5 33.8
91 PM4 1002 6514 82 200 7 43.4
92 N4 1000 6514 82 200 3 21.2
93 N4 1000 6514 82 200 5 32.1
94 N4 1000 6514 82 200 7 40.9
95 LBR-307 700 4561 58.2 140 3 20.9
96 LBR-307 700 4561 58.2 140 5 32.5
97 LBR-307 700 4561 58.2 140 7 40.6
98 LBR-305 700 4562 57.4 140 3 20.6
99 LBR-305 700 4562 57.4 140 5 32.4
100 LBR-305 700 4562 57.4 140 7 41.1

Results and Discussion
39
5.1.4 Material Properties
The introduction of epoxide groups increases the rigidity and polarity of the polymer, and
therefore is increasing the glass transition temperature (Figure 21).[3] The glass transition
temperatures of the various PBus are about the same, and this holds also for the epoxidized
derivatives as along as the degree of epoxidation is comparable (Table 12).[3,90] The minor
differences are related to differences in the microstructure, i.e. the content of 1,2-vinyl
entities (Table 3). The increase of the glass transition temperature (Tg) follows a general Fox
equation (eq. 1, Figure 21). An increase in Tg of 0.83-0.93 K per mol% of epoxide groups is
found, in accordance with prior results[3].
,100% ,0%
1 epoxides polybutadiene
g g g
w w
T T T (1)
wepoxides and wpolybutadiene define the ratio of weight of epoxidized and non-epoxidized
butadiene building blocks, Tg,100% and Tg,0% represent the Tg of PBu with all double bonds
oxidized and non-epoxidized PBu respectively.
Table 12. Glass transition temperatures of investigated polybutadienes
PBu molecular mass (Mn) [g/mol] glass transition (Tg) [K]
Lithene PM4 1500 181.9
Lithene N4-5000 5000 181.3
LBR-307 8000 180.6
LBR-305 26000 178.7

Results and Discussion
40
Figure 21. Increase in Tg with degree of epoxidation following the fox-equation
Table 13. Increase of Tg per percentage point of epoxidation
molecular weight (Mn) [g/mol] increase in Tg per mol% of double
bond epoxidation [K]
1500 0.83
5000 0.88
8000 0.91
26000 0.93
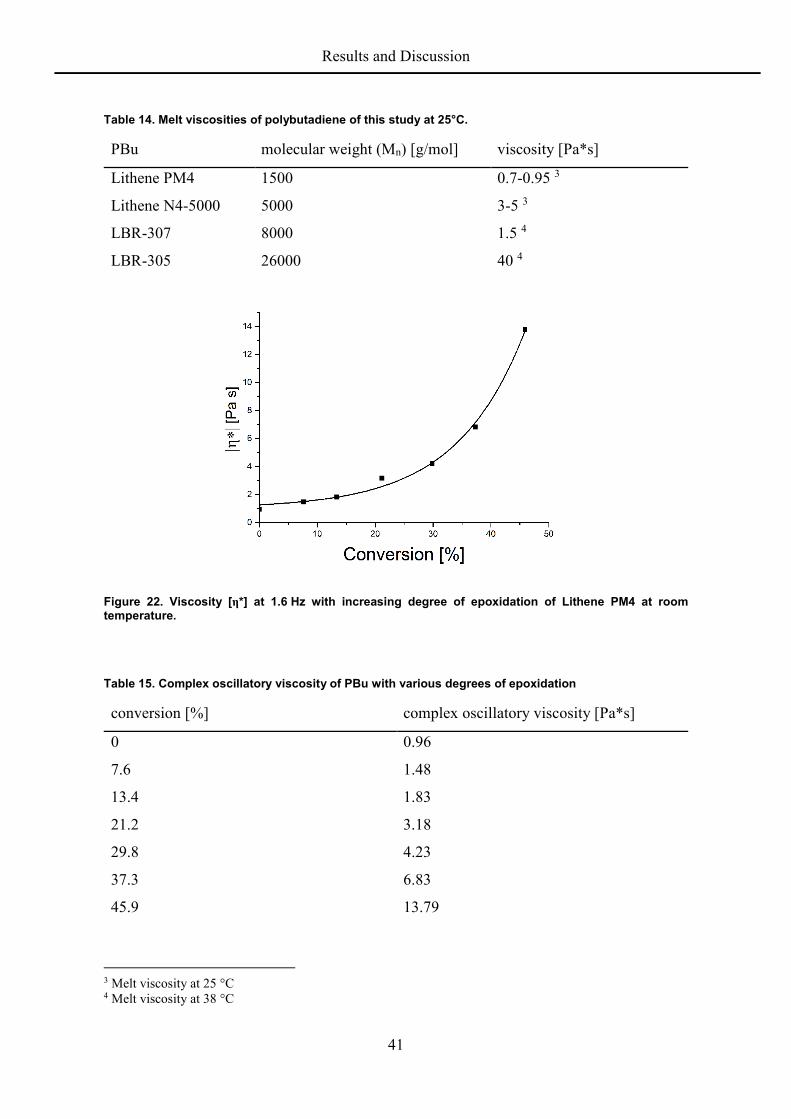
The bulk viscosity of the polybutadienes increases about one order of magnitude by
epoxidizing to about 50 mol% (Figure 22; Table 15).[16] This is again related to change in
chain stiffness and the concomitant increase in glass temperature.[91]
Results and Discussion
41
Table 14. Melt viscosities of polybutadiene of this study at 25°C.
PBu molecular weight (Mn) [g/mol] viscosity [Pa*s]
Lithene PM4 1500 0.7-0.95 3
Lithene N4-5000 5000 3-5 3
LBR-307 8000 1.5 4
LBR-305 26000 40 4
Figure 22. Viscosity [η*] at 1.6 Hz with increasing degree of epoxidation of Lithene PM4 at room temperature.
Table 15. Complex oscillatory viscosity of PBu with various degrees of epoxidation
conversion [%] complex oscillatory viscosity [Pa*s]
0 0.96
7.6 1.48
13.4 1.83
21.2 3.18
29.8 4.23
37.3 6.83
45.9 13.79
3 Melt viscosity at 25 °C 4 Melt viscosity at 38 °C

Results and Discussion
42
5.1.5 Summary
The epoxidation of low molecular weight polybutadienes using a semi-batch process was
reported in this work. The temperature of 75 °C is particular useful for the reaction.
Formation of performic acid is rate determining at this temperature, and the decomposition
rate is low and the ring opening reaction of the product is negligible. The process was
successfully scaled up to a reaction volume of 10 L obtaining 1 kg of product material. The
reaction of various molecular weights between 1500 and 26000 g/mol showed a universal
applicability of the process in this range. The increase in glass transition temperature follows
the Fox equation and the viscosity increases roughly by one order of magnitude to about
50% of epoxidation.

Results and Discussion
43
5.2 Rheological Properties of Epoxidized Liquid Rubber in Bulk and Solution
It is essential for material processing to know about the material properties. The knowledge
of the viscosity of a material can be vital for processing steps such as mixing or pumping.
Therefore the prediction of the viscosity in synthetic steps is of high interest due to the layout
of equipment. In this work a model for the prediction of the complex oscillatory viscosity
(η*) of low molecular weight polybutadienes is developed. This model allows the prediction
of complex oscillatory viscosity as a function of molecular weight, epoxidation ratio,
concentration in toluene and temperature.
Experimental data[92,93] support the approach to factorize the viscosity into a temperature-
and concentration-dependent friction factor ζ(T,Φ) and a molecular weight- and
concentration-dependent structural (topology) factor g(M,Φ). The viscosity can therefore be
expressed as:
= , ∙ , (2)
The viscosity was determined using rheology with oscillatory shear. A typical measurement
is depicted in Figure 23a. The measurement shows Maxwell type behavior as expected for a
viscoelastic fluid. The viscosity is independent of the applied frequency (Figure 23),
showing that the PBus can be considered newtonian liquids.
The frequency region relevant for extrusion, mixing or pipe flow is 4 -110 10 [rad s ] [77].
The viscosity of the investigated polybutadienes in this region is 1 430 Pa s (Figure 23b).

Results and Discussion
44
Figure 23. a) Oscillatory shear experiment of LBR-300 (MW = 44000) at 45 °C, b) Complex viscosities of polybutadienes with different molecular masses
5.2.1 Molecular Weight Dependance
The viscosity in the region depicted in Figure 23 is independent of frequency and therefore
equates the zero-shear-viscosity (η0) which is proportional to the weight average molecular
mass (Figure 24) in the usual power law of
∝ (3)
below and
∝ . (4)
above the entanglement molecular mass.

Results and Discussion
45
Figure 24. Zero-shear-viscosity in relation to molecular weight in bulk at room temperature
The expected slope of viscosity versus molecular mass is 1.0 below the entanglement
molecular mass and 3.4 above it. RENDELL and NGAI found the critical molecular mass at
6400 g/mol for their system[94] and indeed the slope in Figure 24 is slightly higher than 1.0
even for the part of lower molecular weight. However, since the molecular masses
investigated are still very low and the influence of entanglements is expected to be low in
this case, an average slope of 1.5 was chosen for the following discussion. This would
adequately describe the transition region.
5.2.2 Concentration Dependance
The polybutadiene samples were measured in bulk as well as volume fractions of 0.75 and
0.5 in toluene which is a common solvent for polybutadiene synthesis.[5] The slope of the
viscosity vs. molecular weight plot is independent of the volume fraction in toluene but is
shifted towards lower viscosities at lower concentrations as expected for these molecular
masses. At higher molecular masses the slope would also be expected to be concentration
dependent[95]. The viscosity shift covers roughly one magnitude per 0.25 of toluene volume
fraction (Figure 25a).

Results and Discussion
46
Figure 25. a) Viscosity developement with molecular weight at different volume fractions in toluene b) Mastercurve of the shifted viscosities
If a shift factor of φ3.4 is considered, these three slopes can be transformed on to a master
curve (Figure 25b). The proportionality of the zero shear viscosity could ergo be described
as follows:
∝ . ∙ . (5)
Knowing the concentration (volume fraction, Φ) and molecular weight of a polybutadiene
sample, it is possible to predict the viscosity of the solution of unfunctionalized
polybutadiene in this molecular weight region with this master curve.
5.2.3 Functionality dependence
The epoxidation ratio needs also be considered if the polybutadienes are functionalized. The
epoxidation ratio is influencing the viscosity of the polybutadienes due to changes in chain
stiffness and polarity (s. 5.1.4). The degrees of freedom are reduced with an epoxide group
compared to the double bond. Additionally, the more polar epoxide groups are increasing
the chain-chain interaction parameter.[96] The viscosity is therefore gradually increasing
during epoxidation reactions. To take these changes into account a shift factor for the
changes in viscosity due to the epoxidation ratio (f) was introduced:
∝ + . ∙ . (6)

Results and Discussion
47
Figure 26. a) Viscosity developement with molecular weight at different epoxidation ratios b) Mastercurve of the shifted viscosities
The slope again is the same for all functionalization ratios but the curves are shifted with
(1+f)3.4.
5.2.4 Interim Conclusion
The dependence of the viscosity on molecular weight, concentration and epoxide ratio can
be merged into one equation:
∝ + . ∙ . ∙ . (7)

Results and Discussion
48
Figure 27. Mastercurve considering degree of epoxidation, concentration and molecular weight
The influence on viscosity by the epoxidation ratio is based on the changes in structure whilst
the influence by the concentration in toluene is based on the solution states of polymer
solutions.
The viscosity can therefore be shifted onto a master curve taking the epoxidation ratio and
concentration into account. Furthermore, the viscosity during epoxidation is now predictable
with the knowledge of concentration and expected epoxidation ratio.
Additionally, the temperature dependence is needed for the prediction of viscosities at
reaction temperatures other than room temperature.
5.2.5 Temperature Dependence
The glass transition temperatures for the polybutadiene samples in this work are below 0 °C
and therefore low enough for the ARRHENIUS law to be applicable.
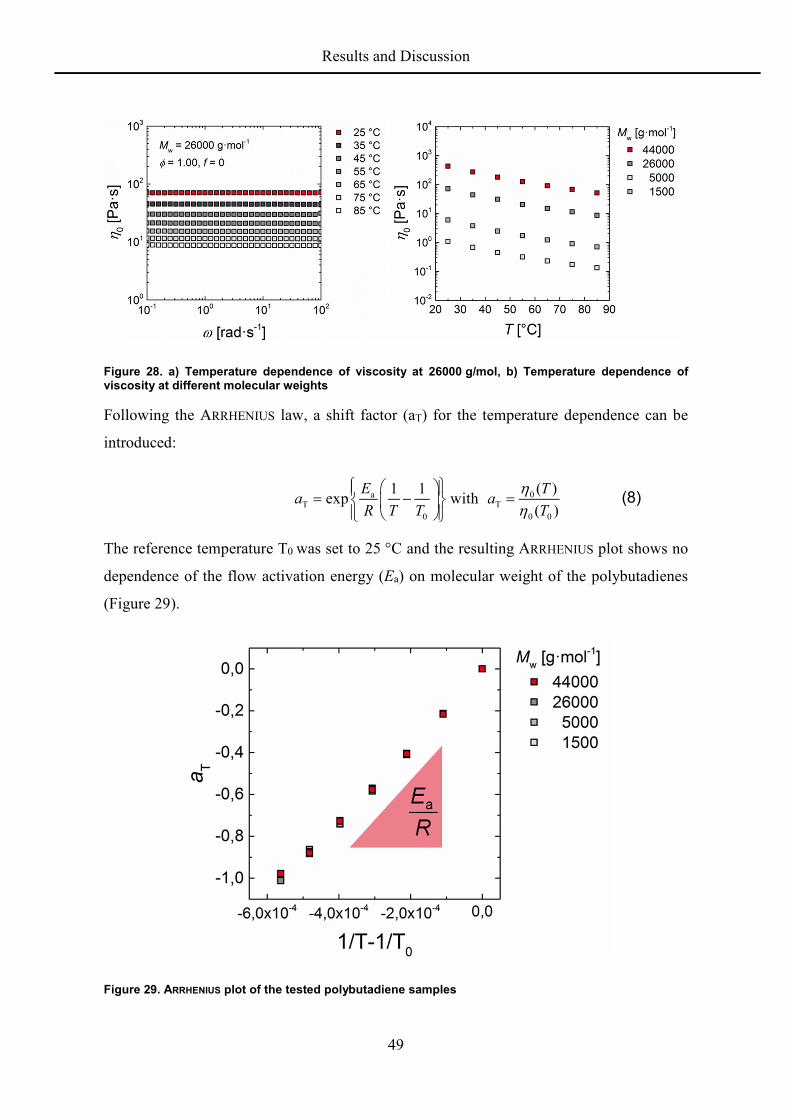
The temperature dependence of the zero shear viscosity shows a similar progress for all
samples (Figure 28).
Results and Discussion
49
Figure 28. a) Temperature dependence of viscosity at 26000 g/mol, b) Temperature dependence of viscosity at different molecular weights
Following the ARRHENIUS law, a shift factor (aT) for the temperature dependence can be
introduced:
a 0T T
0 0 0
( )1 1exp with
( )
E Ta a
R T T T
(8)
The reference temperature T0 was set to 25 °C and the resulting ARRHENIUS plot shows no
dependence of the flow activation energy (Ea) on molecular weight of the polybutadienes
(Figure 29).
Figure 29. ARRHENIUS plot of the tested polybutadiene samples

Results and Discussion
50
However, the epoxidation ratio has an influence on the flow activation energy (Figure 30).
Figure 30. Functionalization dependence of the flow activation energy
These dependencies were expected since the flow activation energy is a function of chain
rigidity and degree of freedom and the epoxide groups increase the chain stiffness. The flow
activation energy also is concentration dependent, which leads to the following relation:
= . − − ∙ . + . ∙ (9)
Uniting all influencing parameters into one equation, it is now possible to predict the
viscosity of a polybutadiene system with the knowledge of epoxidation ratio, concentration,
molecular weight and temperature of the system:
∝ . ∙ . ∙ . (10)
The flow activation energy (Ea) is a function of the concentration (Φ) as well as the
epoxidation ratio (f).
5.2.6 Conclusion
The present model can be used to predict the viscosity evolution during epoxidation reactions
of low molecular weight polybutadienes. This equation enables the operator to design the
optimal reactor system for the processing of the reaction mixture during epoxidation of
10 30 500 20 400
10
20
30
40
50
60
Ea
[kJ*m
ol-1
]
f [%]
0.5 0.6 0.7 0.8 0.9 1.00
10
20
30
40
50
60
Ea
[kJ/m
ol]
Results and Discussion
51
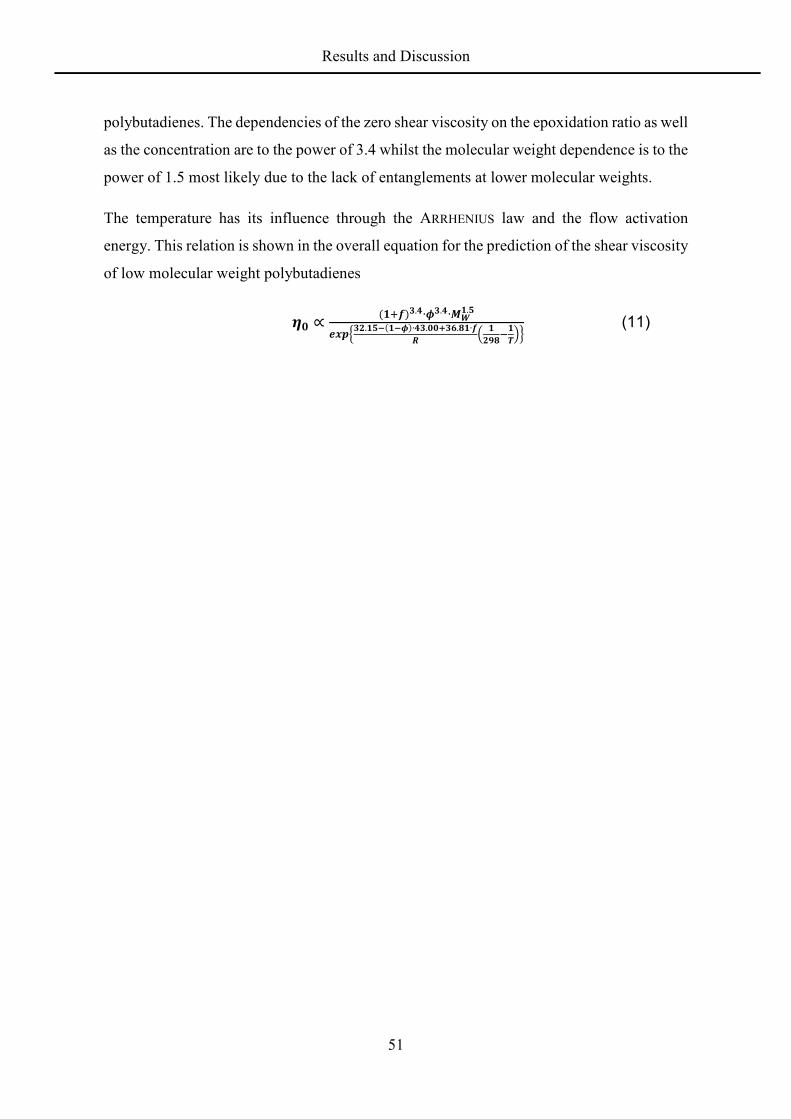
polybutadienes. The dependencies of the zero shear viscosity on the epoxidation ratio as well
as the concentration are to the power of 3.4 whilst the molecular weight dependence is to the
power of 1.5 most likely due to the lack of entanglements at lower molecular weights.
The temperature has its influence through the ARRHENIUS law and the flow activation
energy. This relation is shown in the overall equation for the prediction of the shear viscosity
of low molecular weight polybutadienes
∝ . ∙ . ∙ .. ∙ . . ∙ (11)

Results and Discussion
52
5.3 Aminolysis of Epoxidized Polybutadienes Catalyzed by Lithium Bromide
The synthesized epoxidated polybutadienes were opened by nucleophilic addition of amines.
Butyl amine was chosen for the addition because of its ability to dissolve polybutadiene,
good NMR signature and relatively high nucleophilicity. Lithium bromide was chosen as
Lewis acid catalyst because it is inexpensive, nontoxic, oxophilic and has good availability.
The reactivity of different epoxide isomers in this system was first evaluated with a model
system.
5.3.1 Reaction Mechanism
Lithium bromide is an inexpensive, easy to handle, non-toxic Lewis acid. The additionally
high affinity of lithium to oxygen makes lithium bromide an excellent choice catalyst for the
aminolysis of epoxides.[56]
Scheme 3. Lithium bromide catalyzed aminolysis
Lithium bromide coordinates with the oxygen atom of the epoxide group forming a donor-
acceptor complex. This complex is more susceptible to nucleophilic attack because of the
carbon oxygen bond weakening. The rate determining step most likely is the attachment of
the amine.[97]
5.3.2 Analysis of a Model System
The aminolysis was initially carried out using a set of simple epoxides to better understand
the relative reactivities of asymmetric and symmetric cis and trans epoxides. The reaction
was carried out using 1.0 mL (11.2 mmol) of butylene oxide mixture, 1.0 eq. of n-
butylamine in relation to epoxide groups and 10 mol% of lithium bromide in relation to
epoxide groups as catalyst.
The mix of epoxides consisted of 1,2-butylene oxide, cis-2,3-butylene oxide and trans-2,3-
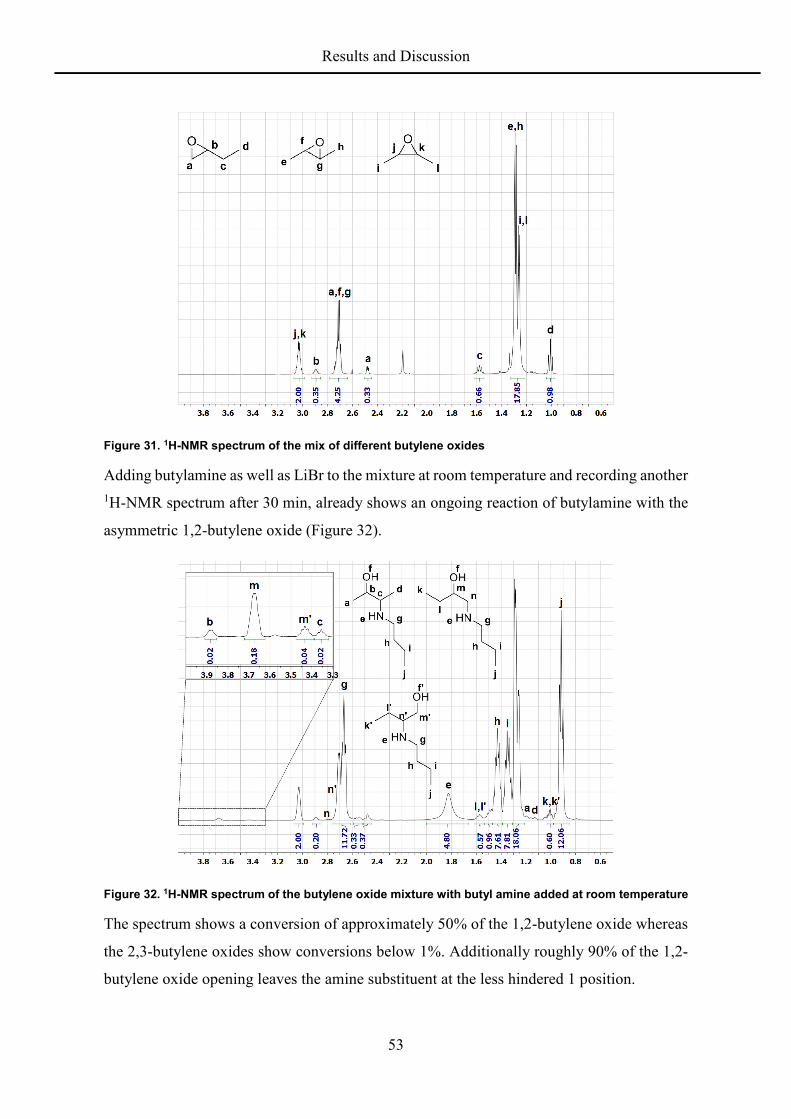
butylene oxide with a ratio of 1:3:6. The 1H-NMR spectrum shows the good distinguishable
signals of the different epoxides (Figure 31).
Results and Discussion
53
Figure 31. 1H-NMR spectrum of the mix of different butylene oxides
Adding butylamine as well as LiBr to the mixture at room temperature and recording another 1H-NMR spectrum after 30 min, already shows an ongoing reaction of butylamine with the
asymmetric 1,2-butylene oxide (Figure 32).
Figure 32. 1H-NMR spectrum of the butylene oxide mixture with butyl amine added at room temperature
The spectrum shows a conversion of approximately 50% of the 1,2-butylene oxide whereas
the 2,3-butylene oxides show conversions below 1%. Additionally roughly 90% of the 1,2-
butylene oxide opening leaves the amine substituent at the less hindered 1 position.
Results and Discussion
54
After 150 h at room temperature another spectrum shows a complete conversion of the 1,2-
butylene oxide as well as roughly 70% and 35% conversion of the cis- and trans-butylene
oxide respectively. Taking the different concentrations into account, the reaction rates can
be sorted to the following order: 1,2-butylene oxide >> cis-2,3-butylene oxide > trans-2,3-
butylene oxide.
The results can only partly be transferred to the epoxidized polybutadiene, since the
differences in structure of the polymer chain also influence the reactivity of the different
isomers.[98]
The reactivity of epoxide groups on the polybutadiene backbone was therefore low for the
reaction conditions of the model system to be applied here. The butyl amine was used in
high excess (usually around 5-10 eq in relation to double bonds). Additionally, temperatures
of 90-150 °C were applied. A glass autoclave was used for these reactions.
5.3.3 Progression of Aminolysis with Butyl Amine
Several reactions with different reaction times were conducted to follow the course of the
reaction, given by the difficulties of sample taking in the high pressure process. The
aminolysis was conducted at 90 and 150 °C with different concentrations of catalyst and
with various polybutadienes epoxidized to a different extent.

Results and Discussion
55
Figure 33. Yield-time curves of Lithene PM4 (with 30% epoxide functionalization) amination with butyl
amine at 150 °C
Figure 34. Yield-time curves of Lithene PM4 (with 42% epoxide functionalization) amination with butyl amine at 90 °C

Results and Discussion
56
Table 16. Conversion of epoxide groups measured by different methods (30% epoxidized BR, 150 °C)
c(LiBr) [mol%] reaction time [h] conversion
1H-NMR Elemental analysis 13C-NMR IG
- 6 7.1% 7%
- 24 26.0% 23%
- 48 46.6% 40% 47.8%
- 72 64.0% 54%
- 96 70.7% 63%
- 120 74.0% 67%
30 1.5 53.7%
30 3 61.1%
30 6 70.1% 65%
30 24 78.5% 75%
30 48 78.8% 73%
30 72 78.5% 75%
Table 17. Conversion of epoxide groups (42% epoxidized BR, 90 °C)
catalyst [mol%] reaction time [h] conversion (1H-NMR)
- 6 2.7%
- 24 5.6%
- 72 12.1%
4 6 9.2%
4 24 23.6%
4 120 58.4%
30 6 23.5%
30 24 56.9%
30 72 68.5%
30 96 69.6%
Results and Discussion
57
The results of 1H-NMR spectroscopy and elemental analysis are in good accordance. The
lower conversions calculated by elemental analysis are most likely because of the
hygroscopic nature of the aminated rubbers. A small water content increases the oxygen
content and therefore falsifies the calculated conversion.
The kinetics of aminolysis has been thoroughly discussed in the literature.[99,100] The system
is expected to undergo an SN2 like mechanism. However, a reaction order of two is only
observed under conditions with very low concentrations of hydroxyl-containing entities.
Usually the observed reaction order is between one and two with respect to the amine
resulting of two competing mechanisms:[99]
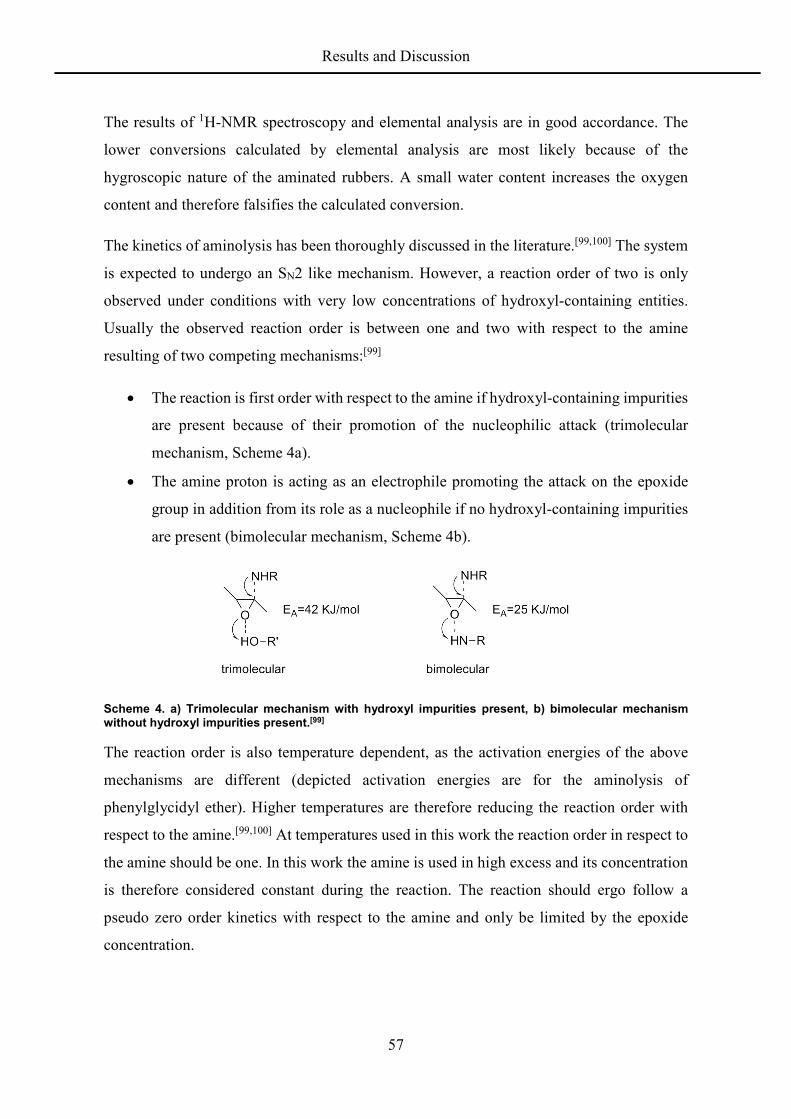
The reaction is first order with respect to the amine if hydroxyl-containing impurities
are present because of their promotion of the nucleophilic attack (trimolecular
mechanism, Scheme 4a).
The amine proton is acting as an electrophile promoting the attack on the epoxide
group in addition from its role as a nucleophile if no hydroxyl-containing impurities
are present (bimolecular mechanism, Scheme 4b).
Scheme 4. a) Trimolecular mechanism with hydroxyl impurities present, b) bimolecular mechanism without hydroxyl impurities present.[99]
The reaction order is also temperature dependent, as the activation energies of the above
mechanisms are different (depicted activation energies are for the aminolysis of
phenylglycidyl ether). Higher temperatures are therefore reducing the reaction order with
respect to the amine.[99,100] At temperatures used in this work the reaction order in respect to
the amine should be one. In this work the amine is used in high excess and its concentration
is therefore considered constant during the reaction. The reaction should ergo follow a
pseudo zero order kinetics with respect to the amine and only be limited by the epoxide
concentration.
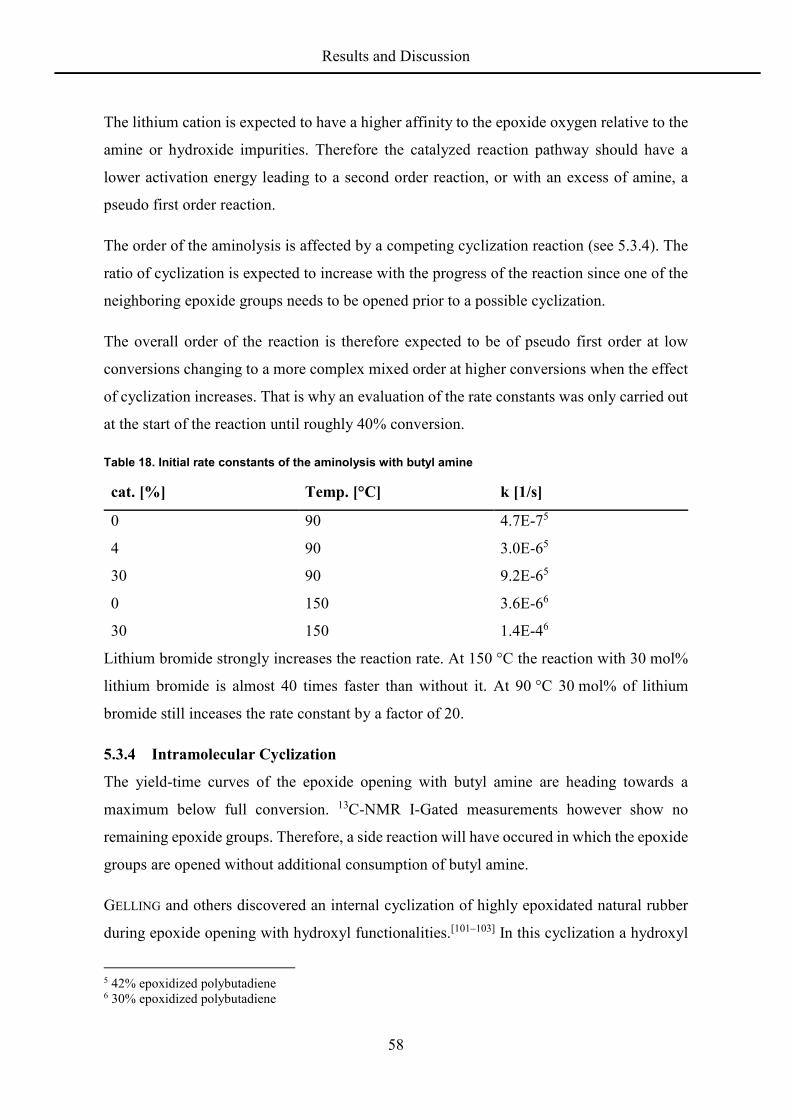
Results and Discussion
58
The lithium cation is expected to have a higher affinity to the epoxide oxygen relative to the
amine or hydroxide impurities. Therefore the catalyzed reaction pathway should have a
lower activation energy leading to a second order reaction, or with an excess of amine, a
pseudo first order reaction.
The order of the aminolysis is affected by a competing cyclization reaction (see 5.3.4). The
ratio of cyclization is expected to increase with the progress of the reaction since one of the
neighboring epoxide groups needs to be opened prior to a possible cyclization.
The overall order of the reaction is therefore expected to be of pseudo first order at low
conversions changing to a more complex mixed order at higher conversions when the effect
of cyclization increases. That is why an evaluation of the rate constants was only carried out
at the start of the reaction until roughly 40% conversion.
Table 18. Initial rate constants of the aminolysis with butyl amine
cat. [%] Temp. [°C] k [1/s]
0 90 4.7E-75
4 90 3.0E-65
30 90 9.2E-65
0 150 3.6E-66
30 150 1.4E-46
Lithium bromide strongly increases the reaction rate. At 150 °C the reaction with 30 mol%
lithium bromide is almost 40 times faster than without it. At 90 °C 30 mol% of lithium
bromide still inceases the rate constant by a factor of 20.
5.3.4 Intramolecular Cyclization
The yield-time curves of the epoxide opening with butyl amine are heading towards a
maximum below full conversion. 13C-NMR I-Gated measurements however show no
remaining epoxide groups. Therefore, a side reaction will have occured in which the epoxide
groups are opened without additional consumption of butyl amine.
GELLING and others discovered an internal cyclization of highly epoxidated natural rubber
during epoxide opening with hydroxyl functionalities.[101–103] In this cyclization a hydroxyl
5 42% epoxidized polybutadiene 6 30% epoxidized polybutadiene

Results and Discussion
59
functionality, deriving from epoxide opening, attacks a neighboring epoxide entity forming
a five-membered cyclic ether.
Transferring this reactivity to the present system, two cyclization reactions seem plausible
(Scheme 5).
Scheme 5. Internal rearrangement of epoxide groups
Which cyclization reaction is occurring depends on the position the amine has added to in
the previous epoxide opening and therefore which nucleophilic group is adjacent to the
neighboring epoxide. Since no real differences between the epoxides carbon atoms exist, a
statistical distribution seems likely. Looking into the 13C-NMR I-Gated spectra the signals
between 69 and 72 ppm are attributed to the oxygen neighboring carbon atoms of the THF
ring[104,105] whereas the nitrogen neighboring carbons would be expected somewhat further
upfield where at 62 ppm a corresponding peak is observed (Figure 35). The 1H-NMR
spectrum doesn’t give much information on account of overlapping signals, but resonances
could be found at the expected positions (Figure 36). The expected statistical cyclization is
backed up from the observation of the integrals of the 13C-NMR reverse I-Gated spectrum.
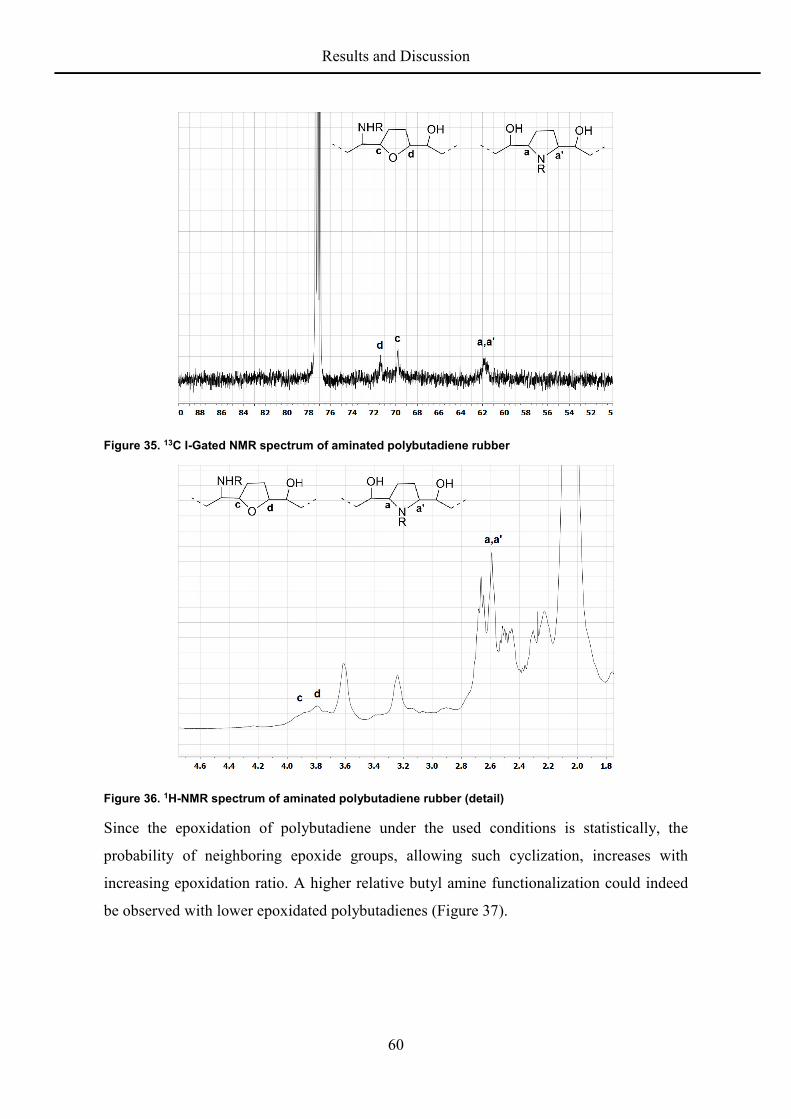
Results and Discussion
60
Figure 35. 13C I-Gated NMR spectrum of aminated polybutadiene rubber
Figure 36. 1H-NMR spectrum of aminated polybutadiene rubber (detail)
Since the epoxidation of polybutadiene under the used conditions is statistically, the
probability of neighboring epoxide groups, allowing such cyclization, increases with
increasing epoxidation ratio. A higher relative butyl amine functionalization could indeed
be observed with lower epoxidated polybutadienes (Figure 37).

Results and Discussion
61
Figure 37. Degree of aminolysis by amine content with Lithene PM4 with different degrees of epoxidation
In conclusion the remaining epoxide groups not getting opened by the primary butyl amine
are most likely undergo an internal cyclization where either the secondary amine or the
hydroxyl entity attached to the polymer chain is attacking a neighboring epoxide group.
The linear fit of Figure 37 crosses the Y-axis at 100% as expected since without epoxide
groups no neighboring epoxides for cyclization exist. At 100% epoxidation there should be
a 100% chance of two epoxide groups to have a neighboring epoxide group, which would
lead to 100% heterocycles. This would only be true for 100% 1,4-polybutadiene without any
branching or 1,2-vinyl groups. The theoretical heterocyclic content of 75% at 100%
epoxidation therefore seems a reasonable number.
The ratio of cyclization is not temperature dependent at temperatures above 90 °C. The
aminolysis with a 42% epoxidized sample at 90 °C and 150 °C gave the same maximum
amine introduction of 70%. This fact leads to the conclusion that the activation energy of the
cyclization reaction is lower than the activation energy of the aminolysis with butylamine.
A reason for the lower activation energy could lie in the favorable five membered transition
state of the intramolecular cyclization.
The concentration of lithium bromide also doesn’t influence the maximum amine
introduction. Reactions with the same epoxidized polybutadiene but different LiBr
concentrations gave the same maximum conversion but different reaction rates. This also
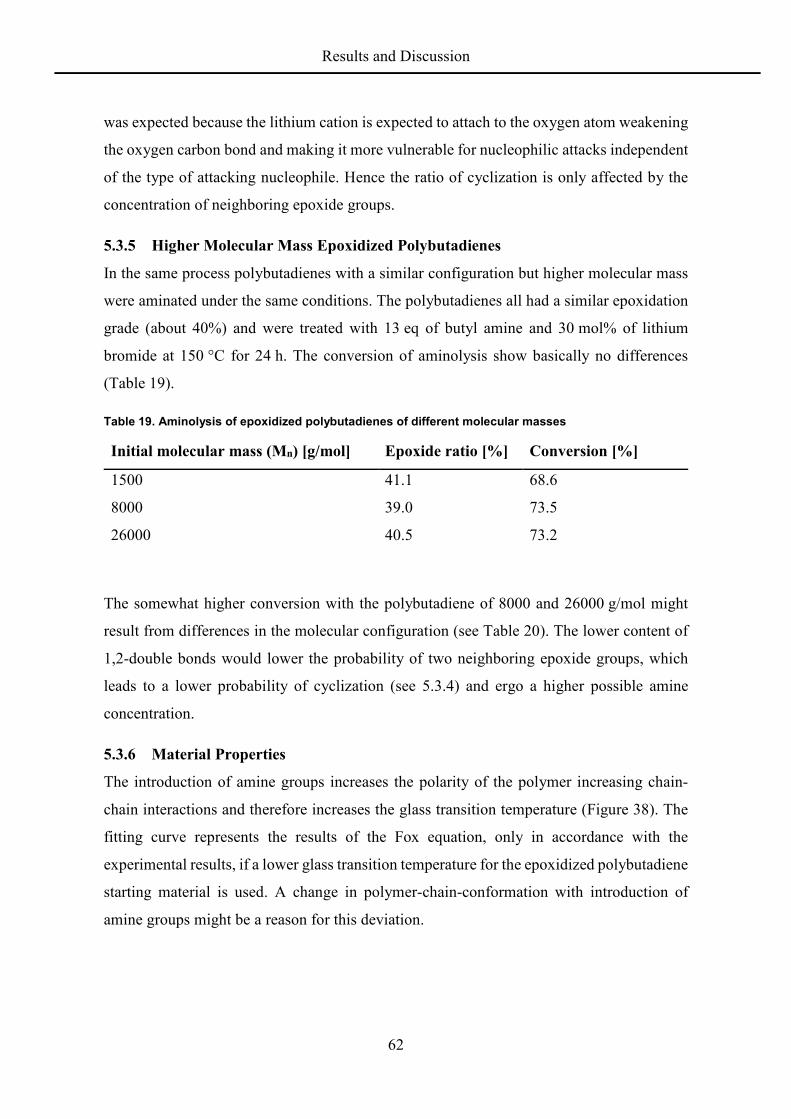
Results and Discussion
62
was expected because the lithium cation is expected to attach to the oxygen atom weakening
the oxygen carbon bond and making it more vulnerable for nucleophilic attacks independent
of the type of attacking nucleophile. Hence the ratio of cyclization is only affected by the
concentration of neighboring epoxide groups.
5.3.5 Higher Molecular Mass Epoxidized Polybutadienes
In the same process polybutadienes with a similar configuration but higher molecular mass
were aminated under the same conditions. The polybutadienes all had a similar epoxidation
grade (about 40%) and were treated with 13 eq of butyl amine and 30 mol% of lithium
bromide at 150 °C for 24 h. The conversion of aminolysis show basically no differences
(Table 19).
Table 19. Aminolysis of epoxidized polybutadienes of different molecular masses
Initial molecular mass (Mn) [g/mol] Epoxide ratio [%] Conversion [%]
1500 41.1 68.6
8000 39.0 73.5
26000 40.5 73.2
The somewhat higher conversion with the polybutadiene of 8000 and 26000 g/mol might
result from differences in the molecular configuration (see Table 20). The lower content of
1,2-double bonds would lower the probability of two neighboring epoxide groups, which
leads to a lower probability of cyclization (see 5.3.4) and ergo a higher possible amine
concentration.
5.3.6 Material Properties
The introduction of amine groups increases the polarity of the polymer increasing chain-
chain interactions and therefore increases the glass transition temperature (Figure 38). The
fitting curve represents the results of the Fox equation, only in accordance with the
experimental results, if a lower glass transition temperature for the epoxidized polybutadiene
starting material is used. A change in polymer-chain-conformation with introduction of
amine groups might be a reason for this deviation.

Results and Discussion
63
Figure 38. Glass transition temperatures of Lithene PM4 with different degrees of aminolysis
The molecular masses by GPC seem to decrease with increasing amine content (Figure 39).
The GPC elugrams were recorded against a polystyrene standard in THF. With ongoing
reaction the aminated rubber becomes more and more dissimilar to polystyrene and probably
shows different coil expansion behavior. The seeming decrease in molecular mass (Mn) to
almost 200 g/mol would equal 1-4 repeating units in a chain. This drastic decrease in chain
length wouldn’t go unnoticed in 1H-NMR or DSC measurements which look very similar
independent of the degree of aminolysis.
Figure 39. Molecular masses (Mn) by GPC (■) and theoretical progression of the molecular mass (─)
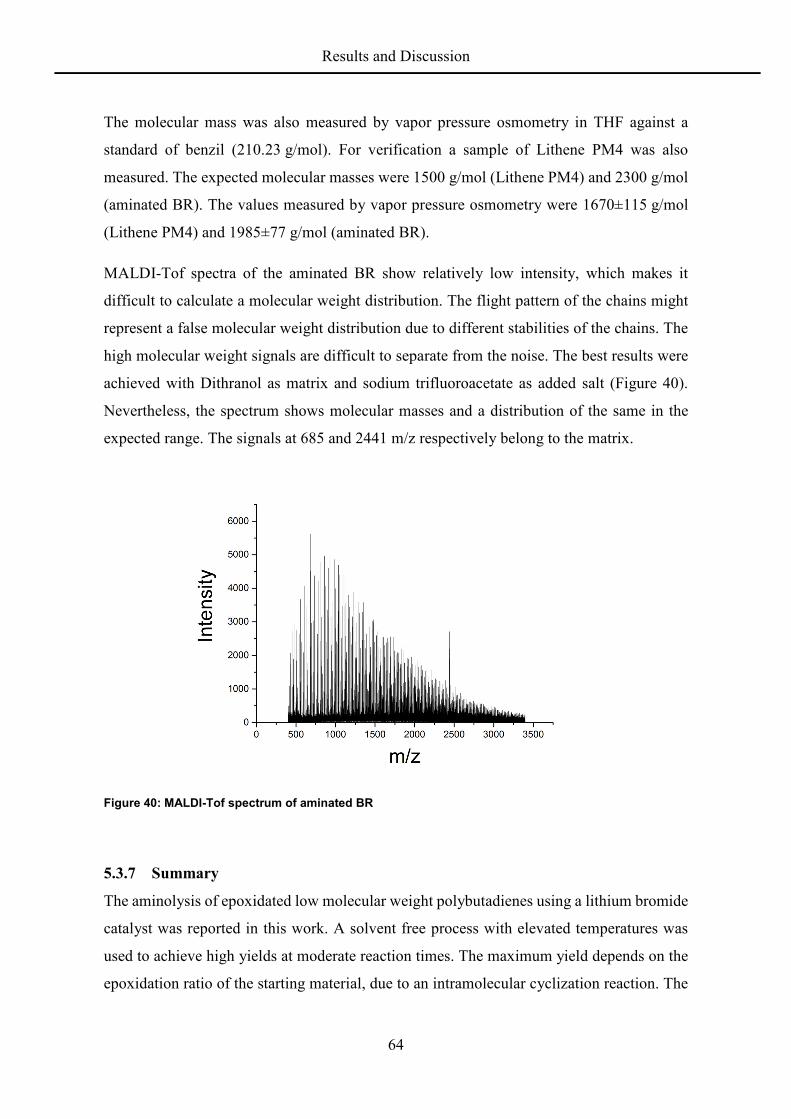
Results and Discussion
64
The molecular mass was also measured by vapor pressure osmometry in THF against a
standard of benzil (210.23 g/mol). For verification a sample of Lithene PM4 was also
measured. The expected molecular masses were 1500 g/mol (Lithene PM4) and 2300 g/mol
(aminated BR). The values measured by vapor pressure osmometry were 1670±115 g/mol
(Lithene PM4) and 1985±77 g/mol (aminated BR).
MALDI-Tof spectra of the aminated BR show relatively low intensity, which makes it
difficult to calculate a molecular weight distribution. The flight pattern of the chains might
represent a false molecular weight distribution due to different stabilities of the chains. The
high molecular weight signals are difficult to separate from the noise. The best results were
achieved with Dithranol as matrix and sodium trifluoroacetate as added salt (Figure 40).
Nevertheless, the spectrum shows molecular masses and a distribution of the same in the
expected range. The signals at 685 and 2441 m/z respectively belong to the matrix.
Figure 40: MALDI-Tof spectrum of aminated BR
5.3.7 Summary
The aminolysis of epoxidated low molecular weight polybutadienes using a lithium bromide
catalyst was reported in this work. A solvent free process with elevated temperatures was
used to achieve high yields at moderate reaction times. The maximum yield depends on the
epoxidation ratio of the starting material, due to an intramolecular cyclization reaction. The

Results and Discussion
65
process was successfully applied to molecular masses of epoxidized polybutadiene of up to
26000 g/mol. The change in polarity and rigidity of the chains reduces the hydrodynamic
volume as well as increases the glass transition temperature of the aminated products.
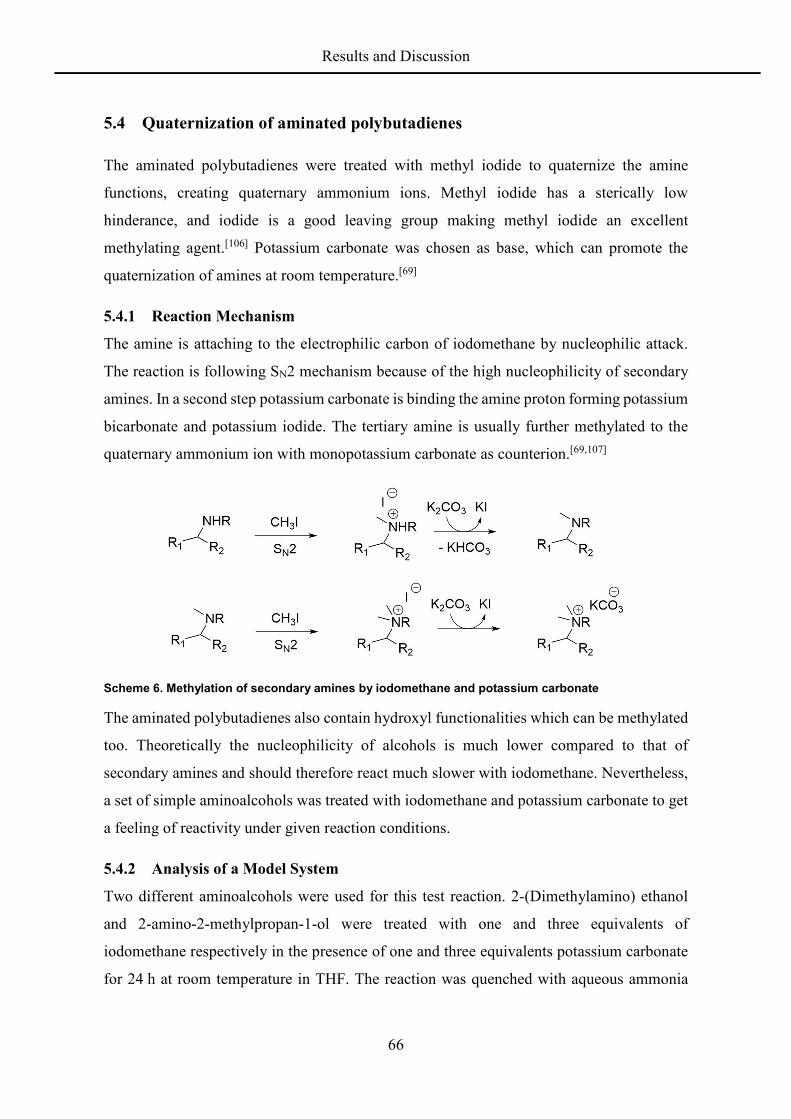
Results and Discussion
66
5.4 Quaternization of aminated polybutadienes
The aminated polybutadienes were treated with methyl iodide to quaternize the amine
functions, creating quaternary ammonium ions. Methyl iodide has a sterically low
hinderance, and iodide is a good leaving group making methyl iodide an excellent
methylating agent.[106] Potassium carbonate was chosen as base, which can promote the
quaternization of amines at room temperature.[69]
5.4.1 Reaction Mechanism
The amine is attaching to the electrophilic carbon of iodomethane by nucleophilic attack.
The reaction is following SN2 mechanism because of the high nucleophilicity of secondary
amines. In a second step potassium carbonate is binding the amine proton forming potassium
bicarbonate and potassium iodide. The tertiary amine is usually further methylated to the
quaternary ammonium ion with monopotassium carbonate as counterion.[69,107]
Scheme 6. Methylation of secondary amines by iodomethane and potassium carbonate
The aminated polybutadienes also contain hydroxyl functionalities which can be methylated
too. Theoretically the nucleophilicity of alcohols is much lower compared to that of
secondary amines and should therefore react much slower with iodomethane. Nevertheless,
a set of simple aminoalcohols was treated with iodomethane and potassium carbonate to get
a feeling of reactivity under given reaction conditions.
5.4.2 Analysis of a Model System
Two different aminoalcohols were used for this test reaction. 2-(Dimethylamino) ethanol
and 2-amino-2-methylpropan-1-ol were treated with one and three equivalents of
iodomethane respectively in the presence of one and three equivalents potassium carbonate
for 24 h at room temperature in THF. The reaction was quenched with aqueous ammonia

Results and Discussion
67
solution after 24 h. 2-(Dimethylamino) ethanol was completely quaternized which was
accompanied by a downfield shift of the methyl signals. No sign of alcohol methylation and
therefore ether formation was visible (Figure 41).
2-Amino-2-methylpropan-1-ol was quaternized to 75% under the described conditions. The
remaining 25% stopped at tertiary amine. Evaporation of iodomethane (bp.: 42 °C[108]) might
be a reason for the incomplete quaternization. No sign of ether formation was visible (Figure
42).
Figure 41. 1H-NMR spectrum of quaternized 2-(dimethylamino) ethanol

Results and Discussion
68
Figure 42. 1H-NMR spectrum of quaternized 2-amino-2-methylpropan-1-ol
Even the sterically more hindered 2-amino-2-methylpropan-1-ol was readily quaternized
under given conditions. The reaction rate was probably lower compared to that of 2-
(Dimethylamino) ethanol, but the alkylation was still highly selective towards amine
methylation and no primary or secondary amine was left unreacted.
These reaction conditions were transferred to the quaternization of aminated polybutadienes.
5.4.3 Progression of Quaternization with Iodomethane
The quaternization of 2-amino-2-methylpropan-1-ol showed an insufficient conversion to
ammonium ions with three equivalents of iodomethane. The methylation of aminated
polybutadienes carrying secondary amines would need at least two equivalents of
iodomethane to give the quaternary ammonium ion. An excess of iodomethane (5-10 eq
relating to the concentration of amine groups) was used for the quaternization of aminated
polybutadienes to avoid insufficient methylation like seen with 2-amino-2-methylpropan-1-
ol. Iodomethane was divided into two halves, to compensate for the probable evaporation of
iodomethane over the course of the reaction. The first half was added at the start of the
reaction, the other half after a certain time of reaction.
The aminated polybutadiene was dissolved in THF and potassium carbonate was dispersed
in the solution under stirring. Iodomethane was added to start the reaction. Samples were

Results and Discussion
69
taken during the reaction. After 24 to 72 h the dispersion was treated with aqueous ammonia
solution to quench the reaction. The reaction mixture was precipitated in cold water and
dried under reduced pressure. The resulting quaternized polybutadiene was analyzed by
NMR-spectroscopy.
The NMR signals of the ammonium ion’s N-methyl groups are interfering with the
polybutadiene signals. The methyl group of the n-butyl rest attached to the nitrogen atom
has a distinctive shift in 1H-NMR spectrums and can be used for the monitoring of
conversion from amine to ammonium ion groups (Figure 43). Lorentzian function was used
for peak fitting due to overlapping signals. Elemental analysis is supporting the NMR results.
Figure 43. Signal changes over the course of the reaction
A typical progression of quaternization at room temperature in THF over time is shown in
Figure 44. 5 eq iodomethane relating to the concentration of amine groups were added. 3 eq
at the beginning of the reaction and 2 eq after 5 h. Additionally 2 eq potassium carbonate
were added at the beginning.

Results and Discussion
70
Figure 44. Conversion of quaternization reaction
The reaction rate is very high at the beginning of reaction and slowing down significantly
with more ammonium ions forming. A reduced solubility with increasing polarity of the
polybutadiene could be the reason. A sterically more hindered center of reaction with
proceeding methylation might be another reason. The introduction of iodomethane after 5 h
seemed to boost the reaction and preventing further deceleration. At high conversions a
distinction of peaks in 1H-NMR spectra is challenging which results in increasing error in
conversion determination. The cyclic tertiary amine groups are most probably slower in
quaternization reaction compared to the secondary amine groups.
5.4.4 Material properties
The resulting quaternized polybutadiene at room temperature is no longer a liquid rubbery
material, but hard and brittle. The polymer structure is resembling polyquaterniums, cationic
polyelectrolytes e.g. used in personal care industry as antistatics and film former.[73] The
cationic charges along the chain are expected to repel themselves and lead to a more
expended rod-like structure compared to the random-coil structure in nonionic
polybutadiene.[109] These conformational changes have a significant impact on the polymer
bulk properties like melt viscosity. The increasing polarity seems also to increase chain-
chain interaction and chain stiffness which results in the increasing glass transition
temperature. The glass transition temperature is increasing to 45 °C (DSC). The significant
0 10 20 30 40 50
0
10
20
30
40
50
60
70
80
90
100
Convers
ion [%
]
time [h]

Results and Discussion
71
increase in polarity is the reason for increasing solubility in more polar solvents. The product
is soluble in methanol.
Based on conversion of aminolysis and quaternization 20% of initial double bonds are
transferred to an ammonium entity if 30% epoxidated polybutadiene is used. For 42%
epoxidated polybutadiene 25% of initial double bonds are holding an ammonium entity after
quaternization. For Lithium PM4 that would be five to seven ammonium ion entities per
chain, or one ammonium ion every 16-22 carbon atoms in average.
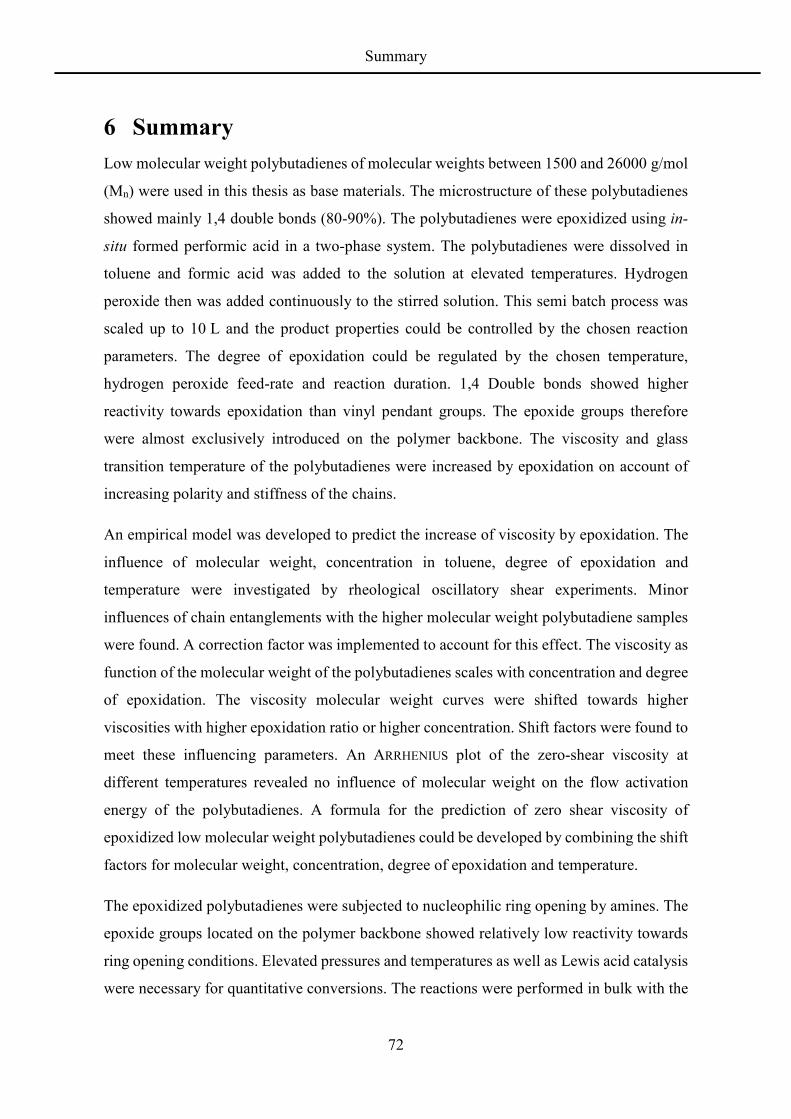
Summary
72
6 Summary
Low molecular weight polybutadienes of molecular weights between 1500 and 26000 g/mol
(Mn) were used in this thesis as base materials. The microstructure of these polybutadienes
showed mainly 1,4 double bonds (80-90%). The polybutadienes were epoxidized using in-
situ formed performic acid in a two-phase system. The polybutadienes were dissolved in
toluene and formic acid was added to the solution at elevated temperatures. Hydrogen
peroxide then was added continuously to the stirred solution. This semi batch process was
scaled up to 10 L and the product properties could be controlled by the chosen reaction
parameters. The degree of epoxidation could be regulated by the chosen temperature,
hydrogen peroxide feed-rate and reaction duration. 1,4 Double bonds showed higher
reactivity towards epoxidation than vinyl pendant groups. The epoxide groups therefore
were almost exclusively introduced on the polymer backbone. The viscosity and glass
transition temperature of the polybutadienes were increased by epoxidation on account of
increasing polarity and stiffness of the chains.
An empirical model was developed to predict the increase of viscosity by epoxidation. The
influence of molecular weight, concentration in toluene, degree of epoxidation and
temperature were investigated by rheological oscillatory shear experiments. Minor
influences of chain entanglements with the higher molecular weight polybutadiene samples
were found. A correction factor was implemented to account for this effect. The viscosity as
function of the molecular weight of the polybutadienes scales with concentration and degree
of epoxidation. The viscosity molecular weight curves were shifted towards higher
viscosities with higher epoxidation ratio or higher concentration. Shift factors were found to
meet these influencing parameters. An ARRHENIUS plot of the zero-shear viscosity at
different temperatures revealed no influence of molecular weight on the flow activation
energy of the polybutadienes. A formula for the prediction of zero shear viscosity of
epoxidized low molecular weight polybutadienes could be developed by combining the shift
factors for molecular weight, concentration, degree of epoxidation and temperature.
The epoxidized polybutadienes were subjected to nucleophilic ring opening by amines. The
epoxide groups located on the polymer backbone showed relatively low reactivity towards
ring opening conditions. Elevated pressures and temperatures as well as Lewis acid catalysis
were necessary for quantitative conversions. The reactions were performed in bulk with the

Summary
73
amine as solvent in high excess and lithium bromide as catalyst. Lithium bromide was
chosen as catalyst because of its low cost and easy removal from the amine modified
polybutadiene product. However, even with catalyst concentrations of 30 mol% quantitative
conversion was achieved only after 24 hours. Apart from this low reactivity there was a
mismatch between epoxide group conversion and aminol formation, hinting towards
occurring side reactions. An intramolecular ring opening of neighboring epoxide groups was
identified as a possible mechanism. The probability of existing neighboring epoxide groups
increases with increasing degree of epoxidation due to the statistical nature of the
epoxidation reaction. A lower maximum degree of amine modification is therefore achieved
with higher degree of epoxidated polybutadienes.
The amine groups in the aminated polybutadiene were alkylated using iodomethane and
potassium carbonate at room temperature. The secondary amine groups were N-
permethylated to get access to quaternary ammonium ions on the polybutadiene backbone.
The introduction of ionic groups to the polymer chain had a significant impact on bulk
properties such as glass transition temperature, which rose above room temperature making
this polyelectrolyte a hard and brittle material. Additionally, solubility in polar solvents like
methanol was increased.
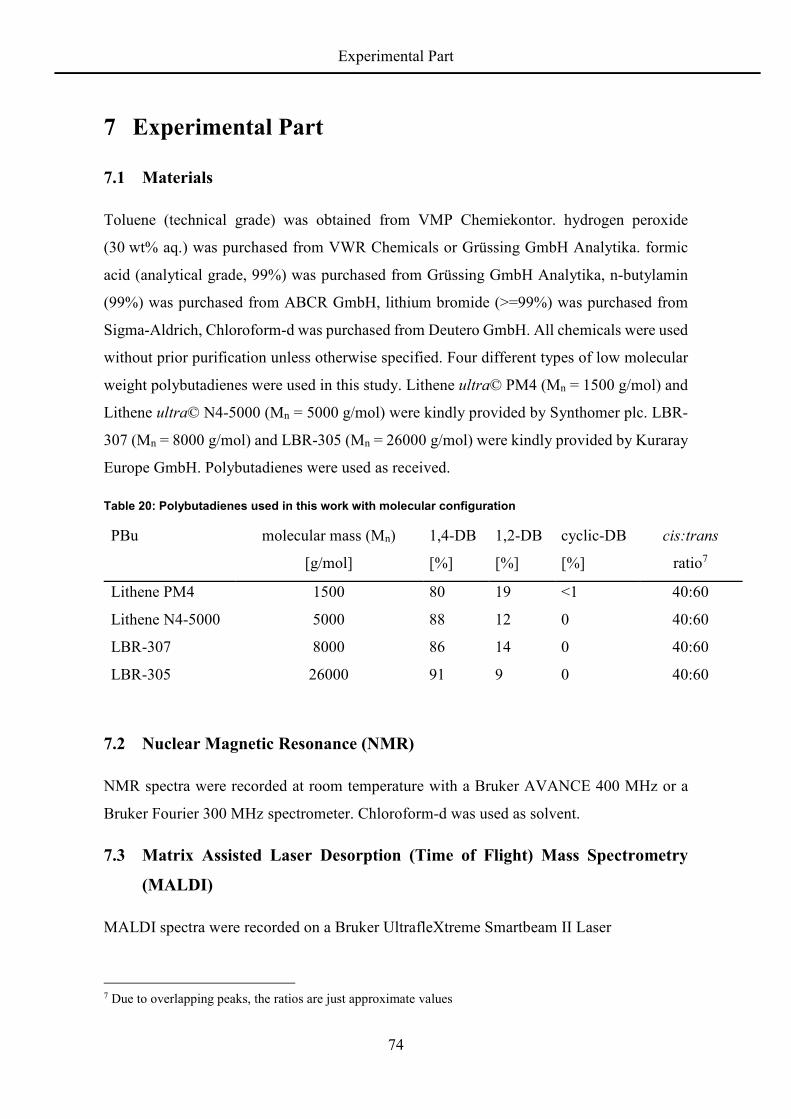
Experimental Part
74
7 Experimental Part
7.1 Materials
Toluene (technical grade) was obtained from VMP Chemiekontor. hydrogen peroxide
(30 wt% aq.) was purchased from VWR Chemicals or Grüssing GmbH Analytika. formic
acid (analytical grade, 99%) was purchased from Grüssing GmbH Analytika, n-butylamin
(99%) was purchased from ABCR GmbH, lithium bromide (>=99%) was purchased from
Sigma-Aldrich, Chloroform-d was purchased from Deutero GmbH. All chemicals were used
without prior purification unless otherwise specified. Four different types of low molecular
weight polybutadienes were used in this study. Lithene ultra© PM4 (Mn = 1500 g/mol) and
Lithene ultra© N4-5000 (Mn = 5000 g/mol) were kindly provided by Synthomer plc. LBR-
307 (Mn = 8000 g/mol) and LBR-305 (Mn = 26000 g/mol) were kindly provided by Kuraray
Europe GmbH. Polybutadienes were used as received.
Table 20: Polybutadienes used in this work with molecular configuration
PBu molecular mass (Mn)
[g/mol]
1,4-DB
[%]
1,2-DB
[%]
cyclic-DB
[%]
cis:trans
ratio7
Lithene PM4 1500 80 19 <1 40:60
Lithene N4-5000 5000 88 12 0 40:60
LBR-307 8000 86 14 0 40:60
LBR-305 26000 91 9 0 40:60
7.2 Nuclear Magnetic Resonance (NMR)
NMR spectra were recorded at room temperature with a Bruker AVANCE 400 MHz or a
Bruker Fourier 300 MHz spectrometer. Chloroform-d was used as solvent.
7.3 Matrix Assisted Laser Desorption (Time of Flight) Mass Spectrometry
(MALDI)
MALDI spectra were recorded on a Bruker UltrafleXtreme Smartbeam II Laser
7 Due to overlapping peaks, the ratios are just approximate values

Experimental Part
75
7.4 Rheometry
Rheometry measurements were done on an ARES G2 Rheometer from TA instruments with
a 60 mm 2° steel cone geometry and peltier plate. The software TRIOS v4.2.1.36612 was
used for measurements and data evaluation.
7.5 Differential Scanning Calorimetry (DSC)
A Mettler Toledo DSC 1 or DSC 821 instrument calibrated with indium was used for thermal
analysis. The weight of samples sealed in an aluminium pan was about 10-15 mg.
First, the samples were cooled from room temperature to -20 °C at -20 K/min, held for 2
min. In a second step, the samples were heated from -20 °C to 60 °C at 10 K/min and held
for 2 min to erase the thermal history. After a second cooling from 60 °C to -120 °C at -20
K/min and second holding for 2 min, the samples were heated from -120 °C to 60 °C at 10
K/min to record heating curves of each sample.
7.6 Gel Permeation Chromatography (GPC)
GPC elugrams were measured on a set up using a precolumn MZ Gel SDplus, 5 µm, 100 Å
from MZ-Analysentechnik, two 5µm Polypore columns from Polymer Laboratories (now
Agilent), an HPLC Pump Intelligent Pump AI12 from Flom, a degasser PLDG 802 from
Polymer Laboratories (now: Agilent), a RI Detector RI 101 from Shodex. The interface hs
2600 and software NTeQGPC V 6.4 version V 1.0.25 used were from hs GmbH.
7.7 Titration of Epoxidized Polybutadienes
Titration of epoxidized polybutadienes for determination of epoxide content was done using
the automatic titration system Titroline alpha plus from SI Analytics. A pH-electrode N4680
eth was used. The end-point determination was done potentiometric with the software
TitriSoft 4.3.

Experimental Part
76
7.8 Epoxidation of Polybutadienes
7.8.1 Reaction Setup
The epoxidation of low molecular weight polybutadienes was performed in various reaction
vessels of glass (250 mL) or steel (1 and 10 L). The double walled cylindrical 250 mL glass
reactor (Büchi AG) was equipped with an anchor stirrer, a thermostat and a syringe pump.
The double walled cylindrical 1 L and double walled conical 10 L steel reactor (Juchheim
Laborgeräte GmbH) were equipped with an anchor stirrer, a thermostat and a double piston
pump (Pharmacia LKB P-500) for uninterrupted feeding of hydrogen peroxide. The
conversion showed a dependence on the reactor material: The first couple of reactions in
steel reactors showed lower conversions, i.e. before the surface was deactivated. This may
be related to metallic ions accelerating the decomposition of hydrogen peroxide.[110] After
each experiment the vessel was extracted three times with toluene for 30 min at the reaction
temperature.
7.8.2 General Procedure of Epoxidation with in-situ Formed Performic Acid
PBu was dissolved in toluene to a concentration of 10-15 wt%. The solution was transferred
to the reactor and heated to reaction temperature. Formic acid (FA) was added. Hydrogen
peroxide (30 wt%) was subsequently added to the stirred mixture, either in one batch or in
semi-batch mode. After the reaction, the organic phase of the final reaction mixture was
phase separated from the aqueous phase, and subsequently washed twice with a saturated
NaHCO3-solution and with a saturated NaCl-solution to remove residual peroxide and acid.
The organic phase was then dried over Na2SO4 and the toluene was removed under reduced
Figure 45. Reaction set-up of the semi-batch process

Experimental Part
77
pressure at 60 °C. The epoxidized polybutadienes were obtained in yields between 90 and
98% based on the applied PBu.
7.8.3 Degree of Epoxidation
The degree of epoxidation was conveniently determined from the 1H-NMR spectra in CDCl3.
The degree of epoxidation was calculated using equation 12. The integrals refer to the signals
indicated by the chemical shift δ in ppm.
( 2.7 2.9 )[%] 100%
( 2.7 2.9 ) ( 5.0 ) ( 5.4 5.6 )
ppmX
ppm ppm ppm
(12)
The signals of the 1,2- and 1,4-double bonds ( = 5.0 − 5.6 broaden as a result of the
epoxidation, the integrals however can be obtained without additional effort. Additionally,
elemental analysis was performed to determine the degree of double bond epoxidation. The
results of elemental analysis are in accordance with the 1H-NMR results (Table 21).
Table 21. Comparison of results of conversion by 1H-NMR and elemental analysis.
conversion by 1H-NMR [%] conversion by elemental analysis [%]
10 12
21 21
30 32
37 37
39 38
42 42
The progress of the reaction was monitored from samples taken from the reacting mixture.
The stirring was stopped, a sample of about 2 mL was taken from the reaction mixture with
a pipette and transferred to a glass vial. It was treated two times with 1 mL of NaHCO3
solution and once with 1 mL of NaCl solution. The organic phase was transferred to another
glass vial and the toluene removed under reduced pressure.

Experimental Part
78
7.8.4 Titration of Epoxide Groups
The titration was based on the method of JUNG and KLEEBERG.[78] The epoxidized PBu
sample was put into a 50 mL Erlenmeyer flask. The sample mass added was calculated by 1H-NMR results, that 1.5 mmol epoxide groups were present in the sample. 5 mL butanone
was added and slewed until the PBu sample was dissolved. 10 mL of a solution (8 mL
concentrated hydrochloric acid in 300 mL butanone) was added and the closed flask stored
for 30 min. 5 mL of demineralized water was added prior to titration to dissolve potassium
chloride formed during reaction. The titration was conducted using 0.1 M ethanol solution
of potassium hydroxide.
A blank value was determined once every day of measurement. The titer potassium
hydroxide solution was determined using 200 to 300 mg potassium hydrogen phthalate in
boiled demineralized water.
The EP-value was calculated using the following equation:
= ∙ ∙∙ (13)
Vblank and Vsample are the volumes of potassium hydroxide solution used until titration end
point of the blank value and the sample titration respectively. c(KOH) describes the
concentration of potassium hydroxide solution and tKOH the titer of the same. The samples
mass is given by msample. The EP-value describes the molar amount of epoxide per 100 g of
epoxidized PBu, which can be calculated into a relative epoxidation ratio with the knowledge
of the polymers molecular mass.

Experimental Part
79
7.9 Rheological Characterization of Epoxidized Polybutadienes
7.9.1 Materials
Toluene was destilled and stored over molecular sieves (4 Å) prior to use.
7.10 Oscillatory Rheology measurements
A strain sweep measurement from 0.1% to 1% or 10% was done for every sample type to
determine the linear viscoelastic range of the material under the given conditions. The strain
for the frequency measurements was then set to a value well in the linear region of the
complex oscillatory viscosity.
For the toluene diluted samples a solvent trap cap was used to prevent solvent evaporation
during the measurement.
The time-temperature-superposition (TTS) mastercurves were calculated using the TRIOS
software and with the measurement at 25 °C as reference curve.

Experimental Part
80
7.11 Aminolysis of Epoxidized Polybutadienes
7.11.1 Process
The ring opening of epoxidized 1,4-polybutadiene is much slower compared to epoxidized
1,2-polybutadiene (vide supra). High temperatures are therefore needed, which exceed the
boiling point of n-butylamine (b.p.: 78 °C). These reactions are thus conducted in glass
autoclave vessels sealed by a PTFE cap and PTFE sealing tape (35 mL, max. 10 bar) at
temperatures above boiling point. The vessels were heated in a glass beaker filled with
sunflower oil. A Heidolph MR 3002 control heating plate was used as heating device.
1 or 2 g of the epoxidized polybutadiene was dissolved under stirring in 20 mL of butyl
amine, lithium bromide was added, the vessel was sealed tight and heated to the reaction
temperature.
After the reaction time the vessel was allowed to cool, the excess amine was evaporated
under reduced pressure and the resulting high viscous product was precipitated out of THF
in water to remove residual free n-butylamine. The product was received as a highly viscous,
slightly yellow liquid.
7.11.2 Degree of Aminolysis
The decrease of epoxy content and increase of amine functionalization was monitored by 1H-NMR and 13C-NMR I-Gated measurements. In 1H-NMR spectroscopy, the signals at
2.7 ppm and 2.9 ppm are attributed to the trans and cis epoxy groups respectively. In 13C-
NMR I-Gated measurements the signals at 56.7 ppm and 58.3 ppm are attributed to the cis
and trans epoxy groups respectively (Figure 46). The analysis of the amine conversion is
illustrated exemplarily for the aminolysis with n-butylamine, where the signal of the terminal
methyl group is shown at 0.92 ppm in 1H-NMR measurements. The signals of the remaining
methylene groups coincide with the signals of the polybutadiene chain. In 13C-NMR I-Gated
measurements the signal at 14.0 ppm is attributed to the terminal methyl group of butylamine
and the signal at 20.5 ppm to the adjacent methylene group (Figure 46).

Experimental Part
81
Figure 46: 13C-NMR I-Gated spectra of the epoxidized sample (a) and the aminated sample (b).
The integrals of the peaks in 13C-NMR I-Gated spectra are only reliable with long relaxation
times. Because of the resulting very long measuring times the degree of aminolysis was
determined by 1H-NMR spectra and elemental analysis measurements. However qualitative
results were drawn from the 13C-NMR I-Gated spectra. A 13C-NMR I-Gated measurement
with a relaxation time of 80 s showed good accordance with the results of 1H-NMR and
elemental analysis (Table 16).
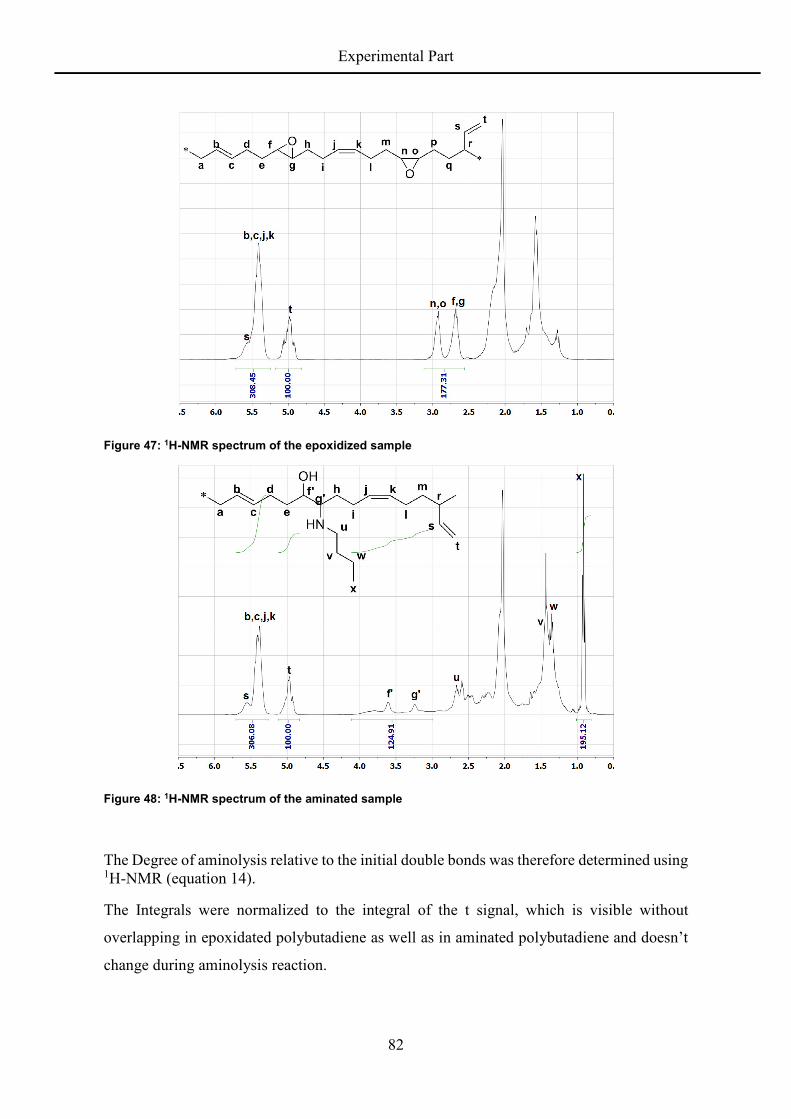
Experimental Part
82
Figure 47: 1H-NMR spectrum of the epoxidized sample
Figure 48: 1H-NMR spectrum of the aminated sample
The Degree of aminolysis relative to the initial double bonds was therefore determined using 1H-NMR (equation 14).
The Integrals were normalized to the integral of the t signal, which is visible without
overlapping in epoxidated polybutadiene as well as in aminated polybutadiene and doesn’t
change during aminolysis reaction.
Experimental Part
83
The integrals of n, o, f and g in the spectrum of the epoxidated polybutadiene precurser
(EBR) were divided by two, since two protons represent one epoxide group. The integral of
x in the spectrum of the aminated polybutadiene product (ABR) was divided by three, since
three protons represent one amine group. The integrals of b, c, j, k, t in the spectra of
epoxidized as well as aminated polybutadiene were divided by two, since two protons
represent one double bond. The corrected integrals were used in equation (14.
Σ , , , , , , , , , = , Σ , , , , , , =
(14)
% = + − + + , , , ∗ 100
The difference of EBR and ABR equals the integrals of epoxide groups not opened by n-
butylamine, representing either unopened epoxide groups or epoxide groups opened by a
neighboring aminol group forming a cyclic ether or cyclic amine (see chapter 5.3.4). The
formation of cycles does open an epoxide group without the addition of n-butylamine.

Experimental Part
84
7.12 Quaternization of aminated polybutadienes
7.12.1 Process
In a glass flask equipped with a magnetic stirrer 1-10 g aminated polybutadiene were
dissolved in THF (10-15 times by weight) under stirring at room temperature. 2-3 eq
potassium carbonate, relative to the concentration of amine groups, were added under
stirring. The first half of 5-10 eq iodomethane, relative to the concentration of amine groups,
were added to the resulting suspension to start the reaction. The flask was sealed, to avoid
evaporation of iodomethane. During the reaction a fine colorless precipitation was visible,
which was distinguishable from the coarse potassium carbonate and most likely was
potassium iodide. After a certain time (usually 24 h) the second half of iodomethane was
added.
After 72 h the reaction was quenched by adding 50 mL of aqueous ammonia (30%). The
resulting mixture was precipitated in cold water, filtered, washed with water and dried under
reduced pressure. The product was received as a hard, slightly brown foam.
7.12.2 Degree of Quaternization
The degree of quaternization was monitored using 1H-NMR spectroscopy. The triplet at
0.92 ppm, attributed to the methyl group of bound n-butylamine, shifts downfield with the
introduction of quaternary ammonium ions (Figure 49). The remaining methylene groups of
bound n-butylamine shift as well but coincide with the rubber signals of polybutadiene. The
shifted triplet has still some overlapping with the triplet of non-ionized amines methyl group,
which is why a lorentzian fit was used to distinguish both peaks (Figure 50).
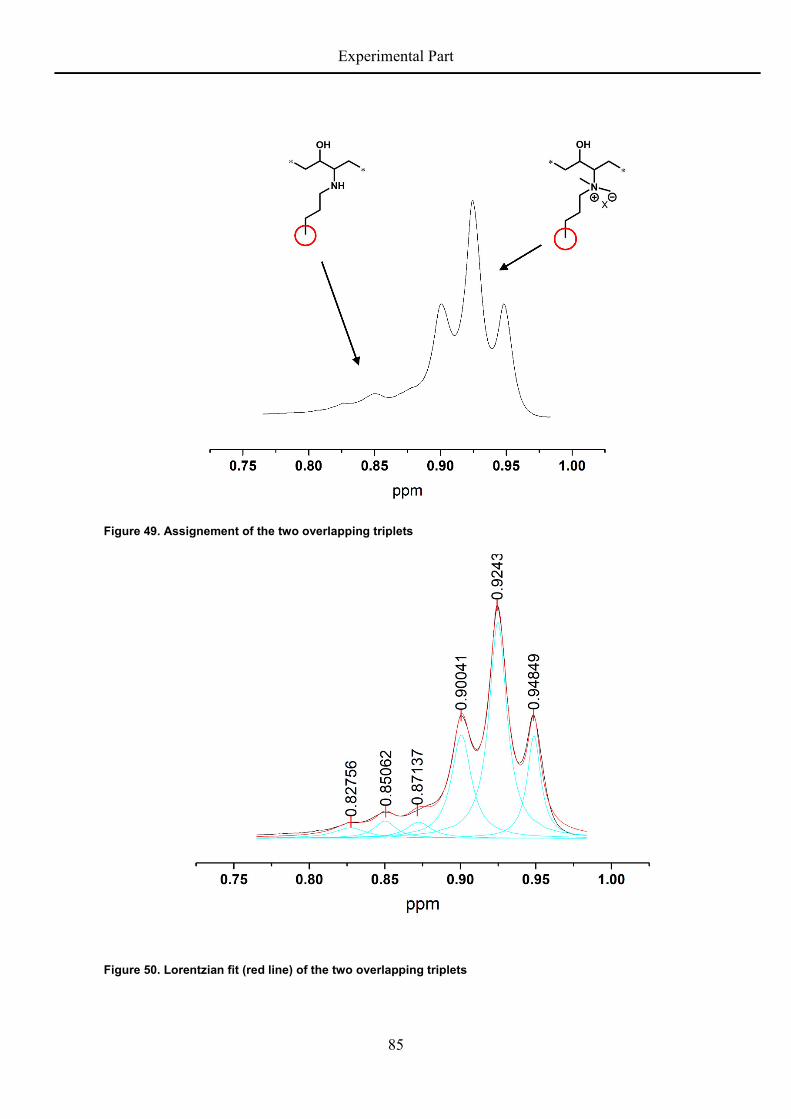
Experimental Part
85
Figure 49. Assignement of the two overlapping triplets
Figure 50. Lorentzian fit (red line) of the two overlapping triplets

Experimental Part
86
The conversion was calculated using equation (15):
X% = 0.90, 0.92, 0.95 0.90, 0.92, 0.95 + 0.83, 0.85, 0.87 ∗ 100 (15)

Safety Data
87
8 Safety Data
Table 22. Hazard statements according to GHS[108]
Substance GHS pictograms Hazard Sentences Precaution Sentences
1,2-Epoxybutane
Danger
H225,
H302+H312+H332,
H315, H319, H335,
H351, H412
P21, P261, P273, P280,
P305+P351+P338,
P308+P313, P403+P235
2-(Dimethylamino)-
ethanol
Danger
H226, H331, H312,
H302, H314, H335
P210, P280,
P303+P361+P353,
P305+P351+P338,
P312, P405
2,3-Epoxybutan
Danger
H225, H315, H319,
H335
P210, P261,
P305+P351+P338
2-Amino-2-
methylpropan-1-ol
Danger
H315, H318, H412 P273, P280,
P305+P351+P338
Aqueous ammonia
(30%)
Danger
H290, H314, H335,
H400
P260, P273, P280,
P301+P330+P331,
P303+P361+P353,
P305+P351+P338
Butanone
Danger
H225, H319, H336 P210,
P305+P351+P338,
P403+P233
Chloroform-d
Danger
H302, H331, H315,
H319, H351, H361d,
H372
P201, P260, P264,
P280,
P304+P340+P311,
P403+P233
Benzil
Caution
H315, H319 P302+P352,
P305+P351+P338

Safety Data
88
Substance GHS pictograms Hazard Sentences Precaution Sentences
Dimethylsulfate
Danger
H301, H314, H317,
H330, H341, H350
P201, P280,
P301+P330+P331,
P302+P352,
P304+P340,
P305+P351+P338,
P308+P310
Formic acid
Danger
H226, H302, H314,
H331
P210, P280,
P303+P361+P353,
P304+P340+P310,
P305+P351+P338,
P403+P233
Hydrochloric acid
aq. (36%)
Danger
H290, H314, H335 P260, P280,
P303+P361+P353,
P304+P340+P310,
P305+P351+P338
Hydrogen peroxide
aq. (30%)
Danger
H318, H412 P280,
P305+P351+P338+P310
Iodomethane
Danger
H301+H331, H312,
H315, H319, H335,
H351, H410
P273, P302+P352,
P304+P340,
P305+P351+P338,
P308+P310
LBR-305 No hazardous substance
LBR-307 No hazardous substance
Lithene ultra® N4-
5000 No hazardous substance
Lithene ultra® PM4 No hazardous substance
Lithium bromide
Caution
H302, H315, H317,
H319
P280, P305+P351+P338
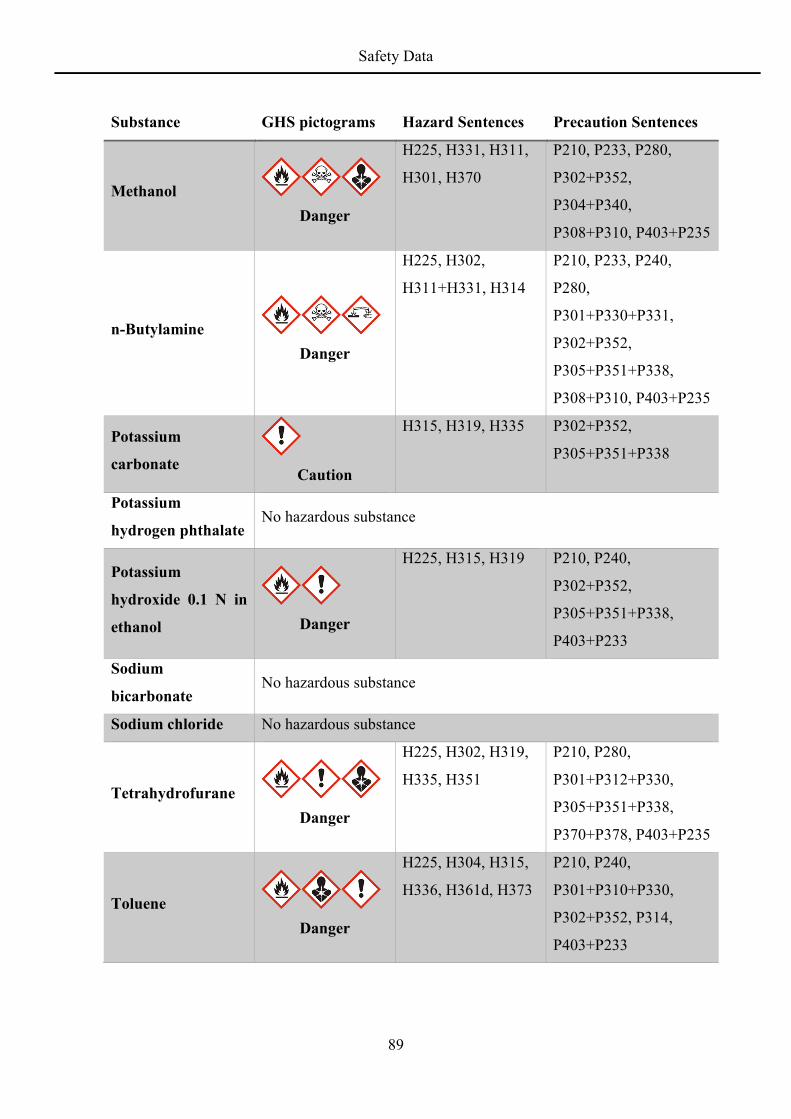
Safety Data
89
Substance GHS pictograms Hazard Sentences Precaution Sentences
Methanol
Danger
H225, H331, H311,
H301, H370
P210, P233, P280,
P302+P352,
P304+P340,
P308+P310, P403+P235
n-Butylamine
Danger
H225, H302,
H311+H331, H314
P210, P233, P240,
P280,
P301+P330+P331,
P302+P352,
P305+P351+P338,
P308+P310, P403+P235
Potassium
carbonate
Caution
H315, H319, H335 P302+P352,
P305+P351+P338
Potassium
hydrogen phthalate No hazardous substance
Potassium
hydroxide 0.1 N in
ethanol
Danger
H225, H315, H319 P210, P240,
P302+P352,
P305+P351+P338,
P403+P233
Sodium
bicarbonate No hazardous substance
Sodium chloride No hazardous substance
Tetrahydrofurane
Danger
H225, H302, H319,
H335, H351
P210, P280,
P301+P312+P330,
P305+P351+P338,
P370+P378, P403+P235
Toluene
Danger
H225, H304, H315,
H336, H361d, H373
P210, P240,
P301+P310+P330,
P302+P352, P314,
P403+P233

Safety Data
90
CMR substances used are listed in Table 23.
Table 23. CMR substances used.[111]
CAS-No. Name Procedure Quantity Catagory
77-78-1 Dimethylsulfate Quarternization ~200 mL Carc. 1B
106-88-7 1,2-Epoxybutane Aminolysis ~14 mL Carc. 1B
67-66-3 Trichloromethane-d NMR-Measurements ~200 mL Carc. 1B
Bibliography
91
9 Bibliography
[1] H.-G. Elias in Makromoleküle (Ed.: H.-G. Elias), 1999.
[2] D. Zuchowska, Polymer 1980, 21, 514–520.
[3] M. M. Jacobi, C. K. Santin, M. E. Viganico, R. H. Schuster, Kautschuk Gummi
Kunststoffe 2004, 3/2004, 82–89.
[4] R. J. Salinas, R. B. Petrovic, Synthetic Rubber Overview, Goa, India, 2016.
[5] F. Röthemeyer, F. Sommer (Eds.) Kautschuk-Technologie. Werkstoffe - Verarbeitung -
Produkte, Hanser, München [u.a.], 2006.
[6] S. V. Lebedev, Zh. Russ. Fiz.Khim. Ova. Chast. 1910, 42, 949.
[7] C. Harries, Justus Liebigs Ann. Chem. 1911, 383, 157–227.
[8] F. E. Mathews, E. H. Strange, GB 24,790, 1910.
[9] I.G. Farbenfabriken, FR 668113, 1928.
[10] Phillips Petroleum Comp., GB 848065, 1956.
[11] M. D. Lechner, K. Gehrke, E. Nordmeier, Makromolekulare Chemie. Ein Lehrbuch
für Chemiker, Physiker, Materialwissenschaftler und Verfahrenstechniker, Birkhäuser,
Basel, 2010.
[12] F. E. Matthews, E. H. Strange, GB24.700, 1910.
[13] P. Cossee, Tetrahedron Letters 1960, 1, 12–16.
[14] P. Cossee, Journal of Catalysis 1964, 3, 80–88.
[15] P. Cossee, Recl. Trav. Chim. Pays-Bas 1966, 85, 1151–1160.
[16] E. Arlman, Journal of Catalysis 1964, 3, 89–98.
[17] E. Arlman, Journal of Catalysis 1964, 3, 99–104.

Bibliography
92
[18] C. Costabile, G. Milano, L. Cavallo, G. Guerra, Macromolecules 2001, 34, 7952–
7960.
[19] Pigment & Resin Technology 1977, 6, 11–15.
[20] E. Piorkowska, A. S. Argon, R. E. Cohen, Polymer 1993, 34, 4435–4444.
[21] H. R. Brown, A. S. Argon, R. E. Cohen, O. S. Gebizlioglu, E. J. Kramer,
Macromolecules 1989, 22, 1002–1004.
[22] H. Fischer, B. Wegemund, W. Gress, M. Gorzinksi, DE3442200 A1, 1984.
[23] S. Ichimura, Y. Tsuzuki, K. Hino, US5965255, 1997.
[24] A. Konietzny, H.-D. Zagefka, K. Rombusch, H.-J. Bax, DE3233949 A1, 1982.
[25] D. C. Edwards, K. Sato, Rubber Chemistry and Technology 1980, 53, 66–79.
[26] Y. Arai, US4594388, 1984.
[27] J. Y. Choi, J. K. Lee, Y. You, W. H. Park, Fibers Polym 2003, 4, 195–198.
[28] G. Heublein, B. Heublein, P. Hortschansky, H. Meissner, H. Schutz, Journal of
Macromolecular Science: Part A - Chemistry 1988, 25, 183–200.
[29] J. W. Holubka, US4486571, 1983.
[30] M. Soga, Y. Takase, M. Ishikawa, M. Nakazawa, M. Nakayama, US4074034,
1975.
[31] Y. Tsuchiya, K. Ito, K. Hagihara, H. Sakamoto, Y. Otsuki, US4730010, 1986.
[32] H. Yasuno, T. Yoshinaga, T. Nakano, US4250007, 1979.
[33] A. N. Bibi, D. A. Boscott, T. Butt, R. S. Lehrle, European Polymer Journal 1988,
24, 1127–1131.
[34] P. Bussi, H. Ishida, J. Polym. Sci. B Polym. Phys. 1994, 32, 647–657.
[35] A. G. Margaritis, N. K. Kalfoglou, European Polymer Journal 1988, 24, 1043–
1047.

Bibliography
93
[36] J.-P. Dilcher, H. Jürgens, G. A. Luinstra in Advances in Polymer Science, Vol. 269
(Ed.: P. Theato), Springer International Publishing, Cham (Switzerland), 2015.
[37] Q. Zhou, S. Jie, B.-G. Li, Polymer 2015, 67, 208–215.
[38] F. P. Greenspan, R. E. Light, US2829135, 1955.
[39] C. Wheelock, Ind. Eng. Chem. 1958, 50, 299–304.
[40] W. Kirchhof, W. Stumpf, B. Schleimer, US3253000, 1962.
[41] H. S. Makowski, M. Lynn, D. H. Rotenberg, Journal of Macromolecular Science:
Part A - Chemistry 1970, 4, 1563–1597.
[42] T. Hirai, Y. Hatano, S. Nonogaki, J. Electrochem. Soc. 1971, 118, 669.
[43] El Fayoumi, Ali A. Z., Journal of Thermal Analysis 1982, 23, 135–141.
[44] W.-K. Huang, G.-H. Hsiue, W.-H. Hou, J. Polym. Sci. A Polym. Chem. 1988, 26,
1867–1883.
[45] R. Siegmeier, A. Grund, G. Prescher, U. Brandt, 4851556, 1988.
[46] O. Hayashi, K. Kimura, Y. Ooi, H. Ueno, Kobunshi Ronbunshu 1980, 37, 327–334.
[47] O. Hayashi, T. Takahashi, H. Kurihara, H. Ueno, Kobunshi Ronbunshu 1980, 37,
195–198.
[48] K. Maenz, H. Schütz, D. Stadermann, European Polymer Journal 1993, 29, 855–
861.
[49] S. Roy, Namboodri, C. S. S., B. R. Maiti, B. R. Gupta, Polym. Eng. Sci. 1993, 33,
92–96.
[50] Y. Kurusu, Y. Masuyama, M. Miyamoto, Polym J 1994, 26, 1163–1169.
[51] M. M. Jacobi, C. P. Neto, C. G. Schneider, Rocha, T. L. A. C., R. H. Schuster,
Kautschuk Gummi Kunststoffe 2002, 11/2002, 590–595.
[52] K. Maenz, M. Möllhoff, D. Stadermann, Acta Polym. 1996, 47, 208–213.

Bibliography
94
[53] A. Iraqi, S. Seth, C. A. Vincent, D. J. Cole-Hamilton, M. D. Watkinson, I. M.
Graham, D. Jeffrey, J. Mater. Chem. 1992, 2, 1057.
[54] M. P. Achalpurkar, U. K. Kharul, H. R. Lohokare, P. B. Karadkar, Sep. Purif.
Technol. 2007, 57, 304–313.
[55] D. Zuchowska, Makromol. Chem. Rapid Commun. 1981, 2, 135–138.
[56] A. K. Chakraborti, S. Rudrawar, A. Kondaskar, European Journal of Organic
Chemistry 2004, 2004, 3597–3600.
[57] T. Ollevier, G. Lavie-Compin, Tetrahedron Letters 2002, 43, 7891–7893.
[58] A. Solladié-Cavallo, P. Lupattelli, C. Bonini, The Journal of organic chemistry
2005, 70, 1605–1611.
[59] A. T. Placzek, J. L. Donelson, R. Trivedi, R. A. Gibbs, S. K. De, Tetrahedron
Letters 2005, 46, 9029–9034.
[60] M. Fujiwara, M. Imada, A. Baba, H. Matsuda, Tetrahedron Letters 1989, 30, 739–
742.
[61] M. Meguro, N. Asao, Y. Yamamoto, J. Chem. Soc., Perkin Trans. 1 1994, 2597.
[62] J. Augé, F. Leroy, Tetrahedron Lett 1996, 37, 7715–7716.
[63] G. R. Krishnan, K. Sreekumar, Polymer 2008, 49, 5233–5240.
[64] C. M. Kleiner, P. R. Schreiner, Chem. Commun. 2006, 4315.
[65] M. Vijender, P. Kishore, P. Narender, B. Satyanarayana, Journal of Molecular
Catalysis A: Chemical 2007, 266, 290–293.
[66] H. Chen, H. Zhang, D. Thor, R. Rahimian, X. Guo, Eur. J. Med. Chem. 2012, 52,
159–172.
Bibliography
95
[67] V. M. Dem’yanovich, I. N. Shishkina, A. A. Kuznetsova, K. A. Potekhin, A. V.
Chesnova, Russ. J. Org. Chem. (Russian Journal of Organic Chemistry) 2006, 42,
986–989.
[68] C. Zhang, H. Ito, Y. Maeda, N. Shirai, S.-i. Ikeda, Y. Sato, J. Org. Chem. 1999, 64,
581–586.
[69] T. Hunt, H. C. Atherton-Watson, S. P. Collingwood, K. J. Coote, S. Czarnecki, H.
Danahay, C. Howsham, P. Hunt, D. Paisley, A. Young, Bioorganic & Medicinal
Chemistry Letters 2012, 22, 2877–2879.
[70] C. Roberts, W. E. Lindsell, I. Soutar, Brit. Poly. J. 1990, 23, 55–62.
[71] J. Hazziza–Laskar, N. Nurdin, G. Helary, G. Sauvet, J. Appl. Polym. Sci. 1993, 50,
651–662.
[72] K. Dorfner, Ion Exchangers, De Gruyter, 2011.
[73] R. Schueller, P. Romanowski, Conditioning Agents for Hair and Skin, Taylor &
Francis, 1999.
[74] N. Phan-Thien, Understanding Viscoelasticity. An Introduction to Rheology,
Springer, Berlin, Heidelberg, 2013.
[75] TA instruments -, "Understanding Rheology of Thermoplastic Polymers".
[76] W. P. Cox, E. H. Merz, J. Polym. Sci. 1958, 28, 619–622.
[77] T. Mezger, Das Rheologie-Handbuch. Für Anwender von Rotations- und
Oszillations-Rheometern, Vincentz Network, Hannover, 2012.
[78] G. Jung, W. Kleeberg, Kunststoffe 1961, 51, 714–715.
[79] B. Kona, M. St. Weidner, J. F. Friedrich, International Journal of Polymer Analysis
and Characterization 2005, 10, 85–108.

Bibliography
96
[80] N. V. Bac, L. Terlemezyan, M. Mihailov, J. Appl. Polym. Sci. 1991, 42, 2965–
2973.
[81] S. Gnecco, A. Pooley, M. Krause, Polymer Bulletin 1996, 37, 609–615.
[82] S.-M. Wang, R. C.-C. Tsiang, J. Polym. Sci. A Polym. Chem. 1996, 34, 1483–1491.
[83] M. I. Abdullin, A. A. Basyrov, O. S. Kukovinets, A. B. Glazyrin, G. I.
Khamidullina, Polym. Sci. Ser. B 2013, 55, 349–354.
[84] N. E. Gordon, Dissertation, Johns Hopkins University, Baltimore, Maryland, 1917.
[85] Kolossowsky, Megenine, Bull. Soc. Chim. Fr. 1932, 51, 1000–1004.
[86] Atherton Seidell, Solubilities of Organic Compounds. A compilation of Quantitative
Solubility Data from the Periodical Literature, D. Van Nostrand Company, Inc., New
York, 1941.
[87] X. SUN, X. ZHAO, W. DU, D. LIU, Chinese Journal of Chemical Engineering
2011, 19, 964–971.
[88] J. P. Dilcher, Dissertation, Universität Hamburg, Hamburg, Unveröffentlicht.
[89] P. D. Filippis, M. Scarsella, N. Verdone, Ind. Eng. Chem. Res. 2009, 48, 1372–
1375.
[90] J. K. Jackson, M. E. de Rosa, H. H. Winter, Macromolecules 1994, 27, 2426–2431.
[91] M. Ballauff, Angewandte Chemie 1989, 101, 261–276.
[92] G. C. Berry, T. G. Fox, Adv. Polymer Sci. 1968, 5, 261–357.
[93] B. L. Hager, G. C. Berry, J. Polym. Sci. Polym. Phys. Ed. 1982, 20, 911–928.
[94] R. W. Rendell, K. L. Ngai, G. B. McKenna, Macromolecules 1987, 20, 2250–2256.
[95] Y. Takahashi, Y. Isono, I. Noda, M. Nagasawa, Macromolecules 1985, 18, 1002–
1008.

Bibliography
97
[96] De Risi, F. R., L. D'Ilario, A. Martinelli, J. Polym. Sci. A Polym. Chem. 2004, 42,
3082–3090.
[97] I. T. Smith, Polymer 1961, 2, 95–108.
[98] Y. Kurusu, Polym. Adv. Technol. 1996, 7, 67–72.
[99] B. A. Rozenberg in Advances in Polymer Science, Vol. 75 (Eds.: K. Dušek, J. P.
Bell), Springer-Verlag, Berlin, New York, 1986.
[100] P. K. Sundaram, M. M. Sharma, Bull. Chem. Soc. Jpn. 1969, 42, 3141–3147.
[101] I. R. Gelling, Rubber Chemistry and Technology 1985, 58, 86–96.
[102] I. R. Gelling, Prog. Rubb. & Plast Tech. 1991, 7, 271–297.
[103] A. Challioui, D. Derouet, A. Oulmidi, J. C. Brosse, Polym. Int. 2004, 53, 1052–
1059.
[104] S. Roth, S. Göhler, H. Cheng, C. B. W. Stark, Eur. J. Org. Chem. 2005, 2005,
4109–4118.
[105] S. Göhler, S. Roth, H. Cheng, H. Göksel, A. Rupp, L. Haustedt, C. Stark, Synthesis
2007, 2007, 2751–2754.
[106] G. A. Sulikowski, M. M. Sulikowski, M. H. Haukaas, B. Moon, Iodomethane,
2005, American Cancer Society, zu finden unter
https://onlinelibrary.wiley.com/doi/full/10.1002/047084289X.ri029m.pub2.
[107] H. Z. Sommer, L. L. Jackson, J. Org. Chem. 1970, 35, 1558–1562.
[108] IFA, "GESTIS-Stoffdatenbank", zu finden unter
http://gestis.itrust.de/nxt/gateway.dll?f=templates&fn=default.htm&vid=gestisdeu:sdb
deu.
[109] J. E. Mark, J. Am. Chem. Soc. 1966, 88, 4354–4359.
[110] C. Walling, A. Goosen, J. Am. Chem. Soc. 1973, 95, 2987–2991.

Bibliography
98
[111] Deutsche Gesetzliche Unfallversicherung, "Liste der krebserzeugenden,
keimzellmutagenen und reproduktionstoxischen Stoffe (KMR-Stoffe)", zu finden unter
https://publikationen.dguv.de/dguv/pdf/10002/kmr_oktober_2018.pdf, 2018.

Acknowledgements
99
10 Acknowledgements
In this chapter I like to thank a number of people who have accompanied and supported me
during my PhD. This part is written in German.
Zunächst möchte ich mich bei Herrn Professor Dr. Gerrit A. Luinstra bedanken für die
Aufnahme in seinen Arbeitskreis, die fachliche Betreuung und die Ermöglichung der
Promotion trotz meiner kreativen Schaffenspause nach der Diplomarbeit.
Herrn Professor Dr. Hans-Ulrich Moritz möchte ich für die Übernahme des Zweitgutachtens,
sowie informative und unterhaltsame Vorlesungen danken.
Kathrin Rehmke und Stefan Bleck danke ich für die Messung der zahlreichen GPC und DSC
Proben. Jens Pagel möchte ich für die kompetente und unkomplizierte Hilfe bei Reaktorbau
und anderen technischen Problemen danken. Holger Stockhusen danke ich für die Hilfe bei
Problemstellungen mit der Elektrik. Kathleen Pruntsch danke ich für die reibungslose
Abwicklung von Bestellungen und Laborbedarfsanforderungen, sowie ihr fröhlich direktes
Auftreten.
Dem gesamten AK Luinstra danke ich für die entspannte, lockere Atmosphäre, die Hilfe bei
fachlichen und organisatorischen Problemen, sowie die zahllosen Grillabende, Bierrunden,
Exkursionen, private Feiern, AK Fahrten und sportlichen Kampfhandlungen digitaler und
analoger Natur. Meinen Labormitbewohnern Claudi, Franzi, Daniel, Helena und Karen
danke ich für die kurzweilige und motivierende Arbeitsatmosphäre, sowie Gesprächen
innerhalb und abseits der Chemie. Daniel danke ich außerdem für die abwechslungsreiche
Musikauswahl, die geduldige theoretische und praktische Unterstützung (vor allem in der
Rheologie) und den hohen Entertainment Wert besonders nach ein paar Bierchen.
Herausheben möchte ich außerdem Jan für die Unterstützung bei Epoxidierung, Titration,
etc. und für die Fussballdiskussionen und Lars für Filmabende und Rain in Africa.
Ich danke meinen Praktikanten und Bachelorstudenten für die Unterstützung bei der
Synthesearbeit und besonders Stefanie Schmidt, Fabian Wenzel und Fabian Ratzke für ihren
engagierten Einsatz.

Acknowledgements
100
André, Dirk, Martin, Marcel und Matthias, danke ich für die Standhaftigkeit unter digitalem
Artilleriefeuer und Beschuss, die Stammtischrunden, Operation „Mustache“,
Junggesellenabschiede, Hochzeiten, Feiern, und und und.
Außerhalb der Uni möchte ich besonders Benni danken für seine vielen Jahre als Freund,
Kumpel und WG-Mitbewohner. Zusammen mit Jan und Tim gab es so schön viel Ablenkung
vom manchmal stressigen Uni-Alltag beim ein oder anderen Bier - egal wo (hauptsache
warm und Musik). Danke euch Jungs!
Meinen Schwiegereltern Elke und Karl-Heinz möchte ich danken für ihre Unterstützung auf
ganz vielen Ebenen und die sehr herzliche Aufnahme in die Familie.
Meinen Eltern gilt ganz besonderer Dank für ihre Unterstützung, ihren Stolz und ihre
Geduld. Vielen Dank dafür, dass ich immer auf euch zählen kann!
Meinen Schwestern Lene und Inga danke ich für lustige, gemütliche und spannende Tage,
Abende und Gespräche.
Mein Größter Dank gilt meiner Frau Ulrike, mit der ich nun schon über 13 Jahre mein Leben
teilen darf und seit über zwei Jahren eine wundervolle Tochter, sowie seit kurzem einen
aufgeweckten, kleinen Sohn habe. Ich danke Dir, dass Du mich motivierst, mir den Rücken
stärkst, mich ausgleichst, mich manchmal wieder auf den Weg bringst, Dich nicht verbiegst,
Dir treu bleibst und Dir nicht für Blödeleien zu schade bist!

Declaration of Oath
101
11 Declaration of Oath
I hereby declare on oath, that I have written the present dissertation by my own and have not
used other than the acknowledged resources and aids. I hereby declare that I have not
previously applied or pursued for a doctorate (Ph.D. studies).