Post-model Analysis in large-scale models: the … Post-model Analysis in large-scale models: the...
20
1 Post-model Analysis in large-scale models: the examples of Aglink-Cosimo, CAPRI and GTAP I. Pérez Domínguez (OECD), W. Britz (University of Bonn) and B. N. Gopalakrishnan (Purdue University) Paper prepared for organized session: „Result exploitation and analysis in large-scale economic models – state of the art and visions” at the 15th Annual Conference on Global Economic Analysis "New Challenges for Global Trade and Sustainable Development" June 27-29, 2012, Geneva, Switzerland Abstract This paper provides a detailed comparison between the graphical interfaces and post-model analysis tools of three large economic models: Aglink-Cosimo, CAPRI and GTAP. Whereas the Aglink-Cosimo and CAPRI models follow a strict separation between model and data analysis software tools, the GTAP model follows a model integrated approach using GEMPACK commercialized tools. Moreover, the CAPRI graphical user interface technically and formally detached from the data generation process. Aglink-Cosimo and GTAP use tools specifically developed to serve mainly their own needs (and tailored to communicate with their model drivers). One specific characteristic of Aglink-Cosimo relates to the need of interactive documentation for users, which relies upon the obligation of the OECD and FAO to deliver to the formalized Aglink-Cosimo user group a transparent and well- documented model and database. The CAPRI and GTAP models are much more research-driven and therefore have invested more resources in building bridges with other model consortia. Keywords: Aglink-Cosimo, CAPRI, GTAP, user interface, filtering, aggregation, normalization, documentation 1 Background Large-scale model produce a fair amount of results that need to be analyzed frequently by few people. On the one side, model developers need to continuously look at results during the development and debugging phases of a model project. On the other side, policy and market analysts working with model results need to see the information condensed in few numbers that can quickly be understood and made available in the form of a policy briefing or fact sheet. For this, having the appropriate graphical tools of exploitation at hand is very important, so that data can be quickly accessed and model results processed to be presented to the respective clients and user groups. The Aglink-Cosimo (OECD 2007, see also www.agri-outlook.org) and CAPRI (Britz & Witzke 2011, see also www.capri-model.org) models have a long history of providing policy advice to governments and have developed different tools to exploit their databases and result files. Basically, both model systems follow a strict separation of model code, data storage and graphical user interfaces (see Fig. 1). GTAP (Global Trade Analysis Project) was born as a global network of researchers and policy
Transcript of Post-model Analysis in large-scale models: the … Post-model Analysis in large-scale models: the...
1
Post-model Analysis in large-scale models: the examples of
Aglink-Cosimo, CAPRI and GTAP
I. Pérez Domínguez (OECD), W. Britz (University of Bonn) and B. N. Gopalakrishnan (Purdue University)
Paper prepared for organized session: „Result exploitation and analysis in large-scale economic
models – state of the art and visions” at the 15th Annual Conference on Global Economic Analysis
"New Challenges for Global Trade and Sustainable Development"
June 27-29, 2012, Geneva, Switzerland
Abstract This paper provides a detailed comparison between the graphical interfaces and post-model analysis
tools of three large economic models: Aglink-Cosimo, CAPRI and GTAP. Whereas the Aglink-Cosimo
and CAPRI models follow a strict separation between model and data analysis software tools, the
GTAP model follows a model integrated approach using GEMPACK commercialized tools. Moreover,
the CAPRI graphical user interface technically and formally detached from the data generation
process. Aglink-Cosimo and GTAP use tools specifically developed to serve mainly their own needs
(and tailored to communicate with their model drivers). One specific characteristic of Aglink-Cosimo
relates to the need of interactive documentation for users, which relies upon the obligation of the
OECD and FAO to deliver to the formalized Aglink-Cosimo user group a transparent and well-
documented model and database. The CAPRI and GTAP models are much more research-driven and
therefore have invested more resources in building bridges with other model consortia.
Keywords: Aglink-Cosimo, CAPRI, GTAP, user interface, filtering, aggregation, normalization,
documentation
1 Background Large-scale model produce a fair amount of results that need to be analyzed frequently by few
people. On the one side, model developers need to continuously look at results during the
development and debugging phases of a model project. On the other side, policy and market analysts
working with model results need to see the information condensed in few numbers that can quickly
be understood and made available in the form of a policy briefing or fact sheet. For this, having the
appropriate graphical tools of exploitation at hand is very important, so that data can be quickly
accessed and model results processed to be presented to the respective clients and user groups.
The Aglink-Cosimo (OECD 2007, see also www.agri-outlook.org) and CAPRI (Britz & Witzke 2011, see
also www.capri-model.org) models have a long history of providing policy advice to governments and
have developed different tools to exploit their databases and result files. Basically, both model
systems follow a strict separation of model code, data storage and graphical user interfaces (see
Fig. 1). GTAP (Global Trade Analysis Project) was born as a global network of researchers and policy
2
makers, sharing data and quantitative analysis of global economic issues (Hertel 1997; Itakura and
Hertel 2000; see also www.gtap.agecon.purdue.edu).
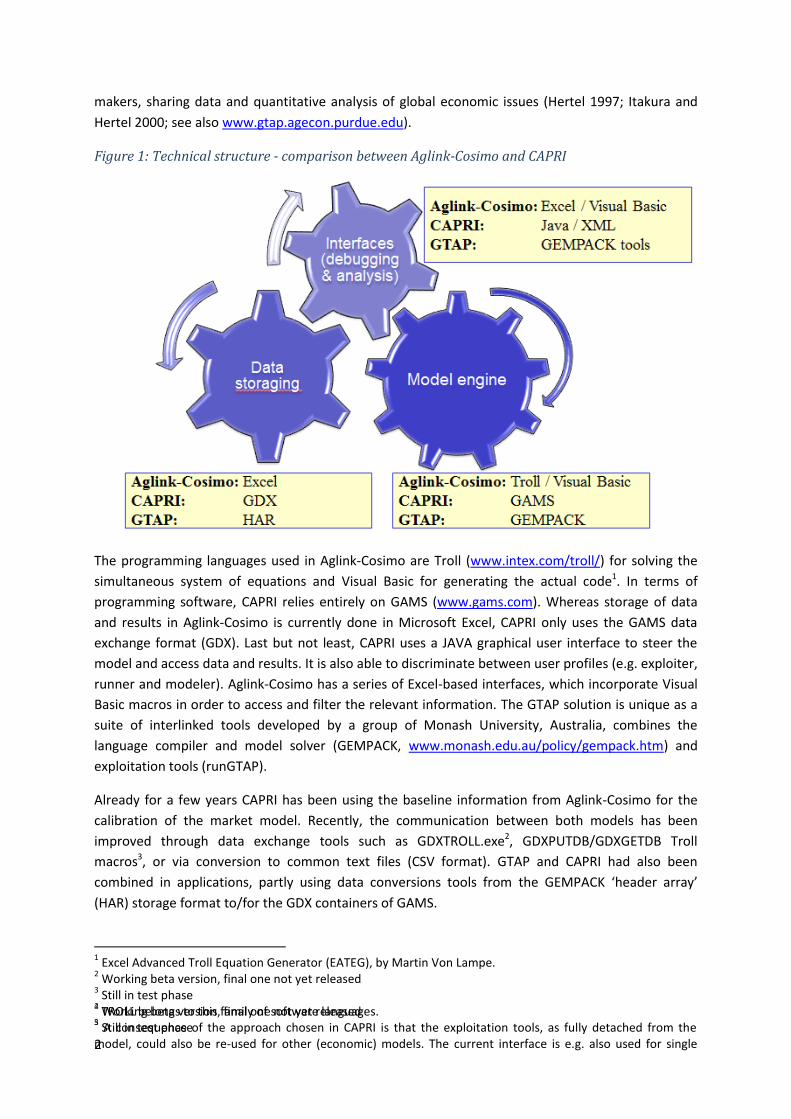
Figure 1: Technical structure - comparison between Aglink-Cosimo and CAPRI
The programming languages used in Aglink-Cosimo are Troll (www.intex.com/troll/) for solving the
simultaneous system of equations and Visual Basic for generating the actual code1. In terms of
programming software, CAPRI relies entirely on GAMS (www.gams.com). Whereas storage of data
and results in Aglink-Cosimo is currently done in Microsoft Excel, CAPRI only uses the GAMS data
exchange format (GDX). Last but not least, CAPRI uses a JAVA graphical user interface to steer the
model and access data and results. It is also able to discriminate between user profiles (e.g. exploiter,
runner and modeler). Aglink-Cosimo has a series of Excel-based interfaces, which incorporate Visual
Basic macros in order to access and filter the relevant information. The GTAP solution is unique as a
suite of interlinked tools developed by a group of Monash University, Australia, combines the
language compiler and model solver (GEMPACK, www.monash.edu.au/policy/gempack.htm) and
exploitation tools (runGTAP).
Already for a few years CAPRI has been using the baseline information from Aglink-Cosimo for the
calibration of the market model. Recently, the communication between both models has been
improved through data exchange tools such as GDXTROLL.exe2, GDXPUTDB/GDXGETDB Troll
macros3, or via conversion to common text files (CSV format). GTAP and CAPRI had also been
combined in applications, partly using data conversions tools from the GEMPACK ‘header array’
(HAR) storage format to/for the GDX containers of GAMS.
1 Excel Advanced Troll Equation Generator (EATEG), by Martin Von Lampe.
2 Working beta version, final one not yet released
3 Still in test phase
4 TROLL belongs to this family of software languages.
5 A consequence of the approach chosen in CAPRI is that the exploitation tools, as fully detached from the
model, could also be re-used for other (economic) models. The current interface is e.g. also used for single
2 Working beta version, final one not yet released
3 Still in test phase
3
2 Graphical User Interfaces: close to the coder or close to the user?
2.1 Modelling package add-ons: runGTAP and the GAMS IDE / GDX Viewer
One clear distinction between the approaches is how close the presentation of the results in tables,
graphs and maps is to the software representation of the model. Packages such as the GEMPACK
graphical interface runGTAP or the GAMS IDE are add-ons to high level modeling languages,
GEMPACK with its focus on General Equilibrium Models being more specialized than GAMS. Given
the rather general nature of these packages, the software itself cannot know the logical structure of
the data it handles. In opposite to statistical packages like EVIEWS or STATA4, even something as the
“observation dimensions” (time, cross-section or panel) are not known.
The exploitation facilities of GAMS or GEMPACK must hence build on the technical structures used in
the language itself and consequently target mostly the code developer. That approach is clearly seen
in runGTAP where a view typically relates to a variable or parameter as it is defined in the code itself.
The logical structuring of the “views” hence follows the technical structures chosen by the coder. The
same can be found in variable/equation listing in the GAMS IDE or the GDX Viewer (www.gams.com).
The tools show typical short labels only which are also used internally for indexing. The use of the
viewer hence requires familiarity with the technical structure of the model as well as the names of
symbols and codes in order to make sense of the presented data structures.
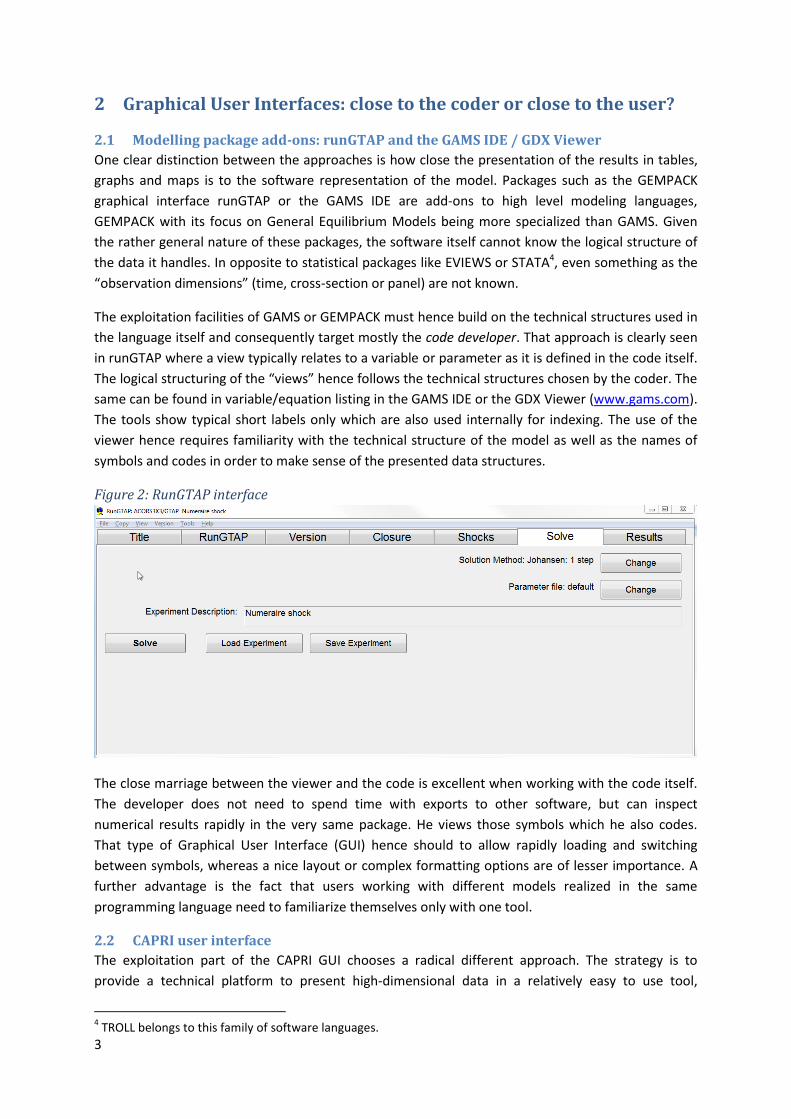
Figure 2: RunGTAP interface
The close marriage between the viewer and the code is excellent when working with the code itself.
The developer does not need to spend time with exports to other software, but can inspect
numerical results rapidly in the very same package. He views those symbols which he also codes.
That type of Graphical User Interface (GUI) hence should to allow rapidly loading and switching
between symbols, whereas a nice layout or complex formatting options are of lesser importance. A
further advantage is the fact that users working with different models realized in the same
programming language need to familiarize themselves only with one tool.
2.2 CAPRI user interface
The exploitation part of the CAPRI GUI chooses a radical different approach. The strategy is to
provide a technical platform to present high-dimensional data in a relatively easy to use tool,
4 TROLL belongs to this family of software languages.
4
detaching the visualized data from the underlying technical data generation process, i.e. the
simulation model(s) and post-model processing. All data are loaded into one multi-dimensional cube
– the relation to the technical structure of the underlying code (variables, equations, parameters) is
thus deliberately broken. Results from different models/modules might be merged. It is hence
thought as a complement to e.g. the GAMS IDE which is far more suitable in the
development/debugging process.
The data cube loaded in the CAPRI exploitation tools might contain several million of non-zero
entries, so that an approach to present the data in digestible bits is needed, replacing the original
coding structure. The new structure is called a view and it combines: (a) filters (i.e. regions,
products/sector, items, years to present to the user), (b) the pivot information (i.e. swapping
possibilities between dimensions in rows, columns and additional dimensions), (c) the presentation
format (i.e. table, graph, map) and (d) further interactive properties (such as on-the-fly meta data,
pre-defined aggregation options and links to other tables of relevance). A good view needs to be
user-oriented. It should combine a small block of data with a logical relation (e.g. a market balance,
different elements of a nutrient balance, a welfare calculation, a dual analysis of a constrained
optimization model, a decomposition of a behavioral function, …) and presents it in an appropriate
way (e.g. as regional table or as a map).
The idea of a view which breaks the relation to the coding structures allows detaching result analysis
from the data generation process (i.e. the simulation model), at least to a certain extent. That idea is
clearly far from new. For instance, tables showing market balances from model results exist since
decades. They combine typically results from different variables in the model such as production and
human consumption, and often combine these with historical data. Under the ‘view = symbol’
paradigm followed in the GTAP interface, combining items from different variables or parameters
within one view requires to code a new symbol (as combination of the mentioned items) which is
then finally shown by the viewer. In opposite to that, reporting tools such as the CAPRI exploitation
tools perform these merge operations ‘on the fly’. Therefore, additional views do not generate new
symbols and require very little additional memory, since only the definition is stored in the reporting
tool (i.e. in CAPRI it is XML-based).
A view is hence in CAPRI closer to the user than to the coder, also supported by replacing short labels
by clearer long-text, by adding units and explanatory tooltips. Indeed, different training session with
CAPRI in the last years have proven that people not familiar neither with the methodological features
of the model nor with the model language (GAMS) can quite successfully analysis complex scenarios
based on this user-oriented approach. A clear disadvantage of this concept is the not immediately
visible link between model symbols (variables, parameters, equations) and the view. When
debugging model code based on the results presented on views, a code developer needs first to
check where a symbol is stored in the multi-dimensional cube and the link to the view.5
The CAPRI exploitation tools are integrated in the CAPRI GUI which offers additionally functionalities
such as starting and tacking model runs, viewing meta-data, updates of data and code via Subversion
5 A consequence of the approach chosen in CAPRI is that the exploitation tools, as fully detached from the
model, could also be re-used for other (economic) models. The current interface is e.g. also used for single country partial equilibrium models, a hydro-economic river basin model and a highly detailed dynamic single farm model. Following these developments, a Generic Graphical Interface is currently being tested for the Aglink model and will be presented to the Aglink Users’ Group in November 2012.
5
software (http://subversion.tigris.org/) or generating a HTML based documentation from GAMS
code. These functionalities are not further discussed in the following, but show some similarities to
runGTAP.
2.3 AGLINK-COSIMO exploitation tools
The OECD-FAO model Aglink-Cosimo has not a centralized interface able to run the different
instances of the model chain, which is done directly from the Troll interface. Moreover, and
compared to the above mentioned examples, Aglink-Cosimo presents a dual approach in terms of
exploitation tools of data and results. On the one side, it has different graphical interfaces designed
to help the model developer. It is important to note that the main use of Aglink-Cosimo is to produce
a medium-term (i.e. +10 years) baseline on commodity markets, what first requires the compilation
of expert information in the form of questionnaires6 for the Aglink part, second the construction of
single country models with the data received and third the merge with the Cosimo model, which
includes a disaggregation of the rest of the world. As AGLINK-COSIMO is a recursive-dynamic model,
the most natural way to look at data are time series, either in tabular format or graphs. But maps can
be produced with AGLINK-COSIMO GUI as well. On the other side, it provides to official users a ready-
to-use exploitation tool to access information through the Aglink-Cosimo collaboration site
(www.agri-outlook.org). There are currently two GUIs in use:
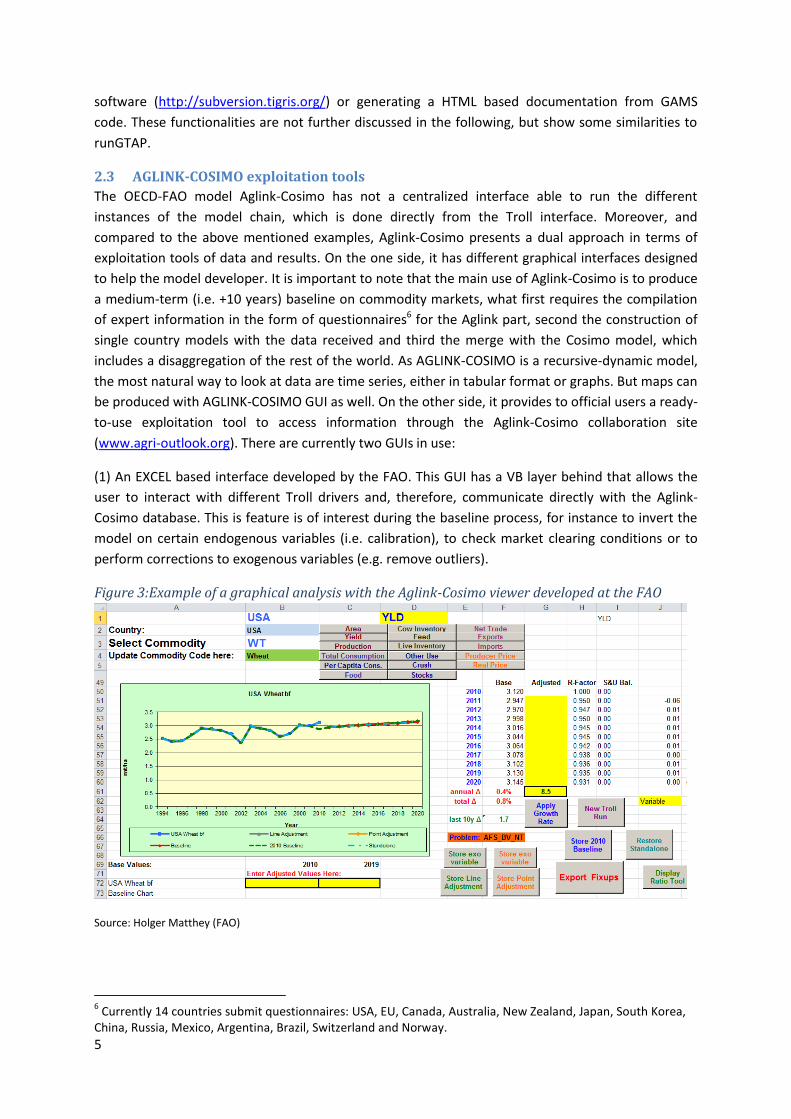
(1) An EXCEL based interface developed by the FAO. This GUI has a VB layer behind that allows the
user to interact with different Troll drivers and, therefore, communicate directly with the Aglink-
Cosimo database. This is feature is of interest during the baseline process, for instance to invert the
model on certain endogenous variables (i.e. calibration), to check market clearing conditions or to
perform corrections to exogenous variables (e.g. remove outliers).
Figure 3:Example of a graphical analysis with the Aglink-Cosimo viewer developed at the FAO
Source: Holger Matthey (FAO)
6 Currently 14 countries submit questionnaires: USA, EU, Canada, Australia, New Zealand, Japan, South Korea,
China, Russia, Mexico, Argentina, Brazil, Switzerland and Norway.
6
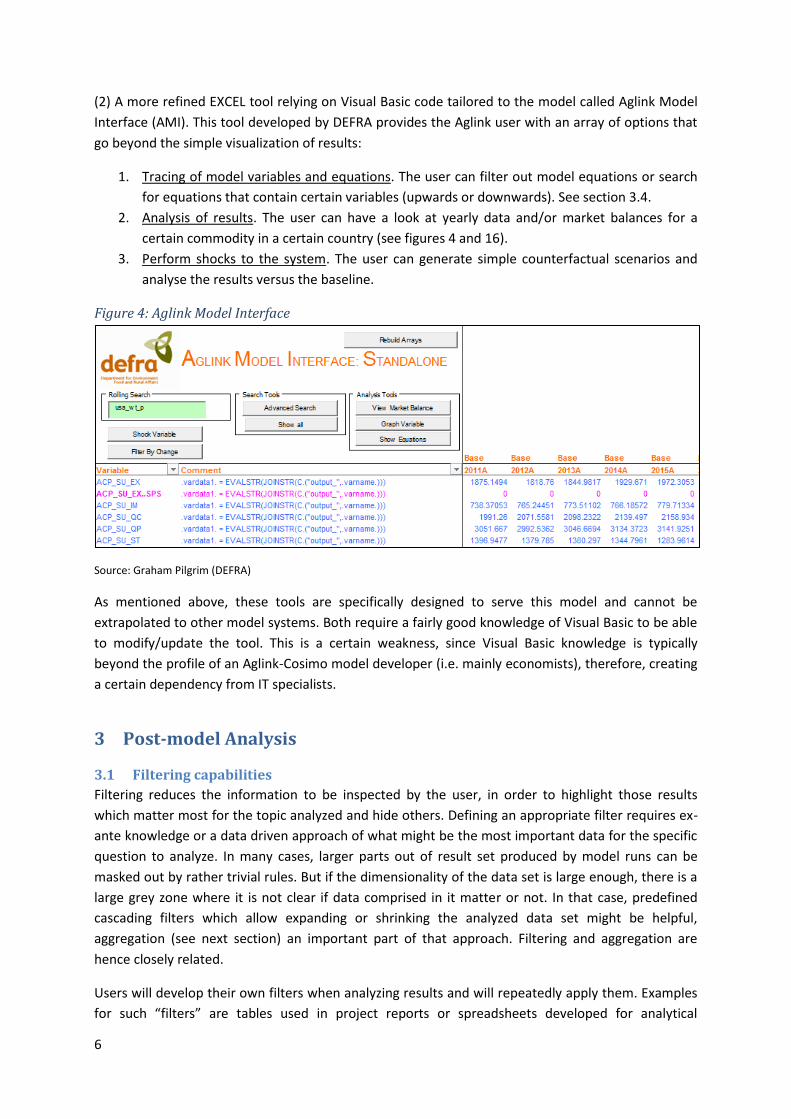
(2) A more refined EXCEL tool relying on Visual Basic code tailored to the model called Aglink Model
Interface (AMI). This tool developed by DEFRA provides the Aglink user with an array of options that
go beyond the simple visualization of results:
1. Tracing of model variables and equations. The user can filter out model equations or search
for equations that contain certain variables (upwards or downwards). See section 3.4.
2. Analysis of results. The user can have a look at yearly data and/or market balances for a
certain commodity in a certain country (see figures 4 and 16).
3. Perform shocks to the system. The user can generate simple counterfactual scenarios and
analyse the results versus the baseline.
Figure 4: Aglink Model Interface
Source: Graham Pilgrim (DEFRA)
As mentioned above, these tools are specifically designed to serve this model and cannot be
extrapolated to other model systems. Both require a fairly good knowledge of Visual Basic to be able
to modify/update the tool. This is a certain weakness, since Visual Basic knowledge is typically
beyond the profile of an Aglink-Cosimo model developer (i.e. mainly economists), therefore, creating
a certain dependency from IT specialists.
3 Post-model Analysis
3.1 Filtering capabilities
Filtering reduces the information to be inspected by the user, in order to highlight those results
which matter most for the topic analyzed and hide others. Defining an appropriate filter requires ex-
ante knowledge or a data driven approach of what might be the most important data for the specific
question to analyze. In many cases, larger parts out of result set produced by model runs can be
masked out by rather trivial rules. But if the dimensionality of the data set is large enough, there is a
large grey zone where it is not clear if data comprised in it matter or not. In that case, predefined
cascading filters which allow expanding or shrinking the analyzed data set might be helpful,
aggregation (see next section) an important part of that approach. Filtering and aggregation are
hence closely related.
Users will develop their own filters when analyzing results and will repeatedly apply them. Examples
for such “filters” are tables used in project reports or spreadsheets developed for analytical
7
purposes. In many cases, such reports comprise algebraic transformations of the original data, such
as calculation of shares or of absolute or relative differences. These user developed filters represent
structural knowledge applied successfully in result analysis. Learning from them and “storing” them
for later re-use can guide others users in result analysis, safe time, prevent information overload and
avoid searching for or seeing spurious relations not embedded in the equation structure of a tool. A
tactic in CAPRI and certainly other tools consists in the development of code which reproduces such
filters. That task is eased with an appropriate software implementation.
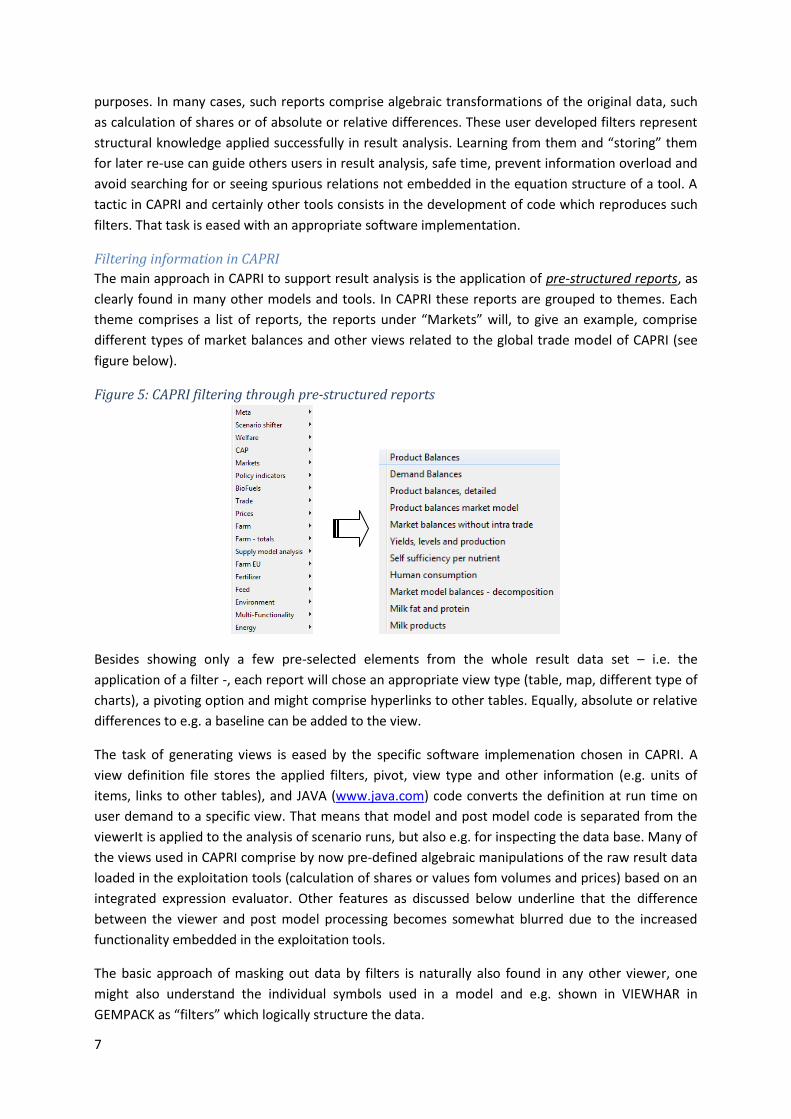
Filtering information in CAPRI
The main approach in CAPRI to support result analysis is the application of pre-structured reports, as
clearly found in many other models and tools. In CAPRI these reports are grouped to themes. Each
theme comprises a list of reports, the reports under “Markets” will, to give an example, comprise
different types of market balances and other views related to the global trade model of CAPRI (see
figure below).
Figure 5: CAPRI filtering through pre-structured reports
Besides showing only a few pre-selected elements from the whole result data set – i.e. the
application of a filter -, each report will chose an appropriate view type (table, map, different type of
charts), a pivoting option and might comprise hyperlinks to other tables. Equally, absolute or relative
differences to e.g. a baseline can be added to the view.
The task of generating views is eased by the specific software implemenation chosen in CAPRI. A
view definition file stores the applied filters, pivot, view type and other information (e.g. units of
items, links to other tables), and JAVA (www.java.com) code converts the definition at run time on
user demand to a specific view. That means that model and post model code is separated from the
viewerIt is applied to the analysis of scenario runs, but also e.g. for inspecting the data base. Many of
the views used in CAPRI comprise by now pre-defined algebraic manipulations of the raw result data
loaded in the exploitation tools (calculation of shares or values fom volumes and prices) based on an
integrated expression evaluator. Other features as discussed below underline that the difference
between the viewer and post model processing becomes somewhat blurred due to the increased
functionality embedded in the exploitation tools.
The basic approach of masking out data by filters is naturally also found in any other viewer, one
might also understand the individual symbols used in a model and e.g. shown in VIEWHAR in
GEMPACK as “filters” which logically structure the data.
8
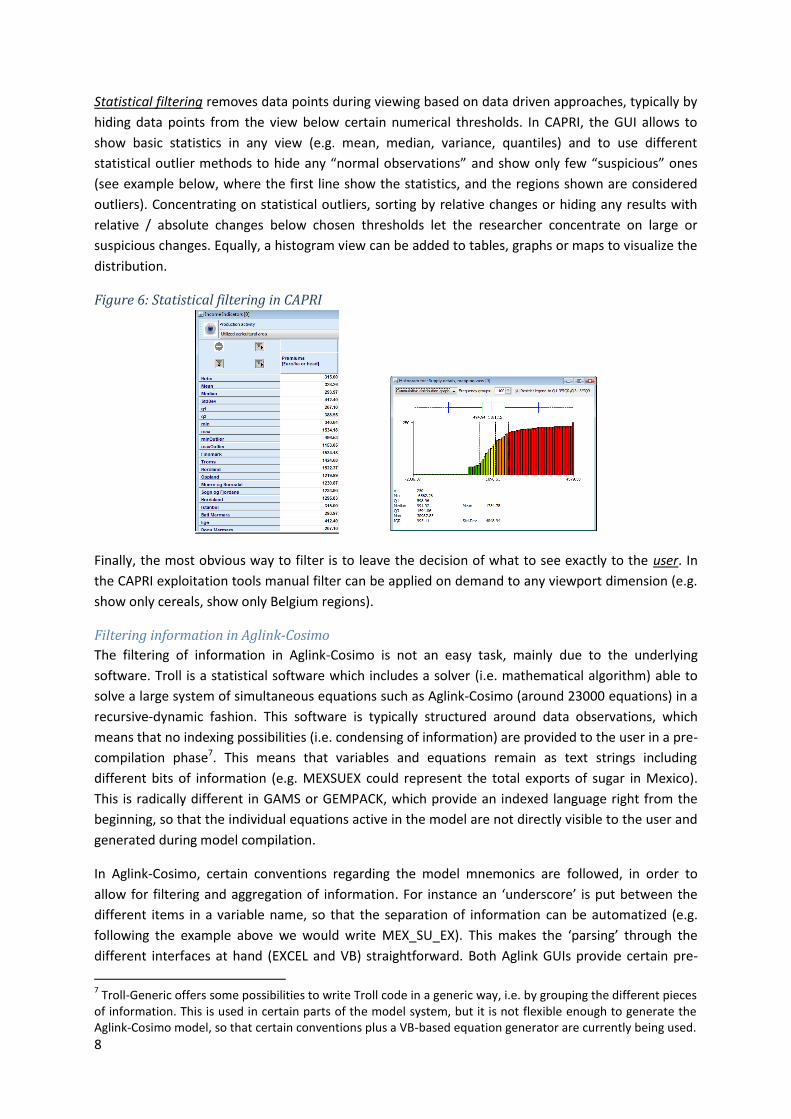
Statistical filtering removes data points during viewing based on data driven approaches, typically by
hiding data points from the view below certain numerical thresholds. In CAPRI, the GUI allows to
show basic statistics in any view (e.g. mean, median, variance, quantiles) and to use different
statistical outlier methods to hide any “normal observations” and show only few “suspicious” ones
(see example below, where the first line show the statistics, and the regions shown are considered
outliers). Concentrating on statistical outliers, sorting by relative changes or hiding any results with
relative / absolute changes below chosen thresholds let the researcher concentrate on large or
suspicious changes. Equally, a histogram view can be added to tables, graphs or maps to visualize the
distribution.
Figure 6: Statistical filtering in CAPRI
Finally, the most obvious way to filter is to leave the decision of what to see exactly to the user. In
the CAPRI exploitation tools manual filter can be applied on demand to any viewport dimension (e.g.
show only cereals, show only Belgium regions).
Filtering information in Aglink-Cosimo
The filtering of information in Aglink-Cosimo is not an easy task, mainly due to the underlying
software. Troll is a statistical software which includes a solver (i.e. mathematical algorithm) able to
solve a large system of simultaneous equations such as Aglink-Cosimo (around 23000 equations) in a
recursive-dynamic fashion. This software is typically structured around data observations, which
means that no indexing possibilities (i.e. condensing of information) are provided to the user in a pre-
compilation phase7. This means that variables and equations remain as text strings including
different bits of information (e.g. MEXSUEX could represent the total exports of sugar in Mexico).
This is radically different in GAMS or GEMPACK, which provide an indexed language right from the
beginning, so that the individual equations active in the model are not directly visible to the user and
generated during model compilation.
In Aglink-Cosimo, certain conventions regarding the model mnemonics are followed, in order to
allow for filtering and aggregation of information. For instance an ‘underscore’ is put between the
different items in a variable name, so that the separation of information can be automatized (e.g.
following the example above we would write MEX_SU_EX). This makes the ‘parsing’ through the
different interfaces at hand (EXCEL and VB) straightforward. Both Aglink GUIs provide certain pre-
7 Troll-Generic offers some possibilities to write Troll code in a generic way, i.e. by grouping the different pieces
of information. This is used in certain parts of the model system, but it is not flexible enough to generate the Aglink-Cosimo model, so that certain conventions plus a VB-based equation generator are currently being used.
9
structured tables, mainly market balances and trade information per country and product. Currently,
these viewers are only able to deal with 3 dimensions (region, product, item), remaining additional
information such as bilateral trade policy restrictions stored within the third dimension (e.g.
MEX_SU_EX..USA for the sugar exports of Mexico into the US) and not available for pivoting.
3.2 Condensing information
Aggregating information in CAPRI
Aggregation is the simplest way to condense information. In CAPRI, the aggregation approach is
rather systematically integrated for almost all results
over the regional scales in the model (farm type => sub-national region => nation => global
region => globe)
over single outputs / inputs / activities (market balance results, prices etc.) to groups of
products / activities such as cereals.
over items, e.g. aggregation different border protection measures to ad-valorem equivalents
or demand components (feed, processing, final ..) to total demand.
The aggregation rules are typically implemented in GAMS code to apply appropriate weights. The set
driven concept of GAMS allows coding the rules rather independently from the actual list of
components and aggregates. It should however be noted that CAPRI is not built for flexible
aggregation as supported in most CGE analysis, but works with a fixed regional / commodity list
which is only changed in the context of major model releases.
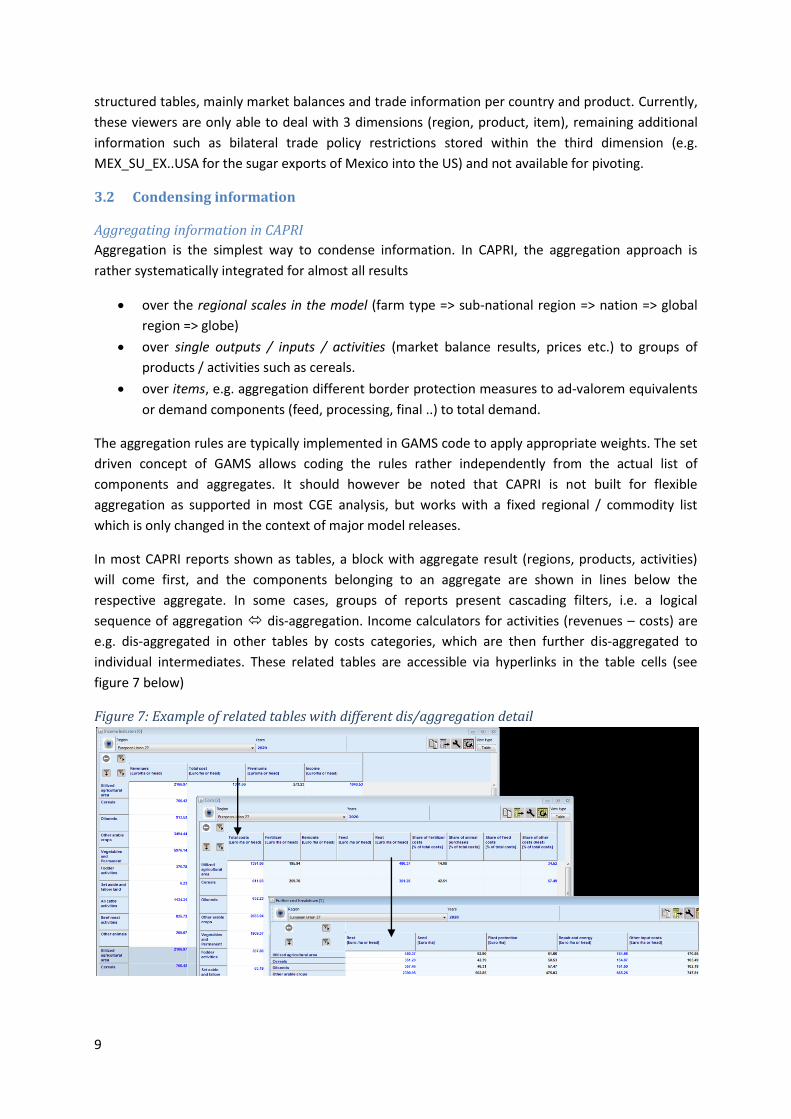
In most CAPRI reports shown as tables, a block with aggregate result (regions, products, activities)
will come first, and the components belonging to an aggregate are shown in lines below the
respective aggregate. In some cases, groups of reports present cascading filters, i.e. a logical
sequence of aggregation dis-aggregation. Income calculators for activities (revenues – costs) are
e.g. dis-aggregated in other tables by costs categories, which are then further dis-aggregated to
individual intermediates. These related tables are accessible via hyperlinks in the table cells (see
figure 7 below)
Figure 7: Example of related tables with different dis/aggregation detail
10
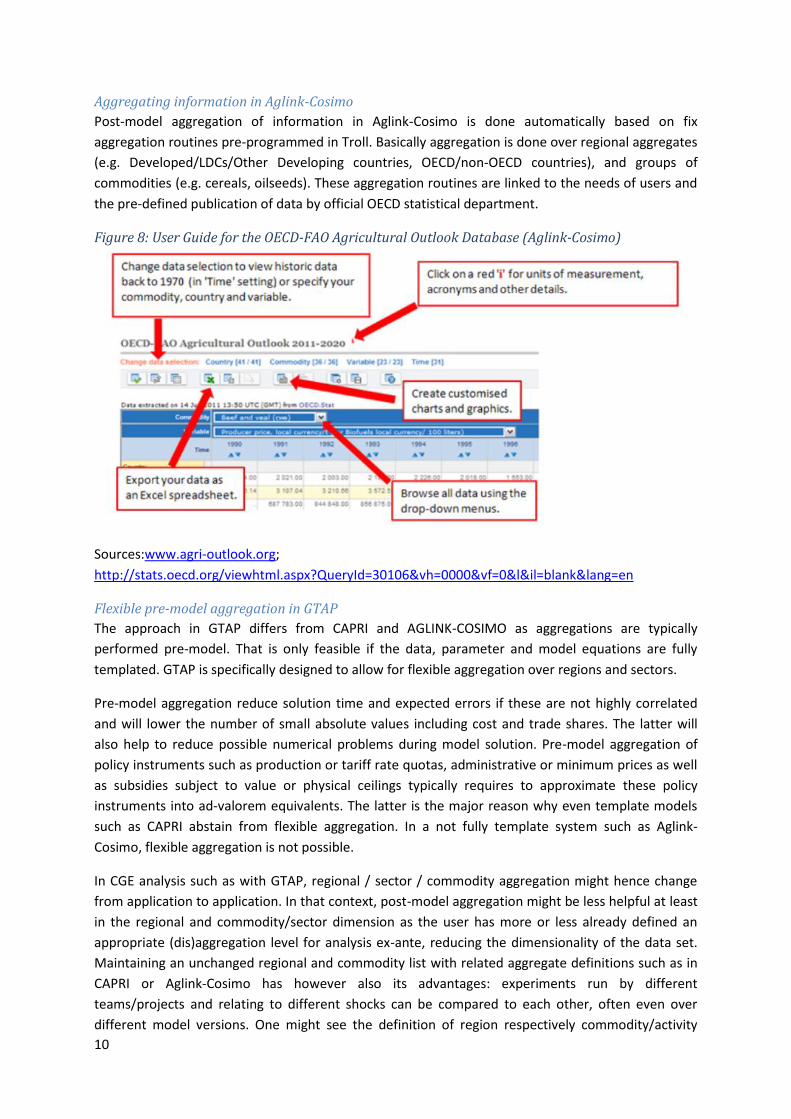
Aggregating information in Aglink-Cosimo
Post-model aggregation of information in Aglink-Cosimo is done automatically based on fix
aggregation routines pre-programmed in Troll. Basically aggregation is done over regional aggregates
(e.g. Developed/LDCs/Other Developing countries, OECD/non-OECD countries), and groups of
commodities (e.g. cereals, oilseeds). These aggregation routines are linked to the needs of users and
the pre-defined publication of data by official OECD statistical department.
Figure 8: User Guide for the OECD-FAO Agricultural Outlook Database (Aglink-Cosimo)
Sources:www.agri-outlook.org;
http://stats.oecd.org/viewhtml.aspx?QueryId=30106&vh=0000&vf=0&l&il=blank&lang=en
Flexible pre-model aggregation in GTAP
The approach in GTAP differs from CAPRI and AGLINK-COSIMO as aggregations are typically
performed pre-model. That is only feasible if the data, parameter and model equations are fully
templated. GTAP is specifically designed to allow for flexible aggregation over regions and sectors.
Pre-model aggregation reduce solution time and expected errors if these are not highly correlated
and will lower the number of small absolute values including cost and trade shares. The latter will
also help to reduce possible numerical problems during model solution. Pre-model aggregation of
policy instruments such as production or tariff rate quotas, administrative or minimum prices as well
as subsidies subject to value or physical ceilings typically requires to approximate these policy
instruments into ad-valorem equivalents. The latter is the major reason why even template models
such as CAPRI abstain from flexible aggregation. In a not fully template system such as Aglink-
Cosimo, flexible aggregation is not possible.
In CGE analysis such as with GTAP, regional / sector / commodity aggregation might hence change
from application to application. In that context, post-model aggregation might be less helpful at least
in the regional and commodity/sector dimension as the user has more or less already defined an
appropriate (dis)aggregation level for analysis ex-ante, reducing the dimensionality of the data set.
Maintaining an unchanged regional and commodity list with related aggregate definitions such as in
CAPRI or Aglink-Cosimo has however also its advantages: experiments run by different
teams/projects and relating to different shocks can be compared to each other, often even over
different model versions. One might see the definition of region respectively commodity/activity
11
aggregates as part of post-model processing e.g. in CAPRI and Aglink-Cosimo as an alternative to
flexible aggregation. To give an example: the regional aggregation in the CAPRI trade model
comprises two aggregation layers: one by geographic aggregates (Africa, South America etc.) and one
from a trade policy perspective (LDCs, developed countries etc.). Flexible aggregation will also
introduce new mnemonics for each new aggregation. And finally, the results obtained will depend on
the chosen aggregation.
3.3 Normalization of results
Another often found approach to remove information in order to condense results is to normalize
results, e.g. to calculate shares or to derive relative or absolute changes against a comparison point.
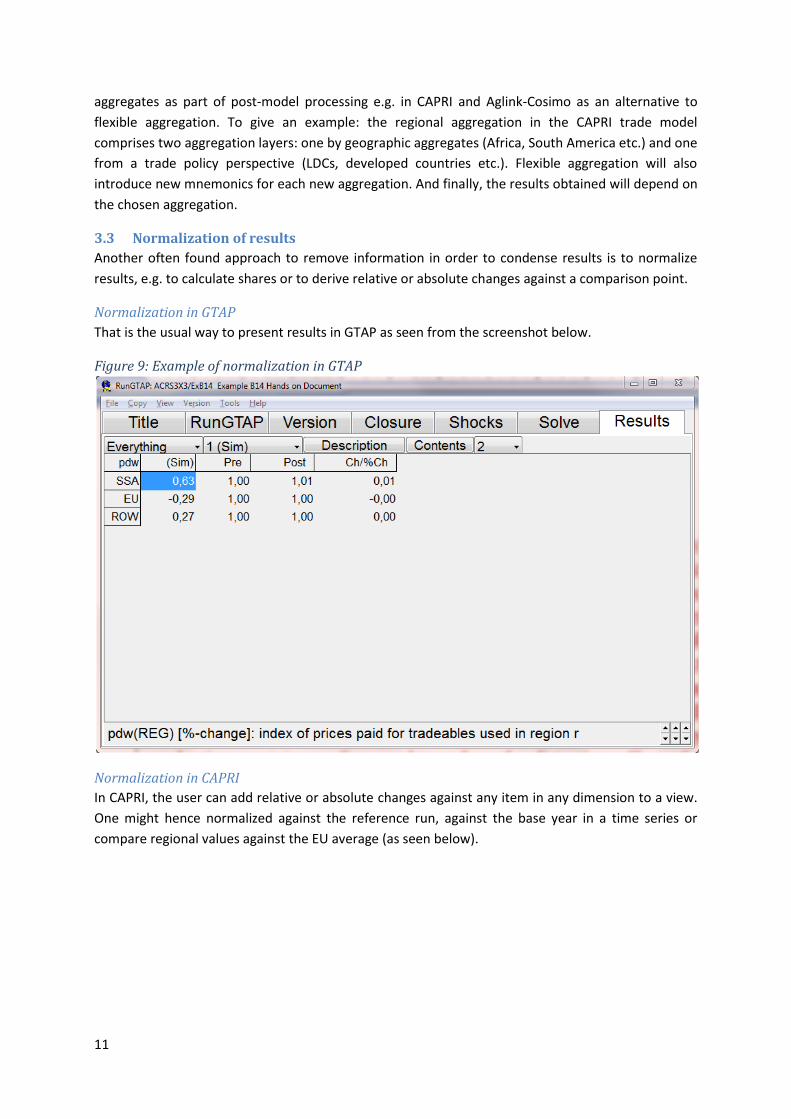
Normalization in GTAP
That is the usual way to present results in GTAP as seen from the screenshot below.
Figure 9: Example of normalization in GTAP
Normalization in CAPRI
In CAPRI, the user can add relative or absolute changes against any item in any dimension to a view.
One might hence normalized against the reference run, against the base year in a time series or
compare regional values against the EU average (as seen below).
12
Figure 10: Example of normalization in CAPRI
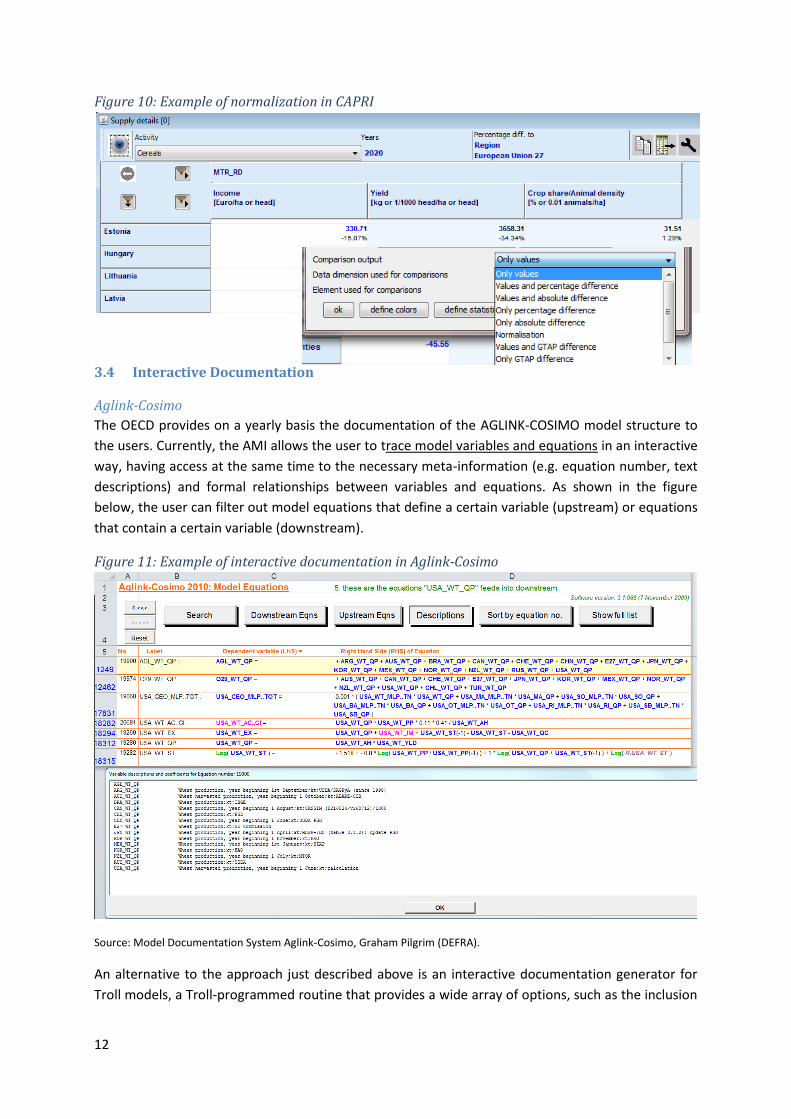
3.4 Interactive Documentation
Aglink-Cosimo
The OECD provides on a yearly basis the documentation of the AGLINK-COSIMO model structure to
the users. Currently, the AMI allows the user to trace model variables and equations in an interactive
way, having access at the same time to the necessary meta-information (e.g. equation number, text
descriptions) and formal relationships between variables and equations. As shown in the figure
below, the user can filter out model equations that define a certain variable (upstream) or equations
that contain a certain variable (downstream).
Figure 11: Example of interactive documentation in Aglink-Cosimo
Source: Model Documentation System Aglink-Cosimo, Graham Pilgrim (DEFRA).
An alternative to the approach just described above is an interactive documentation generator for
Troll models, a Troll-programmed routine that provides a wide array of options, such as the inclusion
13
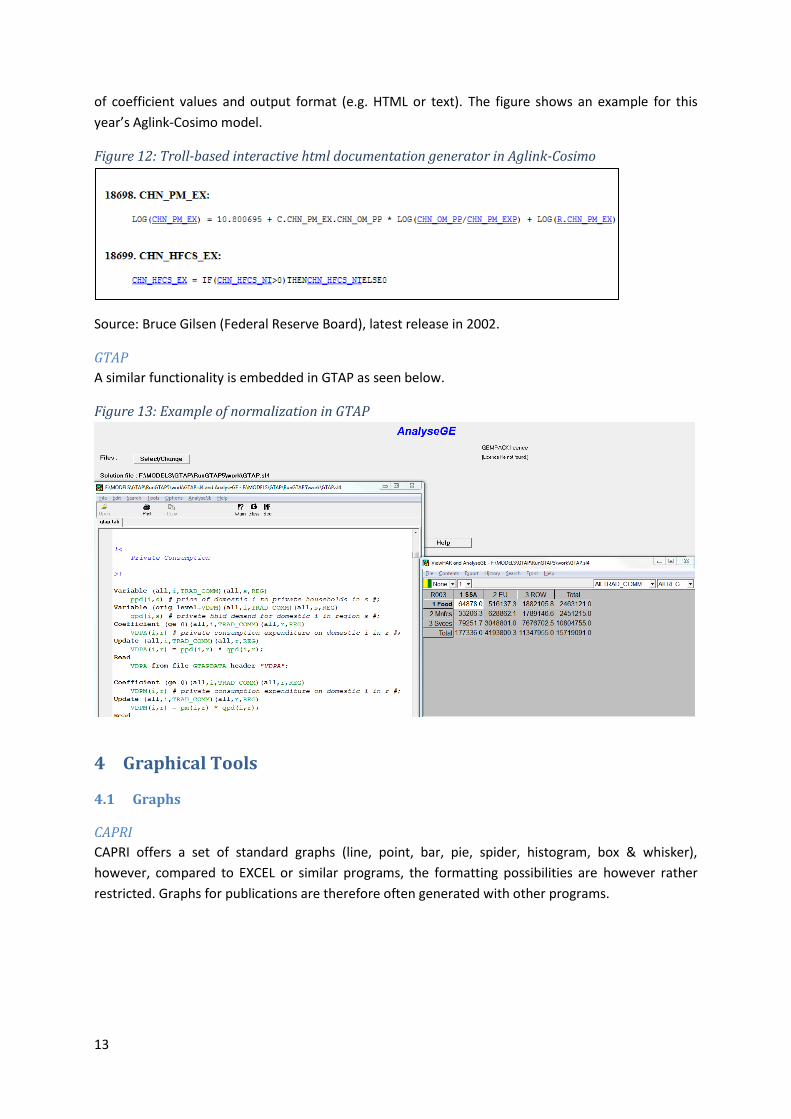
of coefficient values and output format (e.g. HTML or text). The figure shows an example for this
year’s Aglink-Cosimo model.
Figure 12: Troll-based interactive html documentation generator in Aglink-Cosimo
Source: Bruce Gilsen (Federal Reserve Board), latest release in 2002.
GTAP
A similar functionality is embedded in GTAP as seen below.
Figure 13: Example of normalization in GTAP
4 Graphical Tools
4.1 Graphs
CAPRI
CAPRI offers a set of standard graphs (line, point, bar, pie, spider, histogram, box & whisker),
however, compared to EXCEL or similar programs, the formatting possibilities are however rather
restricted. Graphs for publications are therefore often generated with other programs.
14
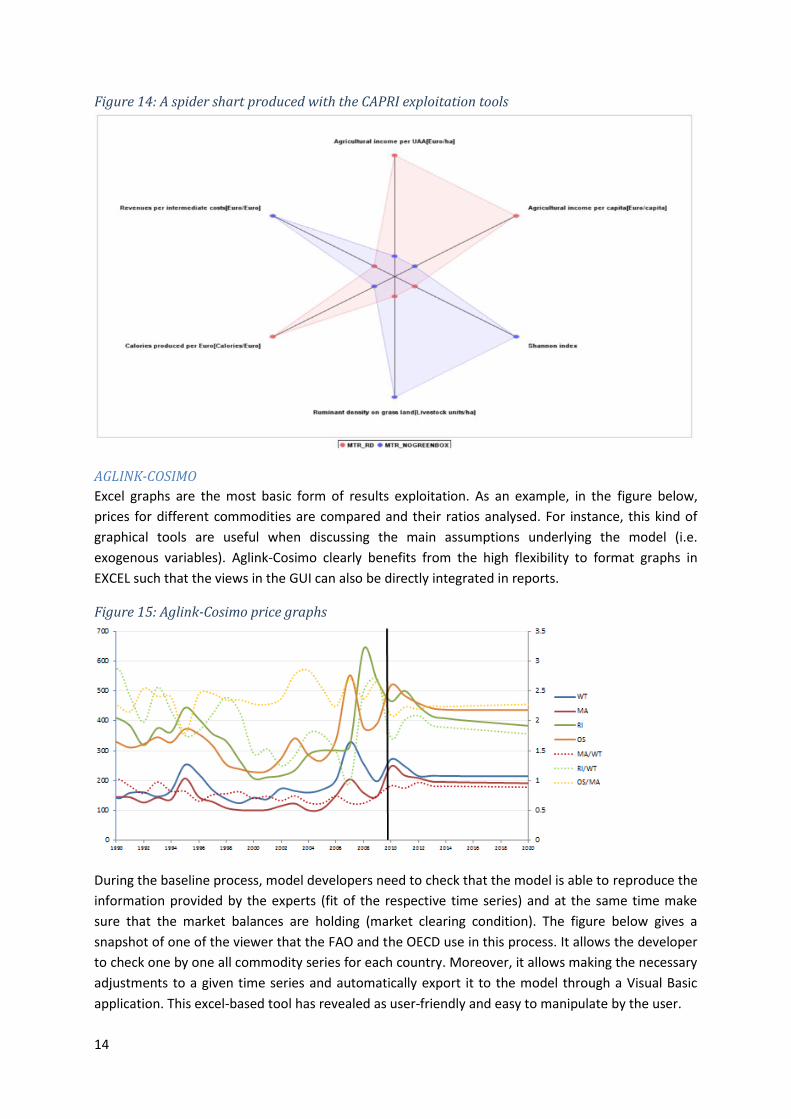
Figure 14: A spider shart produced with the CAPRI exploitation tools
AGLINK-COSIMO
Excel graphs are the most basic form of results exploitation. As an example, in the figure below,
prices for different commodities are compared and their ratios analysed. For instance, this kind of
graphical tools are useful when discussing the main assumptions underlying the model (i.e.
exogenous variables). Aglink-Cosimo clearly benefits from the high flexibility to format graphs in
EXCEL such that the views in the GUI can also be directly integrated in reports.
Figure 15: Aglink-Cosimo price graphs
During the baseline process, model developers need to check that the model is able to reproduce the
information provided by the experts (fit of the respective time series) and at the same time make
sure that the market balances are holding (market clearing condition). The figure below gives a
snapshot of one of the viewer that the FAO and the OECD use in this process. It allows the developer
to check one by one all commodity series for each country. Moreover, it allows making the necessary
adjustments to a given time series and automatically export it to the model through a Visual Basic
application. This excel-based tool has revealed as user-friendly and easy to manipulate by the user.
15
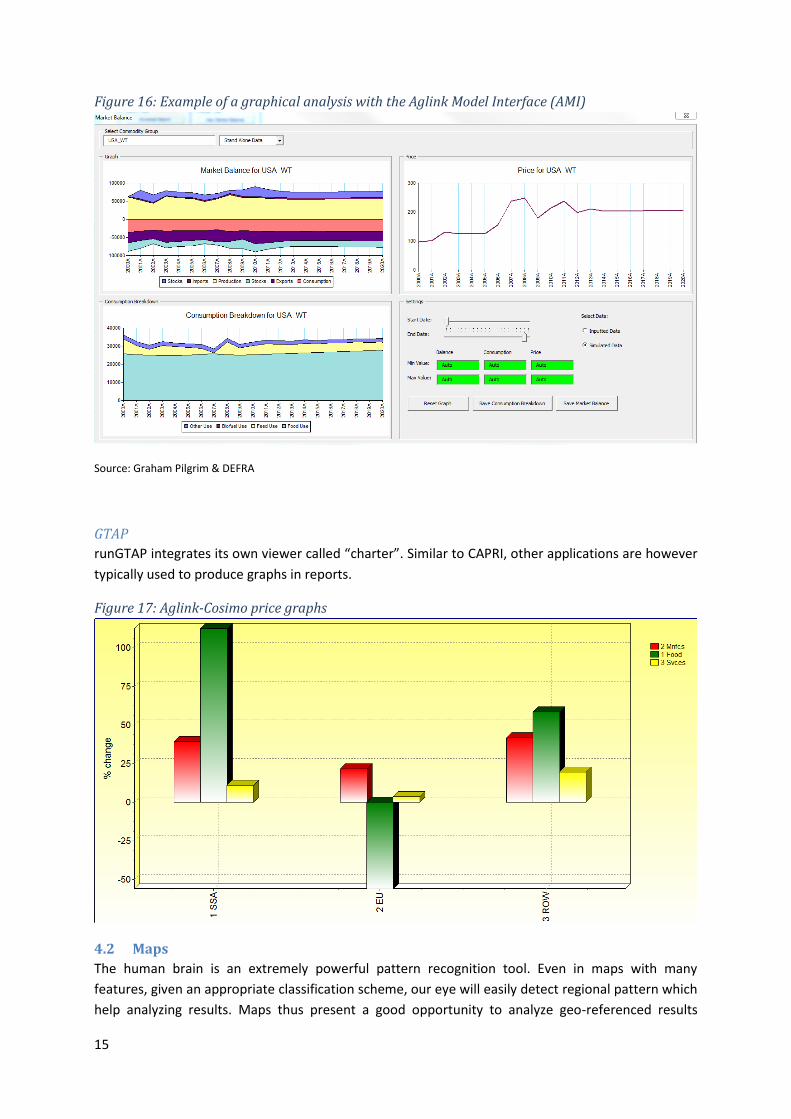
Figure 16: Example of a graphical analysis with the Aglink Model Interface (AMI)
Source: Graham Pilgrim & DEFRA
GTAP
runGTAP integrates its own viewer called “charter”. Similar to CAPRI, other applications are however
typically used to produce graphs in reports.
Figure 17: Aglink-Cosimo price graphs
4.2 Maps
The human brain is an extremely powerful pattern recognition tool. Even in maps with many
features, given an appropriate classification scheme, our eye will easily detect regional pattern which
help analyzing results. Maps thus present a good opportunity to analyze geo-referenced results
16
which are difficult to condense in a table. Certainly, the color scheme and the clustering of data is an
important issue to address when dealing with maps.
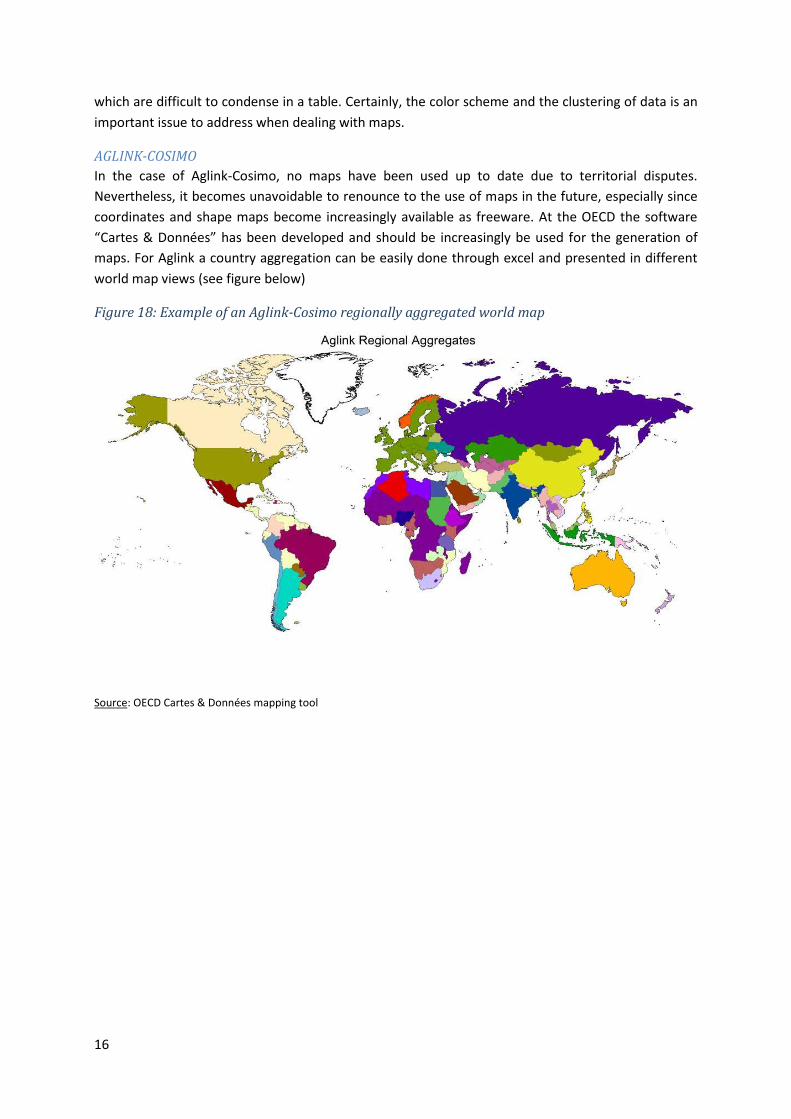
AGLINK-COSIMO
In the case of Aglink-Cosimo, no maps have been used up to date due to territorial disputes.
Nevertheless, it becomes unavoidable to renounce to the use of maps in the future, especially since
coordinates and shape maps become increasingly available as freeware. At the OECD the software
“Cartes & Données” has been developed and should be increasingly be used for the generation of
maps. For Aglink a country aggregation can be easily done through excel and presented in different
world map views (see figure below)
Figure 18: Example of an Aglink-Cosimo regionally aggregated world map
Source: OECD Cartes & Données mapping tool
17
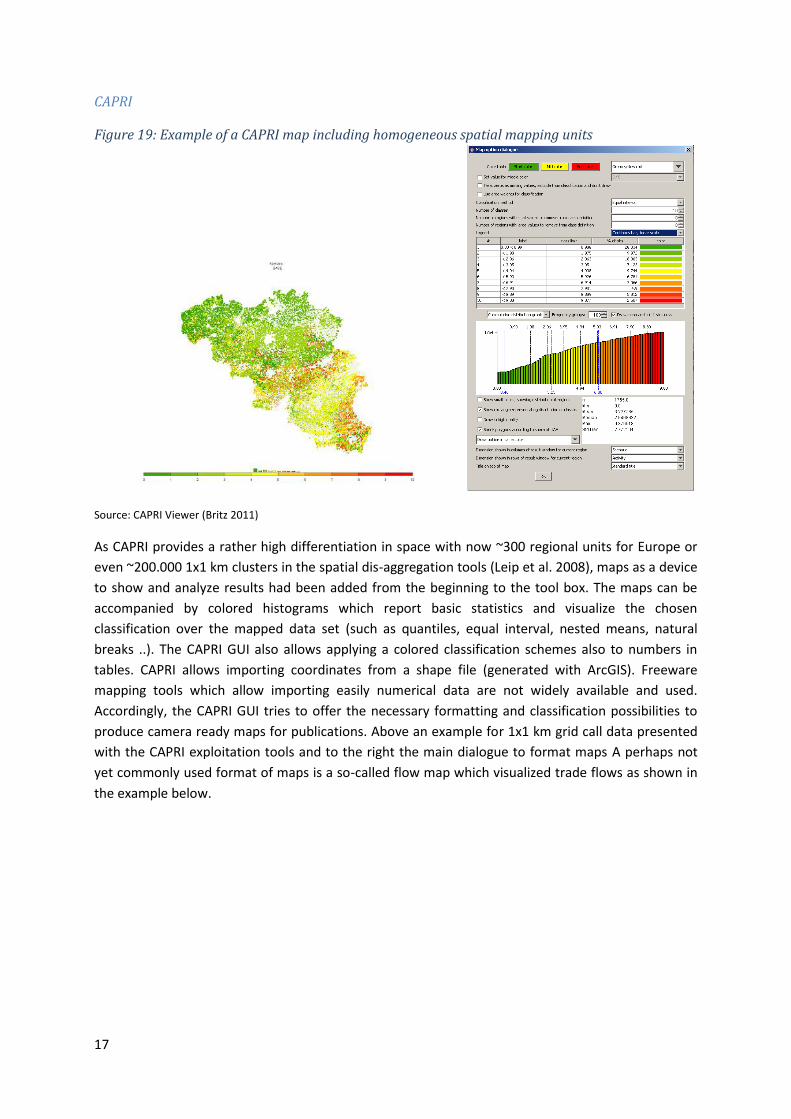
CAPRI
Figure 19: Example of a CAPRI map including homogeneous spatial mapping units
Source: CAPRI Viewer (Britz 2011)
As CAPRI provides a rather high differentiation in space with now ~300 regional units for Europe or
even ~200.000 1x1 km clusters in the spatial dis-aggregation tools (Leip et al. 2008), maps as a device
to show and analyze results had been added from the beginning to the tool box. The maps can be
accompanied by colored histograms which report basic statistics and visualize the chosen
classification over the mapped data set (such as quantiles, equal interval, nested means, natural
breaks ..). The CAPRI GUI also allows applying a colored classification schemes also to numbers in
tables. CAPRI allows importing coordinates from a shape file (generated with ArcGIS). Freeware
mapping tools which allow importing easily numerical data are not widely available and used.
Accordingly, the CAPRI GUI tries to offer the necessary formatting and classification possibilities to
produce camera ready maps for publications. Above an example for 1x1 km grid call data presented
with the CAPRI exploitation tools and to the right the main dialogue to format maps A perhaps not
yet commonly used format of maps is a so-called flow map which visualized trade flows as shown in
the example below.

18
Figure 20: Example of a CAPRI flow map
GTAP
Similar to AGLINK-COSIMO and CAPRI, also the GUI of GTAP allows generating maps.
Figure 21: Example of a ShadeMap for GTAP
Source: http://www.monash.edu.au/policy/shademap.htm
5 Summary and conclusions The comparison between the GUIs of GTAP, CAPRI and Aglink-Cosimo, provides examples for three
rather different basic approaches. GTAP builds on GEMPACK tools which are linked to a specific
modeling software package. The data viewer, with its tools, has more the character of an Integrated
Development Environment, and is strictly linked to the technical presentation of symbols in the
model. CAPRI has opted to develop exploitation tools which are much closer to reporting tools linked
to a Data Base Management System. The CAPRI exploitation tools are technically and formally
detached from the data generation process, i.e. the economic model and its post-processing steps,
and thus can be used with different data sets and have been started to be used with different types
19
of economic models. Aglink-Cosimo finally shows exploitation tools formally separated from the
underlying software but specifically developed to serve this model.
All tools offer the basic visualization possibilities (tables, graphs, maps), however with quite some
differences in detail. Aglink-Cosimo with uses EXCEL as a carrier for tables and graphs benefits from
the excellent formatting options such that graphs and tables can be designed camera ready in the
GUI. Its views are also integrated in certain work steps of the model such as baseline generation with
which they can easily interact. Similar to GEMPACK, the most powerful of the Aglink-Cosimo GUIs
discussed above allows showing the equation which defines a certain variable currently viewed.
The CAPRI exploitation tools put a focus on content guided access to results by grouped thematic
views, on interactive navigation, e.g. by hyperlinks between logically connected tables, on adding
meta data (unit, long text and explanatory tooltips) and have integrated data driven approaches
(basic statistics, outlier detection methods and recently a Machine Learning package, see Britz 2012).
They seem also feature the most versatile mapping possibilities. However, a link to the underlying
technical structures (equations, variables) is not integrated.
The current overview paper does not allow and does not aim to draw conclusions for the individual
viewers, but it is obvious that detailed comparisons might trigger ideas for improvements of the
individual viewers. An interesting question to the modeling community might be following: it is
possible to combine the best of the different worlds into one shared tool? Such an approach would
avoid duplicate costly coding and maintenance as well as decrease learning costs for researchers
switching models, similar as for GAMS and GEMPACK for the coding and running of models. It might
also reduce obvious risks related to the fact that most model (family) related exploitation tools are
only programmed by one or best a handful of people, despite the importance of these tools in model
development and application. An intermediate solution, similar to what is found for Aglink-Cosimo,
would consist in developing generic interfaces to the existing viewers, so that different exploitation
tools could be linked to the same model. That would give model users more freedom and flexibility.
20
6 References Britz W. (2011). The Graphical User Interface for CAPRI version 2011, Institute for Food and Resource
Economics, University Bonn (http://www.capri-model.org/docs/Gui2011.pdf).
Britz W. (2012): “Machine Learning as a data driven tool in result analysis", paper prepared for the 15th Annual
Conference on Global Economic Analysis, June 27-29, 2012, Geneva, Switzerland. GTAP resource # 3807
(https://www.gtap.agecon.purdue.edu/resources/res_display.asp?RecordID=3807).
Britz W. and Witzke P. (2011) CAPRI model documentation 2011 (http://www.capri-
model.org/docs/capri_documentation_2011.pdfLeip, A., Marchi, G., Koeble, R., Kempen, Britz W. and Li,
C.(2008): Linking an economic model for European agriculture with a mechanistic model to estimate nitrogen
losses from cropland soil in Europe. Biogeosciences, 5(1): 73-94, 2008
Hertel T.W. (ed.) (1997) Global Trade Analysis: Modeling and Applications, Cambridge University Press
Itakura K. and Hertel T.W. (2000) A Note On Changes Since GTAP Book Model (Version 2.2a / GTAP94), URL:
https://www.gtap.agecon.purdue.edu/resources/res_display.asp?RecordID=721
OECD (2007) Documentation of the Aglink-Cosimo Model, OECD, Paris, URL:
http://www.oecd.org/officialdocuments/publicdisplaydocumentpdf/?cote=AGR/CA/APM(2006)16/FINAL&docL
anguage=En