
Surface treatment of concrete test specimens subjected to ...

ORNL/TM-2016/551 M2LW-16OR0402022
Post-deformation examination of specimens subjected to SCC testing
Maxim N. Gussev Kevin G. Field Jeremy T. Busby Keith J. Leonard September 2016
Approved for public release. Distribution unlimited.

DOCUMENT AVAILABILITY
Reports produced after January 1, 1996, are generally available free via US Department of Energy (DOE) SciTech Connect. Website http://www.osti.gov/scitech/
Reports produced before January 1, 1996, may be purchased by members of the public from the following source: National Technical Information Service 5285 Port Royal Road Springfield, VA 22161 Telephone 703-605-6000 (1-800-553-6847) TDD 703-487-4639 Fax 703-605-6900 E-mail [email protected] Website http://www.ntis.gov/help/ordermethods.aspx
Reports are available to DOE employees, DOE contractors, Energy Technology Data Exchange representatives, and International Nuclear Information System representatives from the following source: Office of Scientific and Technical Information PO Box 62 Oak Ridge, TN 37831 Telephone 865-576-8401 Fax 865-576-5728 E-mail [email protected] Website http://www.osti.gov/contact.html
This report was prepared as an account of work sponsored by an agency of the United States Government. Neither the United States Government nor any agency thereof, nor any of their employees, makes any warranty, express or implied, or assumes any legal liability or responsibility for the accuracy, completeness, or usefulness of any information, apparatus, product, or process disclosed, or represents that its use would not infringe privately owned rights. Reference herein to any specific commercial product, process, or service by trade name, trademark, manufacturer, or otherwise, does not necessarily constitute or imply its endorsement, recommendation, or favoring by the United States Government or any agency thereof. The views and opinions of authors expressed herein do not necessarily state or reflect those of the United States Government or any agency thereof.

ORNL/TM-2016/551
M2LW-16OR0402022
Fusion and Materials for Nuclear Systems Division
Materials Science and Technology Division
POST-DEFORMATION EXAMINATION OF SPECIMENS SUBJECTED TO
SCC TESTING
Maxim N. Gussev
Kevin G. Field
Jeremy T. Busby
Keith J. Leonard
Date Published: September 2016
Prepared under the direction of the
U.S. Department of Energy
Office of Nuclear Energy
Light Water Reactor Sustainability Program
Materials Aging and Degradation Pathway
Prepared by
OAK RIDGE NATIONAL LABORATORY
Oak Ridge, TN 37831-6285
managed by
UT-BATTELLE, LLC
for the
U.S. DEPARTMENT OF ENERGY
under contract DE-AC05-00OR22725


iii
CONTENTS
LIST OF FIGURES ...................................................................................................................................... v LIST OF TABLES ....................................................................................................................................... ix ABBREVIATED TERMS ........................................................................................................................... xi SUMMARY ............................................................................................................................................... xiii 1. INTRODUCTION .............................................................................................................................. 15 2. MATERIALS AND METHODS........................................................................................................ 16
2.1 AVAILABLE SPECIMEN INVENTORY ............................................................................... 16 2.2 TENSILE SPECIMEN SELECTION FOR DETAILED EVALUATION ............................... 16 2.3 ROUND COMPACT TENSION (RCT) SPECIMEN SELECTION ....................................... 17 2.4 RCT SPECIMEN GEOMETRY AND TEST HISTORY ........................................................ 18 2.5 RCT SPECIMEN PREPARATION AFTER CRACK GROWTH TESTING ......................... 18 2.6 MULTISCALE STRUCTURE CHARACTERIZATION APPROACH ................................. 21 2.7 LIGHT MICROSCOPY AND LOCAL STRAIN ESTIMATIONS ......................................... 21 2.8 SEM-EBSD OBSERVATIONS ............................................................................................... 22 2.9 EBSD OBSERVATIONS USING FIB SPECIMENS .............................................................. 24 2.10 TEM AND STEM OBSERVATIONS ..................................................................................... 25
3. ANALYSIS OF STRESS CORROSION CRACK INITIATION DURING CERT
EVALUATIONS UNDER PW CONDITIONS ................................................................................. 25 3.1 INTRODUCTION .................................................................................................................... 25 3.2 TEXTURE IN THE MATERIAL OF INTEREST ................................................................... 26 3.3 GENERAL APPEARANCE OF STRESS CORROSION CRACKING .................................. 26 3.4 CRACKING AND LOCAL STRAIN ...................................................................................... 27 3.5 ANALYSIS OF THE SPECIMEN CROSS SECTION (A-ALLOY) ...................................... 29 3.6 EBSD ANALYSIS NEAR INTERGRANULAR CRACKS .................................................... 30 3.7 THE ROLE OF GRAIN ORIENTATION ON CRACK INITIATION ................................... 33
4. PLASTIC DEFORMATION MECHANISMS DURING STRAINING IN HIGH-
TEMPERATURE WATER ................................................................................................................ 36 4.1 INTRODUCTION .................................................................................................................... 36 4.2 DEFORMATION MECHANISMS IN THE AS-19 SPECIMEN ............................................ 36 4.3 TWINNING IN DISLOCATION DEFECT-FREE CHANNELS (AS-19 SPECIMEN) ......... 39 4.4 TWINNING IN SW-36 SPECIMEN ........................................................................................ 42
5. PECULIARITIES OF THE CORROSION DAMAGE IN SPECIMENS TESTED IN HIGH-
TEMPERATURE WATER ................................................................................................................ 44 5.1 INTRODUCTION .................................................................................................................... 44 5.2 MORPHOLOGY AND APPEARANCE OF CORROSION PRODUCTS ON
SPECIMEN SURFACE (SW-ALLOY) ................................................................................... 45 5.3 ANALYSIS OF IN-CRACK CORROSION PROCESSES ..................................................... 47
6. ANALYSIS OF PLASTIC DEFORMATION PROCESSES ACCOMPANYING CRACK
GROWTH ........................................................................................................................................... 52 6.1 INTRODUCTION .................................................................................................................... 52 6.2 STRUCTURE AND TEXTURE OF THE MATERIALS OF INTEREST .............................. 52 6.3 CRACK BRANCHING BEHAVIOR ...................................................................................... 56 6.4 EBSD ANALYSIS OF DIFFERENT FRACTURE MECHANISMS ...................................... 58
6.4.1 Non-deformed area ...................................................................................................... 58 6.4.2 Fatigue pre-cracking area ............................................................................................. 59 6.4.3 Post-test fatigue ............................................................................................................ 60 6.4.4 Final fracture area ........................................................................................................ 61 6.4.5 GROD maps showing strain localization for different areas ....................................... 61

iv
6.5 STRESS INTENSITY AND ESTIMATION OF THE DEFORMED AREA
DIMENSIONS .......................................................................................................................... 63 6.6 EBSD ANALYSIS OF THE CRACK-ADJACENT AREA .................................................... 66 6.7 DETAILED ANALYSIS OF THE KAM PROFILES .............................................................. 73 6.8 ROLE OF GRAIN ORIENTATION ON CRACKING ............................................................ 75 6.9 GRAIN SIZE ROLE ON CRACKING .................................................................................... 77 6.10 CORRELATION OF PLASTIC STRAIN LEVEL AND GRAIN ORIENTATION FOR
THE CRACK-ADJACENT GRAINS ...................................................................................... 78 6.11 THE ORIGIN OF THE HIGHLY-DEFORMED AREAS (“HOT SPOTS”) ........................... 79
7. IN-SITU TESTING OF IRRADIATED SPECIMENS ...................................................................... 82 7.1 ADVANTAGES OF IN-SITU TESTING ................................................................................ 82 7.2 SMALL TENSILE STAGE ...................................................................................................... 82
8. SUMMARY AND CONCLUSIONS ................................................................................................. 84 9. ACKNOWLEDGMENTS .................................................................................................................. 85 10. REFERENCES ................................................................................................................................... 85 APPENDIX A. ALLOYS PRODUCED AND IRRADIATED IN THE FRAMEWORK OF THE
CIR PROGRAM ............................................................................................................................... A-1

v
LIST OF FIGURES
Figure 1. Geometry and dimensions of the round compact tension (RCT) specimen. ............................... 18 Figure 2. The appearance of the fracture surface of the MS-01 specimen after crack growth test. ............ 19 Figure 3. SEM images of specific areas on the specimen surface. ............................................................. 20 Figure 4. General view (stitched image) of the MS-01 RCT specimen cross section. ............................... 20 Figure 5. Irradiated alloy imaging showing ferrite before CERT evaluations ............................................ 22 Figure 6. (a) Tensile round bar holder (1) with a tubular fixture (2) and dummy specimen (3). ................ 24 Figure 7. Typical texture plots for the investigated materials. IPFs are shown with respect to the
straining direction during the CERT test. ...................................................................................... 26 Figure 8. Specimens after CERT evaluations and oxide cleaning. ............................................................. 27 Figure 9. Surface of the deformed tensile bar with the strain levels shown (A-alloy). ............................... 28 Figure 10. (a) Cracks C1 and C2 demonstrate a tendency to coalescence via ductile or
transgranular fracture (white arrows) of the bridge area (B); (b) image showing a high
degree of plastic strain and channel density at the blunted crack tip. ............................................ 29 Figure 11. An intergranular crack in a 10.2 dpa A-alloy. ........................................................................... 30 Figure 12. Cracks observed at the fracture surface for both alloys. ............................................................ 30 Figure 13. EBSD-acquired information for a typical crack in an SW-alloy. .............................................. 32 Figure 14. Crystallographic orientation of cracked GB pairs relative to the tensile axis in an
A-alloy specimen. .......................................................................................................................... 34 Figure 15. Grain orientation data for a relatively large crack (L) in an A-alloy. ........................................ 34 Figure 16. A scheme of the unit triangle partitioning. ................................................................................ 35 Figure 17. General view of the AS-19 specimen cross section after electropolishing. ............................... 37 Figure 18. EBSD IPF, IQ, and Phase maps taken with 125 nm step in the deformed area. ....................... 38 Figure 19. Grain Reference Orientation Deviation (GROD) and Kernel Average Misorientation
(KAM) maps for the area depicted in Figure 18. ........................................................................... 38 Figure 20. An unexpected channel-like structure not following the [111]-plane. ...................................... 39 Figure 21. Deformation twins in the AS-19 specimen. ............................................................................... 40 Figure 22. IQ and GROD maps for the area depicted in Figure 21. ........................................................... 40 Figure 23. The structure (EBSD IPF, IQ, GROD, and grain boundary network maps) for the F-
area (see Figure 17) located close to the fracture point. ................................................................ 41 Figure 24. The structure (EBSD IPF, IQ, GROD, and grain boundary network maps) for the S-
area (see Figure 17) located far from the fracture point................................................................. 42 Figure 25. Bright field STEM image for the SW-36 specimen subjected to CERT evaluations
under NWC conditions. ................................................................................................................. 43 Figure 26. Bright field TEM for the area depicted in Figure 25, Grain #1. ................................................ 44 Figure 27. (a) Localized oxide distribution near a crack initiation site in the SW-alloy. ........................... 46 Figure 28. High-angle annular dark field (HAADF) image, EDS element maps, and color-overlay
maps of two dislocation channels. ................................................................................................ 46 Figure 29. (a) Enlarged view of the cracked grain boundary and slip lines at the surface. ........................ 47 Figure 30. Near-surface crack in the SW-alloy (commercial AISI 304L steel irradiated to 4.4 dpa)
tested at PW conditions. ................................................................................................................. 48 Figure 31. The internal structure of the bottom portion of the crack shown in Figure 30. ......................... 49 Figure 32. Oxide layer in the widely open (top) portion of the crack. ........................................................ 50 Figure 33. Specific oxide morphology at the channel-crack intersection (A) and the crack tip (B). .......... 51 Figure 34. An enlarged view of the crack tip shown in Figure 33. ............................................................. 51 Figure 35. The grain structure of the M-alloy (MS-01 specimen). EBSD IPF, Phase (fcc: red; bcc:
green), GROD, and IQ maps. ......................................................................................................... 53 Figure 36. Grain size histogram for the scanned area shown in Figure 35. ................................................ 53 Figure 37. Kernel Average Misorientation (KAM) map for the area shown in Figure 35. ........................ 54

vi
Figure 38. High-resolution (step size 125 nm) scan of the parent material structure (far from
fracture). ......................................................................................................................................... 55 Figure 39. Grain Average Misorientation (GAM) map for the area shown in Figure 38 and GAM
distribution histogram. ................................................................................................................... 56 Figure 40. The enlarged view of the IGSCC area (MS-01 specimen) showing the absence of crack
branching. ...................................................................................................................................... 56 Figure 41. Crack branching in the cold-worked 316L steel (after [35]). .................................................... 57 Figure 42. Secondary cracks (indicated with black arrows) in the M-alloy specimen. .............................. 57 Figure 43. EBSD data for a typical non-deformed area. Scanning with 125-nm step was
performed at the depth ~2 mm from the edge. ............................................................................... 58 Figure 44. EBSD data for a fatigue pre-cracking area. Step size of 125 nm. ............................................. 59 Figure 45. EBSD data set for the post-test fatigue area. ............................................................................. 60 Figure 46. EBSD data for the fracture area. ................................................................................................ 61 Figure 47. GROD maps for different areas (see above). ............................................................................. 62 Figure 48. GROD map for the stress corrosion cracking area. ................................................................... 62 Figure 49. FEA model for the small crack. ................................................................................................. 63 Figure 50. True stress – true strain curves for non-irradiated and irradiated M-alloy (modified 304
steel) specimens. ............................................................................................................................ 64 Figure 51. An estimated geometry of the area that experienced stresses close to yield stress
(dimensions are in meters). ............................................................................................................ 65 Figure 52. Calculated stress (coded by color scale) and strain (shown by contour lines with a 0.01
step increment) fields around the crack tip in the non-irradiated (left) and irradiated
(right) M-alloy specimens. ............................................................................................................. 66 Figure 53. An example of the EBSD data set: several scans were performed along the crack path. .......... 67 Figure 54. EBSD dataset for the crack-adjacent area: IPF, IQ, GROD, and KAM maps. LAB:
low-angle boundaries; S: locations with high local strain level; SF: strain free grains;
dashed ovals show scratches. ......................................................................................................... 68 Figure 55. GAM values for some grains along the crack path. ................................................................... 68 Figure 56. An enlarged portion of the GROD and KAM maps shown in Figure 54 (close to the
left). ................................................................................................................................................ 69 Figure 57. EBSD data set for the crack-adjacent area. LAB: low-angle boundaries; black arrows
point to grains with visible plastic strain. Scanning conditions (working distance, step
size) are the same as in Figure 54. ................................................................................................ 70 Figure 58. EBSD data for the crack-adjacent area showing a spot with high local strain level. S:
areas with high local misorientation (GROD). LAB: low-angle boundaries. ............................... 71 Figure 59. EBSD data set for the highly-strained area (“hot spot”) from the scan shown in Figure
58. .................................................................................................................................................. 72 Figure 60. EBSD dataset for the area with small secondary crack (dashed black line). ............................. 73 Figure 61. KAM profiles (#1–5) for the EBSD scan shown in Figure 54. ................................................. 74 Figure 62. KAM profiles for the EBSD dataset shown in Figure 58. ......................................................... 75 Figure 63. Orientation of crack-adjacent grains (Scan #11, Scan #12) compared to randomly
selected grains in the bulk (at least ~1.2 mm from the crack). ...................................................... 76 Figure 64. The texture in the bulk non-cracked material (left) and summary texture plot for the
crack adjacent grains. ..................................................................................................................... 76 Figure 65. Grain size histograms for bulk material (left) and crack-adjacent grains (right). ..................... 77 Figure 66. GAM (Grain average misorientation) value histogram for one of the EBSD scans (M-
alloy, MS-01 specimen). ................................................................................................................ 78 Figure 67. The orientation of the grains from the Figure 66, with respect to the applied stress
direction. ........................................................................................................................................ 79 Figure 68. EBSD scan for the stress-corrosion crack in the neutron-irradiated 718-alloy (after
[38]). .............................................................................................................................................. 80

vii
Figure 69. Ductile ligament-free crack (top) in contrast with crack with 3 “bridges” (ductile
ligaments). ...................................................................................................................................... 81 Figure 70. General view of the MZ.Sb small tensile stage for the VERSA 3-D SEM. .............................. 83 Figure 71. Tensile stage with a high-temperature heater installed in the SEM microscope chamber
(image provided by the vendor, Kammrath and Weiss Technologies, Inc.). ................................. 83


ix
LIST OF TABLES
Table 1. Damage dose, element composition (wt.%),a and average grain size for A and SW alloys ......... 16
Table 2. Damage dose and element composition (wt.%) for the investigated RCT specimen ................... 21 Table 3. The role of grain orientation on cracking...................................................................................... 35


xi
ABBREVIATED TERMS
BCC Body-Centered Cubic Phase
BSE Backscattered Electron
BWR Boiling Water Reactor
CERT Constant Extension Rate Test
CGR Crack Growth Rate
CIR Cooperative IASCC Research
dpa Displacement per Atom
EBSD Electron Backscatter Diffraction
ECP (SHE) Electro-chemical potential (Standard hydrogen electrode)
EDS Energy Dispersive X-ray Spectroscopy
EPRI Electric Power Research Institute
FCC Face-Centered Cubic
FEA Finite Element Analysis
FEG Field Emission Gun
FIB Focused Ion Beam
fps frames per second
g gram
GAM Grain Average Misorientation
GB Grain Boundary
GROD Grain Reference Orientation Deviation
HAADF High-Angle Annular Dark Field
IASCC Irradiation-Assisted Stress Corrosion Cracking
IG Intergranular
IGSCC Intergranular Stress Corrosion Cracking
IPF Inverse Pole Figure
IQ Image Quality
KAM Kernel Average Misorientation
LAB Low-Angle Boundaries
LAMDA Low Activation Materials Development and Analysis
LM Light Microscopy
LWR Light Water Reactor
LWRS Light-Water Reactor Sustainability Program
NWC Normal Water Chemistry
OM Optical Microscopy
ORNL Oak Ridge National Laboratory
PFB Protective Film Breakdown
PW Primary Water
PWR Pressurized Water Reactor
RCT Round Compact Tension
RIS Radiation-Induced Segregation
SAD Selected Area Diffraction
SCC Stress Corrosion Cracking
SEM Scanning Electron Microscope / Microscopy
SF Strain Free
SFE Stacking Fault Energy
SSRT Slow-Strain Rate Tensile Experiment
S/TEM Scanning Transmission Electron Microscopy
TEM Transmission Electron Microscopy

xii
TG Transgranular
TS True Strain

xiii
SUMMARY
This report details the results of post-radiation and post-deformation characterizations performed during
FY 2015–FY 2016 on a subset of specimens that had previously been irradiated at high displacement per
atom (dpa) damage doses. The specimens, made of commercial austenitic stainless steels and alloys, were
subjected to stress-corrosion cracking tests (constant extension rate testing and crack growth testing) at
the University of Michigan under conditions typical of nuclear power plants. After testing, the specimens
were returned to Oak Ridge National Laboratory (ORNL) for further analysis and evaluation.
The goal was to conduct detailed post-test examinations of the specimens, focusing on corrosion damage,
particularly the initiation and propagation of stress corrosion cracks and any effects caused by
deformation localization and dislocation channel formation. Determining a correlation between
irradiation-assisted stress corrosion cracking (IASCC) and plastic deformation was also important.
The report is divided into chapters that examine the different phenomena accompanying crack initiation
and propagation in high-temperature water. Chapter 1 provides a general introduction, and Chapter 2
describes the criteria used for material selection. The list of the investigated specimens provides a
composition and structural details and includes the research methods and tools used. Chapter 3 is devoted
to the analysis of stress corrosion crack initiation in tensile specimens. The selected specimens were
subjected to detailed examination, including measurements of local strain level, crack morphology
analysis, and scanning electron microscopy–electron backscatter diffraction (SEM-EBSD). Particular
attention was given to the role of grain orientation on crack initiation.
In Chapter 4, plastic deformation mechanisms taking place during testing in high-temperature water are
analyzed and discussed. According to the majority of research studies, stress corrosion crack initiation is
related to plastic strain and deformation localization. It was important to analyze the details of plastic
strain mechanisms in the cracked specimens. In Chapter 5, the results of corrosion damage are discussed
in detail. Using the focused ion beam (FIB) lift-out technique, oxide morphology and crack tip structure
were investigated for specific near-surface cracks formed under primary water (PW) conditions.
Chapter 6 is devoted to the analysis of stress corrosion crack propagation. The selected specimen was
subjected to a detailed examination, including analysis of local strain fields at different locations using
SEM-EBSD and crack morphology analysis, focusing on the role of grain orientation on crack
propagation. Plastic deformation mechanisms taking place in the crack vicinity during testing in high-
temperature water were analyzed and discussed.
Chapter 7 discusses the advantages of in-situ testing for investigating plastic deformation mechanisms in
highly-irradiated austenitic steels. After brief literature survey, the selected small tensile frame for in-
SEM testing is discussed. This tool, as expected, will allow for further deep insight into strain-induced
phenomena.
The results highlight the overall complexity of IASCC in irradiated stainless steels. It was found that the
initiation of IASCC involves many factors including localized deformation and most likely selective
oxidation at the surface steps produced by channels penetrating the free surface. Grain orientation was
found to dictate the location of observable small cracks at the specimen surface. The role of grain
orientation was determined to be more complex than previously thought. Finally, it was found that cracks
could exhibit a complex structure and chemistry, with multilayer oxide formation and variations in oxide
formation occurring with increasing depth in the crack.


1. INTRODUCTION
Austenitic AISI 304 and 316 stainless steels, as well as their numerous variants, are widely employed in
the nuclear industry. These steels were chosen in approximately 1960 because of their favorable
combination of mechanical and corrosion properties, machinability, weldability, price, and—at that
time—acceptable radiation tolerance. Recently, a number of different materials have come into use, but
300-series steels are expected to remain in service for at least the next 20–30 years, if not longer.
Although 300-series steels have an advantageous combination of properties, they are known to suffer
from several issues, one of which is irradiation-assisted stress corrosion cracking (IASCC). IASCC is one
of the widely recognized and most severe concerns associated with this class of materials in light water
reactor (LWR) operating environments. Recently, significant progress was made in mitigating IASCC by
transitioning to hydrogen water chemistry, employing corrosion inhibitors, and decreasing corrosion
potential, among other methods. However, IASCC-related issues are still expected to become more severe
as nuclear power plants and their components age.
Several programs and projects were initiated to investigate IASCC in detail and find a way to mitigate it.
One of these projects, entitled “Production of Tailored Alloys to Isolate Metallurgical Variables
Promoting IASCC,” was performed from 2000 to 2002. In the framework of this project, more than 12
alloys were produced, irradiated, and subjected to different tests. These irradiated materials were recently
used in the Light Water Reactor Sustainability (LWRS) Program, allowing additional IASCC-related tests
to be performed. The philosophy behind this is that each tested specimen is a unique object. Even after the
primary test is over, the specimen is still of high value for further post-test analysis. The fast evolution
and development of new tools—such as modern transmission electron microscopy (TEM), focused ion
beam (FIB), and scanning electron microscopy–electron backscatter diffraction (SEM-EBSD)—allow
new tests to be conducted on previously tested specimens.
IASCC is a complex process involving many contributing factors, including microstructural and
microchemical changes induced by irradiation. These factors influence mechanical reactions of the
material in response to applied external stress. Careful analysis of the literature shows the overwhelming
complexity of mechanical response and localized deformation in polycrystalline materials, especially
when subjected to irradiation. Additionally, the austenitic stainless steels widely used in power plants
have demonstrated specific phenomena during straining, like phase instability and/or deformation
twinning. The formation of twins may affect the strain behavior, deformation parameters, local stress
fields, and, likely, corrosion resistance.
In the present work, a methodical multiscale and multi-tool approach was used to characterize the
corrosion processes and localized deformation in neutron-irradiated materials subjected to testing in a
corrosion environment. This work takes advantage of coupling several analytical techniques, including
SEM-EBSD, FIB, site-specific TEM sample preparation, and scanning transmission electron microscopy
(STEM). Key to this work was the use of novel and/or state-of-the-art techniques and equipment to
resolve information that has been difficult or impossible to uncover to date. This includes the use of a
high-resolution, high-efficiency STEM-based energy dispersive x-ray spectroscopy (STEM-EDS)
spectrum mapping equipment/technique coupled with targeted FIB lift-out procedures based on extensive
SEM-EBSD–based investigations.
Using this approach, specific phenomena were observed and analyzed: the role of grain orientation on
stress corrosion crack initiation (Chapter 3), active plastic deformation mechanisms (Chapter 4), corrosion
damage and oxide layer morphology (Chapter 5), and plastic strain–induced phenomena accompanying
stress corrosion crack propagation.

2. MATERIALS AND METHODS
2.1 AVAILABLE SPECIMEN INVENTORY
The inventory of the available specimens included materials (more than 12 austenitic alloys) produced as
part of the Cooperative IASCC Research (CIR) program [1, 2, 3, 4] and irradiated in the BOR-60 reactor.
Details of the irradiation may be found in [2]. Some of the irradiated tensile specimens were tested at the
University of Michigan in 2010–2014, the key results on tensile specimens and constant extension rate
tests (CERTs) were published by Stephenson and Was [3]. These irradiated materials were also used to
characterize radiation-induced segregation (RIS) [5, 6] and other phenomena like twinning and phase
instability [7]. A summary table giving the composition and maximum damage dose of the CIR-related
alloys is provided in Appendix A.
The tested specimens [3] are located in a long-term storage facility at ORNL and may be retrieved for
further evaluation or used as a supply of irradiated material with well-known history.
2.2 TENSILE SPECIMEN SELECTION FOR DETAILED EVALUATION
The materials used to investigate crack initiation were two commercial AISI 304 stainless steels
designated as A- and SW-alloys [1]; the specimens were tested in a primary water (PW) environment (see
details below) and in normal water chemistry (NWC). The tests were performed at the University of
Michigan by Dr. G. S. Was and colleagues.
The specimens of these materials were selected for two main reasons. First, steels of this composition are
widely employed in nuclear power plants, so the results are of high practical importance. Second, CERT
experiments [3] revealed multiple cracks in specimens tested in a PW environment but not in NWC. High
crack density in the PW environment implied that crack nucleation occurred readily, but crack growth
was suppressed or at least retarded.
It was important to conduct a detailed analysis of such unusual behavior to investigate crack morphology
(size and depth), crack propagation mechanisms, and other corrosion-related phenomena if any. A large
number of cracks and diverse crack population (i.e., the presence of long, well-developed cracks, as well
as small cracks consisting of one to two grain boundary [GB] segments only) provided an opportunity to
accumulate acceptable statistics and focus on aspects of crack initiation. Also, it was interesting to
compare the deformation behavior (i.e., formation of channels and their fine structure) in the specimens
deformed under PW and NWC conditions.
The specimens were round tensile bars (diameter 2 mm, gauge length 12 mm; see [3] for details)
irradiated at 320C at an average dose rate of approximately 8 × 10⁻⁷
dpa/s [2]. The composition, grain
size, and damage dose for each material are given in Table 1. The alloys had similar compositions;
however, alloy A contained more silicon and chromium.
Table 1. Damage dose, element composition (wt.%),a and average grain size for A and SW alloys
Alloy Specimen ID and
environment
Dose,
dpa Mn Si Cr Ni Mo C
Grain
size, m
A AS19 (PW) 10.2 1.82 0.56 19.95 10.8 0.53 0.023 38
SW SW37 (PW);
SW36 (NWC) 4.4 1.07 0.24 18.42 10.45 n/d 0.022 67
aIn both materials: P < 0.01%; S < 0.01%; Ti < 0.02; Nb < 0.005.

The CERT tests were performed at 320C at a strain rate of 3.5 × 10⁻⁷
s-1
. The AS19 and SW37
specimens, listed in Table 1 were strained to fracture in a PW environment with the following parameters:
pressure: 12.4 MPa; H2 concentration: 3000 ppb; B concentration: 1000 ppm; and Li concentration:
2 ppm. The ECP (SHE) potential was –0.860 V.
The SW36 specimen was tested under NWC conditions (pressure: 10.3 MPa; temperature: 288C; O2
concentration: 2000 ppb; conductivity: 0.2 µS/cm; ECP (SHE) potential: +0.215 V). Mechanical behavior
analysis, details on fracture surface morphology, CERT test description, and TEM and microstructure
data for these materials are given elsewhere [2, 3].
Prior to the CERT experiments, the irradiated specimens were mechanically polished using standard
metallographic procedures. To get a clean, defect-free surface, specimens were electropolished with
Struers A2 electrolyte (90 ml distilled water, 730 ml ethanol, l00 ml ethylene glycol monobutyl ether,
78 ml perchloric acid) at 30 V DC. Thus, the specimen surface was cold worked and scratch- and defect-
free. This may be important because the surface conditions (e.g., cold work after coarse grinding) may
influence the crack initiation, and near-surface grains may have significant plastic strain [8].
Because 304-composition steels, in general, may contain some magnetic phase [9], a Fisher FMP-30
ferroprobe was employed to measure the amount of magnetic phase in the material. Before taking
measurements, the device was calibrated with a three-level reference specimen set (0.53%, 2.96%, and
10.4% of -ferrite). This ferroprobe has a threshold limit of 0.1% of ferrite; therefore, any amount of
magnetic phase below this limit could not be reliably detected. The probe cannot distinguish between
ferrite and other magnetic phases.
2.3 ROUND COMPACT TENSION (RCT) SPECIMEN SELECTION
Crack growth testing is usually considered the most informative test because once the specimen is placed
in a chamber (i.e., an autoclave), the environment parameters may vary, and the same specimen may
provide information on a wide range of temperatures, loading conditions, etc. Post-testing analysis often
includes specimen cross-sectioning to analyze crack trajectory and branching, crack opening, and prepare
TEM specimens via electrolytic thinning or focused ion beam milling (FIBing). Once EBSD emerged and
came into wide use, analysis also includes investigating grain boundary type and character (high- or low-
angle or special grain boundary, like 3). Regarding crack growth testing, EBSD may provide valuable
information on local plastic deformation in the crack-adjacent area or near the crack tip.
Few papers have been published recently on the EBSD analysis of non-irradiated compact tension
specimens, and very limited, if any, information exists for irradiated objects tested at the LWR-relevant
conditions. Thus, round compact tension (RCT) specimens that have been irradiated at high doses and
tested in corrosive environments are of immediate interest.
Several RCT specimens were available after crack growth testing. The B-alloy specimen (Commercial
316L steel, see Appendix A) was made of cold-worked steel [1, 2, 3, 4]; pre-irradiation cold work would
make it difficult to separate the pre-irradiation preexisting deformation and crack-induced plastic strain.
The N-alloy specimen had an Nb addition, which is not a typical alloying element. Finally, the P-alloy
specimen was a modified 304 steel with additions of Mo and Hf. While alloying with Hf is of interest, it
would make the analysis more complicated at this step.
Thus, for crack propagation analysis, the M-alloy RCT specimen (MS-01) was selected based on the
availability of its test history and acceptable activity level (i.e., below low activation materials
development analysis [LAMDA] limits for the tested specimen half). Also, this specimen was made of
annealed 304 steel with a Ti-addition. Pre-irradiation annealing and the absence of cold work in the
structure allow for easier evaluation of plastic strain fields in the crack-surrounding area.
Testing RCT specimens is a complex procedure that includes fatigue pre-cracking followed by corrosion
testing under different environment/temperature conditions, followed by post-test fatigue and final
fracture measurements. Due to the multistage character of the test, each RCT specimen can be used to
investigate crack propagation and fracture mechanisms at different conditions. It was important and
interesting to analyze this unique object in detail and investigate crack morphology (trajectory and
branching) and effects accompanying crack propagation (oxidation and acting plastic strain mechanisms).
A relatively long crack (a few millimeters) and availability to prepare several cross-sectional specimens
provided an opportunity to accumulate acceptable statistics.
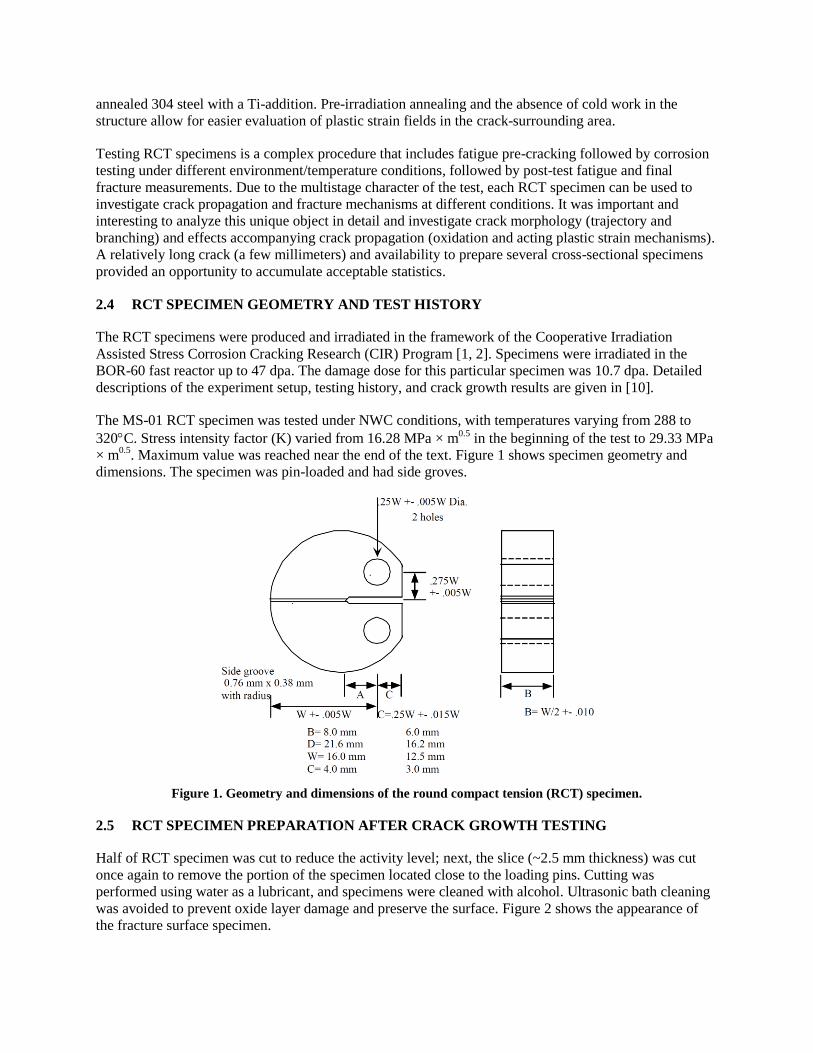
2.4 RCT SPECIMEN GEOMETRY AND TEST HISTORY
The RCT specimens were produced and irradiated in the framework of the Cooperative Irradiation
Assisted Stress Corrosion Cracking Research (CIR) Program [1, 2]. Specimens were irradiated in the
BOR-60 fast reactor up to 47 dpa. The damage dose for this particular specimen was 10.7 dpa. Detailed
descriptions of the experiment setup, testing history, and crack growth results are given in [10].
The MS-01 RCT specimen was tested under NWC conditions, with temperatures varying from 288 to
320C. Stress intensity factor (K) varied from 16.28 MPa × m0.5
in the beginning of the test to 29.33 MPa
× m0.5
. Maximum value was reached near the end of the text. Figure 1 shows specimen geometry and
dimensions. The specimen was pin-loaded and had side groves.
Figure 1. Geometry and dimensions of the round compact tension (RCT) specimen.
2.5 RCT SPECIMEN PREPARATION AFTER CRACK GROWTH TESTING
Half of RCT specimen was cut to reduce the activity level; next, the slice (~2.5 mm thickness) was cut
once again to remove the portion of the specimen located close to the loading pins. Cutting was
performed using water as a lubricant, and specimens were cleaned with alcohol. Ultrasonic bath cleaning
was avoided to prevent oxide layer damage and preserve the surface. Figure 2 shows the appearance of
the fracture surface specimen.

Reasonable precautions during specimen transportation and hot cell handling were not made so
occasional mechanical damage (fine scratches and local imprints) presented at the surface, but these
blemishes were clearly distinguishable from the corrosion and usual (e.g., fatigued) fracture surface.
Small particles like dust or rust were also found on the surface (Figure 3). These might appear during
specimen transportation and handling performed without special precautions.
Figure 2. The appearance of the fracture surface of the MS-01 specimen after crack growth test. All specific
areas (pre-cracking, corrosion crack growth, etc.) are clearly distinguishable from each other. The insert features a
line drawing of the RCT specimen, showing the location of the cut fracture surface specimen.
After the visual analysis and inspection, the specimen was cut to produce several cross-sectional slices
(Figure 2). The first cross-sectional sample (Figure 4) was prepared by mechanical grinding and
polishing. The cross section plane was located close to the middle plane of the RCT specimen and
represented, as expected, the plane strain state.
The final preparation step was electropolishing in a Struer A2 solution for 7 sec. The electropolishing
duration was much shorter than the usual 15 sec procedure in an attempt to keep the sample edges as
sharp as possible. However, even 7 sec electropolishing did produce slightly smooth edges. Later, during
SEM analysis, it was found that for this slice the most important area near the crack was not available for
EBSD scanning as a result of the slightly smooth edges.
Several cross sections were produced in an attempt to get sharp enough edges with limited material lost.
The final established preparation procedure included mechanical grinding with final steps with 1 m and
0.5m sandpaper and very short, 2 sec, electropolishing.
Standard epoxy mounting may be more beneficial for producing sharp edge specimens. Unfortunately,
epoxy mounting was not available at the LAMDA facility during this project. Wet grinding and polishing
of the standard 1.25 in. epoxy mounts would produce too much liquid low-active waste. Currently, a
Post-test fracture
Post-test fatigue
IGSCC area
Pre-cracking
One of the specimens for cross-section analysis

specialized water circulation system is being installed in LAMDA to provide the opportunity to try epoxy
mounting and mechanical grinding with colloidal silica as the last step.
Figure 3. SEM images of specific areas on the specimen surface.Note the strong oxidation of the pre-cracking
area and pronounced ductile fracture surface in the final fracture area.
Figure 4. General view (stitched image) of the MS-01 RCT specimen cross section.
Regarding EBSD analysis of the cross-sectional specimens, it is important to underline the following.
IASCC characterization was limited to the prepared cross section, so the images are essentially two-
dimensional views of a complex, 3-D crack.
Final fracture
Pre-crackingfractur
e
Transition from pre-cracking to IGSCC area
Post-test fatigue

Table 2. Damage dose and element composition (wt.%) for the investigated RCT specimen
Alloy Specimen ID Dose,
dpa Mn Si Cr Ni Mo C N Ti Co
M MS-01 10.7 1 0.03 18.03 11.22 0.02 0.020 0.0005 0.30 0.03
2.6 MULTISCALE STRUCTURE CHARACTERIZATION APPROACH
A number of characterization techniques were coupled together and strictly applied one at a time to
provide detailed observations of the deformation mechanisms and strain localization processes in the
irradiated 304 austenitic stainless steel. These techniques included light microscopy (LM), SEM-EBSD,
dual-beam SEM-FIB, and S/TEM. These techniques covered the entire range of the mesoscale-to-
nanoscale characterization in spatial resolution coordinates of the irradiated material. In the present work,
characterization was conducted using a top-down approach to provide a detailed picture of the
deformation behavior, oxidation processes, and crack initiation.
2.7 LIGHT MICROSCOPY AND LOCAL STRAIN ESTIMATIONS
Grain structure of the material was imaged using a Keyence VHK-1000 optical microscope. To measure
grain size and analyze the structure of the materials, small plate-like samples were cut from the ends of
the irradiated tensile bars prior to CERT exams to determine grain size, phase composition data, and
inclusion morphology. The samples were prepared using standard metallography procedures (e.g.,
mechanical grinding, polishing, and etching). Figure 5 shows the structure of the irradiated A- and SW-
alloys prior to deformation. Both steels had a typical annealed austenite structure, with large equiaxed
austenitic grains containing multiple annealing twins. No signs of pre-irradiation cold-work or post-
irradiation deformation were observed.
Round or irregularly shaped inclusions were observed in the structure of A-alloy and identified as δ-
ferrite using EBSD phase mapping (Figure 5b). In most cases, the inclusions consisted of several δ-ferrite
grains. Microhardness of δ-ferrite and the austenitic matrix at 25 g load were estimated at ~560 kg/mm2
and 409 kg/mm2, respectively. Large loads during indentation could not be used because of the small size
of the δ-ferrite grains. From metallographic images, the average amount of ferrite was estimated at
approximately 0.7–1%; however, ferroprobe readings showed 2.21% ferrite. The difference may be
explained by the formation of fine, dispersed ferrite during irradiation. Such dispersions of α-ferrite were
previously identified in the neutron-irradiated A-alloy [9]. Radiation-stimulated ferrite formation in
austenitic steels is a common phenomenon and has been analyzed in detail elsewhere [9]. No coarse δ-
ferrite was observed in the SW-alloy.
The yield strength of the A-alloy was higher than that of the SW-alloy (813 and 695 MPa, respectively),
likely due to a combination of the increased irradiation dose, smaller grain size (Table 1), and the
presence of δ-ferrite [3]. Comparing these two test conditions at a similar irradiation doses confirms that
the harder δ-ferrite phase does cause an increase in the macroscopic yield strength [3]. Furthermore, a
drastic difference in strain to failure was observed between these two conditions after CERT evaluations
in the PW environment. It is likely that the hard δ-ferrite phase may have influenced the limited ductility
of the A-alloy as compared to the SW-alloy and may have led to the slight enhancement in intergranular
(IG) stress corrosion cracking (IGSCC) observed on the fracture surface.

Figure 5. Irradiated alloy imaging showing ferrite before CERT evaluations (a) Structure of irradiated A-alloy
before CERT evaluations (light microscope, 400×). Black arrows point to retained ferrite grains. The insertion
shows microhardness indentations in ferrite (white arrow) and austenite grains. (b) EBSD phase map (austenite is
red, ferrite is green), A-alloy. The insertion shows a fragment of EBSD image quality (IQ) map for the same area,
demonstrating annealed deformation-free structure. (c) Structure of irradiated SW-alloy prior CERT test, light
microscope, 400× (electrolytic etching with 10% oxalic acid at 6 V for 60–80 s for both A- and SW-alloys).
The composition of the investigated materials was also measured using SEM equipped with EDS. The
results for austenite agreed well with the expected composition given in Table 1. The composition of
ferrite in the A-alloy was significantly enriched in Cr and depleted in Ni (Ni, wt.%: 4.0%; Cr: 30.7%; Mn:
3.1%; Si: ~2.2%; Mo: ~1.0%).
The same microscope running in light transmission mode was used to measure the specimen diameter and
estimate local strain level at the deformed tensile bars. To determine the local strain, an approach based
on the specimen diameter measurement was used. Assuming that specimen volume (V) was a constant
during the straining (V~d2 × l ~ constant, where d represents diameter and l is length), the definition of
engineering strain ( = l/l0) was rewritten as = (d02/di
2) − 1, where di and d0 are current and initial
diameters, respectively. Recently, a very similar approach was used by Subedi et al. [11]. True strain (TS)
in a round tensile bar was calculated as TS = ln(d02/di
2) [11].
2.8 SEM-EBSD OBSERVATIONS
The high-quality, untouched polished surface of the specimen was maintained after straining, which
allowed SEM-based analysis of the specimen to focus on corrosion sediments, dislocation channels, and
a b
c

cracks. The analysis was conducted in two stages after CERT evaluations: as tested and after oxide
cleaning. Corrosion layer morphology and elemental composition were studied using as-received CERT-
tested specimens. A number of specimens were prepared using FIB.
After that the crack morphology analysis and EBSD scanning were conducted on oxide-cleaned
specimens as the corrosion products partially filled the cracks, thus obscuring the true appearance of the
crack and morphology. The following oxide cleaning procedure was used to remove corrosion products:
1. A 5 min soak in an ~100°C solution of 30 g/L potassium permanganate and 100 g/L sodium
hydroxide
2. An additional 5 min soak in an ~100°C solution of 30 g/L ammonium oxalate
3. Ultrasonic cleaning of the specimen in distilled water for up to 3 min
4. Repeating steps 1–3, as needed
The cleaning procedure was repeated four to five times to fully remove oxidation from PW environment
exposure during CERT evaluations.
EBSD analysis was conducted to retrieve crystallographic data including grain orientation and GB
character distribution. SEM was performed using a JEOL JSM 6500F microscope with a field emission
gun (FEG), equipped with an EDAX EBSD system. The accelerating voltage was 20 kV, and the working
distance was 12–15 mm. EBSD maps were measured on a hexagonal grid with a step size of 0.1 to 2.0
µm. The camera operated at approximately 10–15 frames per second (fps) in the 1 × 1 binning mode. The
scan rate was significantly slower than those for typically prepared specimens (~50 fps for electropolished
specimens) because of corrosion-induced damage and surface strain after CERT evaluations.
Since EBSD normally uses flat surfaces, the round specimen shape required a special holder (Figure 6a).
With this holder, the tensile bar was inserted into a hollow aluminum tubular fixture and fixed using a
special hand press. The fixture and specimen freely rotated about the loading axis to provide different
viewing angles. The specimen tensile axis was always aligned with the TD (transverse or horizontal) axis
of the EBSD system. EBSD patterns of acceptable quality were obtained in a narrow band of ~200–230
µm in width. This width corresponds to an approximately 13 section of the 2 mm cylindrical gauge. To
ensure the quality of EBSD scan data (acceptable and relatively uniform pattern brightness, etc.), only
~180–200 µm or more narrow bands (~10 sector or less) were scanned.
After the analysis of the specimen surface by SEM-EBSD, a cross section of the deformed gauge was
prepared by mechanical grinding and polishing with 1 m diamond sandpaper as a final step.
Electropolishing was not used to keep the edges and interfaces sharp, and ultrasonic cleaning was avoided
to preserve the in-crack material. The cross section was analyzed with an optical microscope and SEM to
measure the crack appearance and quantify the depth and morphology.

Figure 6. (a) Tensile round bar holder (1) with a tubular fixture (2) and dummy specimen (3). A small
additional grip (4) may be used to hold the grids for FIB-TEM specimens. (b) Surface of the irradiated specimen
(SW-alloy) subjected to CERT test in a PW environment and cleaning; the pronounced crack density gradient is
visible (i.e., there is no crack on the right and increased crack density from the middle to the left). The white
rectangle shows an area that can be EBSD scanned without specimen rotation operations; typically, these areas
contained 0–5 cracks. The insert shows a typical EBSD pattern; sample curvature limited the ability to maintain a
uniform background in EBSD patterns.
2.9 EBSD OBSERVATIONS USING FIB SPECIMENS
Planar investigations, by their definition, only serve to investigate the surface of the deformed material
and fail to characterize the material in-depth. To characterize the crack morphology, oxide layers, and
local plastic strain distribution of the deformed specimen in-depth, the FIB lift-out technique was utilized
to analyze the near-surface layer. Specific sites of interest—including high local plastic strain, interesting
surface topology, and high-angle grain boundaries— were identified on the specimen using the optical
and SEM-EBSD–based observations. These sites were micro-machined using FIB lift-out procedures
using an FEI Quanta 3D 200i DualBeam FIB. Cross-sectional lamellae of ~20 μm × ~15 μm × ~2–3 μm
were removed from the parent specimen.
Lamellas were then mounted on commercially available Omniprobe FIB-TEM specimen grids in a
chevron configuration. Locking the lamella on both sides of the sample before ion beam
thinning/polishing prevented the sample from warping or bending. Bending, particularly as samples reach
thicknesses below 200 nm, was prominent if residual stress was present in the sample. Preventing the
sample from relieving this stress promotes uniform thickness throughout the entirety of the FIB lift-out
procedure and reduces FIB-induced damage.
The lift-outs were then thinned using standard FIB procedures and polished using a low-angle, low-keV
ion beam to provide a defect-free/reduced surface for EBSD analysis. The specimens were then
temporarily mounted using carbon tape on the stage utilized for EBSD analysis, taking care to align the
specimens near the top of the mount and limit over-tilting. The specimens were then loaded in the JEOL
JSM 6500F FEG-SEM to conduct cross-sectional EBSD analysis. Cross-sectional EBSD analysis was
conducted using the same parameters established during the planar high-resolution scans. The two
coordinate systems (planar and cross section) of the separate EBSD acquisitions could not be directly
correlated because of small deviations in specimen tilting while being mounted.
Finally, specimen cross sections were produced by standard metallurgical procedures (cutting, mounting,
mechanical grinding). Since this step is destructive, SEM-EBSD analysis and FIB lift-outs were
performed before the macroscopic cross-sectional preparation.
1
2
3
a b
4
20 mm
Tensile axis

2.10 TEM AND STEM OBSERVATIONS
After EBSD analysis, specimens were thinned to final electron transparency in the FEI Quanta. Thinned
lift-outs were finished using a low angle, low keV ion polishing on both sides to reduce artifacts from the
FIB sample preparation. TEM specimens were investigated using a Philips CM200 FEG S/TEM or a FEI
F200X Talos operated in both TEM and STEM mode. TEM provided general bright field imaging and
defect contrast imaging while STEM-mode was used for STEM-based orientation mapping.
STEM investigations were carried out using a Philips CM200 or an FEI F200X Talos FEG STEM
operating at 200 kV. Corrosion products and near surface chemistry were investigated using 2-D EDS
spectrum imaging maps. Map sizes varied depending on the sample of interest and microscope used. For
small area maps, the Philips CM200 was used with a 2 nm pixel step size, an incident probe size with a
full-width at half maximum of 1.5 nm, and ~1.5 nA of probe current with drift correction activated. Pixel
dwell time was limited to 1 s to increase the area of the scans. The short dwell time reduced the total
counts within a spectrum, and, therefore, some counting error is inherent. For large area maps, the FEI
F200X Talos was used because this system is outfitted with a 0.9 srad (steradian) solid angle of
collection for x-rays and a proprietary high brightness source, allowing an ultra-high x-ray spectrum
imaging efficiency over other STEM-EDS systems currently qualified for radiological use. Maps on the
FEI F200X Talos varied in size, but all maps utilized a higher than 1.5 nA probe current at a probe size
lower than that of the Philips CM200. All spectrum images were post-processed to reveal regions of
composition variation. Color mixing was used to develop color-overlay maps of each element map
generated, and line scans were developed by post-processing the spectrum images.
3. ANALYSIS OF STRESS CORROSION CRACK INITIATION DURING CERT
EVALUATIONS UNDER PW CONDITIONS
3.1 INTRODUCTION
Austenitic AISI 304 and 316 stainless steels, as well as their numerous variants, are widely used in the
nuclear industry because of their favorable combination of mechanical and corrosion properties and
acceptable radiation tolerance. However, these materials are susceptible to IASCC, which is one of the
widely recognized and most severe issues associated with this class of materials in LWR operating
environments [4, 12, 13]. As the existing fleet of LWRs ages, IASCC-related issues are expected to
become more severe; consequently, this aspect is under active investigation by the LWRS program.
IASCC is a complex process involving many contributing factors, including microstructural and
microchemical changes induced by irradiation [4]. At a high damage dose (20–40 dpa), stress corrosion
cracking may occur even in a low potential corrosion environment, where a very low crack growth rate
was observed in non-irradiated or low-dose irradiated materials [14]. Recently, plastic strain and
dislocation channeling leading to deformation localization have been recognized to play an important role
in IASCC susceptibility [4, 12]. IASCC initiation in austenitic steels has been widely investigated using
constant load tests [4, 12, 13], often with a particular focus on the stress level required for IASCC
initiation [13]. However, very limited data showing the influence of material variables, including grain
orientation role on IASCC initiation, have been openly reported.
As mentioned in Chapter 2, previous CERT evaluations revealed multiple cracks in neutron-irradiated
304 steel specimens tested in a PW environment [3]. A high crack density implied that crack nucleation
occurred readily, but crack growth was suppressed or at least retarded [3]. The main objective of the
present task was to investigate crack morphology (size, depth), crack propagation mechanisms, and other
corrosion-related phenomena on these previously tested materials with a particular focus on aspects of
crack initiation.

3.2 TEXTURE IN THE MATERIAL OF INTEREST
Inverse pole figure (IPF) texture plots for A- and SW-alloys (Figure 7) show relatively weak texture (just
~1.9× random for the given loading direction). No particular grain orientation dominated the structures;
however, the SW-alloy had a slightly increased fraction of soft grains (i.e., grains with a high Schmid
factor) compared to the A-alloy. No signs of pre-irradiation cold-work or post-irradiation deformation
were observed from the EBSD data (image quality maps, kernel average misorientation maps, etc.).
Figure 7. Typical texture plots for the investigated materials. IPFs are shown with respect to the straining
direction during the CERT test.
3.3 GENERAL APPEARANCE OF STRESS CORROSION CRACKING
Figure 8 shows the gauge sections of the SW- and A-alloy tensile specimens after CERT testing and
oxide cleaning. Multiple cracks along the gauges are visible, with crack density and size increasing
towards the fracture surface. Crack density was ~3–3.5 times higher in the A-alloy compared to the
SW-alloy (Figure 8). However, the average crack width was larger in the SW-alloy. Crack coalescence
(see below) was observed in both alloys but was more pronounced in the SW-alloy because of the smaller
number of cracks and larger average width of the individual cracks.
Grain size might be one of the factors influencing crack density. A smaller grain size increases the
number of potential crack initiation sites such as triple junction points and/or favorably oriented grains.
For the investigated materials, the grain size difference was 67/38 m – SW/A. That is the grain size is
approximately 1.76 times greater in A-alloys than in SW-alloys (Table 1). Thus, the density of surface
GB segments is (1.762)
or about 3.1 times higher for the A-alloy, very close to the observed difference in
crack density (200/60 cracks/mm2 or ~ 3.3, Figure 8). It is speculated that for the given test conditions,
the grain size is the most important parameter influencing crack density and that other variables (like
silicon amount or delta-ferrite presence) did not play a key role.
Corrosion products (particles of small irregular or tetrahedron-like shape) present on the surface were
analyzed in detail. Additionally, specific corrosion damage was observed at dislocation channels and in
some cases along grain boundaries. These results are discussed in more detail in Chapter 4.
SW A

Figure 8. Specimens after CERT evaluations and oxide cleaning. The top images show a general view of the
specimen neck. The gradient in plastic strain and in crack density can be seen. The bottom images illustrate the
difference in crack density between the alloys. Bright material filling some cracks in the A-alloy is the remaining
epoxy after replica preparation. It could not be removed without significant sample surface damage.
3.4 CRACKING AND LOCAL STRAIN
As noted, surface corrosion products prevented detailed analysis of the crack initiation and growth in both
alloys. Therefore, the following sections include analysis only after oxide cleaning. As expected, average
crack length and density, as well as channel height and channel density, increased with local strain, as
shown in Figure 9. Areas with local strain close to 0% and up to ~0.6%–0.8% contained dislocation
channels but no cracks. With increasing local strain up to ~1.5%, channels and cracks were observed with
an average crack length of ~100–120 m (~4–5 GB segments). As local strain increased to ~2.5%, the
typical crack length increased to ~150–200 m and included five to seven or more GB segments. Crack
density further increased up to a local strain of ~4–5%. As the local strain increased, crack coalescence
was observed, and in many cases, the local fracture occurred via strong plastic deformation of the material
between cracks followed by ductile fracture or transgranular (TG) crack propagation (Figure 10). Local
channel density at such areas was very high. Similar cracking behavior (i.e., multiple cracks along the
deformed neck followed by crack coalescence) was observed by Je and Kimura [15] in SUS316L steel
after slow strain rate testing in supercritical water (500C, pressure 25 MPa, dissolved oxygen content
<0.01 ppm, and conductivity <0.1 S/cm). The exact reason for intensive crack formation was not
specified.
Local strain
increase
~60 cracks per 1
mm2
~200 cracks per 1
mm2
A SW
A SW

Based on these observations, some factor of limited crack growth via a trans-granular mechanism is
expected. After reaching some length, typically 150–200 m, a crack, as a rule, demonstrated strong
plastic deformation at its edges. Subsequently, crack tips blunted and further fracture often occurred via
plastic deformation and IG fracturing (Figure 10).
Dislocation channel traces were observed along the full gauge length of the tensile specimens for both
alloys, even if the local strain was practically zero. This observation is consistent with numerous other
observations of channel formation in irradiated materials loaded below the yield stress [16, 17]. Cracking
behavior may be linked to the existence of dislocation channels. As demonstrated, cracks coexisted with
dislocation channels (slip lines). Typically, dislocation channels were observed at crack edges, as both
pronounced steps at the specimen surface as well as on IG facets within the crack were observed (Figure
29). There seems to be a critical channel density or, more likely, channel height at which cracking was
initiated [12, 18].
Bosch et al. [19] performed crack initiation analysis on tube specimens under pressurized water reactor
(PWR) conditions. It was shown that no IASCC-related fracture was observed in specimens of cold-
worked 316L steel irradiated at ~12 dpa and loaded at a stress level below the yield stress. Qualitatively,
this result agrees with findings of the present work (no cracking without plastic strain). However, the
situation may change with increasing doses [19]; after ~40 dpa, cracking was observed at ~40% of the un-
irradiated yield stress (results not presented here).
Figure 9. Surface of the deformed tensile bar with the strain levels shown (A-alloy).
~0 ~4.3% ~0.6%
No cracking, channels only
Crack coalescence
Single channels
Crack initiation and growth
Local strain increase

Figure 10. (a) Cracks C1 and C2 demonstrate a tendency to coalescence via ductile or transgranular fracture
(white arrows) of the bridge area (B); (b) image showing a high degree of plastic strain and channel density at
the blunted crack tip. Note also oxidized grain boundary (black arrow).
3.5 ANALYSIS OF THE SPECIMEN CROSS SECTION (A-ALLOY)
Figure 11 shows a typical crack observed at the cross section of the A-alloy specimen. The IG character
of the crack is visible in cross section, and cracked GB segments can easily be traced. At this particular
GB, at least five GB segments were involved, causing a crack depth of ~80 m, before blunting.
A small secondary crack (“S” in Figure 11) ~30 m in size formed at the bottom of the initial crack. It
may be speculated that the crack opening created some specific conditions favorable for the initiation of
secondary cracking. An alternate explanation is the crack blunted, or its propagation rate decreased after
reaching a triple junction point capable of resisting further crack propagation.
As shown in the histogram in Figure 11, the observed cracks had a nominal depth of 20 to 80 m, with an
average of 70 m. This corresponds to nominally one to two grain lengths, but most cracks included three
or more cracked GB segments. Cracks located in the neck, not far from the fracture point, had the largest
depth of ~120 m. The average crack depth of ~70 m and typical crack length of ~150 m suggest a
semielliptical shape of the cracks. One can assume that crack depth increased with local strain level, but it
is difficult to establish a direct connection between these parameters. Also, for most cracks, the
inclination angle was between 60 and 90, nearly perpendicular to the tensile axis.
Figure 12 shows few cracks at the specimen fracture surface after the test. Two intergranular (IG) cracks
of limited depth (≤100 m) can be seen, which is close to the average values observed in the cross
section. Although there was a tendency for crack depth to increase with local strain, high stress and strain
at the growing neck did not lead to a significant increase in the depth. Spots of TG fracture were observed
and believed to form during crack coalescence.
Additionally, the known crack depth allows the crack propagation rate to be estimated. Earlier it was
found that crack initiation required some local plastic strain (~0.6%), so the cracks most likely formed
only after yield stress was reached. The time required to strain the 10.2 dpa A-alloy specimen from yield
stress to fracture was about 8.5 × 10⁴ s [3]. Accepting an average crack depth of ~70 m, the growth rate
for observed near-surface cracks may be estimated as ~8 × 10⁻⁷
mm/s. This estimated value is
unexpectedly high for PW conditions. A value near ~2 × 10⁻⁹
mm/s should be expected [4], taking into
account the potential value (−0.860 VSHE), whereas the rates of 10−6
to 10−7
mm/s are typical for +0.2
VSHE [4]. However, most crack growth rate data have been obtained for deep cracks under known stress
a b
C1
C2
B

conditions. It may be concluded that the studied near-surface cracks appeared and deepened relatively
quickly.
Figure 11. An intergranular crack in a 10.2 dpa A-alloy.A view of the specimen cross section is pictured on the
left, and the crack depth distribution is on right. GB is an example of the cracked grain boundary segment. S
represents a secondary crack, most likely filled with oxide products. CERT evaluations were completed in PW
conditions.
Figure 12. Cracks observed at the fracture surface for both alloys. TG = transgranular, and IG = intergranular.
3.6 EBSD ANALYSIS NEAR INTERGRANULAR CRACKS
Grain orientation with respect to the tensile axis influences the elastic properties of the grain [20], its
Schmid and Taylor factors, and other properties, such as a propensity for phase transformation and
twinning [7]. Local grain configuration may lead to local stress and strain variations [20], which in turn
may impact crack initiation. For this project, grain orientation was analyzed in the crack vicinity for both
alloys using EBSD.
0 40 80 120 1600.0
0.5
1.0
1.5
2.0
2.5
3.0
Coun
t
Crack depth, microns
A-alloy SW-alloy
surface
bulk
GB
GB
Blunting ~80 m
S
~100 m
IG
Ductile TG
~70 m

Figure 13 shows an example of the crystallography data for a representative crack in the SW-alloy. The
crack consisted of two GBs. The full length of the G1–G2 GB was cracked, while the G1–G3 GB only
experienced partial cracking. Partial boundary cracking was seldom observed, and most cracks stopped at
triple junction points. The crack-adjacent grains (G1–G3, Figure 13) were oriented close to the center of
the unit triangle. Grains not involved in cracking tended to group near the [001]-corner.
For the crack presented in Figure 13, a number of dislocation channels were present in the surrounding
grains. Channel #1, which did not penetrate the G1–G2 GB, likely served as a crack initiator. This channel
formed a pronounced step at the GB (see the corresponding SEM image); however, no plastic strain was
observed adjacent to this channel in the G2 grain. Interestingly, if the channel penetrated the GB, an area
with high local misorientation may form (Figure 13, Channels #2 and #3), suggesting a high local density
of dislocations. The grain reference orientation deviation (GROD) parameter value may reach ~23–24 or
up to 3–4 per μm, values which are consistent with small strain testing on AISI 304 steels in a
noncorrosive environment [21]. Areas with a high local GROD parameter may demonstrate twinning, cell
structure formation, and—for the case of room temperature deformation—martensitic transformation
[21]. Also, an area with a local increase in GROD parameters (up to ~7–9) present in the G3 grain close
to the crack termination point (the dashed oval in Figure 13) corresponds with the location of crack
blunting.
There are three possible interactions between a channel and a GB: penetration with the formation of GB
step, channel absorption with GB sliding, and dislocation pileup formation [22]. Dislocation pileup occurs
when the channel cannot penetrate the GB and produces a high-stress field near the GB. It is difficult to
measure the stress intensity directly at the interaction point; however, recent work was capable of
determining the stress distribution near channel-GB intersection by using finite element modeling [20],
and some recent approaches using EBSD have measured the acting stress directly [18]. It was shown that
the acting stress might exceed the applied external stress by a factor of two or three.
Dislocation pileups may promote microcrack formation by coalescing dislocations piled along a slip plane
[22]. In irradiated austenitic stainless steels, IG fracture may occur without an inert environment such as
argon. IG fracture in argon is sensitive to temperature and especially to strain rate, demonstrating its
dependence on the deformation processes [13]. Channel-induced surface steps were commonly observed
for one or both grains adjacent to a cracked GB [13]. In the present work, steps caused by dislocation
channels were observed at the surface of cracked GBs (Figure 13). This observation indicates a possible
connection between localized deformation and IASCC.
Previously, a correlation between localized deformation and IASCC in a water environment was
examined for proton-irradiated austenitic steels for various material compositions and irradiation
conditions [12, 18, 23]. It was clearly shown that IASCC susceptibility (quantified as crack length per
unit area) increased as the degree of deformation localization increased (measured as the average step
height of the slip channel on the surface). IASCC susceptibility was found to correlate with the slip line
(channel) dis/continuity at GBs [18] and with the Schmid factor [12, 23].

Figure 13. EBSD-acquired information for a typical crack in an SW-alloy. IPF colored in the tensile direction,
IQ, GROD, and Schmid factor (Sf) maps with corresponding 70° titled SEM image. The unit triangle at the right
shows the orientation of G1–G7 grains in the crack vicinity relative to the tensile direction. Solid circles are grains
adjacent the crack, and open circles are grains not involved in cracking.
The role and contribution of deformation localization in the IASCC process may not explain the results of
IASCC tests under constant load since failure stress in these tests can be as low as ~0.5 of the yield stress.
However, recent EBSD measurements in 73 dpa irradiated cold-worked 316 steel showed that loading to
~50% of the yield strength caused detectable misorientation evolution and plastic strains near GBs [24].
Channel formation below the yield stress has also been observed in many other studies. For instance,
Edwards et al. [16] conducted a detailed investigation of copper irradiated with neutrons that deformed at
different strain levels. Defect-free channels were observed in the copper samples loaded at 270 MPa or
84% of macroscopic yield stress (~320 MPa) [16]. At conventional strain rates of ~0.0001 s-1
, the
formation of channels on the surface of the 4.4 dpa irradiated 304L steel specimen was observed at 72%
of yield stress [25], although channel height was ~40 nm (roughly 150–300 dislocations); hence, smaller
channels may form at lower stress.
The observation of deformation at stresses below the yield strength is not surprising when considering
finite element analysis (FEA) results determined by Kamaya et al. [26], who found that the maximum
stress near GBs may be 1.5 times larger than the applied external stress. Therefore, plastic strain in some
grains may be initiated at 66% of the yield stress. Moreover, using Gumbel statistics, it was suggested
[26] that the maximum stress on the surface might be ~2.22 of the applied stress. Therefore, signs of
plastic flow at the surface may appear at 45% of yield stress. More evidence is needed to correlate IASCC
initiation with deformation localization.
IQ GROD #2
#3
#1
G3
G1
G4
G2
G7
G5 G6
Sf SEM
#3
#1
#2
IPF
G3
G6 G5
G4
G2
G7
G1
Strain direction

3.7 THE ROLE OF GRAIN ORIENTATION ON CRACK INITIATION
Examples of cracked GB pairs are given in Figure 14. Taking this database into account, it appears that
crack initiation is not a random process. Grain orientation strongly influenced the appearance of stress
corrosion cracks. In small strain areas (~1.3%), one or both grains adjacent to the cracked GB were
oriented close to the center of the unit triangle. Such orientation corresponds to the grains with a high
Schmid factor (~0.47 or more), which are easy to deform. In about 50% of cases, the second grain was
oriented close to the [111] corner, indicating a low Schmid factor. Grains oriented close to [001]- and
[101]-corners were the least involved in crack initiation at low strain levels.
This behavior was less apparent in longer cracks. Figure 15 shows a relatively large crack and the related
grain structure where the local strain level was ~2.3%. Crack (L) has two smaller cracks nearby that were
assumed to be satellite cracks formed in the high-stress area near the main crack. The IPF shows the
orientation of cracked GB pairs relative to the stress direction. All cracked GB pairs were oriented along
the [001]–[111] line. Compared to the crack initiation stage discussed above, the grains oriented close to
the [001]-corner were involved in the crack growth process (Figure 15). It is difficult to define an exact
crack initiation location since no in situ data are available. However, a reasonable conclusion can be made
by analyzing the crack width. Segments “c” and “b” were the locations with the widest crack opening.
Thus, these segments are most likely the crack initiation locations. Both segments include one grain with
an orientation close to the [111] direction (i.e., grains with a low Schmid factor).
Few cracks analyzed in detail (Figure 13, Figure 15) demonstrated grain orientation patterns in the
vicinity of small and long cracks. To analyze the role of grain orientation, the unit triangle was arbitrarily
divided into four areas and designated as [001], [S], [111], and [101] (Figure 16). The [001]-area
contained grains oriented close to the [001]-corner and with the lowest elastic stiffness [31]. Grains
oriented close to the [111]-corner had the largest elastic stiffness and the lowest Schmid factor. Grains
from the [S]-area were mainly the softest grains with a high Schmid factor.
After analyzing about 400 grains in the SW-alloy, the [001]-partition contained ~11% of all grains (48 of
418, Table 3). Only two of the 64 cracked grains belonged to this partition (~3%). Thus, the cracking
intensity, which is the ratio of the cracked grain fraction to the grain fraction for the given partition, for
this partition was 3/11 or ~0.27. In other words, these grains were not often involved in cracking. The
same conclusion was drawn for the [101]-partition, which has a cracking intensity of ~0.443. The largest
cracking intensity was observed for grains belonging to the [111]-partition. These grains were involved in
crack initiation approximately six times more frequently than grains from the [001]-partition (Table 3).
Many cracks were initiated at grain boundaries that included only grains from the [S]-area, the softest
grains.
The A-alloy demonstrated a very similar distribution of grains inside the partitions (Table 3). The fraction
of grains in the [111]-partition was slightly higher than that of the SW-alloy (~0.31 vs. ~0.24), which may
be explained by either limited statistics or the difference in material texture. No cracked grains from the
[101]-partition were observed for the A-alloy, and the general result was close to the SW-alloy: most
cracks formed at grains belonging to [S] or [111]-partitions, and [101]- and [001]-partitions were less
frequently involved in cracking (Table 3).

Figure 14. Crystallographic orientation of cracked GB pairs relative to the tensile axis in an A-alloy
specimen. The estimated strain level at the analyzed area was ~1.3%. Only short cracks (1–2 GBs) are shown.
The role of grain orientation on the initiation of stress corrosion cracking (SCC) is not widely discussed in
the literature. For neutron- and ion-irradiated austenitic steels, a number of papers were published [4, 18, 23]
focusing on the analysis of the difference in Schmid and Taylor factors between cracked and noncracked
grain pairs. It was established [23] that grain pairs with a high Schmid factor mismatch are more likely to
crack than pairs with a low one. This concept—the role of local grain Schmid and Taylor factors—is based
on the close connection between localized plastic strain, dislocation-GB interaction, and SCC [1, 12].
Indeed, the largest Schmid factor difference will be observed between grains from [S]- and [111]-partitions
(Figure 16). In many cases, crack formation included grains whose orientation was close to the [111]-corner
(Figure 14, Figure 15), underlining the importance of concepts based on the Schmid factor.
Figure 15. Grain orientation data for a relatively large crack (L) in an A-alloy. (a) [010]-IPF map overlapped
with SEM image. (b) [010]-IPF, [010]-load direction. A–f represent segments of crack L.S1 and s2are small satellite
cracks. Question marks designate grains for which orientation cannot be defined because of heavy surface damage.
The local strain value is ~2.3%.
However, this concept may not allow analysis of the difference in cracking behavior between grains
belonging to different areas of the unit triangle (Figure 16). For instance, many grains from areas [001],
[101], and [111] have comparable Schmid factors (~0.41–0.44), but grains from the [111] area are more
often involved in crack initiation than grains from [001]- and [101]-areas (Table 3). Grains with the exact
a
a
b
b c
e
d
d
c f
f
?
s1
s2
?
L
e s1
s2 ?
a b Strain direction
G1
G2
Crack

[001] and [101] orientation relative to the tensile axis will have a Schmid factor of 0.408, and grains with
a similar Schmid factor obviously will present in [111]-area; however, cracking behavior (i.e., the
probability of cracking) will be different. Thus, a pure “mechanistic” hypothesis based on the Schmid
factor may not sufficiently describe the grain orientation role in SCC. On the other hand, crack initiation
often required at least one “soft” grain from [S]-area with a high Schmid factor (Figure 14, Figure 16),
further suggesting the possible role of plastic strain in crack initiation.
Figure 16. A scheme of the unit triangle partitioning. Blue dots show average grain orientation data for one of the
scans performed for the SW-alloy (~160 grains in this particular scan). Red-filled circles reproduce the orientation
of grains adjacent to the cracks. Five randomly selected cracks are shown, one of which included four GB pairs.
Dashed lines show the areas with high (0.49) and moderate (0.408) Schmid factor values. Grains with the exact
[001]- and [101]-orientations had a Schmid factor of 0.408, and a number of grains with the close Schmid factor
value belonged to [111]-area.
Table 3. The role of grain orientation on cracking
Partition Grains in
partition Fraction
Grains
involved in
cracking
Cracked
Cracking intensity
(Fraction involved in
cracking/Total
fraction)
SW-alloy
[001] 48 0.115 2 0.030 0.272
[S] 210 0.502 36 0.563 1.120
[111] 101 0.242 22 0.344 1.423
[101] 59 0.141 4 0.063 0.443
Total 418 – 64 – –
A-alloy
[001] 36 0.161 4 0.114 0.708
[S] 94 0.422 19 0.543 1.288
[111] 70 0.314 12 0.343 1.092
[101] 23 0.103 0 0 0
Total 223 – 35 –
[S]
[001]
0.49
0.408 [111]
[101]

4. PLASTIC DEFORMATION MECHANISMS DURING STRAINING IN HIGH-
TEMPERATURE WATER
4.1 INTRODUCTION
High-dose neutron irradiation and postirradiation deformation of metallic polycrystals leads to
deformation localization and the formation of dislocation channels. It is generally accepted that the
majority of plastic deformation occurs in dislocation channels, and the characteristics of these channels
depend on the type of material, grain orientation and size, and stress and strain levels. Most often,
channels are free or exhibit a reduced density of radiation-induced defects; however, in some cases they
contain dislocation debris at channel intersections and dislocation pileups near GBs.
The mechanisms of defect-free channel formation are widely discussed in the literature, but the full nature
of the mechanisms remains unknown. For instance, channels formed in typical 300 series austenitic steels
during deformation at relatively low temperatures may contain deformation twins but also may be twin
free, but the influence of grain orientation was not studied in detail for irradiated material. One may
expect that high acting stress will eliminate or reduce grain orientation role, compared to the non-
irradiated steel of the same composition, and that twins will form even in unfavorably oriented grains. In
general, twinning is an expected deformation mechanism for 300-series steels strained at room
temperature. But, as temperature increases, twinning may be suppressed as a result of increases in
stacking fault energy (SFE), which is one of the key parameters controlling twinning.
Twinning is usually not considered an acting deformation mechanism for slow-strain rate tensile
experiments (SSRTs) in a corrosion environment because of the relatively high temperature (~300C) and
low strain rate (~10-7
s-1
). However, while investigating irradiated 304 steel, Onchi et al. [27] observed
deformation twins in the specimens deformed at 290C in an inert gas environment. Thus, twinning
cannot be directly ruled out in high-temperature environments and may contribute to dislocation channel–
GB interactions.
Moreover, Onchi and coauthors [27] studied 304 steel with 9.4% Ni and 18.6% Cr, and the deformation
twinning was observed at the reactor service temperature. The materials studied in the present work had
slightly higher Ni content (+1% for SW and +1.4% for the A-alloy compared to [27]); Cr content was
increased in the A-alloy from ~18.5% to ~20% (Table 1). Since the increase in Cr and Ni content leads to
an increase in stacking fault energy (SFE), twinning might have disappeared in one or both materials
studied in the present work. Thus, it was important to analyze the acting deformation mechanisms in the
studied high-irradiated steels. Additionally, the same materials were tested in different environments
(PW, NWC, see Chapter 2) at slightly different temperatures, which may be more important for different
hydrogen concentrations. Hydrogen is known to influence deformation localization processes and, likely,
SFE. So, it was important to compare the same materials in different environments.
Section 4 describes the results on the deformation mechanisms acting during CERT evaluations in high-
temperature water.
4.2 DEFORMATION MECHANISMS IN THE AS-19 SPECIMEN
The AS-19 specimen was selected for cross-sectional preparation. This specimen was subjected to CERT
evaluations under PW conditions (Section 2.1). The material was irradiated in the BOR-60 fast reactor to
10.2 dpa. A cross section (Figure 17) of the gauge portion was prepared by mechanical grinding and
polishing followed by electropolishing. The electropolishing fully removed any damage, scratched, and
cold work related to mechanical grinding and provided a cold-work-free surface. The cross-sectional
plane was close to the middle axis of the specimen.

Figure 17. General view of the AS-19 specimen cross section after electropolishing. The specimen end (black
arrow) was damaged by the electropolishing grips.A few dust particles are present on the surface; unfortunately,
cleaning with dusters was not allowed the microscopy room, which is located outside of the standard radiological
facilities. The locations designated by F and S are analyzed in detail below.
Notably, the deformed portion of the specimen (neck) had areas with different strain levels. The local
strain level may be estimated by diameter measurements, which is discussed in detail in Section 2.4.
Hence, the structure at each location may be related to local strain and stress conditions.
A number of scans were performed at the AS-19 specimen cross section. All expected deformation-
induced features were revealed in the structure: high- and low-angle grain boundaries; twin boundaries;
dislocation channels, which were clearly visible in IQ maps as grey lines; and ferrite inclusions. Several
of the most interesting observations are discussed below.
Figure 18 shows typical high-resolution EBSD scan performed in the deformed area. The step size
(125 nm) is close to the EBSD resolution limit, which is determined by the beam-specimen interaction
volume (approximately 80 nm by 150 nm at 20 kV). Further decreases in step size may provide a better
image but will not necessarily provide any more significant details.
In Figure 18, three austenitic grains (#1–#3) and one small ferrite grain (F) can be seen. The austenite
grains have strong internal misorientation, which is especially pronounced in grain #1. The local
orientation may differ up to ~20 from the average grain misorientation. See the GROD map in Figure 19.
The grain is highly fragmented and may be considered subgrains divided by dislocation boundaries, but
these boundaries are, as a rule, broken and do not form an enclosed area. The kernel average
misorientation (KAM) map also shows numerous points with high local misorientation relative to the
matrix (the orange and red “spots” in Figure 19). Comparing IQ (Figure 18) and KAM (Figure 19) maps,
it is easy to see that high local misorientation spots mainly formed at channel intersections. Dislocation
channels also correspond to the sharp variations of the GROD value (compare maps in Figure 18 and
Figure 19), suggesting a high local density of dislocations.
F S

Figure 18. EBSD IPF, IQ, and Phase maps taken with 125 nm step in the deformed area. The face-centered
cubic (FCC) phase is pictured in red, and the body-centered cubic (BCC) phase appears in blue. Two patterns for
FCC and BCC are also shown (right bottom).
Figure 19. Grain Reference Orientation Deviation (GROD) and Kernel Average Misorientation (KAM) maps
for the area depicted in Figure 18. The inserted color scales are different for each map.
The nature and origin of the ferrite grain are not clear; it may be retained ferrite that was present after
material preparation. However, it may be also radiation-assisted ferrite formation. At the moment, there is
Phase
IPF + IQ IQ
#1
#2
#3
F
GROD KAM

no way to answer this question. Interestingly, this small ferrite grain is almost free from visible signs of
plastic strain, and its GROD value (Figure 19) is much lower compared with the austenitic grains. The
KAM parameter shows some weak increase. This suggests that ferrite was less involved in plastic
deformation, probably due to its high strength level compared with austenite.
Figure 20 depicts unusual details found in one of the EBSD scans. One of the slip line channels
propagated in a different direction from the [111]-plane projection. This detail immediately attracted
attention, and a high-resolution scan was performed at the same location. It appeared that the feature had
a strain-induced nature (pronounced local misorientation gradients were observed) but was lying outside
of the known [111]-slip planes.
Figure 20. An unexpected channel-like structure not following the [111]-plane. This feature is depicted by the
dashed line in the left image. The formation the black arrow points to is believed to be an annealing twin. The black,
dashed lines in the top right image show the speculated zig-zag pattern of the slip band propagation.
Due to the limited EBSD resolution, further TEM analysis may provide the exact answer. However, in the
first iteration, it may be speculated that the unusual (“illegal”) slip direction is caused by a zig-zag pattern
of dislocation movement. It appears that at least some segments of this specific formation followed one of
the [111]-planes (Figure 20, top right).
4.3 TWINNING IN DISLOCATION DEFECT-FREE CHANNELS (AS-19 SPECIMEN)
Some EBSD scans revealed wide and pronounced deformation bands with well-defined boundaries A
typical example is shown in Figure 21. The analysis of the band (channel) its orientation, and
corresponding pole figures demonstrated that the observed feature is a deformation twin with specific 60
misorientation relative to the matrix. A few smaller twins were observed in the same area (for instance,
twin B in Figure 21) Most likely, other channels contained twins that remained unresolved by EBSD.
IPF + IQ
“illegal” trace
“legal” (expected) [111]-plane traces
GROD

Figure 21. Deformation twins in the AS-19 specimen. IPF-Map is colored in the tensile direction. Pole figures at
the right show orientation of large (A) and small (B) twins relative to the parent matrix. MA is the area with some
misorientation relative to the matrix.
The twin boundary is also clearly visible in the IQ map (Figure 22). Instead of displaying expected
deformations the twin boundaries display a weaker contrast in the IQ map compared to ordinary slip lines
and channels.
Figure 22. IQ and GROD maps for the area depicted in Figure 21. Black arrows point to the contrast in the IQ
map at the twin boundary.
Deformation twins were found in the A-alloy, which was thought to be more stable to twinning than the
SW-alloy and 304 steel studied by Onchi et al. [27]. Concerning the strain level and its role on twin
formation, it was important to analyze the area with higher strain that was located close to the fracture
area to compare it to the weakly deformed area with much smaller channel density.
Twin A Twin B Parent
Twin A Twin B
Parent
MA IPF + IQ
IQ GROD

Figure 23. The structure (EBSD IPF, IQ, GROD, and grain boundary network maps) for the F-area (see
Figure 17) located close to the fracture point. Deformation twins are shown by white arrows in the IPF map. M
represents an area with high local misorientation (not twins). #1, #2 designate austenitic grains. In the GB map,
black color represents random high-angle GBs. Twin boundaries are red, and random low-angle GB are teal.
Figure 23 shows the structure of material close to the fracture point (F in Figure 17). The IQ map
demonstrates numerous dislocation channels, and the IPF map shows a number of deformation twins. In
this area, twins were relatively wide, up to ~0.5–0.7 m, most likely caused by high local strain levels.
The width of the twins is higher compared with the width of defect-free channels observed in the structure
by numerous authors (usually, 20–50 nm). Also, twins were observed in grain #1 (Figure 23) but not in
grain #2, suggesting that a strong orientation effect on twin formation still existed at the high
temperature/slow strain rate conditions studied.
Figure 24 shows the structure of the AS-19 specimen far from the fracture point (S-location in Figure 17).
The IQ map demonstrates numerous dislocation channels, and the IPF map shows a wide variation of
color (orientation) within one grain. In some cases, the local in-grain misorientation may reach ~22°,
suggesting a high local density of dislocations. However, compared to the location F (Figure 23), the
observed twins are very small, on the edge of the EBSD detection limit. The length of the twins is about 1
µm or less and the width is ~200–250 nm.
GROD
IPF + IQ IQ
GB network map
M
M
T T T #1
#2

Figure 24. The structure (EBSD IPF, IQ, GROD, and grain boundary network maps) for the S-area (see
Figure 17) located far from the fracture point.Deformation twins are indicated by black arrows in the IPF map. M
represents an area with high local misorientation (not twins). In the GB map, black color represents random high-
angle GBs, red represents twin boundaries, and teal represents random low-angle grain boundaries.
4.4 TWINNING IN SW-36 SPECIMEN
Unlike the AS-10 specimen, the SW-36 specimen was deformed in the NWC environment without
dissolved hydrogen. Since this environment is more aggressive than PW, crack initiation occurred
quickly, and the specimen fractured with a significant IG% value [3]. However, some plastic strain
preceded the cracking and fracture, providing the opportunity to analyze the acting deformation
mechanisms.
A few FIB lift-outs were performed at different locations to analyze the surface oxide layer morphology,
the fine structure of dislocation channels, and the initiation of possible cracks. Dislocation channels were
clearly visible at the surface, and their density varied from location to location. Compared with the PW-
tested specimens, the SW-36 specimen had a more distorted shape, and it did not allow accurate strain
estimations.
GROD
IPF + IQ IQ
GB network map
M
M

Figure 25 shows an example of the near-surface structure in the SW-36 specimen. The surface was
covered with a relatively thick oxide layer (0.5–1 µm compared with 50–200 nm for the PW-tested
specimen), and the layer masked many surface features, hiding the channels and possible small cracks.
The sample demonstrated numerous defect-free channels in one of the grains (#1). The second grain (#2)
also showed channels, but they are not visible in Figure 25 because of the grain’s orientation. Some
channels demonstrate specific inclusion-like elongated elements, which are likely areas fenced by
dislocation boundaries from the parent grain. Further analysis using diffraction-based techniques is
needed to verify the structure of these inclusions.
Figure 25. Bright field STEM image for the SW-36 specimen subjected to CERT evaluations under NWC
conditions.
“Hot spot”
GB
“Inclusions” in channel
Channel
#1
#2
Bright Field STEM
Oxide
layer

Figure 26. Bright field TEM for the area depicted in Figure 25, Grain #1. Twinning spots were observed when
tilted to the [110] zone axis in selected area diffraction patterns (DP2). Twinning spots were not observed in DP1
(out of the channel).
Figure 26 shows the TEM bright field image of the first grain (#1) depicted in Figure 25. A selected area
diffraction (SAD) pattern obtained from the area without a channel (DP1) demonstrated a [011] orientated
austenite diffraction pattern. However, the diffraction pattern for the area with a channel (DP2 in Figure
26) reveals both matrix and twin reflections (small satellite reflections in DP2). This suggests that a
deformation twin is present in the analyzed channel. Other channels in Figure 25 also demonstrated
similar contrast and SAD pattern behavior, suggesting the twinning observed was not a singularity in the
observed grain.
At the moment, the orientation of grain #1 relative to the loading axis is not known; more statistics are
needed to populate the unit triangle showing the role of grain orientation on twinning. Nevertheless,
twinning is confirmed as an acting deformation mechanism during CERT evaluations under NWC
conditions.
5. PECULIARITIES OF THE CORROSION DAMAGE IN SPECIMENS TESTED IN HIGH-
TEMPERATURE WATER
5.1 INTRODUCTION
IASCC is a complex process with many contributing factors including microstructural and microchemical
changes induced by irradiation. Under deformation conditions, irradiated austenitic steels exhibit defect-
free channels that provide a pathway for dislocation motion during straining. When a dislocation channel
reaches a free surface, a surface step is formed, and these steps can lead to a rupture in the protective
oxide film and promote local corrosion. At the same time, surface steps lead to a significant concentration
of stress, which may influence corrosion processes. Therefore, it is of interest to evaluate this
phenomenon and determine its interplay with other known IASCC mechanisms.

5.2 MORPHOLOGY AND APPEARANCE OF CORROSION PRODUCTS ON SPECIMEN
SURFACE (SW-ALLOY)
The appearance of the specimen surface in the SW-alloy in the as-tested condition is shown in Figure 27.
The oxide particles formed at the surface were 0.2 m in size and had irregular or tetrahedron-like shapes.
The particles away from cracks or large dislocation channels were uniformly distributed on the specimen
surfaces. It is widely known that stainless steels exposed to high-temperature, high-pressure water form
protective surface oxide layers with a duplex structure. The oxide layers consist of a fine-grained inner
oxide and an outer layer of oxide particles. The outer oxide morphology observed in the present work is
similar to that described in [28] for an alloy with 20.0 wt.% Cr and 13.7 wt.% Ni.
Larger particles or increased particle density was often observed in the vicinity of surface crack tips,
indicating there are local variations in the corrosion process (Figure 27a). Also, oxide morphology near
certain dislocation channels was different, indicating the presence of erosion along the channel length.
SEM imaging performed in backscattered electron (BSE) mode (Figure 27b) demonstrated that channels
often appeared darker than the surface, suggesting the presence of light elements and oxides along the
channel. The BSE-contrast may also be caused by surface relief, but many channels were almost invisible
in secondary electrons. Nevertheless, they were visible in BSE mode, indicating the presence of a thicker
oxide layer. FIB lift-outs were performed to confirm the observations made using SEM. The two different
oxide-channel morphologies were investigated using STEM to determine the depth and extent of the
corrosion-induced layers (Figure 28).
Figure 28a shows a channel with erosion (i.e., attack) at the base of the surface step. Two different oxide
morphologies are noted. The first is a Cr-rich oxide along the unperturbed surface and at the top of the
erosion pocket, and the second is a Cr-depleted oxide protruding into the base metal at the bottom of the
erosion pocket. Regions of Ni-enriched metal can be observed at the metal oxide interface. Figure 28(b)
shows a channel without an erosion pocket and single oxide composition, which is similar to the Cr-rich
oxide observed in the unperturbed regions of the sample in Figure 28(a). Similar regions of Ni enrichment
can be observed at the metal oxide interface for both channel types.
The local corrosion damage associated with defect-free channels shown in Figure 28a may be explained
by oxide protective film breakdown (PFB). As the channel grows, the repeated breaking of the Cr-rich
protective oxide film may cause fresh metal to be exposed, resulting in significantly higher corrosion rates
than a fully adherent oxide layer. The mechanical stress resulting from step formation and local corrosion
may result in the formation of deep corrosion tunnels and cracks [29]. The PFB hypothesis was criticized
by Gutman et al., and consequently, an alternate stress-driven dissolution explanation has been offered
[30]. The selective character of such localized corrosion may be connected to the channel propagation and
growth rate, orientation, surface channel height, or other factors But, a detailed analysis requires
additional experiments with in situ analysis of the channel propagation and cracking, a technique not
currently available at the time of this study.
Cross-sectional STEM-EDS was capable of identifying the complex oxide morphology and
microchemistry in a limited number of channels. To gain further information and statistics, oxide-cleaned
samples were examined for channel erosion using SEM analysis, as shown in Figure 27. Cleaned
channels with erosion pockets were ~0.2–0.4 µm wide and ~0.2–0.5 µm deep. Interestingly, channels
inside the stress corrosion crack did not show this type of erosion. Similar forms of corrosion were
observed in non-irradiated 304 steel after exposure to simulated PWR conditions [32] and in cold-worked
316L steel [33]. Although there is no direct confirmation, it seems likely that channel oxidation may be
one of the driving forces of crack formation, including TG cracks (Figure 29).

Several attempts were made to investigate the oxide metal interface near or at crack tips using cross-
sectional STEM-EDS, but all cracks investigated exceeded the typical depth range of the FIB lift-out
technique (~10 µm) and therefore could not be examined in the same manner as the dislocation channels.
Figure 27. (a) Localized oxide distribution near a crack initiation site in the SW-alloy.The dashed oval
highlights local variations in oxide particle morphology. (b) An SEM-BSE image of the specimen surface. Black
arrows point to channels, and a few cracks are visible on the right side. Both images show the as-tested surface
without oxide cleaning. The BSE image was provided by K. Stephenson.
Figure 28. High-angle annular dark field (HAADF) image, EDS element maps, and color-overlay maps of two
dislocation channels.(a) Shows localized erosion at the base of the surface step, and (b) shows a dislocation channel
with the limited attack at the base of the surface step. In the HAADF images, the channel location and direction are
highlighted as the composition contrast limits their visibility in this particular imaging mode.
Tensile direction
b)
a)
a b

Figure 29. (a) Enlarged view of the cracked grain boundary and slip lines at the surface. One can see surface
steps caused by dislocation channels (black arrows). The surface is eroded along the channels (white arrows). Local
strain ~1.3%. A-alloy. (b) Surface relief example for non-irradiated commercial 304 steel strained at 1% at RT and
strain rate 10–3
s–1
(for comparison). The slip line density is higher and the height is lower compared with the
irradiated case. Images (c) and (d) are examples of transgranular cracks (pointed by arrows) for (c) SW- and (d) A-
alloys.
5.3 ANALYSIS OF IN-CRACK CORROSION PROCESSES
The available literature about in-crack oxidation in neutron-irradiated austenitic steels is relatively
limited. Only a few cases have been analyzed in detail in the open literature. For instance, Bruemmer and
Thomas [34] conducted high-resolution TEM analysis of stress corrosion cracks in 316L and 304L steels.
The cracks formed under boiling water reactor (BWR) conditions, and one of the specimens was obtained
from an in-service part that had been irradiated to 1.4 dpa.
The existing research [34] focuses on the analysis of oxide inside cracks and at the crack tip located far
from the crack mouth. It was established that narrow cracks were filled with Fe-rich spinel oxide, and Cr-
rich spinel formed along the crack wall [34]. Ni-enriched regions were present along the metal-oxide
interface; additionally, copper enrichment was observed along the metal-oxide interface. The crack tip
was enriched with Ni. Areas close to the crack tip demonstrated a high degree of local strain. Deformation
twinning and signs of martensitic transformation were observed as well.
Tensile direction a b
c d

Taking the limited literature data into account, it was important to conduct a detailed analysis of the
cracks on the near-surface layer. As discussed previously, the crack propagation rate was unexpectedly
high, at least to the depth of ~80–100 m. It was interesting to analyze the structure and composition of
oxide layers inside such shallow near-surface cracks (i.e., depths of less than 10 m) in a 4.4 dpa
irradiated SW-alloy and compare the results with the literature data. One may expect some differences in
oxide layer composition because fast crack advances could be caused not just by corrosion but also by
other mechanisms, like hydrogen embrittlement.
Several FIB lift-outs were performed in an attempt to analyze oxide layer morphology and composition of
the crack tip. If specimen cross-sectioning is not considered, FIB only allows objects to be analyzed up to
a limited depth. However, the typical TEM sample height (i.e., the depth from the surface) does not
exceed 10–12 m.
Figure 30 shows the near-surface crack formed in SW-alloy specimen during CERT evaluations under
PW conditions. The crack had a total length of ~9 m and width of ~500 nm at its mouth. Instead of
being relatively short in length, the crack passed at least two GB segments, which appeared on the FIB
specimen (Figure 30). The bottom portion of the crack appeared to be almost filled with oxide below
~70–100 nm. The oxide-filled portion of the crack had a length of ~4 m. In the top, wider portion, the
crack contained open gaps between oxide films on the walls as expected.
Figure 30. Near-surface crack in the SW-alloy (commercial AISI 304L steel irradiated to 4.4 dpa) tested at
PW conditions. Some specimen loss is apparent on the left side of the crack as a result of preferential thinning of
this area during FIB preparation.
Detailed analysis of the bottom portion of the crack was conducted (Figure 31) demonstrating the
complex structure of the oxides filling the crack. The oxide structures consisted of a Cr-rich oxide next to
a Ni-enriched metal layer. The outer oxide, as shown in Figure 31, was a Fe-rich oxide that also existed
within the crack center or where the crack was filled. Based on the observed chemistries in Figure 31 and
known oxidation mechanisms in stainless steels within the tested environment, it is possible the Cr-rich
oxide was a Cr-rich spinel, whereas the crack centers possessed a Fe-rich spinel. Further work is needed
to verify the structure and chemistry (such as M3O4 spinel), including diffraction-based confirmation and
a more detailed look at the composition of the oxides, but this effort falls outside of the scope of the
Grain Boundary (GB)
Channel
Crack Tip
Free Surface
ROI/Crack

current work. It should be noted that as the crack narrowed, the width of the central Fe-enriched layer
gradually decreased, leaving the remaining Cr-rich inner oxide. In the top portion of the crack, the Fe-
enriched layer formed small, round or irregularly shaped particles ~50–200 in nm size (Figure 32). The
oxide layer thickness was not uniform along the crack length, and in some cases, the Cr-enriched oxide
penetrated the matrix, most likely following the dislocation channels.
Figure 31. The internal structure of the bottom portion of the crack shown in Figure 30. Images are formed by
joining several data sets together and blending them to form a more uniform contrast image. Because of the large
size of the crack, only regions directly adjacent to the crack were analyzed using STEM-EDS.
STEM-BF STEM-ADF STEM-HAADF STEM-EDS
Fe Cr Ni O

Figure 32. Oxide layer in the widely open (top) portion of the crack. The black arrow points to oxide penetration
in the matrix.
In the first image, the oxide layer alteration follows the same order along the crack length: crack cavity,
Fe-rich layer, Cr-rich layer, Ni-enriched metal, and parent material. However, a few exceptions were
noticed.
First, the Fe-enriched middle oxide did not necessarily form a continuous layer along the crack length. In
the bottom portion of the crack, the Fe-enriched oxide alternated with large and rough Cr-enriched
particles (Figure 33). It appears that these Cr-enriched spots formed at the intersection of crack and slip
bands (defect free channels). This observation suggests that local in-crack chemistry may be affected by
the slip line. At the moment, it is not clear if the slip line was operational once the crack had passed.
Second, the Ni-enriched area formed at the crack tip (Figure 33). The area had the length of ~200 nm and
consisted of few Ni-enriched spots. The reason for this complex tip morphology is not clear; a single Ni-
enriched spot was expected, based on [34].

Figure 33. Specific oxide morphology at the channel-crack intersection (A) and the crack tip (B).
Figure 34. An enlarged view of the crack tip shown in Figure 33.
The appearance of characteristics typical of corrosion cracking (multiple layers, Ni-enrichment at the
crack tip) suggests that the stress corrosion cracking mechanism may play a key role in crack formation
and propagation.
A
B
A
A
Ni-enriched spots

6. ANALYSIS OF PLASTIC DEFORMATION PROCESSES ACCOMPANYING CRACK
GROWTH
6.1 INTRODUCTION
Austenitic 300-series steels are widely used in the nuclear industry because of their favorable combination
of mechanical and corrosion properties and their acceptable radiation tolerance. However, this class of
materials suffers from several issues, with the IASCC susceptibility being one of the most widely
recognized problems in the LWR operating environments [4, 12, 13]. According to a common point of
view, the IASCC-related issues will become more severe with the aging of the LWR fleet; this aspect is
under active investigation in the framework of the LWRS.
Crack growth rate (CGR) measurement is a common test method to estimate the material performance in
the corrosion environment. For numerous variants of the 300-series steels, the CGR-testing allows for
detailed evaluation of the alloying additions, structure, grain boundary engineering approach, etc. on the
material behavior and crack growth rate (CGR). The main outcome of the test is the CGR value as a
function of corrosion environment parameters, temperature, and stress field. If these values are known,
engineers should be able to provide the safety margins and operational timeframe for a given system.
However, many aspects of the crack advance mechanisms in the irradiated materials are not well
investigated. Most work was conducted at a macro-level (specimen as a whole with the crack growth rate
as the key parameter) or at micro- and even nano-levels (e.g., crack tip analysis, estimation of SCC
susceptibility of different grain boundary types). However, instead of a significant and constantly growing
database on the IASCC processes and crack growth rates in the irradiated materials, post-testing structure
analysis is rarely performed, and very limited literature exists.
Moreover, there is a meso-level defined as a group of interacting grains, with typical scales from several
(10–20) to few hundred (up to ~500) m. Stress localization at the crack tip should lead to localized
deformation in the crack-adjacent grains, with grain orientation and grain boundary type influencing the
crack advance. These aspects are not well-analyzed in the irradiated steels.
6.2 STRUCTURE AND TEXTURE OF THE MATERIALS OF INTEREST
After specimen cutting and cross-sectional sample preparation, several EBSD scans were performed at the
depth of ~1.5–1.7 mm from the fracture surface, below the IGSCC area, to analyze the material structure
and phase composition. These scans covered relatively large areas (0.25 by 0.25 mm or more). It was
important to ensure that the material was annealed and that the structure was fairly uniform, without local
grain size fluctuations.
Figure 35 shows typical EBSD data for the bulk material. The scan size was 500 by 350 m, with a step
size of 1 m on a rectangular grid.

Figure 35. The grain structure of the M-alloy (MS-01 specimen). EBSD IPF, Phase (fcc: red; bcc: green),
GROD, and IQ maps. Black rectangle in the IPF map shows the location of the high-resolution scan, Figure 38.
Dashed black ovals in the Phase map show ferrite grain clusters. Black arrows point on the scratch traces visible in
the GROD and IQ maps.
Figure 36. Grain size histogram for the scanned area shown in Figure 35.
As seen in the results shown in Figure 35 and Figure 36, the irradiated M-alloy (304SS+Ti) had relatively
small average grain size, about 10 m, and a pronounced bimodal grain size distribution. Small grains
formed specific clusters and bands, and large grains often grouped together. Two phases were identified:
IPF Phase
GROD
Grain size histogram
IQ

(1) austenite, face-centered-cubic, and (2) delta-ferrite, body-centered-cubic. The amount of delta-ferrite
visible for EBSD was estimated to be ~1–1.5% (Figure 35).
The structure was found to be cold-work free. No specific signs of pre- or post-irradiation cold work was
observed. For most grains, the GROD, a common EBSD strain metric, showing local in-grain
misorientation, were below 0.1–0.2. Although some grains had a green or even orange color in the
GROD map (Figure 35), it was caused by in-grain low-angle (< 5) boundaries (LAB) leading to the
wrong GROD values. Figure 37 demonstrates the KAM map, with a different color scale compared to
Figure 35, to illustrate specific features. In this map, the LABs are visible as local, line-like features
limited by random high-angle grain boundaries. Interestingly, ferrite grains formed groups and colonies of
some kind; these grains often had larger KAM values compared to the surrounding austenite grains.
Occasional scratches, caused by abrasive particles or carbide inclusions that fell off during grinding, were
clearly visible in the KAM and IQ maps, and are thus easy to avoid during further high-resolution
scanning. Scratches usually intersected several grains and were easy to distinguish from features induced
by plastic strain (slip lines, channels). The sample surface appeared to be scratch-free and no damage was
visible with SEM, but EBSD was able to reveal scratch-related damage as a weak plastic strain in the
under-surface layer. Electropolishing removed most of the damage related to the mechanical grinding, but
the trace of rough scratches might have still survived. Longer electropolishing would eliminate these as
well, but may lead to very smooth edges and information loss.
Figure 37. Kernel Average Misorientation (KAM) map for the area shown in Figure 35. LAB: low-angle in-
grain boundaries. S: scratches. F: ferrite grain colony (compare with the Phase map in Figure 35).
S
S
LAB
LAB
F

Several additional high-resolution scans (step size of 125 nm) were performed at different locations far
from the surface to confirm structure homogeneity and examine different features of interest like ferrite
colonies. An example of a high-resolution scan is given in Figure 38. The high-resolution scan shows the
presence of very small grain (few m) which might be missed during coarse-step scanning. Additionally,
it points out the existence of very small ferrite grains in the structure.
Figure 38. High-resolution (step size 125 nm) scan of the parent material structure (far from fracture). This
scan shows the subarea of a large coarse scan, Figure 35. The KAM map shows a cold-work free structure. Black
arrow points to the scratch.
KAM = 0.145
ND-IPF Phase
IQ

Figure 39. Grain Average Misorientation (GAM) map for the area shown in Figure 38 and GAM distribution
histogram. As shown in the data, ~80% of all grains have a GAM < 0.2 and ~97% have a GAM < 0.25. Few
grains with larger GAM are present, but these are most likely artifacts (LAB inside the austenitic or ferritic grain).
Typical Gam value of the non-deformed material is 0.15–0.2. Step size is 125 nm.
6.3 CRACK BRANCHING BEHAVIOR
Crack branching was analyzed for all prepared cross-sections, including those with excessive
electropolishing and “destroyed” smooth edges. Surprisingly, no large secondary cracks or pronounced
crack branching were observed. In most cases, only the main crack existed (Figure 40). Crack branching
might be expected based on the literature data for materials with comparable levels of strength and
composition (Figure 41). If branching had existed, FIB would be used to provide objects from crack tips
for detailed microstructure analysis.
Figure 40. The enlarged view of the IGSCC area (MS-01 specimen) showing the absence of crack branching.

Figure 41. Crack branching in the cold-worked 316L steel (after [35]).
Figure 42. Secondary cracks (indicated with black arrows) in the M-alloy specimen. C: cracks with visible
connection to the main crack; I: isolated cracks, without visible connection to the main (parent) crack.
Only several small (< 40–50 m) secondary cracks were observed. In all cases these cracks were filled
with corrosion products. In two cases, the small secondary cracks appeared in the structure and had no
C C
I
I

visible connection with the main parent crack. This reveals that under some conditions cracks may
penetrate the structure without any significant crack opening; it is unclear what stress level was present at
this location. In all cases, the observed secondary cracks terminated within 20–50 m of the main crack.
FIB-TEM analysis of such cracks may be of interest for providing information on oxide morphology.
Additionally, it would be beneficial to investigate the possible strain-induced effects in the crack-adjacent
grains and in the crack tip vicinity.
6.4 EBSD ANALYSIS OF DIFFERENT FRACTURE MECHANISMS
The cross-sectional sample contained several areas of possible interest. Pre-cracking, post-test fatigue,
and final fracture areas (Figure 4) may provide information on plastic strain mechanisms acting in contact
with the crack growth area (IGSCC in Figure 4). Non-deformed areas were expected to provide a baseline
for the EBSD strain metrics like KAM or GROD. EBSD scanning conditions (working distance, beam
current, step size) and data processing methods (filtering via grain dilation) were as close as possible for
all samples to maintain data base integrity.
6.4.1 Non-deformed area
Figure 43. EBSD data for a typical non-deformed area. Scanning with 125-nm step was performed at the
depth ~2 mm from the edge. In the phase map, austenite is red and ferrite is green.
Figure 43 shows a typical EBSD data set for the non-deformed area. The IPF-map demonstrates the
absence of in-grain misorientation, and the IQ map is free of visible slip lines (dislocation channels). The
KAM map shows weak local maximums inside the ferritic grains (also see Phase map); these local
KAM = 0.139
ND-IPF Phase
IQ

maximums most likely correspond to low-angle (< 5) in-grain boundaries. The average KAM value for
the non-deformed material was ~0.14 (for the step size of 125 nm).
6.4.2 Fatigue pre-cracking area
Figure 44. EBSD data for a fatigue pre-cracking area. Step size of 125 nm. The scan was taken, approximately,
of the middle of this area. The specimen edge is clearly visible. The black arrow in the IQ map points to the area
with a local IQ decrease due to dislocation channel formation.
Figure 44 shows the EBSD dataset for the fatigue pre-cracking area. Although strong misorientation
gradients are absent in the IPF map, the IQ map reveals weak signs of slip lines, and the KAM value for
this area is large compared to the bulk (0.198 and ~0.14, respectively). The difference in KAM values
points out the existence of plastic strain in the material caused by fatigue deformation.
Interestingly, KAM values estimated for different locations within the pre-cracking fatigue area1 are close
(~0.193), which suggests the absence of strong strain gradients. Most likely, the width of the fatigue-
influenced area is larger than 50 m.
1 Location #1 at a depth of ~15–20 m and Location #2 at the average depth of ~40–45 m, Figure 44.
ND-IPF Phase
IQ
#2, KAMlocal
= 0.193
#1, KAMlocal
= 0.193
KAM = 0.198

6.4.3 Post-test fatigue
Figure 45. EBSD data set for the post-test fatigue area. Black arrows show reliable strain indications in the IQ
and KAM maps. Step size is 125 nm.
Figure 45 shows the EBSD data for the post-test fatigue. The scan was taken at a depth of ~20 m, and
the scan’s center point is located at a depth of ~50 m from the surface. One may see the plastic strain
indications in the IQ map (as gray lines and spots inside grains) and KAM map (color variations mostly
near the grain boundaries). The strain signs were most pronounced near the fracture surface (bottom edge)
and decayed with the depth. The average KAM value for the scan was ~0.20.
KAM = 0.204
ND-IPF Phase
IQ
SEM

6.4.4 Final fracture area
Figure 46. EBSD data for the fracture area.
Figure 46 shows the EBSD dataset for the final fracture area; the depth was ~15–20 m. One may see
strong misorientation (color gradients) in the IPF map, visible in-grain slip lines in the IQ map, and strong
local fluctuations in the KAM map. The KAM value reached ~0.49. Final fracture led to the most
pronounced plastic deformation, and the KAM increase was the largest for this area.
6.4.5 GROD maps showing strain localization for different areas
Figure 47 summarizes the plastic strain observations in the different areas. To underline the small strains,
the color scale was limited to a 2 maximum misorientation. As follows from the data, the bulk non-
deformed material had a very weak misorientation level with few local maximums related to the ferrite
grains (see Figure 43 for the corresponding IPF and Phase maps). Pre- and post-test fatigue cracking led
to some plastic strain, which was more pronounced in the post-test fatigue area. In this area, GROD
values often exceeded the scale limit (2) and appeared white in color. For both fatigue-cracked areas, the
plastic strain gradient appeared to decay with the depth. For the final fracture area (not shown here), the
maximum GROD reached ~16.5 (not shown here).
KAM = 0.495
ND-IPF Phase
IQ
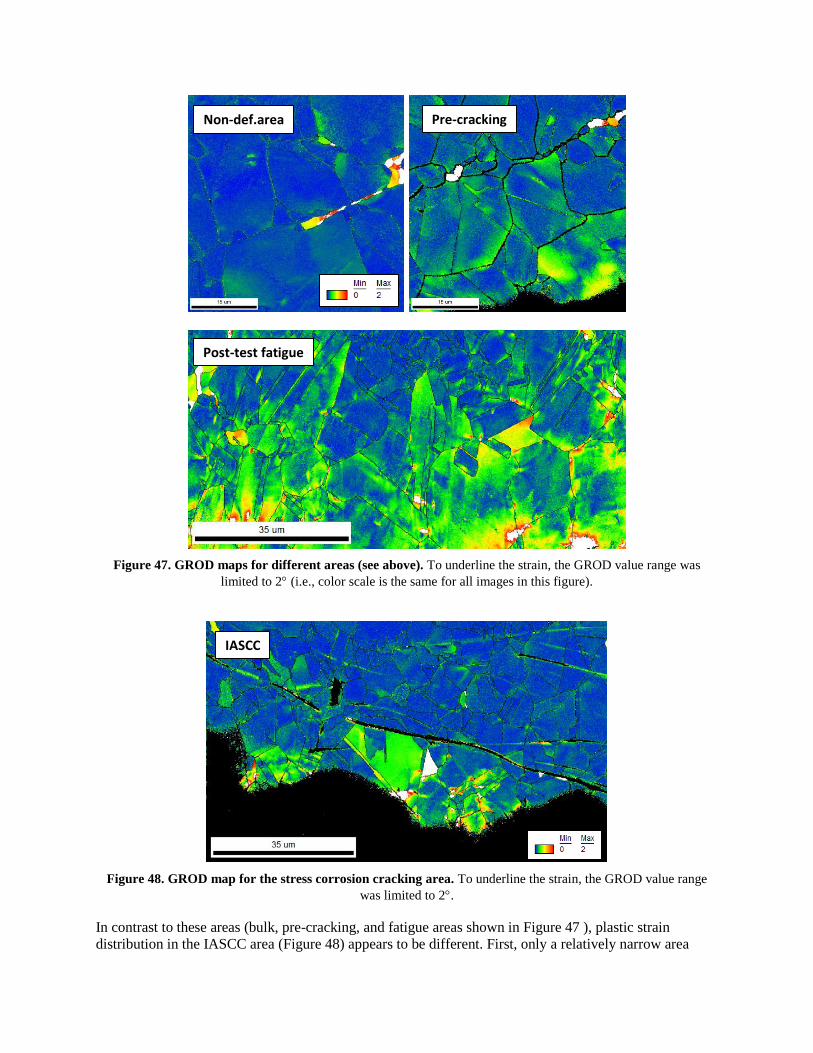
Figure 47. GROD maps for different areas (see above). To underline the strain, the GROD value range was
limited to 2 (i.e., color scale is the same for all images in this figure).
Figure 48. GROD map for the stress corrosion cracking area. To underline the strain, the GROD value range
was limited to 2.
In contrast to these areas (bulk, pre-cracking, and fatigue areas shown in Figure 47 ), plastic strain
distribution in the IASCC area (Figure 48) appears to be different. First, only a relatively narrow area
Non-def.area Pre-cracking
IASCC
Post-test fatigue

(20–25 m) demonstrated visible plastic strain. Second, the strain distribution was strongly
inhomogeneous. Some grains near the crack edge had detectable strain level, whereas the others
demonstrated no visible plastic strain signs. This finding—unexpectedly low strains with pronounced
inhomogeneity—will be discussed in detail below.
Obviously, the width of the area involved in the plastic straining should vary with external stress
conditions. Different stress intensity factor values were used in the crack growth tests; these variations
may result in different plastic zone width and plastic strain mechanisms. This issue requires additional
analysis.
6.5 STRESS INTENSITY AND ESTIMATION OF THE DEFORMED AREA DIMENSIONS
Prior to performing EBSD scanning, it was important to estimate the expected width of the plastically
deformed area near the crack and the plastic strain amplitude within this area. This allows for defining the
scan dimensions (depth, or distance from the edge) and selection of a reference area not influenced by
propagating crack. A rich literature exists on this topic, and a number of approaches may be used (e.g.,
pure analytical solutions or finite element modelling) since stress concentration due to the crack presence
was a key concern of fracture mechanic, fatigue life prediction, and many other disciplines.
Here, a finite element analysis (FEA) approach was employed as the first step. Since only the near-crack
area was of interest, the model ignored the complex RCT specimen geometry (Figure 1); a 2D plate with
a notch-like crack was considered (Figure 49). Another simplification was the assumption of a
homogeneous, isotropic material model. This assumption appears reasonable for the preliminary
calculations, but a more complicated model, taking into account anisotropic grain structure, may be
developed and analyzed in the future.
To minimize the computational time, a low mesh density at the crack tip was selected. The inaccuracy in
the strain/stress values will be high enough in the crack tip vicinity (~2 elements, or 2–3 m), but this
factor is not of the immediate concern. It was believed that the mesh size should not affect the
strain/stress fields significantly at distances of ~3 m or more.
Figure 49. FEA model for the small crack.
The object was a 2D rectangle with a height of 0.4 m and width of 0.1 m (designated as 2b). The rectangle
had a crack 0.005 m (5 mm, designated as a) long with a width of 1e-6 m (1 m); this number is close to
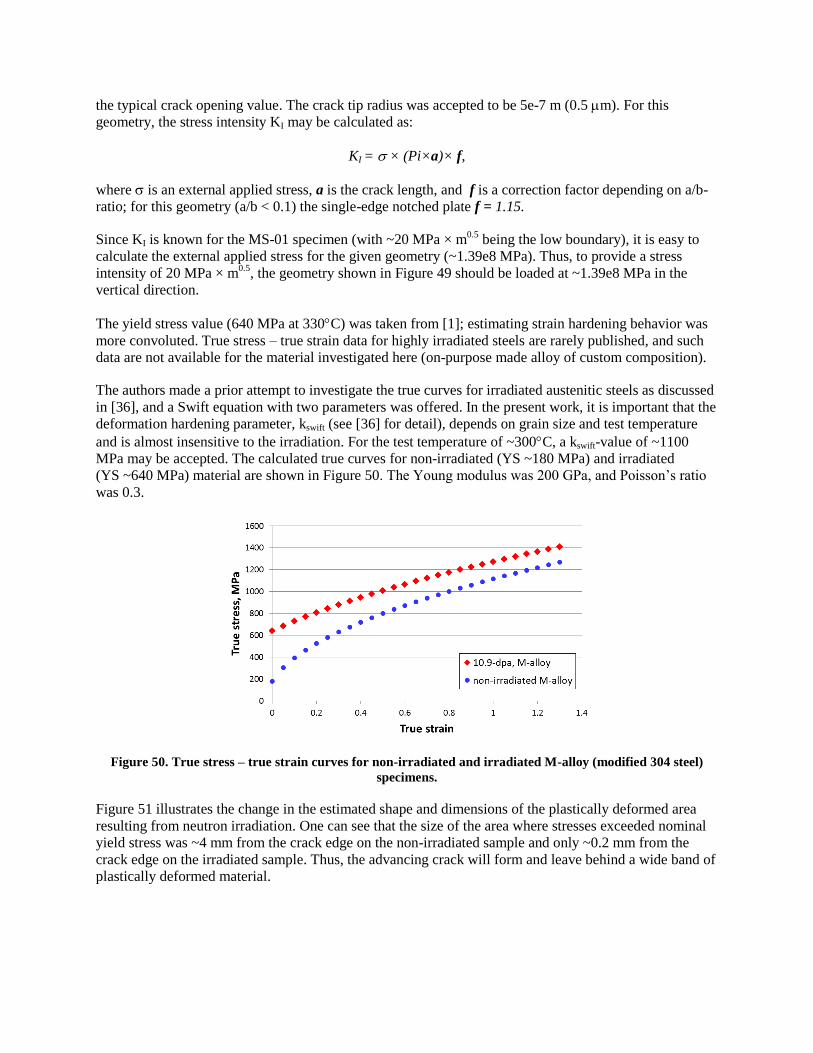
the typical crack opening value. The crack tip radius was accepted to be 5e-7 m (0.5 m). For this
geometry, the stress intensity KI may be calculated as:
KI = × (Pi×a)× f,
where is an external applied stress, a is the crack length, and f is a correction factor depending on a/b-
ratio; for this geometry (a/b < 0.1) the single-edge notched plate f = 1.15.
Since KI is known for the MS-01 specimen (with ~20 MPa × m0.5
being the low boundary), it is easy to
calculate the external applied stress for the given geometry (~1.39e8 MPa). Thus, to provide a stress
intensity of 20 MPa × m0.5
, the geometry shown in Figure 49 should be loaded at ~1.39e8 MPa in the
vertical direction.
The yield stress value (640 MPa at 330C) was taken from [1]; estimating strain hardening behavior was
more convoluted. True stress – true strain data for highly irradiated steels are rarely published, and such
data are not available for the material investigated here (on-purpose made alloy of custom composition).
The authors made a prior attempt to investigate the true curves for irradiated austenitic steels as discussed
in [36], and a Swift equation with two parameters was offered. In the present work, it is important that the
deformation hardening parameter, kswift (see [36] for detail), depends on grain size and test temperature
and is almost insensitive to the irradiation. For the test temperature of ~300C, a kswift-value of ~1100
MPa may be accepted. The calculated true curves for non-irradiated (YS ~180 MPa) and irradiated
(YS ~640 MPa) material are shown in Figure 50. The Young modulus was 200 GPa, and Poisson’s ratio
was 0.3.
Figure 50. True stress – true strain curves for non-irradiated and irradiated M-alloy (modified 304 steel)
specimens.
Figure 51 illustrates the change in the estimated shape and dimensions of the plastically deformed area
resulting from neutron irradiation. One can see that the size of the area where stresses exceeded nominal
yield stress was ~4 mm from the crack edge on the non-irradiated sample and only ~0.2 mm from the
crack edge on the irradiated sample. Thus, the advancing crack will form and leave behind a wide band of
plastically deformed material.

Figure 51. An estimated geometry of the area that experienced stresses close to yield stress (dimensions are in
meters). Non-irradiated specimen (left) shows much larger plastically deformed area compared to the irradiated one
(right): ~4 mm vs. ~0.2 mm.
Since strong strain gradients exist in the plastic area near the crack tip, it was important to estimate the
specific dimensions of the areas subjected to different strains. Figure 52 shows the expected stress and
strain fields in the crack vicinity. As shown in the results, the width of area with a stress level close to the
yield point is expected to be ~200 m in the irradiated specimen. The width of the area with ~1% plastic
strain will be ~40 m and the width of the area with 2% plastic strain will be ~ 20-m.
The strain levels of 1–2% are, in general, easily detectable with EBSD. At a minimum, defect free
channels should be clearly visible along with strong misorientation gradients near grain boundaries. In
principle, EBSD may allow for detecting smaller strains, including loading below YS [17]. However, to
achieve this, the same area should be scanned before and after loading.
The calculated dimensions of the deformed area near the crack (~20–40 m for 1–2% plastic strain) are
obviously rough estimations considering the number of simplifications made (mentioned above)
regarding plastic hardening behavior of the irradiated steel and isotropic plasticity assumption. If present,
ductile ligaments should lead to crack tip shielding and a decrease in stress intensity [37]. The preliminary
and qualitative character of the calculations discussed in the present section is recognized and will be
addressed in more detail in future work. Nevertheless, close attention should be paid to the ~20–40 m
area along the crack in the irradiated material. At the distances of ~0.2–0.5 mm and more, material may
be considered to be free of effects caused by crack propagation.
1 mm 1 mm

Figure 52. Calculated stress (coded by color scale) and strain (shown by contour lines with a 0.01 step
increment) fields around the crack tip in the non-irradiated (left) and irradiated (right) M-alloy
specimens. Note that the specific shape of the stress and strain fields. In the right image, each color line
shows a 1%-strain increment. For the irradiated specimen, the width of the 1%-deformed
area is ~40 m and the ~10 m area should have experienced ~4%-strain.
6.6 EBSD ANALYSIS OF THE CRACK-ADJACENT AREA
Figure 53 shows an example of the EBSD data set collected along the crack propagation path. Scanning
was performed at 800–1000 times magnification. Step (pitch) size in most cases was 125 m. Separate
scans overlapped at ~20–30 m, thus allowing for image stitching. The depth (distance from the crack
edge) varied from ~20–30 to 50–70 m depending on the local crack trajectory. As expected, such depth
should reveal plastic strain in the crack-adjacent layer and show strain gradients via EBSD strain metrics
like KAM.
Non-irradiated Irradiated, 10.7 dpa
~0.01 (1%)
~0.01 (1%)
100 m 100 m

Figure 53. An example of the EBSD data set: several scans were performed along the crack path. The start
location was close to the pre-cracking fatigue point (~0.2 mm). Unfortunately, surface quality varied along the
scanned path, and some information was lost. The IPF images are colored in the vertical direction (the direction of
the acting stress during crack growth testing).
Figure 54 shows EBSD data for one scan. A typical analyzed data set included IPF-map (colored in the
direction of the applied stress during crack growth), IQ map, and a GROD or KAM map (or both). This
particular scan was performed near the crack final position, just prior to the post-test fatigue area. Fatigue
area starts at the left (distance ~0.2 mm).
A number of features present in each scan and may be analyzed in detail. Most common elements are
grains, grain boundaries, slip bands (defect-free channels), occasional scratches, etc. Scratches caused by
specimen preparation are usually clearly visible and easy to distinguish from other structure features.
Scratch-related artefacts usually cross many grains. In the IQ maps scratch-related artefacts are visible as
large smooth areas with decreased image quality (in contrast to grain or twin boundaries or deformation
bands which are usually much sharper).
The crack-adjacent grains often have some signs of plastic strain, which are visible in the GROD and
KAM maps. The width of the crack-adjacent area with signs of plastic strain (marked by “S” in Figure
54) is ~10 m, and is slightly more in some cases. Local in-grain misorientation (GROD) for the crack-
adjacent grains may reach ~10 for some grains. Unfortunately, it is not easy to connect the GROD value
to the local strain level. To do so one needs to construct a special correlation relationship, connecting the
plastic strain level and the selected EBSD strain metric (e.g., GROD, KAM, GAM, etc.). A set of
specimens with a known history (strain level) is required. Such data for irradiated austenitic steels are not
currently available in the literature.
Interestingly, LABs are often presented in the austenitic grains near the crack edge (Figure 54). These
structure elements (LAB) might be seen as a sharp local increase in KAM, and as a rule were also visible

in the IQ maps. The LABs were less common in austenitic grains in the volume, far from the crack edge.
It suggests that LABs may form during crack propagation.
Figure 54. EBSD dataset for the crack-adjacent area: IPF, IQ, GROD, and KAM maps. LAB: low-angle
boundaries; S: locations with high local strain level; SF: strain free grains; dashed ovals show scratches.
Figure 55. GAM values for some grains along the crack path.
SF
SF
GAM
0.15 0.19 0.25 0.17 0.16

Figure 56. An enlarged portion of the GROD and KAM maps shown in Figure 54 (close to the left). Dashed
arrows point to local misorientation variations that suggest the presence of defect-free channels (slip bands). KAM
map highlights local strain-induced fluctuations. SF: strain free grains; solid black arrows show triple junction points
with visible signs of strain.
Dislocation channels (slip bands), as a rule, did not appear in the IQ map for the stress corrosion cracking
area. However, the detailed analysis of misorientation maps (Figure 56) suggests their presence in the
structure. Triple junction points also often served as stain-localization locations (Figure 56). Compared to
the TEM-FIB lift-outs, EBSD may cover larger areas and reveal processes acting on the meso-scale level
(several to hundreds grains).
The most interesting aspect, observed with EBSD, is the strong inhomogeneity in the strain distribution
along the crack path. Some grains (marked as SF in Figure 54 and Figure 56) have no visible signs of
plastic strain, even when such grains were crack-adjacent. This result is contra-intuitive, and the finite
element modeling suggested a retain plastic strain field of a more or less uniform degree.
KAM GROD SF

Figure 57. EBSD data set for the crack-adjacent area. LAB: low-angle boundaries; black arrows point to
grains with visible plastic strain. Scanning conditions (working distance, step size)
are the same as in Figure 54.
Figure 57 shows an additional data set for the crack-adjacent area. As discussed above, clear signs of
plastic strain were present in some grains, a few low-angle boundaries were also visible. At the same
time, the GROD map demonstrates a much smaller average misorientation for the crack-adjacent grains,
compared to Figure 54. This may be caused by changes in the test conditions (temperature, environment,
etc.; see [10]). Several attempts were made to establish a correlation between the test conditions—mainly
stress intensity factors—and EBSD strain metrics. Unfortunately, at present no relevant solid conclusion
can be drawn. It was difficult to connect any particular location and the corresponding EBSD dataset to
the test history. One reason stems from the complexity of the processes during crack propagation; the
crack front is often a complexly shaped line in a 3D space. Crack segments may propagate at different
rates, advancing or experiencing a delay depending on local structure. Average crack length at any given
time has limited value for establishing crack position at a particular cross section.

Figure 58. EBSD data for the crack-adjacent area showing a spot with high local strain level. S: areas with
high local misorientation (GROD). LAB: low-angle boundaries.
The results discussed above (Figure 54, Figure 57) show inhomogeneity in strain distribution along the
crack path and low (or zero) strain level in some grains. Figure 58 shows an example of different kinds
regarding plastic strain distribution. Several grains experienced significant plastic strain, and the depth of
the deformed area exceeded ~20–25 m. GROD and KAM maps revealed complex character of strain
distribution in many grains, with multiple LABs formed, most likely during deformation. Inside this
specific area, the dislocation channels are clearly visible in the IQ map. This “deformation hot spot” co-
existed with strain free areas (SF). Interestingly, such “hot spots” often formed if a crack changed
direction.
SF

Figure 59. EBSD data set for the highly-strained area (“hot spot”) from the scan shown in Figure 58. Note the
high local misorientation (color change) in Grain #1 (up to ~12). The dashed oval shows fragmentation of a small
annealing twin. Grain boundary character is also shown in the IQ map.
Figure 59 demonstrates an enlarged fragment of the data maps shown in Figure 58. The GAM map was
added to highlight the local strains. An interesting peculiarity seen in Figure 59 is the formation of small
sub-grains (dashed oval). Most likely, the pre-existing small annealing twin experienced fragmentation
during straining and was transformed for several small sub-grains separated by low-angle grain
boundaries. Such structures (groups of small LAB-separated grains) are not typical for the bulk parent
material.

Figure 60. EBSD dataset for the area with small secondary crack (dashed black line). Step size is 125 nm,
70-degree tilt. The GAM map also indicates the GAM value for some crack-adjacent grains.
Figure 60 shows a small (~20–25 m) secondary crack. Unlike the main crack both edges of the
secondary crack are visible. One may see strong inhomogeneity of plastic strain in GROD and KAM
maps. Note that the plastic strain in not uniform along the secondary crack. The KAM value may differ
significantly even within one grain.
Plastic strain quantification by the GAM parameter demonstrated that many grains are practically strain-
free, with GAM < 0.2, which is close to the bulk value. Unfortunately, the very edge of the crack (~1–2
m) was lost during electro-polishing.
6.7 DETAILED ANALYSIS OF THE KAM PROFILES
To estimate the thickness of the plastically deformed layer, a detailed analysis of the KAM profiles was
conducted. To reduce local fluctuations and noise level, the KAM values were averaged for 10 pixels
located at the same depth, and the profile was calculated at the normal direction relative to the fracture
KAM
RD-IPF
GROD
IQ
GAM
0.14
0.15 0.15
0.28
0.27
0.14
0.19 0.16
1.47
0.48
0.34
0.13

surface. The KAM parameter is more suitable here compared to GAM and GROD because KAM is more
sensitive to the in-grain misorientation and strain gradients.
Figure 61 shows several KAM profiles for the most typical areas. Profiles #1 and #2 show deformed areas
with LABs. One may see some increase in KAM (from ~0.18, i.e., bulk level, to ~0.4–0.5) at the depth
of ~5 m. Below ~5 m the material appeared to be unstrained, and the KAM profile curve was close to
the bulk.
Profiles #3 and #5 were taken in the grains without visible plastic strain. Indeed, regardless of the depth,
the KAM value was close to the bulk (~0.18). Material at these locations did not reveal plastic strains
even in the crack vicinity. The local fluctuation in profile #3 at 10–15 m of depth was caused by a
scratch.
Profile #4 has few maximums, related to both cracking and scratches. The first maximum, at the crack
edge, was most likely induced by plastic strain. The second, at ~5–6 m depth, corresponded to the LAB.
Figure 61. KAM profiles (#1–5) for the EBSD scan shown in Figure 54. Average width of 10 data points.
It appears that most plastic strain, if it appeared during crack propagation, was localized in the ~5–10 m
layer. The strain tended to be localized to some grains, whereas other grains near the crack edge remained
un-deformed.

Figure 62. KAM profiles for the EBSD dataset shown in Figure 58.
Figure 62 provides some additional statistics and shows the KAM profiles for the highly deformed area
(Profile #3) in contrast to the neighboring grains. Along profile #3, KAM reached ~3 and the depth of
the deformed area was up to 20 m. Curves #1 and #4 demonstrated zero strain even at the crack edge,
and profile #2 had a ~4–5 µm deformed layer.
6.8 ROLE OF GRAIN ORIENTATION ON CRACKING
Early on it was shown that grain orientation may influence crack initiation behavior under PW conditions,
see Chapter 3. It was important to check if grain orientation relative to the external acting stress also
influenced crack propagation. In other words, are the [111]-grains more often involved in cracking
compared to the [001]-grains? Grain orientation to the acting stress strongly influences the elastic and
plastic behavior of the grain (Schmid and Taylor factors). If crack propagation depends on the stress field
near the crack tip, and on the dislocation emission from the crack-adjacent area, grain population in the
crack-adjacent area will be different compared to the bulk. Depending on how strong the connection is
between grain properties and cracking, one may expect a strong selection of, for instance, [001]- or [111]-
grains, or just statistical differences between near-crack and in-bulk populations.
The complex shape of the crack front might influence local stresses and change the direction of the main
acting stress. However, the crack in the investigated specimen mainly propagated in the typical direction
in relation to the acting stress. Crack branching, leading to the stress redistribution, was weak, and in most
cases secondary cracks were short. Thus, it may be assumed that the real acting stress direction was close
to the applied load direction.
Bulk KAM
(~0.15-.18)

Figure 63 shows the orientation of the crack-adjacent grains in comparison to the bulk material. The
number of data points was limited (only two scans were included in the figure) to keep the image
readable. As shown in the plot, there is no pronounced difference between cracked and non-cracked grain
populations. At least, this difference was weak enough and did not lead to the pronounced depopulation of
any of the unit triangle area.
Figure 63. Orientation of crack-adjacent grains (Scan #11, Scan #12) compared to randomly selected grains
in the bulk (at least ~1.2 mm from the crack). The IPFs are plotted in the vertical direction (with respect to the
acting stress during the crack growth test).
To analyze the grain orientation role in more detail, a series of EBSD scans (8 in total, with > 250 crack-
adjacent grains) were merged, and the orientation of the crack-adjacent grains was compared to the
summary data for the grains farther from the crack (Figure 64). As shown in the texture plots, the general
texturing in the bulk material along the crack trajectory was weak enough, only ~1.53 × random. The
most pronounced texturing component was an increased fraction of [001] grains in the crack propagation
direction, [010] in Figure 64.
Figure 64. The texture in the bulk non-cracked material (left) and summary texture plot for the crack
adjacent grains. The summary plot for 8 scans (same step size and imaging conditions).
Non-cracked grains Cracked grains
Applied stress direction
Applied stress direction
Crack propagation direction
Crack propagation direction
A A B
C
B
C

Comparing the grain orientation patterns in the bulk and near the crack, one may see that crack-adjacent
grain orientations are, in general, close to the non-cracked ones. Grains with [001] with respect to the
crack propagation direction (group marked as “A” in Figure 64) have a texture index of ~1.5 × random in
the bulk and ~1.6 × random near the crack. Two other specific areas (B and C) have similar texture
indexes (B: ~1.1 × random in bulk and ~1.5 × random after cracking; C: ~1.2 ×random in bulk and ~1.6 ×
random after cracking). Some weak secondary effects may be present, and this aspect should be addressed
in the future when more data on different specimens and testing conditions are available.
At the moment, it is possible to conclude that grain orientation plays a weak, if any, role on the stress
corrosion crack advancing. No one grain population (e.g., grains with [111] or [001] orientation)
dominated along the crack path.
6.9 GRAIN SIZE ROLE ON CRACKING
Grain size is an important influence on material properties. In particular, grain size affects a material’s
strength level and deformation hardening. Grain orientation, as discussed above, played a weak role in
crack propagation; however, it was important to investigate the role of grain size in crack advancing.
Figure 65 shows the grain size histograms for the bulk material and near the crack. To produce these data,
the EBSD data were re-analyzed, and the total grain population was divided into two categories: crack-
adjacent grains (~250–280), and grains without visible connection to the crack (> 500). To reduce random
fluctuations, the data were binned with a ~4-m step (e.g., the smallest grains < 4 m, 4–8 m, 8–12 m,
etc.).
Bulk material At the crack edge
Figure 65. Grain size histograms for bulk material (left) and crack-adjacent grains (right).
As shown in the image, the probabilities of finding a grain of the given size near the crack and in the bulk
material are not the same. The fraction of the smallest grains (< 4 m) is slightly higher in the bulk (factor
of ~1.5), but it may be just an artifact induced by the specimen preparation method. Electropolishing
might destroy small grains at the edge.
However, as grain size increases, the probability of finding a given size grain at the crack edge increases
drastically. The largest grains (16–20 m grain size range) presented at the crack edge with ~13 times
larger probability compared to the bulk, and grains with moderate size (8–12 m) presented at the crack

edge with ~5 times larger probability compared to the bulk. Obviously, more data are required for
specimens tested under different environmental conditions and stress intensity/loads.
Nevertheless, it appears that larger grains may be involved more often in the crack propagation compared
to the small grains. In the first iteration, it may be explained by the well-known Hall-Petch law (reducing
the grain size will lead to strength level increase). Smaller grains will have larger yield stress compared to
the larger grains, and plastic deformation will first develop in the larger grains.
6.10 CORRELATION OF PLASTIC STRAIN LEVEL AND GRAIN ORIENTATION FOR THE
CRACK-ADJACENT GRAINS
As shown above, the plastic strain distribution along the crack path was strongly non-uniform; plastic
deformation tended to appear in some grains, whereas most grains were non- or just slightly deformed.
Thus, it was important to analyze the relationship between the plastic strain level in a particular grain and
other factors, like grain orientation.
0.0 0.1 0.2 0.3 0.4 0.5 0.6 0.70
2
4
6
8
10
12
14
16
Count
GAM (Grain Average Misorientation), degree
Figure 66. GAM (Grain average misorientation) value histogram for one of the EBSD scans (M-alloy, MS-01
specimen). Only crack-adjacent grains are shown. The typical GAM value for non-deformed
material is 0.13 ± 0.05°.
Figure 66 shows a typical GAM value histogram for the crack-adjacent grains. The GAM value of ~0.13–
0.15 was obtained for the bulk austenitic grains (non-deformed material far from the crack). As shown in
the image, ~50% of grains along the crack path had the GAM values close to the bulk (i.e., these grains
did not experience visible plastic strain). Some grains demonstrated weak signs of plastic deformation
with the GAM values within a 0.2–0.4 range, and 3 grains in the analyzed scan showed an unexpectedly
high GAM value (> 0.5).
Figure 67 shows the orientation of crack-adjacent grains with respect to the externally applied stress. The
marker size corresponds to the GAM value for each particular grain. One can see that there is a tendency
for the GAM value to correlate with the grain orientation. It appears that slightly deformed grains (GAM
range of 0.2–0.4) are grouped near the center of the unit triangle (near the Schmid factor maximum). All
heavily deformed grains (GAM > 0.4) appeared in the middle area of the unit triangle.
Bulk GAM (reference)

Figure 67. The orientation of the grains from the Figure 66, with respect to the applied stress direction. The
size and color of the markers correspond to the GAM value range. For each grain, an average orientation is given.
Thus, for the crack-adjacent grains, there may be a strong connection between grain orientation and its
GAM value (internal misorientation or strain level). The largest plastic strain was observed in the softest
grains with the highest Schmid factor. At the same time, there were significant variations in the internal
misorientation level between the grains of the same or similar orientation. This suggests that there may be
an additional factor(s) influencing the appearance and amplitude of plastic strain during stress corrosion
crack propagation. Such a factor may be a grain boundary type.
6.11 THE ORIGIN OF THE HIGHLY-DEFORMED AREAS (“HOT SPOTS”)
As was discussed above, stress localization occurs near the crack tip leading to the formation of the
localized plastic deformation field. In soft material (e.g., annealed austenitic steel) such a field will be
large enough and it would be difficult to identify the same “hot spots.” To reduce the plastic area to the
grain-size comparable value, material has to have a high enough strength level induced by irradiation or
precipitation hardening.
Leonard et al. [38] investigated high-strength nickel 718 super-alloy that experienced stress corrosion
cracking in high-temperature, high-pressure water. This material had a high strength level (yield stress >
1200 MPa) leading to a very small plastic area size around crack tip; thus, the crack-induced plastic strain
was not masked by cold work or other processes, and EBSD was a suitable tool to investigate plastic
strain distribution.
0-0.2
0.2-0.4
>0.4

Figure 68. EBSD scan for the stress-corrosion crack in the neutron-irradiated 718-alloy (after [38]).
Analyzing the crack trajectory, authors observed specific, highly-deformed areas in the 718-alloy
specimen with stress-corrosion cracks [38] (Figure 68). These areas (often termed “plastic bridges” or
“ductile ligaments”) were attributed to the 3-grain boundaries (or twin boundaries), which are usually
more resistant to cracking compared to the conventional random high-angle boundaries.
Thus, the highly-deformed areas might be the result of appearance and evolution of “plastic bridges.”
Unfortunately, there was no way to analyze the corresponding grains/areas on the second half of the
specimen or exactly define the grain boundary type.

Figure 69. Ductile ligament-free crack (top) in contrast with crack with 3 “bridges” (ductile ligaments). The
loading conditions are the same.
The FEA model introduced above was modified to introduce several “plastic bridges” (or ductile
ligaments); the external loading conditions were kept the same. Figure 69 shows the stress and strain
distributions around the crack without, and with a few, simulated ductile ligaments (“plastic bridges”).
One may see some decrease in the plastic area size (from ~50 m for the 1%-strain level to ~30 m) if the
ligaments are present in the structure. Interestingly, there are strong stress and plastic strain gradients
inside the “bridges” (i.e., ductile ligaments are spatially limited objects); strain level inside the bridges
reached ~0.1–0.15 (~10–15%). Thus, the presence of ductile ligaments may explain, at least qualitatively,
the reduction in the plastic area size and the smaller than expected degree of plastic strain.
However, it is still difficult to explain the absence of plastic strain in many crack-adjacent grains behind
the crack. One may speculate that some particular grain boundaries cracked at stress levels much below
yield stress.
Thus, the final plastic strain distribution of the structure will be a result of overlapping from strains
induced by the main crack and strains produced by the ductile ligaments. Stress shielding due to ligament
formation should reduce the actual stress intensity factor.

7. IN-SITU TESTING OF IRRADIATED SPECIMENS
7.1 ADVANTAGES OF IN-SITU TESTING
Electron back scatter diffraction came in the material science practice about two decades ago. Since then,
EBSD and its variations demonstrated strong progress. For example, high-resolution EBSD (HR-EBSD)
came to the practical use several years ago [39]. Since EBSD patterns are sensitive to the elastic strains,
HR-EBSD allows for direct measurements of the acting stress and for calculating geometrically necessary
dislocation density [39]. In the metallic polycrystal, local acting stress may be different than the applied
macroscopic stress because of elastic anisotropy. Moreover, measuring the object under stress, one can
find stress concentration points and connect them to structure features like grain boundaries and triple
junction points [39, 40]. At the moment, a limited number of publications is available for non-irradiated
materials, and practically no work has been done for irradiated materials.
Some materials may demonstrate deformation-induced twinning and phase transformation during
straining and plastic deformation. The common practice of post-deformation structure analysis postulates
there are no structure changes during unloading or such changes are negligible. However, this is not
always true. For instance, Barnett et al. [40] conducted EBSD analysis of deformed Mg-3Al-1Zn alloy,
and the EBSD measurements and scanning were conducted for the specimen during and after unloading.
It was demonstrated [40] that stress release led to de-twinning That is, part of the deformation twins
formed during straining disappeared during unloading. Because of high yield stress in austenitic steels
after irradiation, the elastic strains may be high enough to provide the driving force for dislocation
channel evolution during unloading. This aspect is also important to investigate.
If in-situ straining capability is available, one continuously deformed specimen will be able to provide
data for wide range of conditions (e.g. strain levels). This approach was successfully used for in-situ creep
experiments [41] and precise strain and misorientation mapping [42], etc.
Taking these and other potential benefits into account, it was decided to establish similar capability in
ORNL’s LAMDA laboratory. As believed, considering the role of plastic strain on material performance
and different processes like stress corrosion crack initiation and propagation provided new and important
results for the nuclear material community.
7.2 SMALL TENSILE STAGE
After analyzing the available market options, it was decided to purchase the miniature tensile stage from
Kammrath and Weiss Technologies, Inc. This company specializes in the development and production of
custom-made systems for mechanical testing under specific conditions (e.g., vacuum, high- or low-
temperatures, corrosive environments, etc.).

Figure 70. General view of the MZ.Sb small tensile stage for the VERSA 3-D SEM.
Figure 71. Tensile stage with a high-temperature heater installed in the SEM microscope chamber (image
provided by the vendor, Kammrath and Weiss Technologies, Inc.).
The selected model, MZ.Sb (Figure 70) has a loading capacity up to 5 kN, providing an opportunity to
test all available specimen geometries and, in the future, compact tension specimens. The small tensile
frame is operated by a modern microprocessor controller that allows for a strain rate range of 0.1 to 20
m/s. A wide range of test conditions may be applied (e.g., load and temperature ramps, tension,
compression, etc.). Two heating options (Figure 71) will be available: a middle-temperature range (up to
320C, for the LWRS-program purpose) and a high-temperature (up to 800C, for advanced alloy
testing).
The device is expected to be delivered, installed, and tested in November–December 2016.

8. SUMMARY AND CONCLUSIONS
This report aimed to study the IASCC initiation and crack growth stages. Oxidation processes in high-
temperature water and deformation mechanisms under corrosion environment conditions were
investigated using modern techniques, including SEM-EBSD, FIB, TEM, and STEM-EDS. Additionally,
crack propagation mechanisms were investigated using an SEM-EBSD approach. Highly irradiated
archive tensile and RCT specimens from previous research activities were analyzed in detail using a
systematic top-down approach.
Crack initiation and the phenomenon of multiple cracking was examined in specimens deformed under
PW conditions. It was shown that IG cracks reached some length (~150–200 m) and depth (~80–100
m), blunted, and tended to coalesce with limited in-depth propagation. The in-depth crack propagation
rate was estimated to be ~8 × 10⁻⁷
mm/s at this early stage. The reason for limited crack depth was not
determined but may be attributed to changes in the in-crack chemistry. Crack initiation required some
preliminary plastic deformation, roughly ~0.6%. Using SEM-EBSD, grain orientation was shown to be an
important factor affecting cracking. Grains oriented close to the [111] area (with respect to the tensile
direction) and the softest grains with a high Schmid factor were most often involved in crack initiation.
Grains oriented close to the [001] and [101] areas were much less sensitive to crack initiation. The role of
grain orientation extends and details the paradigm on Schmid and Taylor factor contribution to crack
initiation.
The acting deformation mechanisms (channel propagation, interaction with grain boundaries, fine in-
channel structure) were investigated using EBSD and FIB-TEM. Significant local misorientation levels
and formation of in-grain low-angle boundaries were observed. Deformation twinning was found to be an
acting deformation mechanism in a high-temperature environment. Twins of a strain-induced nature were
observed inside defect-free dislocation channels in specimens deformed under PW and NWC conditions.
Oxide layers at the specimen surface and inside crack were analyzed. A specific multilayer structure
(Fe-enriched oxide, Cr-enriched oxide, Ni-enriched metal oxide interface, and finally parent metal) was
observed in the PW-strained specimen. The crack tip was shown over pockets of Ni-enriched metal.
Channel-crack interaction led to the formation of specific Cr-enriched oxide inclusions.
Based on the results of this study, it may be concluded that IASCC initiation involves contributions from
deformation localization and, most likely, selective oxidation of deformation channels. Grain orientation
also dictates the location of crack initiation, but the details are not fully understood at this time. Future
work should focus on detailed analysis of channel-GB interaction with direct stress field measurement, if
possible. The role of twinning as crack promoter and factors influencing twinning should be explored.
Additionally, in the present work the stress corrosion crack propagation was investigated in detail for a
highly-irradiated (10.7 dpa) austenitic steel specimen. The focus was on the plastic deformation processes
accompanying crack propagation. Plastic stain fields and deformation localization were analyzed using a
modern SEM-EBSD approach. The goal was to determine if a preferred crack path exists as a result of the
crystallography orientation of the crack-adjacent grains and to determine which structures influence crack
propagation.
The crack propagation analysis was performed using already-tested RCT specimens of model 304 steel
with Ti-addition. The object was tested under NWC conditions. The material had weak texturing, small
average grain size (~10 m), and contained ~1–1.5% retained ferrite. In this material, no pronounced
crack branching was observed; only few short, less than 40–50 m secondary cracks were found in the
structure.

EBSD analysis revealed strong inhomogeneity in plastic strain distribution along the crack path. Some
crack-adjacent grains remained virtually strain-free whereas few grains experienced strong plastic strain.
These areas were presumed to be “plastic bridges” or “ductile ligaments.” The width of the plastically
deformed areas along the crack was, in most cases, 5–10 m or less; this value increased up to ~20–50
m inside the plastic bridges.
Grain orientation with respect to the acting stress direction was not a major factor controlling crack
propagation. No crystallography orientation susceptible to crack propagation was identified by this work.
At the same time, there was a tendency for larger grains to group along the crack path, and larger grains
were more likely to be involved in cracking.
Further work, if supported, will include the analysis of RCT and tensile specimens under different
conditions (primary water vs. NWC), before and after post-irradiation annealing, FIB-lift outs from the
cracked surface to perform detailed TEM analysis of the dislocation structures, and analysis of crack tips
for the secondary cracks.
As believed, the present work demonstrated the value and significance of in-depth analysis of the
available specimen archive. Continuing progress in the development of modern tools and research
methods will allow more information to be obtained from already tested and well-documented objects.
9. ACKNOWLEDGMENTS
The authors would like to thank Dr. G. Was (the University of Michigan), Dr. P. Edmondson (ORNL),
and Dr. L. Tan (ORNL) for the fruitful and stimulating discussion, K. Stephenson (University of
Michigan) for providing several SEM images and discussing the results from Chapter 3, and D. Stevens
(ORNL), S. Crawford (ORNL), E. Huckabay (ORNL), and K. Jones (ORNL) for valuable help with
document preparation.
10. REFERENCES
1. Massoud, J. P., P. Dubuisson, P. Scott and V. K. Chamardine. 2005. CIR II Program: Description of
the Boris 6 and 7 Experiments in the BOR-60 Fast Breeder Reactor. EPRI Report No. 1011787.
2. Scott, P. 2003. Materials Reliability Program: A Review of the Cooperative Irradiation Assisted
Stress Corrosion Cracking Research Program (MRP-98). EPRI Report No. 1002807.
3. Stephenson, K. J. and G. S. Was. 2014. “Crack Initiation Behavior of Neutron Irradiated Model and
Commercial Stainless Steels in High Temperature Water.” J. Nucl. Mater., 444: 331–41.
4. Was, G. S., Y. Ashida and P. L. Andresen. 2011. “Irradiation-Assisted Stress Corrosion Cracking.”
Corrosion Review. 29: 7–49.
5. Tan, L. and J. T. Busby. 2013. “Alloying Effect of Ni and Cr on Irradiated Microstructural Evolution
of Type 304 Stainless Steels.” J. Nucl. Mater., 443: 351–58.
6. Field, K. G., Y. Yang, T. R. Allen and J. T. Busby. 2015. “Defect Sink Characteristics of Specific
Grain Boundary Types in 304 Stainless Steels Under High Dose Neutron Environments.” Acta
Materialia, 89: 438–49.
7. Gussev, M. N., K. G. Field, and J. T. Busby. 2014. “Strain-Induced Phase Transformation at the
Surface of an AISI-304 Stainless Steel Irradiated to 4.4 dpa and Deformed to 0.8% Strain,” J. Nucl.
Mater., 446: 187–92.

8. Turnbull, A. 2014. “Corrosion Pitting and Environmentally Assisted Small Crack Growth.” Proc. R.
Soc. A, 470. DOI: http://dx.doi.org/10.1098/rspa.2014.0254.
9. Gussev, M. N., J. T. Busby, L. Tan and F. A. Garner. 2014. “Magnetic Phase Formation in Irradiated
Austenitic Alloys.” J. Nucl. Mater., 448: 294–300.
10. Was, G. S., Y. Ashida, K. J. Stephenson, A. Flick, and P. L. Andersen. YEAR. “Identifying
Mechanisms and Mitigation Strategies for Irradiation Assisted Stress Corrosion Cracking of
Austenitic Steels in LWR Core Components.” EPRI Report No. 3002003105.
11. Subedi S., R. Pokharel and A. D. Rollett. 2015. “Orientation Gradients in Relation to Grain
Boundaries at Varying Strain Level and Spatial Resolution.” Mat. Sci. Eng. A, 638: 348–56.
12. Jiao Z. and G. S. Was. 2011. “Impact of Localized Deformation On IASCC in Austenitic Stainless
Steels.” J. Nucl. Mater., 408: 246–56.
13. Fukuya, K. 2013. “Current Understanding of Radiation-Induced Degradation in Light Water Reactor
Structural Materials.” J. Nucl. Mater., 50(3): 213–54.
14. Fukuya, K., M. Nakano, K. Fujii and T. Torimaru. 2004. “IASCC Susceptibility and Slow Tensile
Properties of Highly-Irradiated 316 Stainless Steels.” J. Nucl. Sci. Technol., 41(6): 673–81.
15. Je, H. and A. Kimura. 2014. “Stress Corrosion Cracking Susceptibility of Candidate Structural
Materials in Supercritical Pressurized Water.” J. Nucl. Mater., 455: 507–11.
16. Edwards, D. J. and B. N. Singh. 2004. “Evolution of Cleared Channels in Neutron-Irradiated Pure
Copper as a Function of Tensile Strain.” J. Nucl. Mater., 329–333: 1072–77.
17. Kamaya, M. and T. Haruna. 2007 “Influence of Local Stress on Initiation Behavior of Stress
Corrosion Cracking for Sensitized 304 Stainless Steel.” Corrosion Science, 49: 3303–24.
18. McMurtrey, M. D., G. S. Was, L. Patrick and D. Farkas. 2011. “Relationship between Localized
Strain and Irradiation Assisted Stress Corrosion Cracking in an Austenitic Alloy.” Mater Sci Eng.,
A528: 3730–40.
19. Bosch, R. W., M. Vankeerberghen., R. Gérard and F. Somville. 2015. “Crack Initiation Testing of
Thimble Tube Material under PWR Conditions to Determine a Stress Threshold for IASCC.” J. Nucl.
Mater., 461: 112–21.
20. Sauzay, M. 2007. “Cubic Elasticity and Stress Distribution at the Free Surface of Polycrystals.” Acta
Materialia, 55: 1193–202.
21. Field, K. G., M. N. Gussev and J. T. Busby. 2014. “Microstructural Characterization of Deformation
Localization at Small Strains in a Neutron-Irradiated 304 Stainless Steel.” J. Nucl. Mater., 452: 500–
508.
22. Was, G. S., D. Farkas and I. M. Robertson. 2012. “Micromechanics of Dislocation Channeling in
Intergranular Stress Corrosion Crack Nucleation.” Current Opinion in Solid State Material Science,
16: 134–42.
23. West, E. A. and G. S. Was. 2011. “A Model for the Normal Stress Dependence of Intergranular
Cracking of Irradiated 316L Stainless Steel in Supercritical Water.” J. Nucl. Mater.408: 142–52.
24. Fukuya, K., H. Nishioka, K. Fujii, T. Miura and Y. Kitsunai. 2013. “Local Strain Distribution Near
Grain Boundaries under Tensile Stresses in Highly Irradiated SUS316 Stainless Steel.” J. Nucl.
Mater., 432: 67–71.
25. Gussev, M. N., K. G. Field and J. T. Busby. 2015. “Deformation Localization and Dislocation
Channel Dynamics in Neutron-Irradiated Austenitic Stainless Steels.” J. Nucl. Mater., 460: 139–52.

26. Kamaya, M., Y. Kawamura and T. Kitamura. 2007. “Three-Dimensional Local Stress Analysis on
Grain Boundaries in Polycrystalline Material.” Int. J. Solids Struct., 44: 3267–77.
27. Onchi, T., K. Dohi, K. N. Soneda, J. R. Cowan, R. J. Scowen, and M. L. Castano. 2003.
“Fractographic and Microstructural Characterization of Irradiated 304 Stainless Steel Intergranularly
Fractured in Inert Gas.” J. Nucl. Mater., 320: 194–208.
28. Terachi, T., T. Yamada, T. Miyamoto, K. Arioka and K. Fukuya. 2008. “Corrosion Behavior of
Stainless Steels in Simulated PWR Primary Water—Effect of Chromium Content in Alloys and
Dissolved Hydrogen.” J. Nucl. Sci. Technol., 45(10): 975–84.
29. Woodtli, J. and R. Kieselbach. 2000. “Damage due to Hydrogen Embrittlement and Stress Corrosion
Cracking.” Eng. Fail. Anal., 7: 427–50.
30. Gutman, E. M. “An Inconsistency in Film Rupture Model of Stress Corrosion Cracking.” 2007.
Corrosion Science, 49: 2289–302.
31. Gonzalez, D., I. Simonovski, P. J. Withers and J. Q. da Fonseca. 2014. “Modelling the Effect of
Elastic and Plastic Anisotropies on Stresses at Grain Boundaries.” Int. J. Plasticity, 61: 49–63.
32. Ilevbare, G. O. and T. Couvant. 2014. “Effect of Localized Strain Deformation on SCC Initiation of
Stainless Steels in Simulated PWR Primary Water.” Proceedings of Corrosion NACE Conference.
San Antonio, TX. Paper No. 4469.
33. Lozano-Perez, S., T. Yamada, T. Terachi, M. Schroder, C. A. English, G. D. W. Smith, C. R. M.
Grovenor and B. L. Eyre. 2009. “Multi-Scale Characterization of Stress Corrosion Cracking of Cold-
Worked Stainless Steels and the Influence of Cr Content.” Acta Materialia, 57: 5361–381.
34. Bruemmer, S. M. and L. E. Thomas. 2005. “High-Resolution Characterizations of Stress-Corrosion
Cracks in Austenitic Stainless Steel from Crack Growth Tests in BWR-Simulated Environments,”
Proceedings of the 12th International Conference on Environmental Degradation of Materials in
Nuclear Power System—Water Reactors, edited by T. R. Allen, P. J. King, and L. Nelson. (The
Minerals, Metals & Materials Society).
35. Du, D., K. Chen, L. Yu, L. Zhang, X. Shi and X. Xu. 2015. “SCC Crack Growth Rate of Cold
Worked 316L Stainless Steel in PWR Environment.” Journal of Nuclear Materials, 456: 228–34.
36. Gussev, M. N., T. S. Byun, and J. T. Busby. 2012. “Description of Strain Hardening Behavior in
Neutron-Irradiated FCC Metals.” Journal of Nuclear Materials, 427(1): 62–68.
37. Jivkov, A. P., N. P. C. Stevens and T. J. Marrow. 2006. “A Two-Dimensional Mesoscale Model for
Intergranular Stress Corrosion Crack Propagation.” Acta Materialia, 54(13) 3493–501.
38. Leonard, K. J., M. N. Gussev, J. N. Stevens and J. T. Busby. 2015. “Analysis of Stress Corrosion
Cracking in Alloy 718 Following Commercial Reactor Exposure.” Journal of Nuclear Materials, 466:
443–59.
39. Britton, T. B., J. Jiang, R. Clough, E. Tarleton, A. I. Kirkland and A. J. Wilkinson. 2013. “Assessing
the Precision of Strain Measurements Using Electron Backscatter Diffraction. Part 2:Experimental
Demonstration. Ultramicroscopy, 135: 136–41.
40. Barnett, M. R., Z. Keshavarz and M. D. Nave. 2005. “Microstructural Features of Rolled Mg-3Al-
1Zn, Metallurgical and Materials Transactions A, 36(7): 1697–704.
41. C. J. Boehlert, S. C. Longanbach, M. Nowell and S. Wright. 2008. “The Evolution of Grain-
Boundary Cracking Evaluated through In Situ Tensile-Creep Testing of Udimet Alloy 188.” J. Mater.
Res., 23(2).

42. A. Clair, M. Foucault, O. Calonne, Y. Lacroute, L. Markey, M. Salazar, V. Vignal and E. Finot.
“Strain Mapping Near a Triple Junction in Strained Ni-based Alloy Using EBSD and Biaxial
Nanogauges.” Acta Materialia, 59 (2011) 3116–23.

A-1
APPENDIX A. ALLOYS PRODUCED AND IRRADIATED IN THE
FRAMEWORK OF THE CIR PROGRAM
Table A1 shows the composition and maximum damage dose for key materials produced and irradiated in
the framework of CIR program. Figure A1 shows the scheme of alloying, and Figure A2 demonstrates the
specimen geometry along with the image of typical specimen.
Table A1. Damage dose, element composition (wt.%),a and grain size for investigated alloys
Alloy Max. dose
(dpa) C Mn Si Cr Ni Mo N
Grain
size
(m)
A 47 0.023 1.82 0.56 19.95 10.8 0.53 0.072 38
B 25 0.056 1.13 0.73 16.84 10.54 2.25 0.021 47
C 4.8 0.07 1.4 0.56 16.77 12.78 2.18 0.008 15
E 11.8 0.021 0.94 0.04 18.76 12.37 0.04 0.0003 48
G 11.8 0.02 0.97 0.03 18.26 12.15 2.36 0.0004 72
H 7.8 0.02 1.01 1.05 18.17 12.45 0.02 0.0005 32
K 9.6 0.02 1 0.03 18.21 25.08 0.02 0.0005 24
L 9.1 0.02 1.02 0.03 25.22 25.07 0.02 0.0005 26
P 9.6 0.028 1.01 0.1 17.03 13.6 2.18 n/d 19
M 10.7 0.02 1 0.03 18.03 11.22 0.02 0.0005 10
N 10.7 0.02 1 0.03 18.24 12.12 0.02 0.0004 n/d
SW 4.4 0.022 1.07 0.24 18.42 10.45 n/d 0.025 67
aIn all alloys (except N and M): P < 0.01%; S < 0.01%; Ti < 0.02; Nb < 0.005. The P alloy also contains 1.17% Hf. N-alloy:
0.595% Nb; M-alloy:0.3% Ti.
Figure A1. Schematic representation of alloys investigated.

A-2
Figure A2. Dimensions and image of the typical specimen used in the study.


