Post-cracking behavior of UHPC on the concrete members...
16
Computers and Concrete, Vol. 18, No. 1 (2016) 139-154 DOI: http://dx.doi.org/10.12989/cac.2016.18.1.139 139 Copyright © 2016 Techno-Press, Ltd. http://www.techno-press.org/?journal=cac&subpage=8 ISSN: 1598-8198 (Print), 1598-818X (Online) Post-cracking behavior of UHPC on the concrete members reinforced by steel rebar H.A. Rahdar a and M. Ghalehnovi ∗ Civil Engineering Department, Faculty of Engineering, Ferdowsi University Of Mashhad, Mashhad, Iran (Received November 22, 2015, Revised March 12, 2016, Accepted May 5, 2016) Abstract. Since the concrete strength around the reinforcement rebar affects the tension stiffening, the tension stiffening effect of ultra high performance concrete on the concrete members reinforced by steel rebar is examined by testing the specimens with circular cross section with the length 850 mm reinforced by a steel rebar at the center of a specimen's cross section in this research. Conducting a tensile test on the specimens, the cracking behavior is evaluated and a curve with an exponential descending branch is obtained to explain the post-cracking zone. In addition, this paper proposes an equation for this branch and parameters of equation is obtained based on the ratio of cover thickness to rebar diameter (c/d) and reinforcement percentage (ρ). Keywords: Ultra High Performance Concrete (UHPC); reinforcement; tension stiffening; reinforced concrete member; crack 1. Introduction As a basic feature, tension stiffening focuses on the behavior of the reinforced concrete members under tension. Consider a reinforced concrete member which made by a reinforcement rebar surrounded by a concrete cylinder. The tension force exerts on the two ends of the rebar. Due to the bond between the concrete and rebar in their interface, the strains and stresses of the concrete cylinder increase with increasing force and crack occurs at a certain level of force where strains meet the cracking criterion. Creation of crack in the member results in the redistribution of internal strains and stresses in the member and the stiffness of the reinforced concrete member also changes. The increase of loading can produce more cracks in certain positions. For a reinforced concrete member, the process of loading increase occurs until the reinforcement rebar yields at one of two ends or the cracking cross section. Emergence of cracks in the concrete cylinder surrounding the reinforcement rebar affect on the stiffness and the behavior of the reinforced concrete member. This effect is called “tension stiffening” (Soltan Mohammadi 2010). CEB-FIB (1993) and fib codes (1999a) propose similar stiffening models. In the model proposed by fib code (1999a), the force-strain relation of a concrete member reinforced by steel is ∗Corresponding author, Associate Professor, E-mail: [email protected] a Ph.D. candidate, E-mail: [email protected]
Transcript of Post-cracking behavior of UHPC on the concrete members...
Computers and Concrete, Vol. 18, No. 1 (2016) 139-154DOI: http://dx.doi.org/10.12989/cac.2016.18.1.139 139
Copyright © 2016 Techno-Press, Ltd.http://www.techno-press.org/?journal=cac&subpage=8 ISSN: 1598-8198 (Print), 1598-818X (Online)
Post-cracking behavior of UHPC on the concrete membersreinforced by steel rebar
H.A. Rahdara and M. Ghalehnovi∗
Civil Engineering Department, Faculty of Engineering, Ferdowsi University Of Mashhad, Mashhad, Iran
(Received November 22, 2015, Revised March 12, 2016, Accepted May 5, 2016)
Abstract. Since the concrete strength around the reinforcement rebar affects the tension stiffening, thetension stiffening effect of ultra high performance concrete on the concrete members reinforced bysteel rebar is examined by testing the specimens with circular cross section with the length 850 mmreinforced by a steel rebar at the center of a specimen's cross section in this research. Conducting atensile test on the specimens, the cracking behavior is evaluated and a curve with an exponentialdescending branch is obtained to explain the post-cracking zone. In addition, this paper proposes anequation for this branch and parameters of equation is obtained based on the ratio of cover thickness torebar diameter (c/d) and reinforcement percentage (ρ).
Keywords: Ultra High Performance Concrete (UHPC); reinforcement; tension stiffening; reinforcedconcrete member; crack
1. Introduction
As a basic feature, tension stiffening focuses on the behavior of the reinforced concretemembers under tension. Consider a reinforced concrete member which made by a reinforcementrebar surrounded by a concrete cylinder. The tension force exerts on the two ends of the rebar. Dueto the bond between the concrete and rebar in their interface, the strains and stresses of theconcrete cylinder increase with increasing force and crack occurs at a certain level of force wherestrains meet the cracking criterion. Creation of crack in the member results in the redistribution ofinternal strains and stresses in the member and the stiffness of the reinforced concrete member alsochanges. The increase of loading can produce more cracks in certain positions. For a reinforcedconcrete member, the process of loading increase occurs until the reinforcement rebar yields at oneof two ends or the cracking cross section. Emergence of cracks in the concrete cylinder surroundingthe reinforcement rebar affect on the stiffness and the behavior of the reinforced concrete member.This effect is called “tension stiffening” (Soltan Mohammadi 2010).
CEB-FIB (1993) and fib codes (1999a) propose similar stiffening models. In the modelproposed by fib code (1999a), the force-strain relation of a concrete member reinforced by steel is
∗Corresponding author, Associate Professor, E-mail: [email protected]. candidate, E-mail: [email protected]

Fig. 1 Force-strain relation of a reinforced concrete member under tension
used (see Fig. 1).In past, many researches are conducted on the tension stiffening effect of the concrete
reinforced by steel and the concrete with normal strengthof these members is considerable. Seongreinforced concrete elements subjected to uniaxialenables the calculation of average tensile stresses in concrete, after yielding of reinforcement.proposed model makes it possible to accurately calculate reinforcement stresses at crack locationsand, thus, average strain conditions which result in rupture of reinforcement. Threalistic predictions of the uniaxial, flexural, and shear ductility of reinforced concrete members.The tension stiffening effect of chemically preexperimentally investigated and compared with those of reinforced concrete (RC) by RaktipongSahamitmongkol and Toshiharu Kishi (2010). The results of their study show that the CPC hassuperior tension stiffening than RC anunderestimates the tension stiffening of CPC. In addition, the number of cracks in CPC is less thanin RC at the same load and the bond of CPC near loading and is higher than that of RC, althoughthe average bond is almost same.approach combining nonlinear numerical analysis and global experimental response to develop thetension stiffening model parameters needed to simulate homogenized concrete behavThe results of this study providedreinforced whit steel and fiber(2002) used the results of seven groups of researtensile stiffness of the reinforcement rebars confined in reinforced concrete by consideringparameters including the cover thickness, spacing between cracks, rebars size, tension stiffening ofbare rebar and the softening effect of concrete. The studies of Ebead and Marzouk (2005) led tothe presentation of a tension stiffening model for the concrete strengthened by FRP sheets to beused in the analysis of two-way slabs strengthened by FRP sheets. Stramandi(2008) presented a curve with an exponential descending branch to explain the postand in their Equation, the exponential decline parameter α is a function of the member yield ratio (ρ) and the ratio of steel to concrete mospecimens with the length 500 mm and the strength 26 MPa, Shayanfarresulting tensile strength curve, into four regions for the member and presented Equations for anyregion of the curve. Regarding the bond
H.A. Rahdara and M. Ghalehnovi
strain relation of a reinforced concrete member under tension (CEB-
In past, many researches are conducted on the tension stiffening effect of the concretereinforced by steel and the concrete with normal strength. their results show that tensionof these members is considerable. Seong et al. (2011) presented a tension stiffening modelreinforced concrete elements subjected to uniaxial tension, shear or flexure the proposed modelenables the calculation of average tensile stresses in concrete, after yielding of reinforcement.proposed model makes it possible to accurately calculate reinforcement stresses at crack locations
average strain conditions which result in rupture of reinforcement. Threalistic predictions of the uniaxial, flexural, and shear ductility of reinforced concrete members.The tension stiffening effect of chemically pre stressed concrete (CPC) under uniaxial tension wasexperimentally investigated and compared with those of reinforced concrete (RC) by RaktipongSahamitmongkol and Toshiharu Kishi (2010). The results of their study show that the CPC hassuperior tension stiffening than RC and the conventional model for RC substantiallyunderestimates the tension stiffening of CPC. In addition, the number of cracks in CPC is less thanin RC at the same load and the bond of CPC near loading and is higher than that of RC, although
nd is almost same. Rim Nayal and Haydar A. Rasheed (2006) developapproach combining nonlinear numerical analysis and global experimental response to develop the
model parameters needed to simulate homogenized concrete behavprovided good model parameters to use in the case of concrete beams
reinforced whit steel and fiber-reinforced polymer (FRP) bars. In a report, Elfgren and Noghabai(2002) used the results of seven groups of researchers on about 50 analyses and experiments on thetensile stiffness of the reinforcement rebars confined in reinforced concrete by consideringparameters including the cover thickness, spacing between cracks, rebars size, tension stiffening of
nd the softening effect of concrete. The studies of Ebead and Marzouk (2005) led tothe presentation of a tension stiffening model for the concrete strengthened by FRP sheets to be
way slabs strengthened by FRP sheets. Stramandinoli and La Rovere(2008) presented a curve with an exponential descending branch to explain the post
Equation, the exponential decline parameter α is a function of the member yield ratio ) and the ratio of steel to concrete modulus of elasticity (n). Testing the reinforced concrete
specimens with the length 500 mm and the strength 26 MPa, Shayanfar et al. (2007) divided theresulting tensile strength curve, into four regions for the member and presented Equations for any
of the curve. Regarding the bond-slip and tension stiffening of the ordinary concrete with
-FIP 1993).
In past, many researches are conducted on the tension stiffening effect of the concrete memberstheir results show that tension stiffening
. (2011) presented a tension stiffening model. Intension, shear or flexure the proposed model
enables the calculation of average tensile stresses in concrete, after yielding of reinforcement. Theproposed model makes it possible to accurately calculate reinforcement stresses at crack locations
average strain conditions which result in rupture of reinforcement. This leads to morerealistic predictions of the uniaxial, flexural, and shear ductility of reinforced concrete members.
(CPC) under uniaxial tension wasexperimentally investigated and compared with those of reinforced concrete (RC) by RaktipongSahamitmongkol and Toshiharu Kishi (2010). The results of their study show that the CPC has
d the conventional model for RC substantiallyunderestimates the tension stiffening of CPC. In addition, the number of cracks in CPC is less thanin RC at the same load and the bond of CPC near loading and is higher than that of RC, although
Rim Nayal and Haydar A. Rasheed (2006) developed an inverseapproach combining nonlinear numerical analysis and global experimental response to develop the
model parameters needed to simulate homogenized concrete behavior in tension.good model parameters to use in the case of concrete beams
reinforced polymer (FRP) bars. In a report, Elfgren and Noghabaichers on about 50 analyses and experiments on the
tensile stiffness of the reinforcement rebars confined in reinforced concrete by consideringparameters including the cover thickness, spacing between cracks, rebars size, tension stiffening of
nd the softening effect of concrete. The studies of Ebead and Marzouk (2005) led tothe presentation of a tension stiffening model for the concrete strengthened by FRP sheets to be
noli and La Rovere(2008) presented a curve with an exponential descending branch to explain the post-cracking zone
Equation, the exponential decline parameter α is a function of the member yield ratio dulus of elasticity (n). Testing the reinforced concrete
. (2007) divided theresulting tensile strength curve, into four regions for the member and presented Equations for any
slip and tension stiffening of the ordinary concrete with
140

Post-cracking behavior of UHPC on the concrete members reinforced by steel rebar
FRP, Baena et al. (2013) presented a numerical model for analysis and compared its results withthe experimental results. Yoo and Nemkumar Banthia (2015) simulated the flexural behavior ofultra-high-performance fiber-reinforced concrete (UHPFRC) beams reinforced with steel and glassfiber-reinforced polymer (GFRP) rebars. Chao-Wei Tang (2015) studied the local bond stress-slipbehavior of reinforcing bars embedded in Lightweight aggregate concrete (LWAC).the result ofthis study show that the ultimate bond strength increased with the increase of concretecompressive strength. Calos Zanuy et al. (2009) presented the model to reproduce the distributionof longitudinal stresses and strains, bond stresses and relative slips along the crack spacing of areinforced concrete tie with number of cycles. Deng Zong-cai et al. (2013) conducting the pull outtest to investigate the bonding properties between high strength rebar and reactive powder concrete(RPC). The experimental results of the pullout and flexure tests conducted with HSS rebar inUHPC presented by saleem et al. (2013). Testing 35 direct tensile specimens, Lee and Kim (2009)examined the effect of the compressive strengths 20, 60 and 80 MPa on tension stiffening andcrack response of the specimens. Yazici (2007) studied effect of condition curing and mineraladditives with high-volume on the mechanical properties of the various compounds of ultra highperformance concrete. Graybeal and Tanesi (2007) emphasized that the largest size of sandparticles which used in construction UHPC is between 0.15 to 0.6 mm.
Since using ultra high performance concrete(UHPC) has attracted the attention of engineers dueto its special features such as high compressive strength, low penetrability and resistance to frostcycles and also, because Less attention to the effect of tension stiffening for reinforced concretemembers that UHPC are used to make them, In these research, doing a tensile test on the ultrahighperformance concrete specimens reinforced by steel rebars concrete, the tension stiffening effect isevaluated in the post-cracking stage by presenting an Equation.
2. Material properties, mixing process and preparation of specimens
2.1 Material properties
Ultra High Performance Concrete constituent materials are Portland cement, Silica fume,Quartz powder, Silica sand, superplasticizer and water.
The physical properties of the aggregates, used for this work, is descripted as follow:• Quartz powderQuartz powder is an important material in Ultra High Performance Concrete. Average diameter
of its particles is 0.01 mm. Quartz powder is a hard material that improves the properties of thematrix.
• Silica sandSand particle size is limited to 0.8 mm, but not less than 0.15 mm. silica sand has advantages
such as high hardness and easy access.• Super Plasticizer(Since water-cement ratio is very low for the Ultra High Performance Concrete, carboxylate-
based Plasticizers is used to provide concrete slump.)
2.2 Mixing process
Firstly, the dry materials mix together until a homogeneous mixture achieve .This can take
141

H.A. Rahdara and M. Ghalehnovi
Table 1 Characteristics of the specimens being tested
No. Name of specimen Diameter of specimen (mm) Rebar diameter (mm) Type of rebar Cover C/d* ρ**
1 65-12-A2 65 12 A2 26.5 2.0 3.53
2 65-12-A3 65 12 A3 26.5 2.0 3.53
3 100-12-A2 100 12 A2 44.0 3.0 1.46
4 100-12-A3 100 12 A3 44.0 3.0 1.46
5 150-12-A2 150 12 A2 69.0 5.0 0.64
6 150-12-A3 150 12 A3 69.0 5.0 0.64
7 65-16-A2 65 16 A2 24.5 1.5 6.65
8 65-16-A3 65 16 A3 24.5 1.5 6.45
9 100-16-A2 100 16 A2 42.0 2.5 2.63
10 100-16-A3 100 16 A3 42.0 2.5 2.63
11 150-16-A2 150 16 A2 67.0 4.0 1.15
12 150-16-A3 150 16 A3 67.0 4.0 1.15
* c/d: Ratio of cover thickness to rebar diameter** ρ: Reinforcement percentage
Table 2 the mix design of the concrete used to prepare the specimen
Materials Content (kgf)
Cement 670.0
Silica fume 200.0
Quartz powder 285.0
Silica sand 1020.0
Superplasticizer (3%) 20.1
Water 178.0 (Liter)
Note: The values listed for a cubic meter of concrete.)
Table 3 Mechanical properties of ultra high performance concrete based on the results of the experiments
Mechanical properties value
Compressive strength (MPa) 110.00
Modulus of elasticity (GPa) 41.18
Density (kgf/m3) 2100.00
Splitting tensile strength of cylindrical concrete Specimens (MPa) 10.51
Direct Tensile strength (MPa) 9.00
several minutes. Then part of the water and half of the super plasticizer add to the mix. Mixingwill continue until the materials completely combine. In the next step the remaining water andsuperplasticizer add to the mix.
Since in this research, ultra high performance concrete is used, the mix design and mechanicalproperties of the concrete are obtained from the related experiments and are given in Tables 2-3
2.3 Preparation of specimens
142

Post-cracking behavior of UHPC on the concrete members reinforced by steel rebar
Fig. 2 Details and characteristics of the concrete specimens being tested
12 specimens of ultra high performance concrete with steel reinforcement were prepared andtested. Any test specimen has a circular cross section, at the center of which there is a steel rebar asa reinforcement. The length of specimens is 850 mm and the reinforcement rebar is exposed as 150mm from both sides to be anchored in the tensile test device (Fig. 12). Two diameters of 12 and 16mm are used to examine the effect of rebar diameter and the diameters 65, 100 and 150 mm for thespecimens are chosen to apply the effect of concrete cover thickness (c/d) and reinforcement ratio(ρ) on the specimens. Two types of steel rebars A2 and A3 are also used to apply the effect ofreinforcement properties such as modulus of elasticity and strength on the concrete member'stension stiffening.
Concrete specimens are generally denoted by X-Y-M. Where X denotes the diameter of theconcrete specimen, Y denotes the diameter of the reinforcement rebar and M denotes the type ofreinforcement rebar. For example, 100-12-A2 shows a concrete specimen with the diameter 100mm reinforced by a steel rebar with the diameter 12 mm and the type of A2 at the center. Thedetailed characteristics of the specimens are given in Table 1.
For preparing the specimens, plastic cylindrical molds with the height 850 mm were firstprovided and the reinforcement rebar was placed at the center of the specimen's cross section usinga suitable bench over which the molds were put, and the concrete was placed in the molds in threestages and for any stage, a vibrating table was used for proper compaction and removal of theconcrete air.
3. Testing procedure
Specimens were preserved in vitro and after being processed for 28 days. tensile test wasperformed on them. In this test, the displacement speed of the tension jack is 0.7 mm/min. The
143
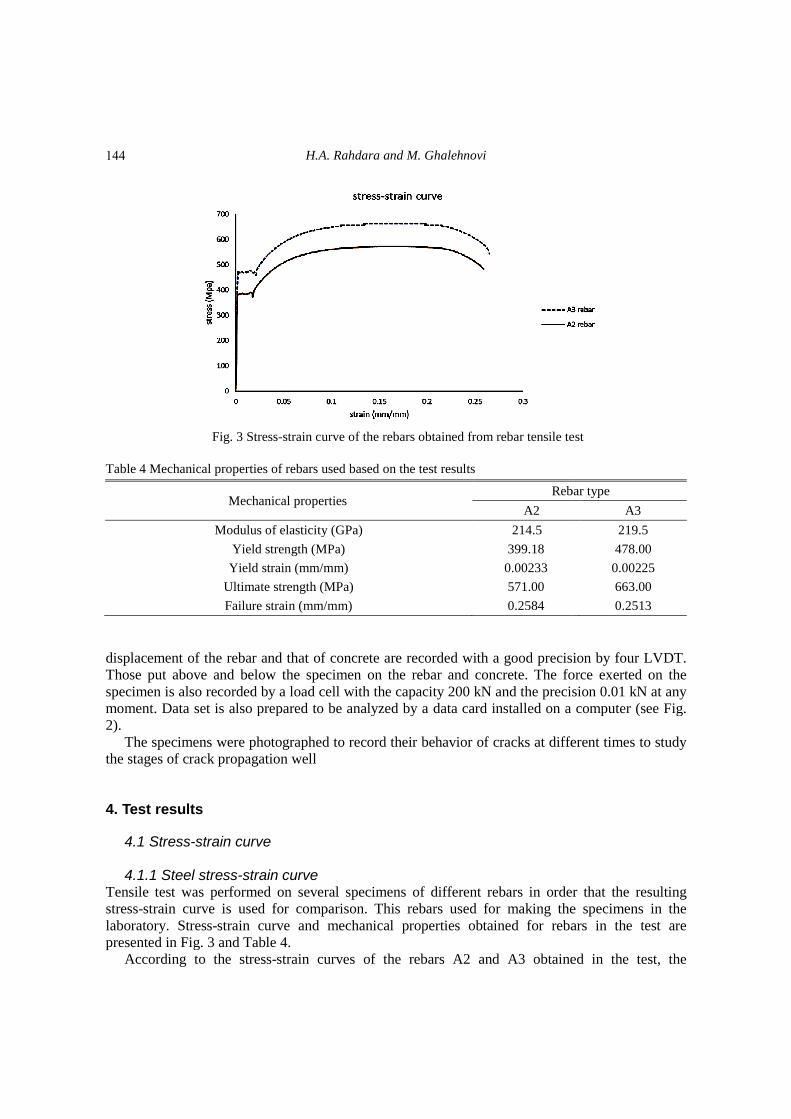
Fig. 3 Stress-strain
Table 4 Mechanical properties of rebars used based on the test results
Mechanical properties
Modulus of elasticity (GPa)
Yield strength (MPa)
Yield strain (mm/mm)
Ultimate strength (MPa)
Failure strain (mm/mm)
displacement of the rebar and that of concrete are recorded with a good precision by fourThose put above and below the specimen on thespecimen is also recorded by a load cell with the capacity 200 kN and the precision 0.01 kN at anymoment. Data set is also prepared to be analyzed by a data card installed on a computer (see Fig.2).
The specimens were photographed to record their behavior of cracks at different times to studythe stages of crack propagation well
4. Test results
4.1 Stress-strain curve
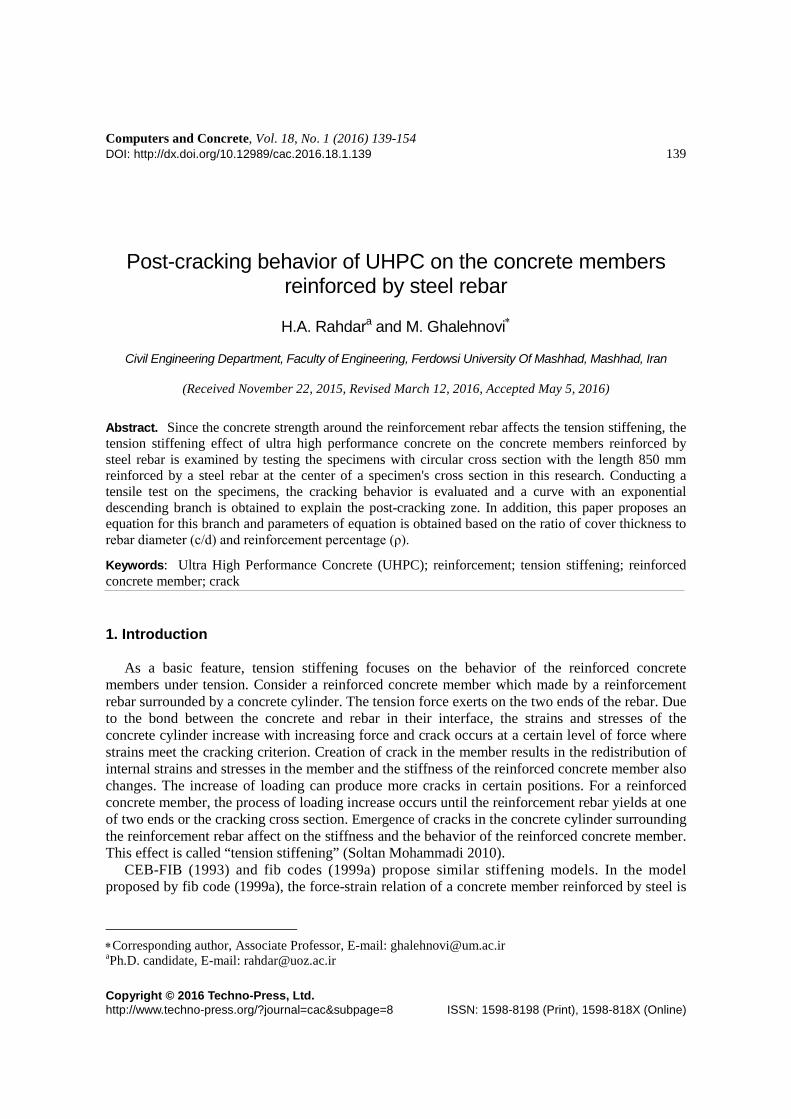
4.1.1 Steel stress-strain curveTensile test was performed on several specimens of different rebarsstress-strain curve is used for comparison. This rebarslaboratory. Stress-strain curve and mechanical properties obtainedpresented in Fig. 3 and Table 4.
According to the stress-strain curves of the rebars A2 and A3 obtained in the test, the
H.A. Rahdara and M. Ghalehnovi
strain curve of the rebars obtained from rebar tensile test
rebars used based on the test results
Mechanical propertiesRebar type
A2
Modulus of elasticity (GPa) 214.5
Yield strength (MPa) 399.18
strain (mm/mm) 0.00233
Ultimate strength (MPa) 571.00
Failure strain (mm/mm) 0.2584
displacement of the rebar and that of concrete are recorded with a good precision by fourThose put above and below the specimen on the rebar and concrete. The force exerted on thespecimen is also recorded by a load cell with the capacity 200 kN and the precision 0.01 kN at anymoment. Data set is also prepared to be analyzed by a data card installed on a computer (see Fig.
ens were photographed to record their behavior of cracks at different times to studythe stages of crack propagation well
strain curveTensile test was performed on several specimens of different rebars in order that the resulting
strain curve is used for comparison. This rebars used for making the specimens in thestrain curve and mechanical properties obtained for rebars in the test are
Fig. 3 and Table 4.strain curves of the rebars A2 and A3 obtained in the test, the
curve of the rebars obtained from rebar tensile test
Rebar type
A3
219.5
478.00
0.00225
663.00
0.2513
displacement of the rebar and that of concrete are recorded with a good precision by four LVDT.rebar and concrete. The force exerted on the
specimen is also recorded by a load cell with the capacity 200 kN and the precision 0.01 kN at anymoment. Data set is also prepared to be analyzed by a data card installed on a computer (see Fig.
ens were photographed to record their behavior of cracks at different times to study
in order that the resultingused for making the specimens in the
for rebars in the test are
strain curves of the rebars A2 and A3 obtained in the test, the
144

Post-cracking behavior of UHPC on the concrete members reinforced by steel rebar
mechanical properties of both types of rebars are calculatedA2 is 214.5 GPa and that of the rebar A3 is 219.5 GPa according to the curves (
4.1.2 Stress-strain curves of theTensile test was performed on all reinforced concrete specimens. The purpose of the test was to
determine the changes of the tensile strength of the reinforced concrete member in terms of themean strain of rebar compared to the single rebar strength and tto the tensile strength. Details of the test and notations of the specimens are presented inTable 1.
Curve of variations of total tensile strength of specimen (is shown in Figs. 4-5 (T: exerted force &
Fig. 4 Tensile strain-stress curve of ultra high performance concrete specimens reinforced by the rebar A2
Fig. 5 Tensile strain-stress curve of ultra
cracking behavior of UHPC on the concrete members reinforced by steel rebar
mechanical properties of both types of rebars are calculated. The modulus of elasticity of the rebar214.5 GPa and that of the rebar A3 is 219.5 GPa according to the curves (
strain curves of the reinforced concrete specimensTensile test was performed on all reinforced concrete specimens. The purpose of the test was to
determine the changes of the tensile strength of the reinforced concrete member in terms of themean strain of rebar compared to the single rebar strength and to obtain the concrete's contributionto the tensile strength. Details of the test and notations of the specimens are presented in
Curve of variations of total tensile strength of specimen (T/As) in terms of the mean strainexerted force & As: rebar cross section). The curves show that the tensile
stress curve of ultra high performance concrete specimens reinforced by the rebar A2
stress curve of ultra high performance concrete specimens reinforced by the rebar A3
cracking behavior of UHPC on the concrete members reinforced by steel rebar
he modulus of elasticity of the rebar214.5 GPa and that of the rebar A3 is 219.5 GPa according to the curves (Fig. 3).
Tensile test was performed on all reinforced concrete specimens. The purpose of the test was todetermine the changes of the tensile strength of the reinforced concrete member in terms of the
o obtain the concrete's contributionto the tensile strength. Details of the test and notations of the specimens are presented in Fig. 2 and
in terms of the mean strain (εsm)curves show that the tensile
stress curve of ultra high performance concrete specimens reinforced by the rebar A2
high performance concrete specimens reinforced by the rebar A3
145

H.A. Rahdara and M. Ghalehnovi
strain-stress curve of a reinforced concrete member can be divided into three regions. The region(1) describes the member's elastic behavior from the beginning of loading to the beginning of thefirst crack. The region (2) shows the member's behavior from the first crack to the last crack. Inthis region, transverse cracks occur successively until the steady state is achieved. As it is alsoobserved in the figures, the concrete's contribution significantly decreases after the first crack dueto the occurrence of subsequent cracks to the final cracking point. The region (3) describes themember's behavior after the crack until the steel yields.
The comparison of the curves in Figs. 4-5 shows that the difference of the specimens' responseis related to the steel content of the specimen's section and the rebar concrete cover thickness. Forthe specimens 150-16-A3, 150-16-A2, 150-12-A3 and 150-12-A2 whose steel content is low, theconcrete’s contribution to the specimen's total strength is significant compared the steelcontribution. However, for specimens 65-16-A3, 65-16-A2, 65-12-A3 and 65-12-A2 whose steelcontent is high, the concrete's contribution to the tensile strength is negligible and steel has thehighest contribution, so that the curve of the total strength changes of the reinforced concretespecimen is close to the single steel strength curve for these specimens.
Another point about Figs. 4-5 is that after the first crack occurred, the higher steel contentmakes later cracks occur more quickly and cracking reaches the crack stability point in lower meanstrain. Also, specimens with a high steel content reach the yield point in a strain close to the baresteel yield strain, while specimens with a low steel content reach the yield point in a strain lessthan the bare steel yield strain due to the concrete's significant contribution and higher bondstrength.
The comparison of the curves in Figs. 4-5 shows that for similar specimens, the change in rebartype from A2 to A3 has decreased the concrete's contribution to the specimen's total strength dueto the higher strength and modulus of elasticity of the rebar A3.
4.1.3 tensile strain-stress curves of concrete's contributionIf the total tensile force exerted on the specimen is denoted by T, the following equilibrium
Equation holds for any section
cs FFT += (1)
In the Equation above, Fs is the mean tensile force of the rebar's contribution that is obtainedfrom the following Equation
smSSS EAF ε= (2)
εsm is the rebar's mean strain of the reinforced concrete specimen that is determined during thetest for any exerted force T. As and Es are the cross section and modulus of elasticity of the rebar,respectively.The mean tensile force of the concrete's contribution is obtained from the Eq. (3).
SC FTF −= (3)
The mean tensile stress of the concrete is determined by the following Equation for thereinforced concrete specimen
C
CC A
F=σ (4)
146
Post-cracking behavior of UHPC on the concrete members reinforced by steel rebar
Fig. 6 The curve of the changes of the concrete's mean tensile stress versus the mean strain of the rebar A2
Fig. 7 The curve of the changes of the concrete's
In the Equation above, Ac is the concrete's net cross section (AUsing the Eq. (4), the changes of the concrete's mean tensile stress are obtained in terms of the
rebar's mean strain. The application of the Equation is very important for nonlinear analysis ofreinforced concrete structures by finite element method taking the smeared crack model intoaccount. Using the Equation, a tension stiffening model can be obtained for the stressof a reinforced concrete element that matches the actualeffective tensile strength of thepresented in Figs. 6-7.
The curves show that the concrete's effective tensile strength has a linear elastic behaviorbefore cracking. But after cracking, it has a descending branch that is callstiffening”. At first, the descending branch has a steep slope duesuccessive transverse cracks, but after reaching the steady state, it has a mild slope. Subsequently,the steel stress reaches the yield point in the crack
cracking behavior of UHPC on the concrete members reinforced by steel rebar
Fig. 6 The curve of the changes of the concrete's mean tensile stress versus the mean strain of the rebar A2
Fig. 7 The curve of the changes of the concrete's mean tensile stress versus the mean strain of the rebar A2
is the concrete's net cross section (Ac=Ag-As)., the changes of the concrete's mean tensile stress are obtained in terms of theThe application of the Equation is very important for nonlinear analysis of
reinforced concrete structures by finite element method taking the smeared crack model intoaccount. Using the Equation, a tension stiffening model can be obtained for the stressof a reinforced concrete element that matches the actual behavior. The curve of the changes ofeffective tensile strength of the concrete's contribution (σc) versus rebar's mean strain (
The curves show that the concrete's effective tensile strength has a linear elastic behaviorbefore cracking. But after cracking, it has a descending branch that is call “
. At first, the descending branch has a steep slope due to the quick occurrence ofbut after reaching the steady state, it has a mild slope. Subsequently,
the steel stress reaches the yield point in the cracks, but the specimen's mean strain and the steel
cracking behavior of UHPC on the concrete members reinforced by steel rebar
Fig. 6 The curve of the changes of the concrete's mean tensile stress versus the mean strain of the rebar A2
mean tensile stress versus the mean strain of the rebar A2
, the changes of the concrete's mean tensile stress are obtained in terms of theThe application of the Equation is very important for nonlinear analysis of
reinforced concrete structures by finite element method taking the smeared crack model intoaccount. Using the Equation, a tension stiffening model can be obtained for the stress-strain curve
behavior. The curve of the changes ofrebar's mean strain (εsm) is
The curves show that the concrete's effective tensile strength has a linear elastic behavior“concrete’s tension
to the quick occurrence ofbut after reaching the steady state, it has a mild slope. Subsequently,
, but the specimen's mean strain and the steel
147

H.A. Rahdara and M. Ghalehnovi
stress don’t reach the yield point in the spacing of two cracks that is due to uniform bond stressesin the spacing. Increasing the slip, there is no bond between the concrete and the steel and theeffective tensile strength of the concrete approaches zero. The mean strain of the specimen will bealso equal to the yield point strain of the rebar.
The strength of the curves obtained for specimens with different steel contents shows that at thebeginning of the curve's descending branch, the effective tensile strength of the concrete'scontribution for specimens with a low steel content is more than that of specimens with a highsteel content. While after the stage of stability of crack, specimens with a low steel content have alower tensile strength, because in this zone, the total tensile strength of reinforced concretespecimens is almost close to the bare steel strength and is similar for all specimens, and accordingto the inverse relation between stress and cross section and in similar force conditions, the tensilestress of the concrete's contribution is lower for specimens with a larger cross section (lower steelcontent).
5. Formulation of tensile behavior of ultra high performance concrete in reinforcedconcrete members with steel rebar
The curves in Figs. 6-7 show that the tensile behavior of ultra high performance concrete inreinforced concrete members under tension has two zones. The first zone is before cracking andthe second zone is after cracking. For the reinforcement concrete specimens, before cracking in thereinforcement concrete, force divides between the concrete and reinforcement. Before cracking,Concrete contribution increases linearly until reaching the tensile strength of concrete (Eq. (5)).After cracking, by increasing the number of cracks in concrete, concrete contribution ofstress tolerance gradually decreases exponentially. The ratio of the stress and strain ofconcrete after cracking to the cracking stress and strain is presented by Eq. (6).
Hence, the following Equations can be presented for tensile behavior of ultra high performanceconcrete in reinforced concrete members
Before cracking
ctc
tc
c εε
σσ
= (5)
After cracking (descending branch)
−
×=tc
c
tc
c eε
εβ
ασ
σ (6)
In these Equations, σct is the tensile stress of cracking and εc
t is its equivalent strain.σc and εc arealso the concrete's stress and strain, respectively. The parameters α and β are also obtained basedon the results of experiments on the specimens for different reinforcement ratios (ρ) and thickness covers to diameter rebars ratios (c/d) that are shown in Figs. 8 to 11.
148

Post-cracking behavior of UHPC on the concrete members reinforced by steel rebar
Fig. 8 The curve of the changes of β in terms of the reinforcement ratio (ρ)
Figs. 8- 9 show that increasing the reinforcement ratio (ρ), the parameters α and β decrease and for the rebar A3, their values are less than those for the rebar A2 that is due to the higher modulusof elasticity and strength of the rebar A3 compared to the rebarthe effect of the change in the rebar type is lower on the parameter β. According to the parameters α and β in the show that increasing the reinforcement ratio, the
Fig. 10 the curve of the changes of β in terms of c/d
Figs. 10-11 show that increasing the reinforcement ratio (c/d), the parameters α and β increase and for the rebar A3, their values are less than those for the rebar A2 that is due to the highermodulus of elasticity and strength of the rebar A3 compared to the rebathe effect of the change in the rebar type is lower on the parameter β, while the effect is lower parameter α for lower ratios.
6. Analysis of cracks
cracking behavior of UHPC on the concrete members reinforced by steel rebar
Fig. 8 The curve of the changes of β in terms of the Fig. 9 The curve of the changes of α in terms of the reinforcement ratio (ρ)
9 show that increasing the reinforcement ratio (ρ), the parameters α and β decrease and for the rebar A3, their values are less than those for the rebar A2 that is due to the higher modulusof elasticity and strength of the rebar A3 compared to the rebar A2. For high reinforcement ratios,
rebar type is lower on the parameter β. According to the parameters α and β in the Eq. (6), the changes of these parameters in terms of ρ show that increasing the reinforcement ratio, the tension stiffening effect decreases.
Fig. 10 the curve of the changes of β in terms of c/d Fig. 11 the curve of the changes of α in terms of c/d
11 show that increasing the reinforcement ratio (c/d), the parameters α and β increase and for the rebar A3, their values are less than those for the rebar A2 that is due to the highermodulus of elasticity and strength of the rebar A3 compared to the rebar A2. For high c/d ratios,the effect of the change in the rebar type is lower on the parameter β, while the effect is lower
cracking behavior of UHPC on the concrete members reinforced by steel rebar
Fig. 9 The curve of the changes of α in terms of the
9 show that increasing the reinforcement ratio (ρ), the parameters α and β decrease and for the rebar A3, their values are less than those for the rebar A2 that is due to the higher modulus
A2. For high reinforcement ratios,
, the changes of these parameters in terms of ρ stiffening effect decreases.
Fig. 11 the curve of the changes of α in terms of c/d
11 show that increasing the reinforcement ratio (c/d), the parameters α and β increase and for the rebar A3, their values are less than those for the rebar A2 that is due to the higher
r A2. For high c/d ratios,the effect of the change in the rebar type is lower on the parameter β, while the effect is lower on
149

Fig. 12 The comparison of cracks of specimens with the rebar diameter
In this section, the initial cracking force and the development range of cracks are presented forall specimens and finally, the spacing of cracks is compared for any specimen.
For the specimen 100-12-A2, the firstoccurred for the forces 26, 27, 29, 30 and 37 kN in this specimen. The creation and developmentof cracks continued to the force range from 46 to 50 kN. The minimum and maximum spacing ofcracks are 30 and 80 mm, respectively, and the mean spacing of cracks is 45 mm (see Fig. 12). Thefirst crack occurred for the force 15 kN in the specimen 65forces 17, 19, 20, 23 and 26 kN and the cracks opened in the force range frmean spacing of cracks is 50 mm in this specimen. For the specimen 150occurred suddenly for the force 39 kN. Subsequently, increasing the force to 48 kN, later cracksoccurred. The creation and development stage of cspecimen. In this specimen, the minimum and maximum spacing of cracks are 50 and 120 mmrespectively. The mean spacing of cracks is 68 mm for this specimen.
Fig. 13 The comparison of cracks of specimens
According to Fig. 13, the first crack occurred for the force 34 kN for the specimen 150Other cracks occurred for the forces 44, 49, 51, 54 and 64 kN. The crack development and openingoccurred for the force range from 70 to 78 kN and subsequently, crack was stable. The meanspacing of cracks is 58 mm, while minimum and maximum spacing of cracks are 36 and 80 mm,respectively. The distance between crack and edges of specimen is 80 mm. Theoccurred for the force 19.5 kN in the specimen 65
H.A. Rahdara and M. Ghalehnovi
Fig. 12 The comparison of cracks of specimens with the rebar diameter 12 and the type A2 (forces in kgf)
In this section, the initial cracking force and the development range of cracks are presented forall specimens and finally, the spacing of cracks is compared for any specimen.
A2, the first crack occurred for the force 24.6 kN. Other cracksoccurred for the forces 26, 27, 29, 30 and 37 kN in this specimen. The creation and developmentof cracks continued to the force range from 46 to 50 kN. The minimum and maximum spacing of
80 mm, respectively, and the mean spacing of cracks is 45 mm (see Fig. 12). Thefirst crack occurred for the force 15 kN in the specimen 65-12-A2 and later cracks occurred for theforces 17, 19, 20, 23 and 26 kN and the cracks opened in the force range from 40 to 47 kN. Themean spacing of cracks is 50 mm in this specimen. For the specimen 150-12occurred suddenly for the force 39 kN. Subsequently, increasing the force to 48 kN, later cracksoccurred. The creation and development stage of cracks continued to the force 52 kN in thisspecimen. In this specimen, the minimum and maximum spacing of cracks are 50 and 120 mmrespectively. The mean spacing of cracks is 68 mm for this specimen.
Fig. 13 The comparison of cracks of specimens with the rebar diameter 16 and the type A2 (forces in kgf)
According to Fig. 13, the first crack occurred for the force 34 kN for the specimen 150Other cracks occurred for the forces 44, 49, 51, 54 and 64 kN. The crack development and opening
curred for the force range from 70 to 78 kN and subsequently, crack was stable. The meanspacing of cracks is 58 mm, while minimum and maximum spacing of cracks are 36 and 80 mm,respectively. The distance between crack and edges of specimen is 80 mm. Theoccurred for the force 19.5 kN in the specimen 65-16-A2 and later cracks occurred for the forces
12 and the type A2 (forces in kgf)
In this section, the initial cracking force and the development range of cracks are presented for
crack occurred for the force 24.6 kN. Other cracksoccurred for the forces 26, 27, 29, 30 and 37 kN in this specimen. The creation and developmentof cracks continued to the force range from 46 to 50 kN. The minimum and maximum spacing of
80 mm, respectively, and the mean spacing of cracks is 45 mm (see Fig. 12). TheA2 and later cracks occurred for the
om 40 to 47 kN. The12-A2, some cracks
occurred suddenly for the force 39 kN. Subsequently, increasing the force to 48 kN, later cracksracks continued to the force 52 kN in this
specimen. In this specimen, the minimum and maximum spacing of cracks are 50 and 120 mm,
with the rebar diameter 16 and the type A2 (forces in kgf)
According to Fig. 13, the first crack occurred for the force 34 kN for the specimen 150-16-A2.Other cracks occurred for the forces 44, 49, 51, 54 and 64 kN. The crack development and opening
curred for the force range from 70 to 78 kN and subsequently, crack was stable. The meanspacing of cracks is 58 mm, while minimum and maximum spacing of cracks are 36 and 80 mm,respectively. The distance between crack and edges of specimen is 80 mm. The first crack
A2 and later cracks occurred for the forces
150
Post-cracking behavior of UHPC on the concrete members reinforced by steel rebar
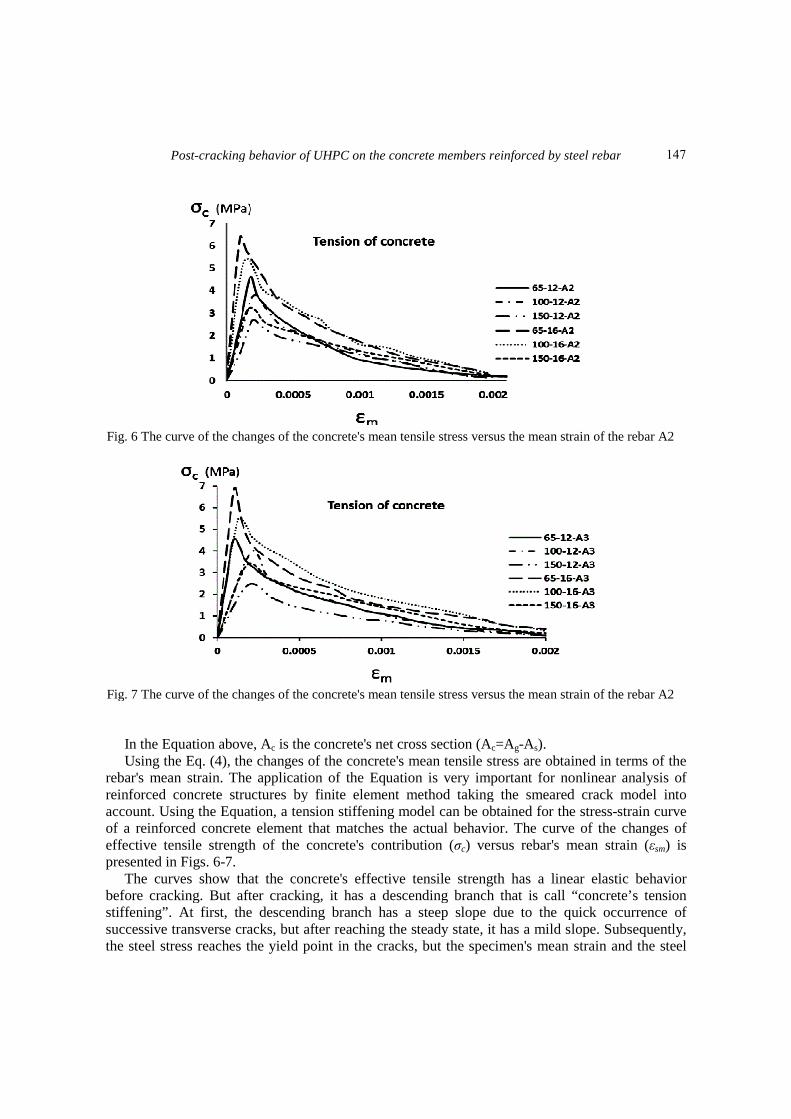
Fig. 14 The comparison of cracks of specimens with the rebar diameter 16 and the type A3 (forces in kgf)
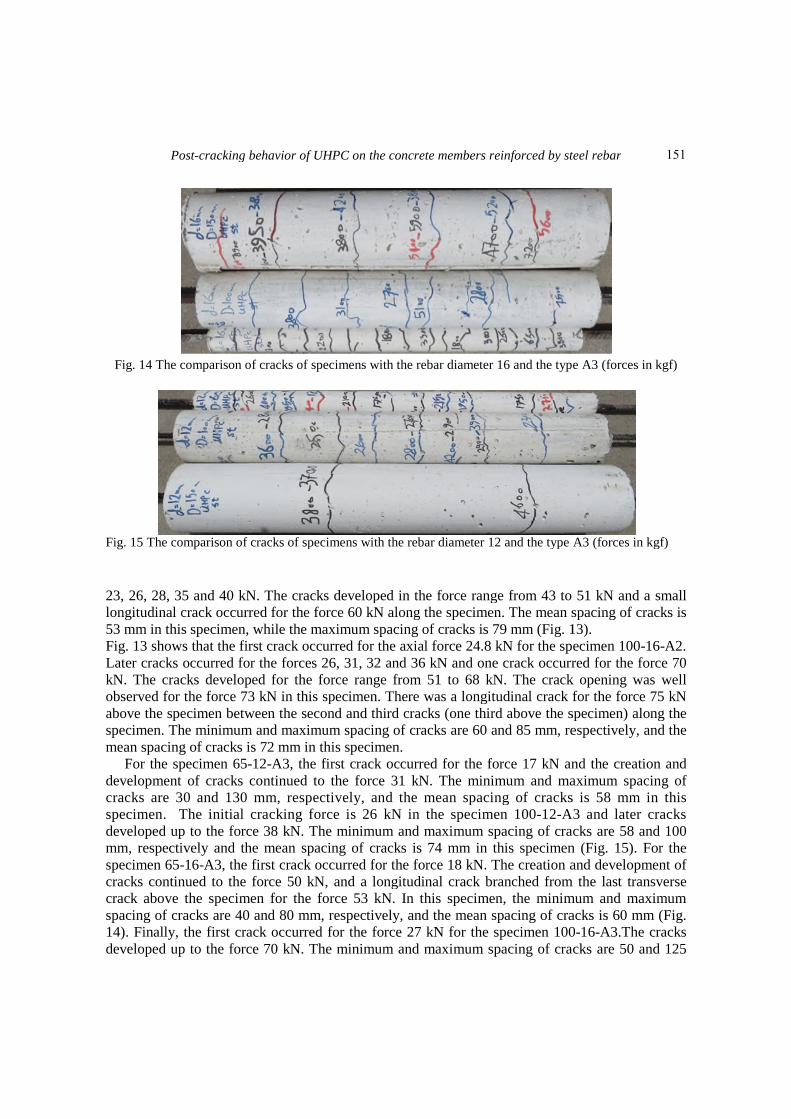
Fig. 15 The comparison of cracks
23, 26, 28, 35 and 40 kN. The cracks developed in the force range from 43 to 51 kN and a smalllongitudinal crack occurred for the force 60 kN along the specimen. The mean spacing53 mm in this specimen, while the maximum spacing of cracks is 79 mm (Fig. 13).Fig. 13 shows that the first crack occurred for the axial force 24.8 kN for the specimen 100Later cracks occurred for the forces 26, 31, 32 and 36 kN andkN. The cracks developed for the force range from 51 to 68 kN. The crack opening was wellobserved for the force 73 kN in this specimen. There was a longitudinal crack for the force 75 kNabove the specimen between the sspecimen. The minimum and maximum spacing of cracks are 60 and 85 mm, respectively, and themean spacing of cracks is 72 mm in this specimen.
For the specimen 65-12-A3, the first crack occurredevelopment of cracks continued to the force 31 kN. The minimum and maximum spacing ofcracks are 30 and 130 mm, respectively, and the mean spacing of cracks is 58 mm in thisspecimen. The initial cracking forcedeveloped up to the force 38 kN. The minimum and maximum spacing of cracks are 58 and 100mm, respectively and the mean spacing of cracks is 74 mm in this specimen (Fig. 15). For thespecimen 65-16-A3, the first crack occurred for the force 18 kN. The creation and development ofcracks continued to the force 50 kN, and a longitudinal crack branched from the last transversecrack above the specimen for the force 53 kN. In this specimen, the minimum and maxispacing of cracks are 40 and 80 mm, respectively, and the mean spacing of cracks is 60 mm (Fig.14). Finally, the first crack occurred fordeveloped up to the force 70 kN. The minimum and maximum sp
cracking behavior of UHPC on the concrete members reinforced by steel rebar
Fig. 14 The comparison of cracks of specimens with the rebar diameter 16 and the type A3 (forces in kgf)
of specimens with the rebar diameter 12 and the type A3 (forces in kgf)
23, 26, 28, 35 and 40 kN. The cracks developed in the force range from 43 to 51 kN and a smalllongitudinal crack occurred for the force 60 kN along the specimen. The mean spacing53 mm in this specimen, while the maximum spacing of cracks is 79 mm (Fig. 13).Fig. 13 shows that the first crack occurred for the axial force 24.8 kN for the specimen 100Later cracks occurred for the forces 26, 31, 32 and 36 kN and one crack occurred for the force 70kN. The cracks developed for the force range from 51 to 68 kN. The crack opening was wellobserved for the force 73 kN in this specimen. There was a longitudinal crack for the force 75 kNabove the specimen between the second and third cracks (one third above the specimen) along thespecimen. The minimum and maximum spacing of cracks are 60 and 85 mm, respectively, and themean spacing of cracks is 72 mm in this specimen.
A3, the first crack occurred for the force 17 kN and the creation anddevelopment of cracks continued to the force 31 kN. The minimum and maximum spacing ofcracks are 30 and 130 mm, respectively, and the mean spacing of cracks is 58 mm in thisspecimen. The initial cracking force is 26 kN in the specimen 100-12-A3 and later cracksdeveloped up to the force 38 kN. The minimum and maximum spacing of cracks are 58 and 100mm, respectively and the mean spacing of cracks is 74 mm in this specimen (Fig. 15). For the
e first crack occurred for the force 18 kN. The creation and development ofcracks continued to the force 50 kN, and a longitudinal crack branched from the last transversecrack above the specimen for the force 53 kN. In this specimen, the minimum and maxispacing of cracks are 40 and 80 mm, respectively, and the mean spacing of cracks is 60 mm (Fig.
crack occurred for the force 27 kN for the specimen 100developed up to the force 70 kN. The minimum and maximum spacing of cracks are 50 and 125
cracking behavior of UHPC on the concrete members reinforced by steel rebar
Fig. 14 The comparison of cracks of specimens with the rebar diameter 16 and the type A3 (forces in kgf)
of specimens with the rebar diameter 12 and the type A3 (forces in kgf)
23, 26, 28, 35 and 40 kN. The cracks developed in the force range from 43 to 51 kN and a smalllongitudinal crack occurred for the force 60 kN along the specimen. The mean spacing of cracks is53 mm in this specimen, while the maximum spacing of cracks is 79 mm (Fig. 13).Fig. 13 shows that the first crack occurred for the axial force 24.8 kN for the specimen 100-16-A2.
one crack occurred for the force 70kN. The cracks developed for the force range from 51 to 68 kN. The crack opening was wellobserved for the force 73 kN in this specimen. There was a longitudinal crack for the force 75 kN
econd and third cracks (one third above the specimen) along thespecimen. The minimum and maximum spacing of cracks are 60 and 85 mm, respectively, and the
d for the force 17 kN and the creation anddevelopment of cracks continued to the force 31 kN. The minimum and maximum spacing ofcracks are 30 and 130 mm, respectively, and the mean spacing of cracks is 58 mm in this
A3 and later cracksdeveloped up to the force 38 kN. The minimum and maximum spacing of cracks are 58 and 100mm, respectively and the mean spacing of cracks is 74 mm in this specimen (Fig. 15). For the
e first crack occurred for the force 18 kN. The creation and development ofcracks continued to the force 50 kN, and a longitudinal crack branched from the last transversecrack above the specimen for the force 53 kN. In this specimen, the minimum and maximumspacing of cracks are 40 and 80 mm, respectively, and the mean spacing of cracks is 60 mm (Fig.
the force 27 kN for the specimen 100-16-A3.The cracksacing of cracks are 50 and 125
151

H.A. Rahdara and M. Ghalehnovi
Table 5 The comparison of the initial cracking forces of the reinforced concrete member and the meanspacing of cracks
No. Specimen Initial cracking force (kN) Mean spacing of cracks (mm)
1 65-12-A2 15.0 50
2 65-12-A3 17.0 58
3 100-12-A2 24.6 45
4 100-12-A3 26.0 74
5 150-12-A2 39.0 68
6 150-12-A3 39.5 185
7 65-16-A2 19.5 53
8 65-16-A3 18.0 60
9 100-16-A2 24.8 72
10 100-16-A3 27.0 79
11 150-16-A2 24.0 58
12 150-16-A3 38.0 103
mm, respectively, and the mean spacing of cracks is 79 mm in this specimen. To examine better,the results of the cracks analysis are presented in Table 5 that include the initial cracking force andthe mean spacing of cracks.
The study of the crack behavior in the specimens being tested shows that increasing theconcrete cover thickness on rebars, the initial cracking force increases in all specimens. Inspecimens with similar diameter, the increase in rebar diameter that leads to the increase in thereinforcement percent of the specimen increases its initial cracking force. On the other hand, thechange in the rebar type has slightly affected the initial cracking force in specimens with similardiameter. Also, increasing the concrete cover thickness on rebars, the mean spacing of cracks hasincreased and the number of cracks has decreased. The increase in the reinforcement percent(increase of rebar diameter) for specimens with similar diameter resulted in the increase in themean spacing of cracks. Although the modulus of elasticity of both types of rebar A2 and A3 is notlargely different, the change in the rebar type in similar specimens has slightly increased the meanspacing of cracks.
7. Conclusions
In this research, the tension stiffening effect of ultra high performance concrete on the behaviorof the concrete members reinforced by steel rebar was studied. The research was conducted bytensile test of 12 ultra high performance concrete specimens with circular cross section and thelength 850 mm reinforced by a rebar at the center of specimen. The displacement speed of thetension jack was taken as 0.7 mm/min and the displacements and forces exerted on the specimenwere recorded at any moment. According to the data obtained from experiments, the followingresults were obtained:
• According to the experimental results and curves related to the tension stiffening effect, it canbe concluded that the presented experimental technique directly evaluates the tension stiffening
152

Post-cracking behavior of UHPC on the concrete members reinforced by steel rebar
effect of ultra high performance concrete on the concrete members reinforced by steel rebar and ismore suitable than other indirect procedures.
• Before the stage of crack formation, the initial stiffness ratio of specimens presents a goodanalysis of the tension stiffening effect. The ratio largely depends on the concrete specimen'sreinforcement percent, and increasing the reinforcement ratio (ρ), the ratio decreases. Also for similar specimens, the ratio for the rebars A2 is more than the rebars A3, showing the increase inthe concrete stiffening effect.
• For specimens with different steel contents at the beginning of the descending branch of thecurve, the effective tensile strength of the concrete's contribution is more than the specimens witha high steel content for those with a low steel content. However, after the cracks were stable,specimens with a low steel content had a lower tensile strength, because in this zone, the tensilestrength of reinforced concrete specimens is almost close to the bare steel strength and is similarfor all specimens.
• Increasing the reinforcement ratio (ρ), the parameters α and β decrease and for the rebar A3, their values are less than those for the rebar A2 that is due to the higher modulus of elasticity andstrength of the rebar A3 compared to the rebar A2. For high reinforcement ratios, the effect of thechange in the rebar type is lower on the parameter β. According to the parameters α and β in the Equations presented, the changes of both parameters in terms of ρ show that the increasing the reinforcement ratio, the tension stiffening effect decreases.
• In crack stability stage, the mean spacing of cracks is less than the specimens of the rebar A3for those of the rebar A2. Hence, the number of cracks is more than the specimens of the rebar A3for those of the rebar A2 that results more decrease of the tension stiffening effect in thesespecimens.As the increase of c/d ratio increased the initial stiffness, the force required for the beginning ofthe cracking stage has also increased.
References
Saleem, M.A., Mirmiran, A., Xia, J. and Mackie, K. (2012), “Development length of high-strength steelrebar in ultrahigh performance concrete”, J. Mater. Civil Eng., 25(8), 991-998.
Baena, M., Torres, L., Turon, A. and Miàs, C. (2013), “Analysis of cracking behaviour and tensionstiffening in FRP reinforced concrete tensile elements”, Compos. Part B: Eng., 45(1), 1360-1367.
CEB-FIP (1993), Model Code for Concrete Structures, Committee Euro- International du Beton andFederation Internationale de la Precontrainte, Thomas Telford, London.
Zong-cai, D., Daud, J.R. and Chang-xing, Y. (2014), “Bonding between high strength rebar and reactivepowder concrete”, Comput. Concrete, 13(3), 411-421.
Yoo, D.Y. and Banthia, N. (2015), “Numerical simulation on structural behavior of UHPFRC beams withsteel and GFRP bars”, Comput. Concrete, 16(5), 759-774.
Ebead, U.A. and Marzouk, H. (2005), “Tension-stiffening model for FRP-strenghened RC concrete two-wayslabs”, Mater. Struct., 38(2), 193-200.
Elfgren, L. and Noghabai, K. (2002), “Tension of reinforced concrete prisms. Bond properties ofreinforcement bars embedded in concrete tie elements. Summary of a RILEM round-robin investigationarranged by TC 147-FMB ‘Fracture Mechanics to Anchorage and Bond’”, Mater. Struct., 35(6), 318-325.
FIB (1999a), Structural Concrete, Textbook on Behavior, Design and Performance, Bulletin 1, federationinternationale du beton, Lausanne, Switzerland, 224.
Graybeal, B. and Tanesi, J. (2007), “Durability of an ultrahigh-performance concrete”, J. Mater. Civil Eng.,19(10), 848-854.
153

H.A. Rahdara and M. Ghalehnovi
Lee, G.Y. and Kim, W. (2009), “Cracking and tension stiffening behavior of high-strength concrete tensionmembers subjected to axial load”, Adv. Struct. Eng., 12(2), 127-137.
Nayal, R. and Rasheed, H.A. (2006), “Tension stiffening model for concrete beams reinforced with steel andFRP bars”, J. Mater. Civil Eng., 18(6), 831-841.
Sahamitmongkol, R. and Kishi, T. (2011), “Tension stiffening effect and bonding characteristics ofchemically prestressed concrete under tension”, Mater. Struct., 44(2), 455-474.
Lee, S.C., Cho, J.Y. and Vecchio, F.J. (2011), “Model for post-yield tension stiffening and rebar rupture inconcrete members”, Eng. Struct., 33(5), 1723-1733.
Shayanfar, M.A., Ghalehnovi, M. and Safiey, A. (2007), “Corrosion effects on tension stiffening behavior ofreinforced concrete”, Comput. Concrete, 4(5), 403-424.
Soltan Mohammadi, M. (2010), “Stiffening behavior modeling elements reinforced with FRP reinforcedconcrete in pure tension”, J. Sharif Civil Eng., 26(2), 11-19.
Stramandinoli, R.S. and La Rovere, H.L. (2008), “An efficient tension-stiffening model for nonlinearanalysis of reinforced concrete members”, Eng. Struct., 30(7), 2069-2080.
Tang, C.W. (2015), “Local bond stress-slip behavior of reinforcing bars embedded in lightweight aggregateconcrete”, Comput. Concrete, 16(3), 449-466.
Yazici, H. (2007), “The effect of curing conditions on compressive strength of ultra high strength concretewith high volume mineral admixtures”, Build. Envir., 42(5), 2083-2089.
Zanuy, C., Albajar, L. and de la Fuente, P. (2010), “On the cracking behaviour of the reinforced concretetension chord under repeated loading”, Mater. Struct., 43(5), 611-632.
CC
154