Possibilities and Constraints in Adoption of Alternative...
200
Study No. 142 Publication No. 190 Possibilities and Constraints in Adoption of Alternative Crops to Paddy in Green Revolution belt of North India (Western U.P.) Prof. Ramendu Roy 2014 Agro-Economic Research Centre University of University of University of University of Allahabad Allahabad Allahabad Allahabad Allahabad Allahabad Allahabad Allahabad-211002 211002 211002 211002
Transcript of Possibilities and Constraints in Adoption of Alternative...

Study No. 142 Publication No. 190
Possibilities and Constraints in Adoption of Alternative
Crops to Paddy in Green Revolution belt of North India
(Western U.P.)
Prof. Ramendu Roy
2014
Agro-Economic Research Centre
University ofUniversity ofUniversity ofUniversity of Allahabad Allahabad Allahabad Allahabad AllahabadAllahabadAllahabadAllahabad----211002 211002 211002 211002

PREFACE
Prior to Green Revolution, India was facing acute shortage of foodgrains to fulfill the
consumption needs of the people. The huge quantities of wheat were imported from USA
under PL 480 to meet the consumption requirement of the people across the country. After
advent of Green Revolution in the country, the diversion in cropped area has taken place
very fast in favour of rice and wheat. The expansion of irrigation net-works, use of HYV
seeds, fertilizers, pesticides, new scientific techniques, adoption of mechanization in
agriculture, etc. were also cause of diversification of areas under coarse grains, pulses and
oilseeds towards rice and wheat crops. On account of use of new strategy in rice and wheat
crops, the yield and profitability of these two crops have increased manifold in comparison
to its competing crops. In order to get high yield and maximum profitability, the farmers
had devoted maximum area to rice and wheat crops in the cropping pattern than other
crops. The rice-wheat has become common rotation in cropping sequence. The repeating of
rice-wheat rotation is in neither good for soil health nor agro-ecosystem. In spite of this,
dwindling ground water resources due to excessive withdrawal of water for irrigation, led
to impurities in water, a cause of attendant crop health effect.
This mono- cropping system is also cause of stagnancy in the yield of rice and wheat.
Because of this, the profitability of rice and wheat crops has been showing the diminishing
trends since last decade. The continuous adoption of rice wheat rotation is also cause of
infestation weeds, contamination of ground water, incidences of pests, diseases and
deterioration of soil health. Hence, it is needed to diversify the area under paddy to its
competing crops to improve the soil texture, check the depleting ground water and enhance
the farm income. To maintain the dynamic equilibrium of agro-ecosystem and improve the
quality of soil texture, the diversification of area of paddy to maize, bajra, urd etc are most
important task at present scenario. In this context, Government of India has issued
guidelines for crops diversifying in original Green Revolution belts of the country. Nine
states of the country have been covered under this programme. The finance Ministry has
provided an amount Rs. 500 crores to nine states for this programme to diversify the area of

paddy to alternative crops in year 2013-14. Among nine states, U.P. is one of them, where
this programme has been initiated during 2013-14.
The area under paddy was 3059.70 thousand hectares in U.P. in year TE 1970-71 which
has significantly increased to 5797.30 thousand hectares in TE 2012-13, there by showing
89.47% increase over the period. Out of GCA during 2009-10, paddy accounted for 23%
area alone in U.P. The area under paddy has been continuously increasing from year to year
since 1970-71 in U.P. On account of this, the ground water table in paddy producing
districts of Uttar Pradesh has been going down and will pose a cute shortage of drinking
water in years to ahead.
In the wake of this emerging scenario in the country, Government of India is advising to
the rice producing states to motivate the farmers to devote some areas to alternative crops
from paddy. The decline in ground water table has been observed maximum in western
region of Uttar Pradesh. The same observation has also been noticed in Punjab and
Haryana states. Therefore, AER Centre, Ludhiyana has proposed to undertake a study
entitled “Possibility and Constraints in Adoption of Alternative Crops to Paddy in
Green Revolution Belt of North India”. On the advice of AER Centre Ludhiyana, the
AER Centre, Allahabad has also conducted this study in six districts namely, Aligarh,
Mainpuri, Buland Shahar, Barielly and Amroha of western region of Uttar Pradesh. The
total 210 sample farmers were selected from six mentioned districts of west U.P. for the
study. The research methodology and analysis of secondary and primary data have been
followed as per guidelines of Co-ordinator Centre, Ludhiyana. The over all findings of the
study are that the paddy is still dominant crop on the sample farms due to its higher yield
and net income in comparison to alternative crops. The production efficiencies and
marketing efficiency of paddy are also better than the bajra, maize, urd etc. However, the
farmers are now realizing the importance of alternative crops and giving weightage in
cropping pattern.
I am highly obliged to Director of AER Centre, Ludhiyana (Punjab) to provide us an
opportunity to under-take this study in western region of U.P. I am also thankful to Director
of Agriculture and Director of Economics and Statistics of Uttar Pradesh for their full

support and cooperation in smooth conduct of the study in six selected districts of western
region of U.P. The Deputy Director of Agriculture of Aligarh, Mainpuri, Buland Shahar,
Mathura, Bareilly and Amorha had provided full support to research team of the centre,
during the collection of secondary and primary data of the study. I am thankful to them.
My appreciation also goes to research team members namely Shri Ramji Pandey, Shri S. N.
Shukla, Shri R.S. Maurya, Shri Hasib Ahmad and Dr. H.C. Malviya for doing hard work in
the completing the study. Smt. N. Nigam and Shri Ovesh Ahmad have also done excellent
work in compilation of secondary data. Computer typing of manuscript of the report and
posted the data on M.S. Excel has been done by Smt. N. Nigam. I pay my good wishes to
them. The report has been drafted by Shri D.K. Singh, Ex. Research Officer of the Centre
for which he deserves the credit. The ministerial and technical staff of Centre have also
supported in the completion of the report. I am thankful to them.
I also acknowledge the help of sample farmers to support the research team during filling
up the schedules and questionnaires of the study. Any comments and suggestions for the
improvement in the report are solicited and will be acknowledged thankfully.
(Ramendu Roy)
Agro-Economic Research Centre Prof. & Hon. Director
University of Allahabad
Allahabad.
Date 01.05.2015

CREDITCREDITCREDITCREDIT
Overall Supervision Prof. Ramendu Roy
Drafting of Report Shri D.K. Singh, Ex R.O.
Collection of Primary Data Shri Ramji Pandey
Shri. S.N. Shukla Shri R.S. Maurya
Shri Hasib Ahmad Dr. H.C. Malviya
Tabulation & Analysis of Data Shri Ramji Pandey Posting of Data on M.S. Excel & Computer Typing Smt. Nirupama Nigam Secretarial Services Smt. M.R. Kesherwani &
Shri S. D. Singh
Xeroxing Shri H.C. Upadhyay
Support Services Shri Raju Kumar
Shri Virendra Kumar
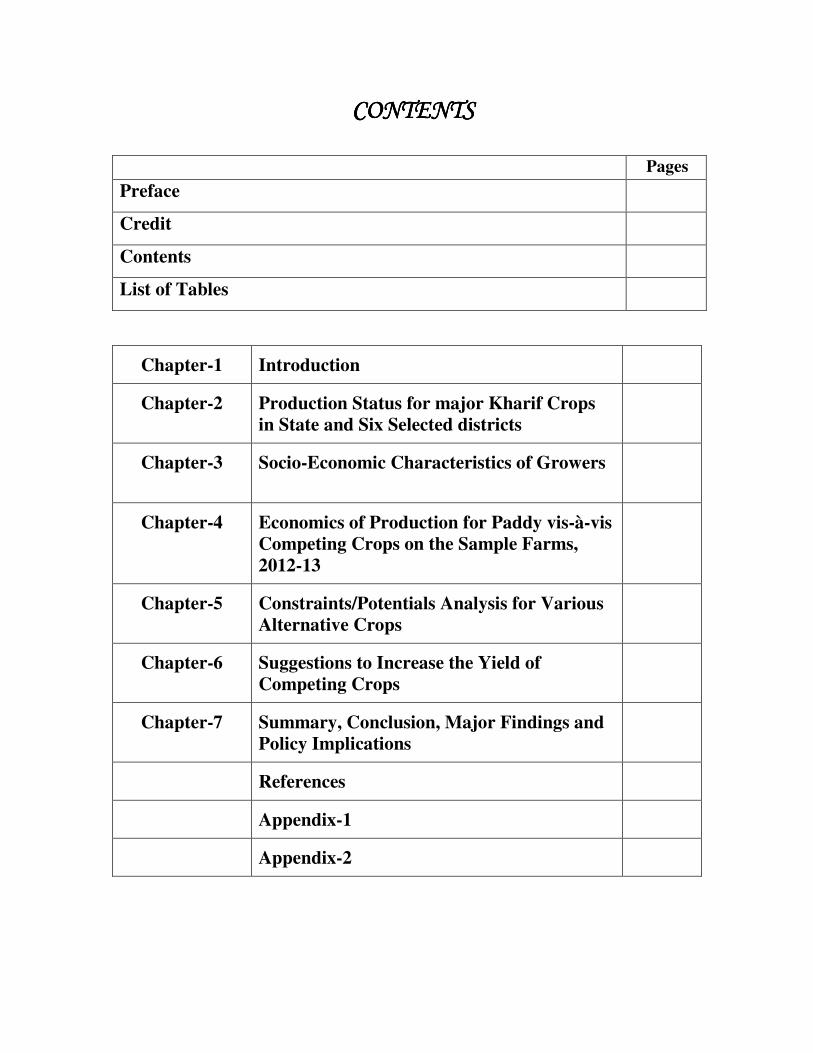
CONTENTSCONTENTSCONTENTSCONTENTS
Pages
Preface
Credit
Contents
List of Tables
Chapter-1 Introduction
Chapter-2 Production Status for major Kharif Crops in State and Six Selected districts
Chapter-3 Socio-Economic Characteristics of Growers
Chapter-4 Economics of Production for Paddy vis-à-vis Competing Crops on the Sample Farms,
2012-13
Chapter-5 Constraints/Potentials Analysis for Various Alternative Crops
Chapter-6 Suggestions to Increase the Yield of Competing Crops
Chapter-7 Summary, Conclusion, Major Findings and Policy Implications
References
Appendix-1
Appendix-2
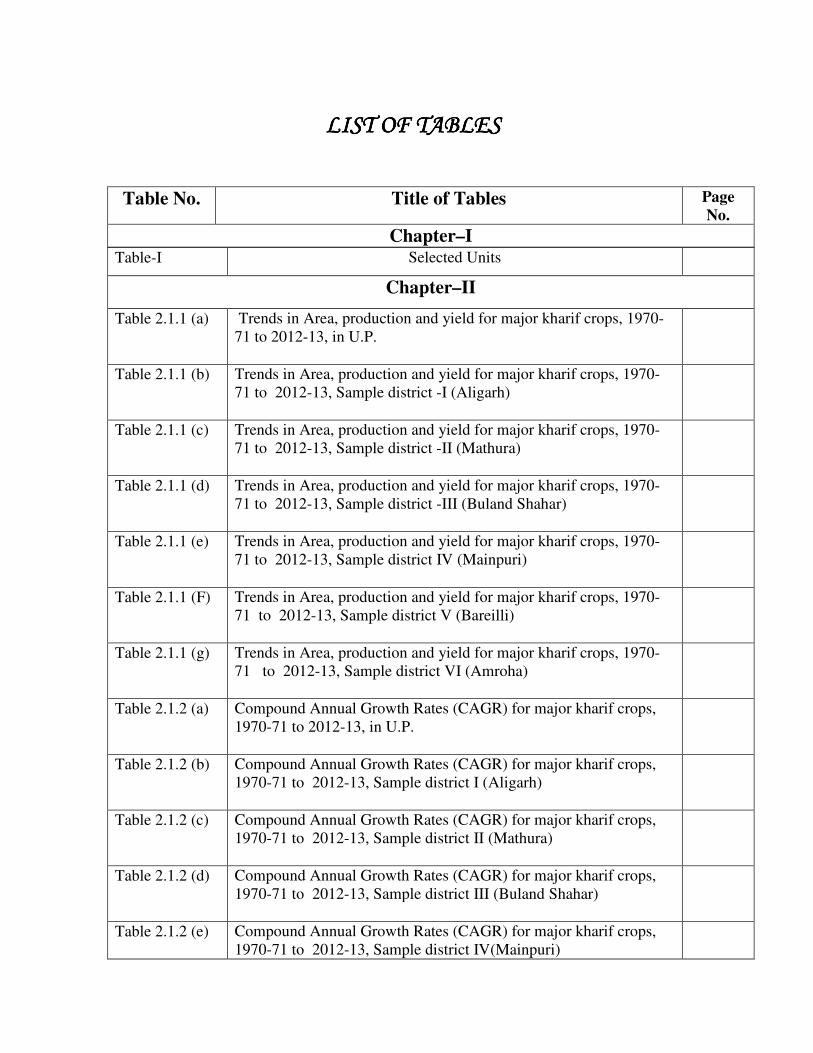
LIST OF TABLESLIST OF TABLESLIST OF TABLESLIST OF TABLES
Table No. Title of Tables Page
No.
Chapter–I Table-I Selected Units
Chapter–II
Table 2.1.1 (a) Trends in Area, production and yield for major kharif crops, 1970-
71 to 2012-13, in U.P.
Table 2.1.1 (b) Trends in Area, production and yield for major kharif crops, 1970-
71 to 2012-13, Sample district -I (Aligarh)
Table 2.1.1 (c) Trends in Area, production and yield for major kharif crops, 1970-
71 to 2012-13, Sample district -II (Mathura)
Table 2.1.1 (d) Trends in Area, production and yield for major kharif crops, 1970-
71 to 2012-13, Sample district -III (Buland Shahar)
Table 2.1.1 (e) Trends in Area, production and yield for major kharif crops, 1970-
71 to 2012-13, Sample district IV (Mainpuri)
Table 2.1.1 (F) Trends in Area, production and yield for major kharif crops, 1970-
71 to 2012-13, Sample district V (Bareilli)
Table 2.1.1 (g) Trends in Area, production and yield for major kharif crops, 1970-
71 to 2012-13, Sample district VI (Amroha)
Table 2.1.2 (a) Compound Annual Growth Rates (CAGR) for major kharif crops,
1970-71 to 2012-13, in U.P.
Table 2.1.2 (b) Compound Annual Growth Rates (CAGR) for major kharif crops,
1970-71 to 2012-13, Sample district I (Aligarh)
Table 2.1.2 (c) Compound Annual Growth Rates (CAGR) for major kharif crops,
1970-71 to 2012-13, Sample district II (Mathura)
Table 2.1.2 (d) Compound Annual Growth Rates (CAGR) for major kharif crops,
1970-71 to 2012-13, Sample district III (Buland Shahar)
Table 2.1.2 (e) Compound Annual Growth Rates (CAGR) for major kharif crops,
1970-71 to 2012-13, Sample district IV(Mainpuri)

Table 2.1.2 (f) Compound Annual Growth Rates (CAGR) for major kharif crops,
1970-71 to 2012-13, Sample district V (Bareilly)
Table 2.1.2 (g) Compound Annual Growth Rates (CAGR) for major kharif crops,
1970-71 to 2012-13, Sample district VI (Amroha)
Table 2.2 Procurement of Major Kharif Crops by different Agencies, 1970-71
to 2010-11,
Chapter–III
Table: 3.1 General Characteristics of sample households, 2012-13,
Table: 3.2 Average land holding of sample households, 2012-13
Table 3.3 Average Farm inventory ownership, sample households, 2012-13
Table 3.3 (a) Total value of farm inventory, ownership, sample households, 2012-
13
Table 3.4.1 Cropping Pattern of sample households, 2012-13
Table 3.4.2 Potential alternative crops to paddy crop as perceived by Sample
households, 2012-13
Table 3.5.1 (a) Production and Crop retention pattern of Paddy, sample households,
2012-13
Table 3.5.1 (b) Production and Crop retention pattern of Competing crop -I (Bajra)
sample households, 2012-13
Table 3.5.1 (c) Production and Crop retention pattern of Competing (Maize),
sample households, 2012-13
Table 3.5.1 (d) Production and Crop retention pattern of Competing crop III (Urd),
sample households, 2012-13
Table 3.5.2 (a) Disposal pattern of paddy, sample households, 2012-13
Table 3.5.2 (b) Disposal pattern of Competing Crop-1 (Bajra), sample households,
2012-13
Table 3.5.2 (c) Disposal pattern of Competing Crop-II (Maize), sample households,
2012-13
Table 3.5.2 (d) Disposal pattern of Competing Crop-III (Urd), sample households,
2012-13
Chapter–IV

Table 4.1 (a) Input use pattern for cultivation of paddy, sample households,
2012-13
Table 4.1 (b) Input use pattern for cultivation of competing crop I (Bajra), sample
households, 2012-13
Table 4.1 (c) Input use pattern for cultivation of competing crop-II (Maize),
sample households, 2012-13
Table 4.1 (d) Input use pattern for cultivation of competing crop III (Urd), sample
households, 2012-13
Table 4.2 (a) Cost of cultivation (Variable cost) of paddy, sample households,
2012-13
Table 4.2 (b) Cost of cultivation (Variable cost) of Bajra, sample households,
2012-13
Table 4.2 (c) Cost of cultivation (Variable cost) of Maize, sample households,
2012-13
Table 4.2 (d) Cost of cultivation (Variable cost) of Urd, sample households, 2012-
13
Table 4.3 Economics of paddy vis-à-vis competing crops, sample households,
2012-13
Table 4.4.1 Estimated yield function paddy vis-à-vis competing crops, sample
households, 2012-13
Table 4.4.2 (a) The Marginal Value Product (MVP) and Marginal Factor Cost
(MFC) of Important inputs for paddy, sample households, 2012-13
Table 4.4.2 (b) The Marginal Value Product (MVP) and Marginal Factor Cost
(MFC) of Important inputs for Bajra, sample households, 2012-13
Table 4.4.2 (c) The Marginal Value Product (MVP) and Marginal Factor Cost
(MFC) of Important inputs for Maize, sample households, 2012-13
Table 4.4.2 (d) The Marginal Value Product (MVP) and Marginal Factor Cost
(MFC) of Important inputs for Urd, sample households, 2012-13
Chapter–V
Table 5.1.1 (a) Reasons for attraction to paddy as revealed by farmers, sample
farms, 2012-13

Table 5.1.1 (b) Reasons for attraction to competing crop I (Bajra) as revealed
by farmers, sample farms, 2012-13
Table 5.1.1 (c) Reasons for attraction to competing crop II (Maize) as
revealed by farmers, sample farms, 2012-13
Table 5.1.1 (d) Reasons for attraction to competing crop III (Urd) as revealed
by farmers, sample farms, 2012-13
Table 5.1.2 (a) Main problems faced during production of paddy as revealed by
farmers, sample farms, 2012-13
Table 5.1.2 (b) Main problems faced during production of competing crop I
(Bajra) as revealed by farmers, sample farms, 2012-13
Table 5.1.2 (c) Main problems faced during production of competing crop II
(Maize) as revealed by farmers, sample farms, 2012-13
Table 5.1.2 (d) Main problems faced during production of competing crop III
(Urd) as revealed by farmers, sample farms, 2012-13
Table 5.1.3.1 (a) Problems of Diseases faced during basmati rice production as
revealed by farmers, sample farms, 2012-13
Table 5.1.3.1 (b) Problems of Insects/pests faced during basmati rice production as
revealed by farmers, sample farms,2012-13
Table 5.1.3.1 (c) Problems of weeds faced during basmati rice production as
revealed by farmers, sample farms, 2012-13
Table 5.1.3.2 (a) Problems of Diseases faced during maize production as revealed
by farmers, sample farms, 2012-13
Table 5.1.3.2 (b) Problems of Insects/pests faced during maize production as
revealed by farmers, sample farms, 2012-13
Table 5.1.3.2 (c) Problems of weeds faced during maize production as revealed by
farmers, sample farms, 2012-13
Table 5.1.3.3 (a) Problems of Diseases faced during bajra production as revealed by
farmers, sample farms, 2012-13
Table 5.1.3.3 (b) Problems of Insects/pests faced during bajra production as
revealed by farmers, sample farms, 2012-13

Table 5.1.3.3 (c) Problems of weeds faced during bajra production as revealed by
farmers, sample farms, 2012-13
Table 5.1.3.4 (a) Problems of Diseases faced during Urd production as revealed by
farmers, sample farms, 2012-13
Table 5.1.3.4 (b) Problems of Insects/pests faced during Urd production as revealed
by farmers, sample farms, 2012-13
Table 5.1.3.4 (c) Problems of weeds faced during Urd production as revealed by
farmers, sample farms, 2012-13
Table 5.1.4 (a) Problems of environment stress faced during production of
competing crop I (Bajra)as revealed by farmers, sample farms,
State, 2012-13
Table 5.1.4 (b) Problems of environment stress faced during production of
competing crop II( Maize) as revealed by farmers, sample farms,
State, 2012-13
Table 5.1.4 (c) Problems of environment stress faced during production of
competing crop III( Urd) as revealed by farmers, sample farms,
State, 2012-13
Table 5.2.1 (a) Problems regarding inputs faced during production of competing
crop I (Bajra) as revealed by farmers, sample farms, 2012-13
Table 5.2.1 (b) Problems regarding inputs faced during production of competing
crop II (Maize) as revealed by farmers, sample farms, 2012-13
Table 5.2.1 (c) Problems regarding inputs faced during production of competing
crop III (Urd) as revealed by farmers, sample farms, 2012-13
Table 5.2.2 (a) Problems faced during marketing of produce for competing crop I
(Bajra) as revealed by farmers, sample farms, 2012-13
Table 5.2.2 (b) Problems faced during marketing of produce for competing crop II
(Maize) as revealed by farmers, sample farms, 2012-13
Table 5.2.2 (c) Problems faced during marketing of produce for competing crop
III (Urd) as revealed by farmers, sample farms, 2012-13
Chapter–VI
Table 6.1 (a) Suggestions to increase yield of competing crop I (Bajra) as
revealed by farmers, sample farms, 2012-13
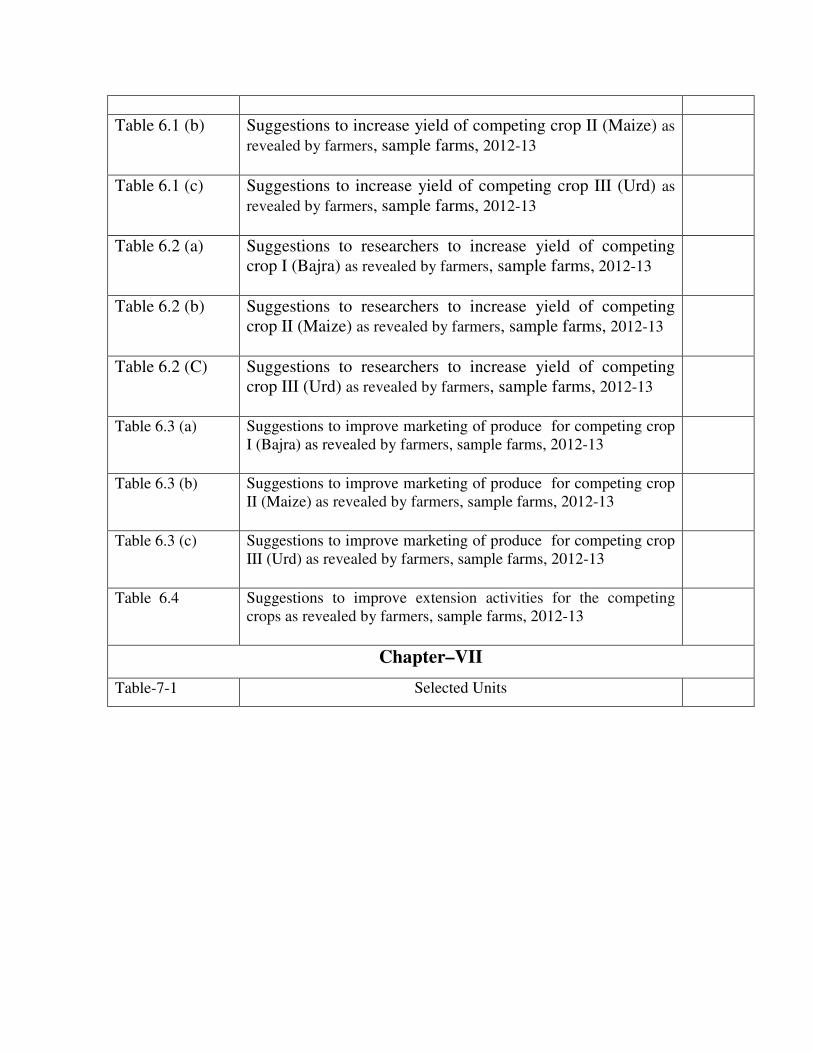
Table 6.1 (b) Suggestions to increase yield of competing crop II (Maize) as
revealed by farmers, sample farms, 2012-13
Table 6.1 (c) Suggestions to increase yield of competing crop III (Urd) as
revealed by farmers, sample farms, 2012-13
Table 6.2 (a) Suggestions to researchers to increase yield of competing
crop I (Bajra) as revealed by farmers, sample farms, 2012-13
Table 6.2 (b) Suggestions to researchers to increase yield of competing
crop II (Maize) as revealed by farmers, sample farms, 2012-13
Table 6.2 (C) Suggestions to researchers to increase yield of competing
crop III (Urd) as revealed by farmers, sample farms, 2012-13
Table 6.3 (a) Suggestions to improve marketing of produce for competing crop
I (Bajra) as revealed by farmers, sample farms, 2012-13
Table 6.3 (b) Suggestions to improve marketing of produce for competing crop
II (Maize) as revealed by farmers, sample farms, 2012-13
Table 6.3 (c) Suggestions to improve marketing of produce for competing crop
III (Urd) as revealed by farmers, sample farms, 2012-13
Table 6.4 Suggestions to improve extension activities for the competing
crops as revealed by farmers, sample farms, 2012-13
Chapter–VII
Table-7-1 Selected Units

CHAPTER-I
Introduction
Prior to introduction of Green Revolution, country was insufficient in food production to
provide adequate quantity of food grains to ever growing population of the country. Huge
quantity of foodgrains had been imported from foreign countries to meet the required
quantity of foodgrains of people of the country. After advent of Green Revolution in the
country, the production of rice and wheat has tremendously increased which was even
beyond the expectation. The production of food grains was only 50.82 million tones in
1950-51 which has gone-up to 244.49 million tones in 2010-11, thereby showing 381%
increase over the period. This increase in production of foodgrains was mostly attributed by
huge production of rice and wheat. The production of rice was 20.59 million tones in 1950-
51 which has gone up to 95.98 million tones in 2010-11, thereby showing 366% increase
over the period. The significant growth in production of wheat was also witnessed during
corresponding period. The production of wheat was only 6.46 million tones in 1950-51
which went up to 86.87 million tones in 2010-11, showing 1245% increase over the period.
Since 1970-71, the area under rice and wheat has been increasing at the cost of decrease of
area under coarse grains, pulses and oil seeds crops. The maximum change in cropping
pattern was witnessed in rice growing belts. The foodgrain crops structure has shifted in
favour of rice and wheat. Crop composition has also shifted towards rice and wheat.
The rice and wheat are still dominant crops across the country. The area under rice was
37.68 million hectares in 1969-70 which has increased to 44.02 million hectares in 2011-
12, thereby showing 16.80% increase over the period. The area under wheat was 16.63
million hectares in 1969-70 which has gone to 29.86 million hectares, showing 79.55%
increase over the period. On account of higher production, low risk, high margin of profit
etc, the farmers were inclined to shift the cropping pattern in favour of rice and wheat
crops. These two crops also require maximum water than its competing crops. The
maximum availability of ground and surface, sources of water are being utilized in the
fields of rice and wheat. Hence, water is not distributed equitably and it is not used

efficiently. The rains due to monsoon are not only inadequate but highly unequal in respect
of seasonal distribution.
In recent past decade, the yield of rice and wheat has been either decreasing or stagnant due
to adoption of mono-cropping sequence such as rice –wheat.
It is also noticed from records that net profit of both crops has been maintaining
diminishing trends. This was mostly observed in North-West Plains, comprising Punjab
Haryana and West U.P. These three states have been withdrawing maximum quantity of
ground water for irrigation of rice crop. This happens more at time of failure of monsoon.
To check the depletion of ground water table and maintain the fertility in soil, etc. in
Original Green Revolution States, Government of India has constituted a Committee of
Secretaries (COS) in 2013-14 to advice ways and means to divert the area of paddy to
alternative crops in Kharif season. The continuous cultivation of rice wheat cropping
system is cause of the stagnancy in rice yield, infestation of weeds, depletion of water
table, incidence of pests and diseases and deterioration of soil health in Original Green
Revolution states. Therefore, it calls for immediate diversification in crop rotation through
promotion of technical innovations in alternative crops. This would be helpful in improving
soil fertility, check the depletion of ground water and enhance the farms income. The Crop
Diversification Programme has also been introduced in Punjab, Haryana and West U.P. in
2013-14.
At least 5% area under paddy in identified blocks should be diverted towards alternative
crops during 2013-14. The total area under paddy was 1537.2 thousand hectares in QE
2011-12 in West U.P. of which 80 thousand hectares was targeted to divert towards
alternative crops during 2013-14. To fulfill this target, the farmers were advised to grow
the maize, bajra and urd etc in place of paddy. An amount of Rs. 500.00 crores was
remarked in this programme under RKVY funds for the year 2013-14.
Out of total funds being Rs. 500.00 crores of the programme, the share of Punjab was
maximum being 49.90% followed by 25.10% and 19.70% for West U.P. and Haryana
respectively. The allocation of funds was maximum being 50% for demonstration followed
by 23%, 15%, 2% and 10% for farm mechanization, site specific activities, contingency for

awareness, training and incentive for implementation of programme respectively for the
year 2013-14 in West U.P.
In order to proper grass-root-level execution of this programme, the national level, state
level and district level teams have been constituted to proper implementation and
monitoring of the programme.
In order to popularize this programme, assistance @ of Rs. 10,000 per ha. for maize, kharif
pulses and oilseeds has been allotted to farmers to devote more area under these crops. The
Crop Diversification Programme in western U.P. would be definitely fruitful in years to
come. This would also be beneficial in maintaining the ground water level in the districts of
West U.P. which has been used indiscriminately and uncontrolled by paddy growers.
Uttar Pradesh is largest state in India as far as population is concerned. Of the total
population of India, 16.49% population resides only in U.P. The geographical area of the
state was 240928 Sq Km. in 2001. The density of population was estimated at 828 per Sq.
Km against 382 Sq Km. of the country. The per capita availability of land was only 0.12
ha. in 2011. More than 70% population of the state is directly or indirectly dependent upon
agriculture and allied sectors. The net area sown was 16589 thousand ha. which was
68.63% of reporting area of the state during 2009-10. The cropping intensity was 153.35%
in corresponding period. The rice and wheat are the main crops across the state. Of GCA,
the area under wheat accounted for 38% followed by 22% of rice during 2009-10. It shows
that both crops accounted for 60% area of GCA of the State.
The area under rice and wheat has been continuously increasing from 1970-71 to 2010-11.
The increase in area of wheat in U.P. is also due to decrease in area of coarse cereals and
pulses while the cause of increase in area under rice is due to decrease in area of millet
crops and pulses. The expansion of irrigation net work coupled with high profitability, the
shift has gone in favour of rice and wheat. Out of 4 economic regions of the states, the
maximum shifting of area has witnessed in western region of U.P. Uttar Pradesh is one of
the vast states of the country and has different types of climate conditions, topography, soil
characteristic and ground water availability. On that ground, the state is divided into four
economic regions namely, western, central, eastern and Bundelkhand. Among these

regions, western region is economically and agriculturally well advanced and much
prosperous than other regions of the state. The introduction of Green Revolution was firstly
introduced in western region of the state because of much availability of irrigation sources.
The advent of Green Revaluation and expansion of irrigation network along with adoption
of good scientific techniques, the production of rice and wheat has touched at about
optimum level in the region.
The new strategy made a significant impact on cropping pattern in west U.P. The Green
Revolution has affected the attitudes and behaviors of farmers of west U.P. Assured
irrigation is the base of new strategy in agriculture. Hence, irrigation got high priority in
this region. Maximum investment was made in the installation of diesel and electric pump
sets in this region. The soil of the region is agriculturally rich and irrigation potential is
very high. Therefore, the farmers of this region have devoted maximum area under rice
than the maize, bajra and urd in kharif season. Paddy requires heavy rainfall and assured
availability of irrigation sources. The irrigation intensity is very high in this region as
compared to other regions of the state. The continuous cultivation of paddy has resulted
depletion of ground water and flood irrigation in paddy crop is also cause of expansion of
salinity soil. Apart from this, the yield of rice is either stagnant or moving in decreasing
trends. Therefore, the diversification of cropping pattern from paddy to coarse grain crops
is very much needed in the districts of western region of Uttar Pradesh.
Need of the Study
Paddy occupied 22% of GCA in 2009-10 in Uttar Pradesh which has increased by 32.23%
over the area in 1970-71. The state has contributed about 13% rice to total production of
rice of the country during the past years. Uttar Pradesh is still second most important state
of the country in the production of rice. Since, the advent of Green Revolution and
expansion of irrigation, the diversification in cropping pattern has taken place in favour of
rice. The high yield, maximum net profit and less risk in the cultivation of paddy have
motivated the farmers to devote more under paddy in the state. A number of schemes were
also introduced in the state to boost the production of rice in the state. The main aim of the
scheme was to increase production of rice through expansion of area under rice. Since

1970s the farmers have been changing the cropping pattern in favour of rice in Kharif
season. On account of this, cropping pattern was dominated by wheat, rice rotation. Both
crops require maximum water than its competing crops. Therefore, the underground water
table has been continuously going down particularly in rice growing belt of U.P.
The contribution of rice and wheat production in total pool of food grains in the country
was 56.35% in 1966-67 which has increased to 65.79%. At present the storage capacity of
FCI, CWC, SWC etc is not sufficient to store the bumper production of rice and wheat.
Due to lack of proper storage facilities, huge quantity of both commodities goes wastage in
each year. Since, the commencement of Green Revolution, the area under rice and wheat
has been continuously increasing across the country. The high productivity and profit of
both crops than its competing crops have compelled to the farmers to devote more area
under rice and wheat crops. The cropping pattern on farms has become unbalanced. The
area under coarse cereals, millets etc has been decreasing from year to year across the
country. The unbalanced adopting of cropping sequence, the incidence of pests and
diseases have become more common. The use of high dose of pesticides, fungicides,
fertilizers etc are producing high level pollution in water, soil and atmosphere. The water
table of ground water has been going down very fast in the rice growing north belt of the
country. Assured irrigation facilities are base of new strategy in agriculture. In the Five
Year Plans, irrigation got high priority to get success in increasing the production of rice
and wheat in the country.
Apart from this, water is being polluted due to heavy use of fertilizers and pesticides in
paddy crop. The soil health, soil texture etc are also much degraded because of mono
cropping system. The fertility of land has been degrading because of the neglect of pulses
and coarse grain crops in cropping pattern. These factors are disturbing natural soil
composition. The degrading of land, erosion in soil, decrease in water table etc are much
witnessed in the districts of western regions of the state. The farmers of the region are still
devoting maximum area under paddy in Kharif season. Paddy is water intensive crop,
hence, it is responsible for water-table depletion in tube-well irrigated areas. Due to
unregulated use of canal water in paddy crop, the water logging problem has emerged in
the districts of western U.P. The mono culture districts of paddy and wheat has resulted

into increasing the incidence of nutrient deficiency in the soil which could be posing major
threats to productivity. These were posing a serious cause of concern for agricultural
scientists and Government officials. There is a need to aware the farmers to diversify the
cropping pattern towards coarse grains and pulses.
In wake of this emerging scenario in country, the Union Government is advising to launch
a Crop Diversification Programme in Haryana, Punjab and western Uttar Pradesh for
sustainable agriculture with increased productivity and profitability. Hence, this study has
been under taken in western U.P. because it is most problematic region of the state
Objectives of the Study
The following objectives have been framed for the study.
a. To examine the production and procurement of paddy in U.P.
b. To workout the relative economics of paddy vis-à-vis competing/alternative crops.
c. To bring out the constraints in adoption of alternative crops.
d. To suggest policy measure to overcome in adoption of alternative crops to paddy in
Uttar Pradesh.
Coverage of Crops
The paddy is dominant crop of Kharif season in western of U.P. Maize, bajra and urd are
important competing crops to paddy in this region. Hence, these three crops namely bajra,
maize and urd have been selected for comparative analysis against paddy.
Data Collection
This study is based on primary and secondary data, therefore primary data were collected in
well designed schedules from selected sample farmers while secondary data were collected
from Directorate of Agriculture and Statistics, Krishi Bhawan, Lucknow and also from
other concerned Directorates of the State.

Selection of Units
Among the 23 districts of western region of U.P. 6 districts namely Buland Shahar,
Mainpuri, Aligarh, Mathura, Bareilly and Amroha were selected. The area of Maize was
found highest in Buland Shahar and Mainpuri districts in Western U.P. in 2013 while the
share of area under bajra was maximum in Aligarh and Mathura districts in corresponding
year. The share of area of urd was highest in Bareilly and Amroha districts during the same
year. Hence, Buland Shahar and Mainpuri were selected for maize crop. Aligarh and
Mathura were selected for bajra crop. Since share of area under urd was maximum in
Bareilly and Amroha districts, hence these were found appropriate for the selection of urd
crop. These crops were also alternative crops of paddy in Kharif season in the respective
districts of western U.P. From each selected district, one block was selected randomly.
From each block a cluster of 3 to 5 villages were randomly chosen. A sample of 35 farmers
were selected randomly from each selected cluster spreading over various farm size
categories i.e. small (less than two hectares), medium (2-10 hectares) and large (more than
10 hectares) based on the size of operational holding, making a total sample of 210 farmers,
with minimum 80 for each selected crop. Thus, 108 small, 90 medium and 12 large are the
sample farmers of the study.
The reference year of the study is 2012-13. The detail of selected units is illustrated in
Table-1-I
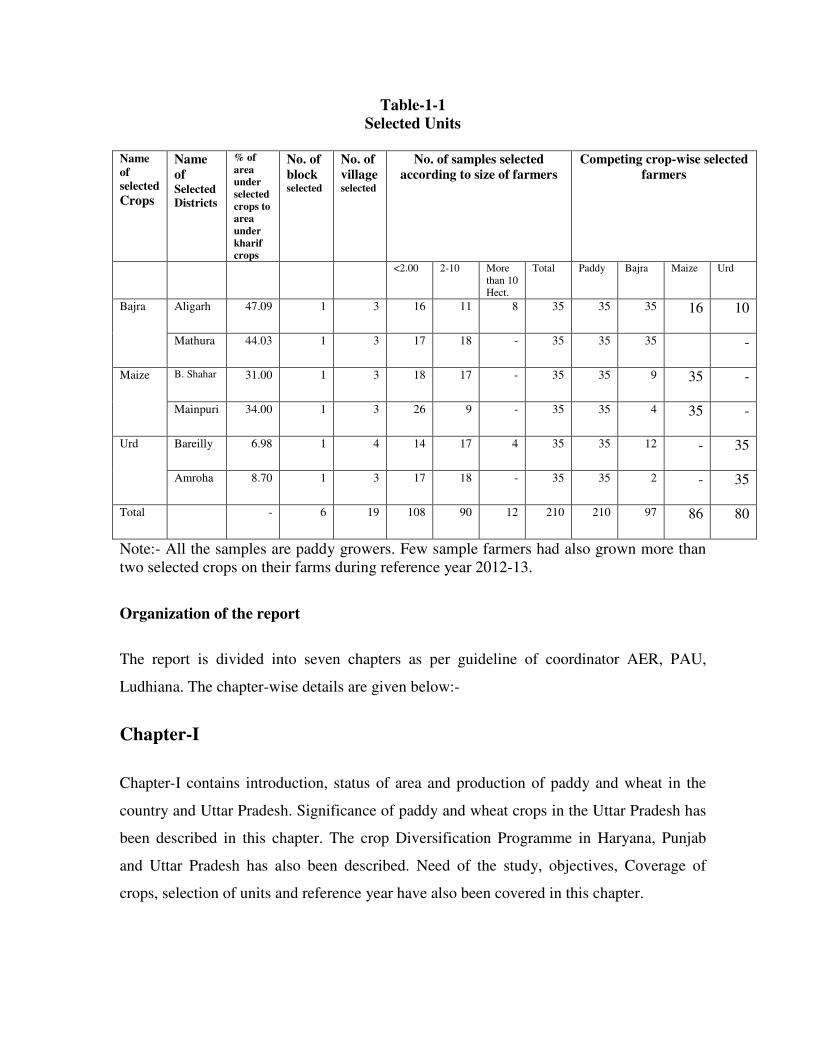
Table-1-1
Selected Units Name of selected Crops
Name
of Selected Districts
% of
area under
selected
crops to area
under
kharif crops
No. of
block selected
No. of
village selected
No. of samples selected
according to size of farmers
Competing crop-wise selected
farmers
<2.00 2-10 More
than 10
Hect.
Total Paddy Bajra Maize Urd
Aligarh 47.09 1 3 16 11 8 35 35 35 16 10 Bajra
Mathura 44.03 1 3 17 18 - 35 35 35 -
B. Shahar 31.00 1 3 18 17 - 35 35 9 35 - Maize
Mainpuri 34.00 1 3 26 9 - 35 35 4 35 -
Bareilly 6.98 1 4 14 17 4 35 35 12 - 35 Urd
Amroha 8.70 1 3 17 18 - 35 35 2 - 35
Total - 6 19 108 90 12 210 210 97 86 80
Note:- All the samples are paddy growers. Few sample farmers had also grown more than
two selected crops on their farms during reference year 2012-13.
Organization of the report
The report is divided into seven chapters as per guideline of coordinator AER, PAU,
Ludhiana. The chapter-wise details are given below:-
Chapter-I
Chapter-I contains introduction, status of area and production of paddy and wheat in the
country and Uttar Pradesh. Significance of paddy and wheat crops in the Uttar Pradesh has
been described in this chapter. The crop Diversification Programme in Haryana, Punjab
and Uttar Pradesh has also been described. Need of the study, objectives, Coverage of
crops, selection of units and reference year have also been covered in this chapter.
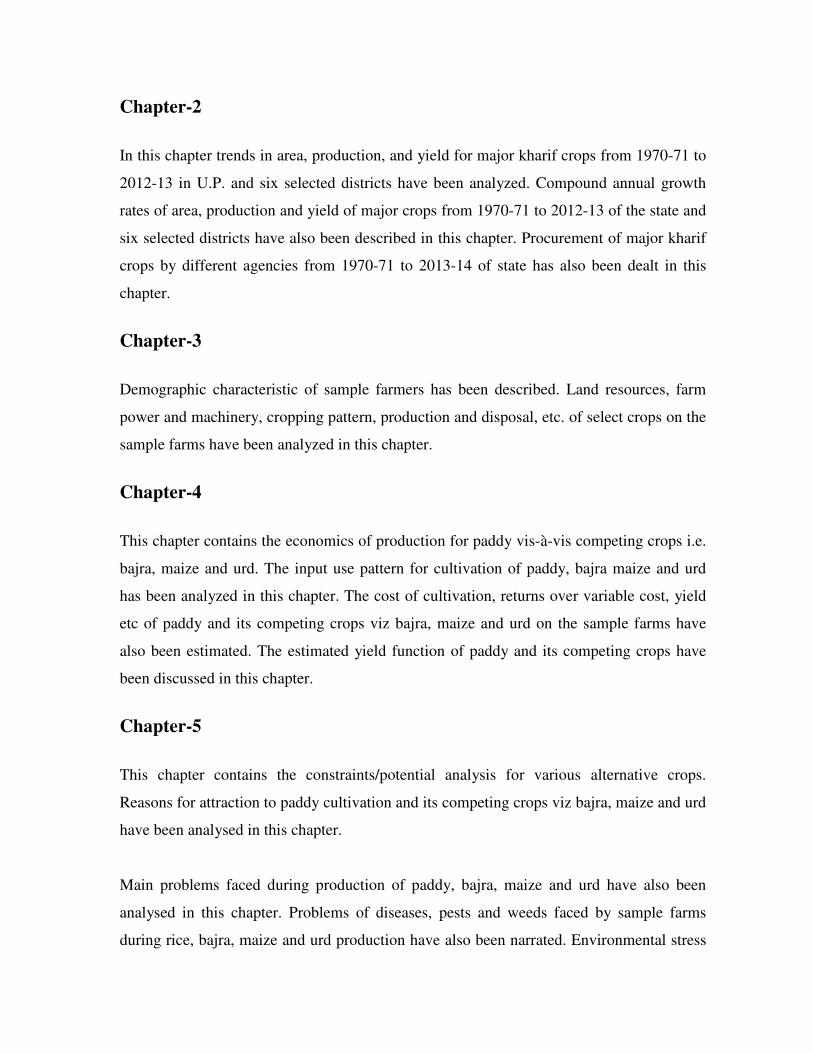
Chapter-2
In this chapter trends in area, production, and yield for major kharif crops from 1970-71 to
2012-13 in U.P. and six selected districts have been analyzed. Compound annual growth
rates of area, production and yield of major crops from 1970-71 to 2012-13 of the state and
six selected districts have also been described in this chapter. Procurement of major kharif
crops by different agencies from 1970-71 to 2013-14 of state has also been dealt in this
chapter.
Chapter-3
Demographic characteristic of sample farmers has been described. Land resources, farm
power and machinery, cropping pattern, production and disposal, etc. of select crops on the
sample farms have been analyzed in this chapter.
Chapter-4
This chapter contains the economics of production for paddy vis-à-vis competing crops i.e.
bajra, maize and urd. The input use pattern for cultivation of paddy, bajra maize and urd
has been analyzed in this chapter. The cost of cultivation, returns over variable cost, yield
etc of paddy and its competing crops viz bajra, maize and urd on the sample farms have
also been estimated. The estimated yield function of paddy and its competing crops have
been discussed in this chapter.
Chapter-5
This chapter contains the constraints/potential analysis for various alternative crops.
Reasons for attraction to paddy cultivation and its competing crops viz bajra, maize and urd
have been analysed in this chapter.
Main problems faced during production of paddy, bajra, maize and urd have also been
analysed in this chapter. Problems of diseases, pests and weeds faced by sample farms
during rice, bajra, maize and urd production have also been narrated. Environmental stress

presented problems during last production cycle of paddy, bajra, maize and urd have been
discussed.
Problems regarding inputs faced during production of competing crops viz bajra, maize and
urd have been analysed. Apart from this, problems faced during marketing of produce of
bajra, maize and urd have been reported in the chapter.
Chapter-6
This chapter contains the suggestions to increase the yield of competing crops i.e. bajra,
maize and urd. Suggestions to researchers and suggestions to improve marketing produce
for competing crops (bajra, maize and urd) have been discussed in this chapter.
Chapter-7
This chapter contains the summary, conclusion, findings and policy implication etc.
References

CHAPTER-2
Production status for major kharif crops in State and Six Selected Districts
The chapter deals with trends in area, production and yields of major kharif crops in six
selected districts and the state as a whole for the period (i) TE 1970-71 (ii) TE 1985-86
(iii)TE 2000-01 and (iv) TE 2012-13. The compound growth rates of area, production and
yield of major kharif crops of selected districts and state as a whole have also been
estimated in different periods in this chapter. Apart from these, the procurement of major
kharif crops by different agencies at different periods i.e. 1980-81, 1990-91, 2001-02 and
2010-11 has also been analysed in this chapter.
2.1.1 (a) Trends in area, production and yield for major kharif crops from 1970-71 to
2012-13 in Uttar Pradesh.
The trends in area, production and yield of major kharif crops in the state for different
periods are presented in Table 2.1.1(a) Table shows that area under paddy was 3059. 70
thousand hectares in TE in 1970-71 which has increased to 5797.30 thousand hectares in
TE 2012-13, showing 89.47% increase over the period. However the maximum increase in
area under paddy was found during TE 2000-01. The production of paddy has been
continuously increasing from TE 1970-71 to TE 2012-13 in U.P.
The production of paddy was 2362.32 thousand metric tones in TE 1970-71 which has
gone upto 13418.24 thousand metric tones in TE 2012-13 showing 468% increase over the
period. The yield of paddy was 7.67 qtls per ha. in TE 1970-71 which has increased to
23.12 qtls per ha. in TE 2012-13 thereby showing 201% increase over the period. It shows
that area, production and yield of paddy have positive rate of growth during the study
periods. The pace of growth in production of paddy was more than area and yield during
the study periods. The highest rate of growth in yield is recorded during TE 2012-13 in
U.P. Against this, the maximum rate of growth in area and production of paddy is

witnessed during TE 2000-01. It shows that area, production and yield of paddy have
significantly increased in TE 1985-86, TE 2000-01 and TE 2012-13 from the area,
production and yield in TE 1970-71. It reflects that the farmers of U.P. have been
increasing the area under paddy since the commencement of Green Revolution.
Table 2.1.1 (a)
Trends in Area, production and yield for major kharif crops, 1970-71 to 2012-13, in
U.P.
Note: TE indicates Triennium Ending Average
Area: 000’ ha., Production: 000’ metric tonnes and Yield: qtl/ha
Crops TE 1970-71 TE 1985-86 TE 2000-01 TE 2012-13
Area 3059.70 5209.01 5953.03 5797.30
Production 2362.32 6946.81 12092.29 13418.24 Paddy
Yield 7.67 12.33 20.30 23.12
Area 1454.78 1119.13 953.08 720.44
Production 1292.84 1393.13 1288.85 1191.40 Maize
Yield 8.84 12.49 13.61 16.55
Area 1064.90 950.06 852.94 907.93
Production 731.53 829.99 1140.65 1649.18 Bajra
Yield 6.85 6.48 13.36 18.18
Area 134.28 188.20 293.90 508.65
Production 51.96 47.18 107.95 340.11 Urd
Yield 3.91 1.49 3.66 6.69
Area 51.38 16.58 6.58 4.21
Production 35.08 2.37 0.89 0.92 Cotton
Yield 2.50 1 1.37 2.17
Area 1284.50 1533.25 1974.68 2166.322
Production 52600.30 72024.63 1126565.60 129089.30 Sugar cane
Yield 409.37 471.03 570.34 595.52
Area - 208.654 250.693 548.42
Production - 51.68 124.47 358.71 Pulses
Yield - 2.48 5.00 6.54
Area - 8308.814 8606.25 8175.40
Production - 9824.92 15143.20 16847.92
Total food
Grains
Yield - 11.82 17.59 20.60
Area - 242.71 250.70 446.38
Production - 125.00 124.48 176.81
Total
oilseed
Yield - 5.23 5.00 3.96

Table-2.1.1(a) reflects that area and production of maize have maintained the decreasing
trends during corresponding periods. The area under maize was 1454.78 thousand hectares
in TE 1970-71 which has decreased to 720.44 thousand hectares in TE 2012-13, thereby
showing 50.48% decrease over the period while the yield of maize has maintained the
increasing trends from TE 1970-71 to TE 2012-13. The trends of growth in area of maize
were negative during study periods. It shows that area under maize was shifting to another
kharif crops in U.P. despite its better yield per ha.
The area under bajra was 1064.90 thousand hectares in TE 1970-71 which has decreased to
907.93 thousand hectares in TE 2012-13, showing 14.74% decrease over the period.
However, there was a marginal fluctuation in area under bajra over a period of 42 years. It
is also observed from 2.1.1(a) that the production as well as yield of bajra have maintained
rising trends during the study periods. There was significant increase in yield of bajra
during the study periods of 42 years. The highest growth rate of yield is recorded during TE
2012-13.
Urd is most important kharif pulse in Uttar Pradesh. Table 2.1.1 (a) shows that area
production and yield of urd have also maintained increasing trends over a period of 42
years. The area under urd was 51.96 thousand hectares in TE 1970-71 which has gone up to
508.65 thousand hectares in TE 2012-13 showing 878.93% increase over the period, while
yield rate of urd varied from 1.49 qtls per ha in TE 1985-86 to 6.69 qtls per ha. in TE 2012-
13. It reflects from the table 2.1.1.(a) that the area, production and yield of urd have
positive rate of growth during the study periods. As far as other Kharif crops is concerned,
table-2.1.I(a) shows that area, production and yield of sugarcane and pulses have
significantly increased in U.P. in the study period. It may be concluded with this
impression that among Kharif crops of U.P. the maximum decline in area under maize was
witnessed during the study periods. The area, production and yield of most of other
important kharif crops of U.P. have maintained rising trends in U.P. during the study
periods.

2.1.1 (b) Trends in area, production and yield for major kharif crops from 1970-71 to
2012-13 in sample district-I (Aligarh)
The trends of area, production and yield of major kharif crops in TE 1970-71 TE 1985-86
TE 2000-01 and TE 2012-13 of Aligarh district have been worked out in Table 2.1.1 (b).
Aligarh district was selected for bajra crop for the purpose of the study.
Table 2.1.1 (b)
Trends in Area, production and yield for major kharif crops, 1970-71 to 2012-13,
Sample district I (Aligarh)
Note: TE indicates Triennium Ending Average
Area: 000’ ha., Production: 000’ metric tonnes and Yield: qtl /ha
Crops TE 1970-71 TE 1985-86 TE 2000-01 TE 2012-13
Area 22.12 14.855 29.58 73.68
Production 16.75 18.64 53.24 165.20 Paddy
Yield 7.49 12.59 18.00 22.31
Area 74.14 52.88 40.97 18.66
Production 79.40 62.12 70.53 41.05 Maize
Yield 10.66 10.05 17.31 22.29
Area 103.42 101.91 76.76 88.82
Production 85.84 108.55 118.63 190.32 Bajra
Yield 8.30 10.47 15.37 21.37
Area 0.56 1.25 0.47 0.72
Production 0.22 0.31 0.18 0.48 Urd
Yield 3.80 2.45 3.66 6.69
Area 11.60 6.810 1.86 0.86
Production 4.10 1.150 0.23 0.17 Cotton
Yield 1.50 1.71 1.29 1.94
Area 20.140 13.95 9.12 9.58
Production 627.17 627.46 544.73 579.36 Sugar cane
Yield 305.95 448.72 599.21 603.88
Area - 1.41 0.70 0.87
Production - 33.8 0.24 0.17 Pulses
Yield - 2.41 3.35 1.94
Area - 172.99 148.02 182.16
Production - 190.73 242.65 397.44
Total food
Grains
Yield - 10.97 16.25 21.72
Area - 0.55 0.05 0.17
Production - 0.12 0.01 0.09 Total oilseed
Yield - 2.45 2.45 3.58

It is noticed from Table 2.1.1 (b) that area under maize, bajra, sugarcane, pulses and
oilseeds has come down in TE 2012-13 from the area in TE 1970-71. There was a major
shift of area in favour of paddy crop in the district. Against this, the yield of mentioned
crops has increased during the corresponding periods. The area under paddy was 22.12
thousand hectares in TE 1970-71 which has gone upto 73.68 thousand hectares in TE 2012-
13, thereby showing 233% increase over the period while the area under maize and bajra
has declined by 74.83% and 14.12% in TE 2012-13 from the area of TE 1970-71
respectively. The area of urd, maize and bajra has been decreasing trends during study
periods. The yield of major kharif crops of the district has positive growth throughout
entire study periods. The area under maize, bajra, sugarcane, oilseeds and pulses has been
continuously shifting in favour of paddy crop during the study periods. On account of this,
the area under paddy of this district has increased to 33.73% and 233% in TE 2000-01 and
TE 2012-13 from the area in TE 1970-71 respectively.
2.1.1 (C)Trends in area, production and yield for major kharif crops from 1970-71 to
2012-13 in sample district II (Mathura).
The trends in area, production and yield for major kharif crops in TE 1970-71, TE 1985-86,
TE 2000-01 and TE 2012-13 of Mathura district are worked out in table 2.1.1(c ). Mathura
district was also selected for bajra crop because it was found competing crop to paddy crop.
The area of bajra was 58.40 thousand hectares in TE 1970-71 which has drastically
decreased to 41.08 thousand hectares, showing 29.66 decrease over the period. Table also
reveals that area under bajra was maximum during TE 1985-86 in this district. However the
yield was 6.10 qtls per ha in TE 1970-71 which has increased to 13.17 qtls per ha. in TE
2012-13, showing an increase of 115.9% over the period. The area of paddy was only 5.07
thousand hectares in TE 1970-71 which has gone up to 47.22 thousand hectares in TE
2012-13, showing 831% increase over the period. There was significant increase in area of
paddy in Mathura district. Except paddy crop, the area of other kharif crops of Mathura
district was decreasing from year to year. The maximum fall in area of maize, urd and
sugarcane is witnessed in Mathura district during the study periods. It shows that there was
much diversion of area in favour of paddy crop in this district. The area of competing crops
namely bajra, maize and urd to paddy crop was decreasing during the study periods.

Against this, yield of major kharif crops have shown rising trends through out the study
periods in this district.
Table 2.1.1 (C)
Trends in Area, production and yield for major kharif crops, 1970-71 to 2012-13,
Sample district II (Mathura)
Note: TE indicates Triennium Ending Average
Area: 000’ ha., Production: 000’ metric tonnes and Yield: qtl /ha
Crops TE 1970-71 TE 1985-86 TE 2000-01 TE 2012-13
Area 5.07 5.083 36.638 47.22
Production 3.83 6.069 74.303 108.52 Paddy
Yield 7.14 12.16 20.20 22.96
Area 9.48 3.610 0.612 0.158
Production 7.68 2.650 0.884 0.403 Maize
Yield 7.94 9.35 14.13 24.82
Area 58.40 63.20 51.20 41.08
Production 35.84 38.90 60.26 54.03 Bajra
Yield 6.10 6.17 11.52 13.17
Area 0.89 1.45 0.450 0.143
Production 0.33 0.35 0.168 0.096 Urd
Yield 3.79 2.45 3.66 6.69
Area 7.33 3.358 0.837 1.30
Production 2.76 0.309 0.089 0.31 Cotton
Yield 1.35 1.04 1.11 2.38
Area 18.06 13.343 10.831 3.405
Production 594.70 431.515 613.614 166.73 Sugar cane
Yield 327.01 334.13 566.40 479.11
Area - 1.58 0.521 0.158
Production - 368 187 0.103 Pulses
Yield - 2.43 3.51 6.53
Area - 75.837 89.72 88.68
Production - 48.834 136.24 163.11
Total food
Grains
Yield - 6.47 15.03 18.41
Area - 1.270 1.923 0.46
Production - 0.145 0.207 0.091 Total oilseed
Yield - 1.16 2.17 2.01

2.1.1(d) Trends in area, production and yield for major kharif crops from 1970-71 to
2012-13 in sample district III (Buland Shahar).
Buland Shahar district was selected for maize crop because it was competing crop to paddy
crop. The trends in area, production and yield for major kharif crops from 1970-71 to 2012-
13 are presented in table 2.1.1(d).
Table 2.1.1 (d)
Trends in Area, production and yield for major kharif crops, 1970-71 to 2012-13,
Sample district III (Buland Shahar)
Note: TE indicates Triennium Ending Average
Area: 000’ ha. Production: 000’ metric tonnes and Yield: qtl /ha
Crops TE 1970-71 TE 1985-86 TE 2000-01 TE 2012-13
Area 11.76 8.27 34.20 83.30
Production 9.64 7.88 73.99 198.89 Paddy
Yield 8.66 9.53 21.86 24.03
Area 103.55 126.23 83.19 48.20
Production 134.62 256.72 144.43 106.69 Maize
Yield 12.81 18.18 17.79 22.20
Area 38.99 26.05 8.99 11.19
Production 16.65 25.37 13.03 21.89 Bajra
Yield 4.28 9.68 14.55 19.61
Area 0.51 0.78 0.56 1.52
Production 0.19 0.21 0.21 1.02 Urd
Yield 3.80 2.81 3.66 6.69
Area 9.87 - 0.37 0.12
Production 2.99 - 0.063 0.024 Cotton
Yield 1.39 - 1.86 2.17
Area 46.32 51.93 44.05 53.76
Production 1087.31 2393.09 2250.57 3188.11 Sugar cane
Yield 370.51 462.67 579.68 592.83
Area - 0.958 1.05 2.06
Production - 0.244 0.385 1.26 Pulses
Yield - 2.56 3.86 6.11
Area - 165.08 127.84 144.43
Production - 291.93 232.12 328.53
Total food
Grains
Yield - 17.63 18.15 22.74
Area - 0.40 0.047 0.015
Production - 0.04 0.011 0.009 Total oilseed
Yield - 1.00 2.06 5.76

Table shows that there was a significant increase in area, production and yield of paddy in
this district during the period of 42 years. The area under paddy was 11.76 thousand
hectares in TE 1970-71 which has increased to 83.30 thousand hectares in TE 2012-13
showing 608% increase over the period. The yield per ha. was 8.66 qtls in TE 1970-71
which has maintained rising trends from year to year and reached upto 24.03 qtls per ha. in
TE 2012-13, showing 177.48% increase over the period of 42 years. Table 2.1.1 (d) shows
that the production of Buland Shahar was 9.64 thousand metric tones in TE 1970-71 which
has increased to 198.89 thousand metric tones in TE 2012-13, showing an increase of
1963% over the period. This shows that there was significant increase in area, production
and yield of paddy crop in Buland Shahar district during the study periods. Against this,
there was drastic fall in area of maize and bajra in the district during corresponding periods.
However, the progress of production and yields of both crops in the district was also not
satisfactory during the same periods.
The progress of remaining major kharif crops of the district was also not satisfactory during
the periods of 42 years. It reflects that area, production and yield of paddy crop in the
district have maintained steady growth from TE 1970-71 to TE 2012-13 on the cost of
other important kharif crops.
2.1.1 (e) Trends in area, production and yield for major kharif crops from 1970-71 to
2012-13 in sample district IV (Mainpuri).
Mainpuri district was also selected for maize crop because maize is competing crop to
paddy crop. The trends in area, production and yield for major kharif crops from TE 1970-
71 to 2012-13 of the district is worked out in Table-2.1.1 (e) Table 2.1.1 (e) shows that area
under paddy was 49.09 thousand hectares in TE 1970-71 which has increased by 28.08%,
28.87% and 18.15% in TE 1985-86, TE 2000-01 and TE 2012-13 respectively while the
production of paddy in the district has increased by 116.37%, 245.60% and 295.41%
during the corresponding periods. This shows that pace of growth in the production of
paddy in the district much faster than area under paddy during the study periods. This was
due to higher increase in productivity of paddy crop. The yield of paddy was only 7.88 qtls

per ha in TE 1970-71 which has gone upto 25.61 qtls in TE 2012-13 showing an increase
of 225% over the period.
Table 2.1.1 (e)
Trends in Area, production and yield for major kharif crops, 1970-71 to 2012-13,
Sample district IV (Mainpuri)
Note: TE indicates Triennium Ending Average
Area: 000’ ha., Production: 000’ metric tonnes and Yield: qtl /ha
As far as maize crop is concerned, Table 2.1.1(e) shows that area under maize was 51.94
thousand hectares in TE 1970-71 which was more than the area of paddy in the district
which went down to 39.23 thousand hectares in TE 2012-13 showing 24.47% decrease
Crops TE 1970-71 TE 1985-86 TE 2000-01 TE 2012-13
Area 49.09 62.87 63.26 58.00
Production 37.70 81.57 130.29 149.07 Paddy
Yield 7.88 12.93 20.59 25.61
Area 51.94 43.69 32.34 39.23
Production 62.18 60.93 57.37 97.30 Maize
Yield 12.01 13.50 17.65 24.59
Area 48.55 49.38 16.06 17.70
Production 33.88 44.0 23.22 38.07 Bajra
Yield 6.98 8.88 14.39 21.78
Area 0.40 1.25 0.23 0.29
Production 0.15 0.30 0.078 0.19 Urd
Yield 3.79 2.45 3.66 6.69
Area 0.025 0 0 0.000
Production 0.012 0 0 0.000 Cotton
Yield 1.42 0 0 0.000
Area 3.99 1.98 0.46 0.51
Production 178.91 74.14 25.77 24.06 Sugar cane
Yield 452.04 380.24 559.95 479.11
Area - 1.334 0.260 0.396
Production - 0.315 0.088 0.244 Pulses
Yield - 2.40 3.53 6.17
Area - 160.79 113.10 115.97
Production - 188.81 211.76 285.29
Total food
Grains Yield - 11.75 18.71 24.49
Area - 2.21 0.28 1.36
Production - 1.01 0.13 1.15 Total oilseed
Yield - 4.07 4.61 8.33

over the period. The production and yield of maize crop in the district have increased by
56.48% and 104.75% from TE 1970-71 to TE 2012.13 respectively. The area under bajra
was 48.55 thousand hectares in TE 1970-71 which has decreased by 63.54% in TE 2012-
13. Against this, the production and yield of bajra in this district have increased by 12.37%
and 222% in TE 2012-13 over the year TE 1970-71 respectively. There was also downfall
in the area of urd but production and yield of this crop have maintained rising trends during
the study periods. The area under sugarcane, pulses and oilseeds have maintained
decreasing trends through-out the study period of 42 years.
Above analysis reflects that the area of maize, bajra, urd, sugarcane, pulses and oilseeds
has maintained decreasing trends from one period to another period but it was just reverse
in case of paddy crop. On account of this, area of important kharif crops of this district has
been shifting to paddy crops since the period-I of the study. It is also interesting to note that
yield of almost all kharif crops in the district has been increasing since TE 1870-71 to TE
2012-13.
2.1.1(F) Trends in area, production and yield for major kharif crops from 1970-71 to
2012-13 in sample district-V (Bareilly)
Bareilly district is bowl of paddy. Paddy is dominant crop of kharif season of the district.
The agro-climatic condition of the district is very much suitable for paddy crop. Hence, the
farmers of the district devote very limited area of their land to urd crop. The urd is also
treated as alternative crop to paddy crop in the district. The trends in area, production and
yield for major kharif crops of the district from TE 1970-71 to 2012-13 are presented in
Table 4.1.1(f). The area under paddy was 101.02 thousand hectares in TE 1970-71 which
has increased by 58.80% in TE 2012-13. Against this, area under urd has increased by
777.98% in TE 2012-13 over the area of TE 1970-71. The area under maize and bajra has
decreased by 98.66% and 50.22% respectively in TE 2012-13 over the area of TE 1970-71.
It shows that the area of maize and bajra has been shifting in favour paddy crop during the
study periods. There was tremendous increase in the production of paddy in the district.
The production of paddy was 78.63 thousand metric tones in TE 1970-71 which has
increased by 186.52%, 364.57% and 330.38% in TE 1985-86 TE 2000-01 and TE 2012-13

respectively. The higher increase in the production of paddy in the district was due to its
better response of yield in respective years.
Table 2.1.1 (F)
Trends in Area, production and yield for major kharif crops, 1970-71 to 2012-13,
Sample district VI (Bareilly)
Note: TE indicates Triennium Ending Average, Area: 000’ ha. Production:
000’ metric tonnes and Yield: qtl /ha
It is also noticed from table 2.1.1(f) that production of bajra was more or less stagnant
throughout the study periods while the drastic decline in production of maize is witnessed
in TE 2000-01 and TE 2012-13. The production of urd was 0.41 thousand MT in TE 1970-
Crop TE 1970-71 TE 1985-86 TE 2000-01 TE 2012-13
Area 101.02 135.45 178.18 158.40
Production 78.63 225.29 365.29 338.41 Paddy
Yield 7.82 16.60 20.50 21.00
Area 17.16 9.25 0.40 0.24
Production 15.38 8.09 0.33 0.46 Maize
Yield 8.91 8.99 11.80 18.78
Area 15.45 14.16 8.91 7.69
Production 9.97 11.86 8.79 10.94 Bajra
Yield 6.45 8.44 10.14 14.22
Area 1.09 2.65 1.36 9.57
Production 0.41 0.50 0.47 7.19 Urd
Yield 3.79 1.89 3.95 9.57
Area 0.008 0.00 0.004 0.00
Production 0.002 0.00 0.001 0.00 Cotton
Yield 0.99 0.00 0.87 0.00
Area 39.11 29.31 66.33 84.67
Production 1622.89 1279.65 3786.65 5022.99 Sugar
cane Yield 414.04 444.64 571.40 560.61
Area - 2.70 1.37 9.57
Production - 0.50 0.47 7.19 Pulses
Yield - 1.88 3.94 6.96
Area - 177.41 190.59 176.00
Production - 246.17 375.88 357.00
Total food
Grains Yield - 13.86 19.72 20.22
Area - 14.78 1.97 4.30
Production - 12.12 0.51 1.12
Total
oilseed
Yield - 8.28 2.56 2.63
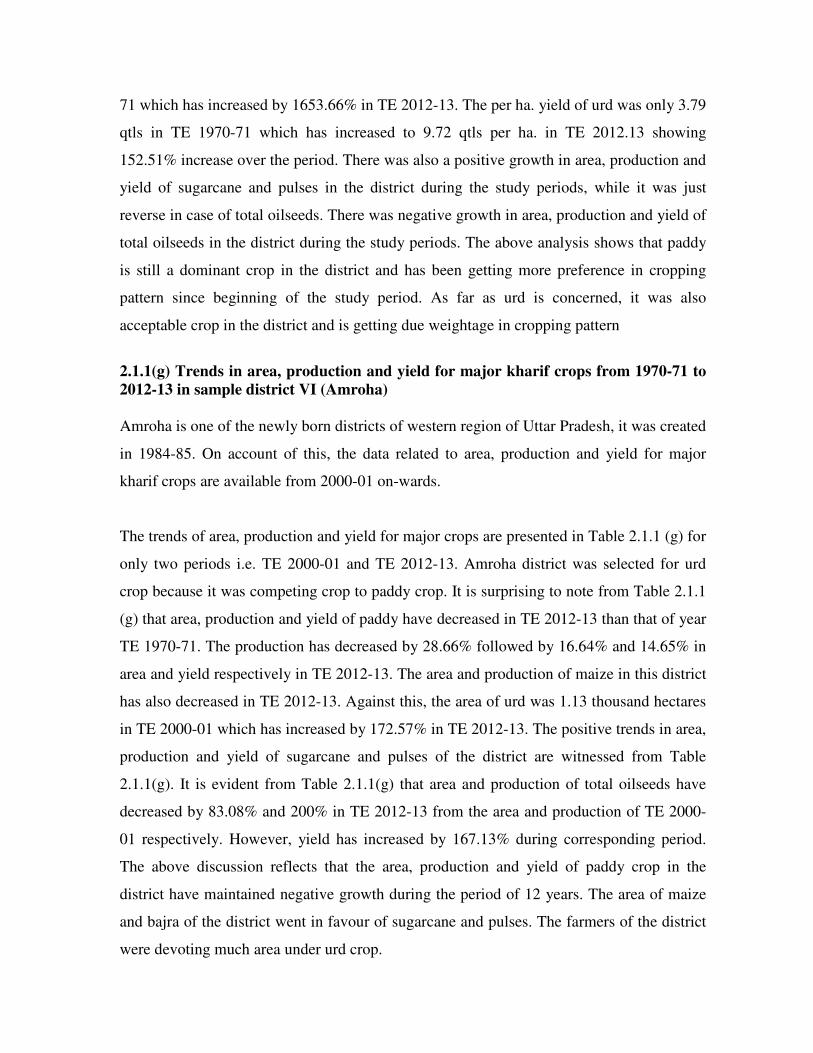
71 which has increased by 1653.66% in TE 2012-13. The per ha. yield of urd was only 3.79
qtls in TE 1970-71 which has increased to 9.72 qtls per ha. in TE 2012.13 showing
152.51% increase over the period. There was also a positive growth in area, production and
yield of sugarcane and pulses in the district during the study periods, while it was just
reverse in case of total oilseeds. There was negative growth in area, production and yield of
total oilseeds in the district during the study periods. The above analysis shows that paddy
is still a dominant crop in the district and has been getting more preference in cropping
pattern since beginning of the study period. As far as urd is concerned, it was also
acceptable crop in the district and is getting due weightage in cropping pattern
2.1.1(g) Trends in area, production and yield for major kharif crops from 1970-71 to
2012-13 in sample district VI (Amroha)
Amroha is one of the newly born districts of western region of Uttar Pradesh, it was created
in 1984-85. On account of this, the data related to area, production and yield for major
kharif crops are available from 2000-01 on-wards.
The trends of area, production and yield for major crops are presented in Table 2.1.1 (g) for
only two periods i.e. TE 2000-01 and TE 2012-13. Amroha district was selected for urd
crop because it was competing crop to paddy crop. It is surprising to note from Table 2.1.1
(g) that area, production and yield of paddy have decreased in TE 2012-13 than that of year
TE 1970-71. The production has decreased by 28.66% followed by 16.64% and 14.65% in
area and yield respectively in TE 2012-13. The area and production of maize in this district
has also decreased in TE 2012-13. Against this, the area of urd was 1.13 thousand hectares
in TE 2000-01 which has increased by 172.57% in TE 2012-13. The positive trends in area,
production and yield of sugarcane and pulses of the district are witnessed from Table
2.1.1(g). It is evident from Table 2.1.1(g) that area and production of total oilseeds have
decreased by 83.08% and 200% in TE 2012-13 from the area and production of TE 2000-
01 respectively. However, yield has increased by 167.13% during corresponding period.
The above discussion reflects that the area, production and yield of paddy crop in the
district have maintained negative growth during the period of 12 years. The area of maize
and bajra of the district went in favour of sugarcane and pulses. The farmers of the district
were devoting much area under urd crop.

Table 2.1.1 (g)
Trends in Area, production and yield for major kharif crops, 1970-71 to 2012-13,
Sample district- V (Amroha)
Crop TE 1970-71 TE 1985-86 TE 2000-01 TE 2012-13
Area N.A. N.A. 30.11 25.10
Production N.A. N.A. 67.94 48.47
Paddy
Yield N.A. N.A. 22.53 19.23
Area N.A. N.A. 5.63 2.07
Production N.A. N.A. 7.30 2.48
Maize
Yield N.A. N.A. 13.18 11.60
Area N.A. N.A. 6.63 3.58
Production N.A. N.A. 5.01 2.55
Bajra
Yield N.A. N.A. 7.53 7.25
Area N.A. N.A. 1.13 3.08
Production N.A. N.A. 0.71 2.63
Urd
Yield N.A. N.A. 5.86 8.59
Area N.A. N.A. 0.001 0.00
Production N.A. N.A. 0.033 0.00
Cotton
Yield N.A. N.A. 0.87 0.00
Area N.A. N.A. 72.14 76.38
Production N.A. N.A. 4286.02 4794.25
Sugarcane
Yield N.A. N.A. 591.17 627.28
Area N.A. N.A. 1.21 3.13
Production N.A. N.A. 0.73 2.65
Pulses
Yield N.A. N.A. 5.72 8.53
Area N.A. N.A. 43.66 33.8
Production N.A. N.A. 81.04 56.16
Total Food
Grains
Yield N.A. N.A. 18.55 16.55
Area N.A. N.A. 0.13 0.022
Production N.A. N.A. 0.003 0.009
Total oilseed
Yield N.A. N.A. 1.43 3.82
Note: TE indicates Triennium Ending Average, Area: 000’ ha. Production:
000’ metric tonnes and Yield: qtl /ha
2.1.2(a) Compound annual Growth Rates(CAGR) for major Kharif Crops 1970-71 to
2012-13 in Uttar Pradesh.
In order to analyse the CAGR for major Kharif crops in the state and six selected districts
of western region of Uttar Pradesh, data period has been divided into 4 periods i.e. period I
(1970-71 to 1984-85), period II (1985-86 to 1999-2000), period III (2000-01 to 2012-13
and period IV (1970-71 to 2012-13). The CAGR has been calculated separately for each
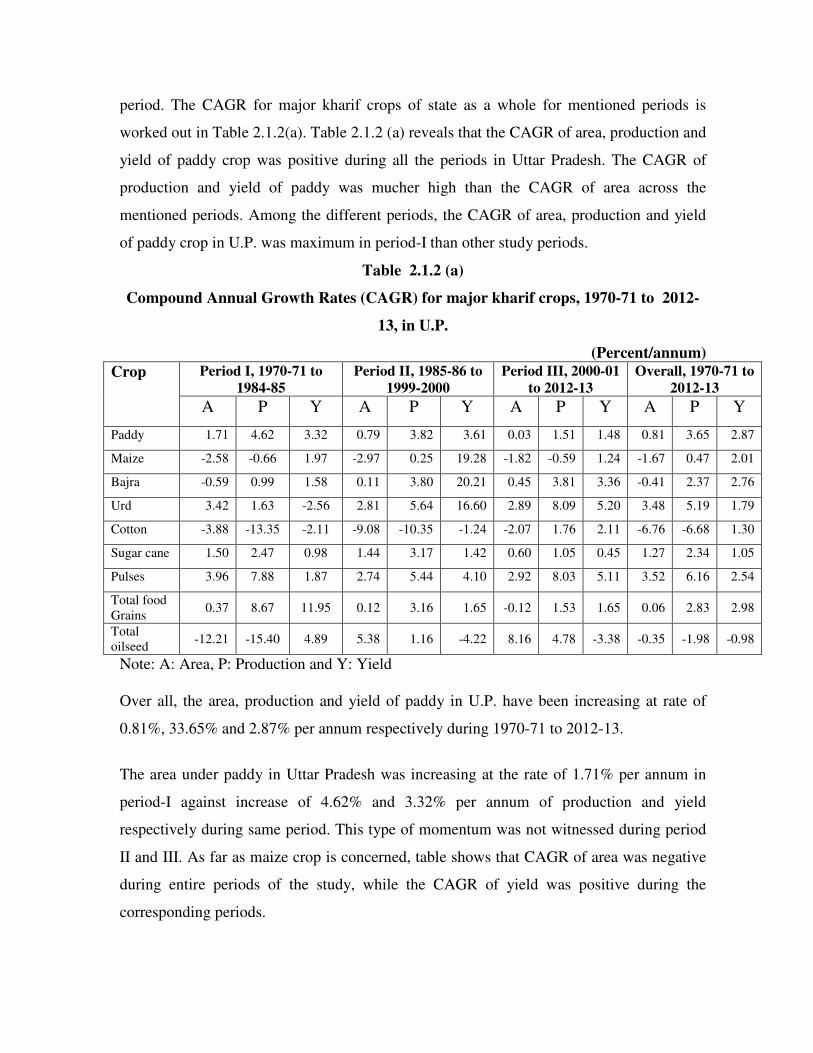
period. The CAGR for major kharif crops of state as a whole for mentioned periods is
worked out in Table 2.1.2(a). Table 2.1.2 (a) reveals that the CAGR of area, production and
yield of paddy crop was positive during all the periods in Uttar Pradesh. The CAGR of
production and yield of paddy was mucher high than the CAGR of area across the
mentioned periods. Among the different periods, the CAGR of area, production and yield
of paddy crop in U.P. was maximum in period-I than other study periods.
Table 2.1.2 (a)
Compound Annual Growth Rates (CAGR) for major kharif crops, 1970-71 to 2012-
13, in U.P.
(Percent/annum) Period I, 1970-71 to
1984-85
Period II, 1985-86 to
1999-2000
Period III, 2000-01
to 2012-13
Overall, 1970-71 to
2012-13 Crop
A P Y A P Y A P Y A P Y
Paddy 1.71 4.62 3.32 0.79 3.82 3.61 0.03 1.51 1.48 0.81 3.65 2.87
Maize -2.58 -0.66 1.97 -2.97 0.25 19.28 -1.82 -0.59 1.24 -1.67 0.47 2.01
Bajra -0.59 0.99 1.58 0.11 3.80 20.21 0.45 3.81 3.36 -0.41 2.37 2.76
Urd 3.42 1.63 -2.56 2.81 5.64 16.60 2.89 8.09 5.20 3.48 5.19 1.79
Cotton -3.88 -13.35 -2.11 -9.08 -10.35 -1.24 -2.07 1.76 2.11 -6.76 -6.68 1.30
Sugar cane 1.50 2.47 0.98 1.44 3.17 1.42 0.60 1.05 0.45 1.27 2.34 1.05
Pulses 3.96 7.88 1.87 2.74 5.44 4.10 2.92 8.03 5.11 3.52 6.16 2.54
Total food
Grains 0.37 8.67 11.95 0.12 3.16 1.65 -0.12 1.53 1.65 0.06 2.83 2.98
Total
oilseed -12.21 -15.40 4.89 5.38 1.16 -4.22 8.16 4.78 -3.38 -0.35 -1.98 -0.98
Note: A: Area, P: Production and Y: Yield
Over all, the area, production and yield of paddy in U.P. have been increasing at rate of
0.81%, 33.65% and 2.87% per annum respectively during 1970-71 to 2012-13.
The area under paddy in Uttar Pradesh was increasing at the rate of 1.71% per annum in
period-I against increase of 4.62% and 3.32% per annum of production and yield
respectively during same period. This type of momentum was not witnessed during period
II and III. As far as maize crop is concerned, table shows that CAGR of area was negative
during entire periods of the study, while the CAGR of yield was positive during the
corresponding periods.

The CAGR of production of maize in the state was also negative in the period Ist and III
rd.
It shows that the CAGR of area and production of maize in U.P. was mostly negative
during the entire periods of the study. The area under maize of U.P. was decreasing at the
rate of 2.58% per annum during period-I followed by 2.97% and 1.82% during period II
and III respectively while the yield of this crop was increasing at the rate of 1.97%, 19.28%
and 1.24% per annum during period I, II and III respectively. Over all period i.e. 1970-71
to 2012-13, growth rate of area of maize in U.P. was negative being 1.67%.
In case of bajra crop, CAGR of area, production and yield was positive during IInd
and IIIrd
periods of study. The period III i.e. 2000-01 to 2012-13 was found very favourable for
bajra crop because the CAGR was maximum being 0.45%, 3.81% and 3.36% of area,
production and yield respectively. The CAGR of area under bajra has registered negative
growth being -0.59% during period Ist.
It is also evident from table 2.1.2 (a) that area under bajra was decreasing at the rate of
0.59% per annum during period-I while it was increasing at the rate of 0.11% and 0.45%
per annum during period II and III respectively. However, the production and yield of bajra
in the state have maintained rising trends during, overall period i.e. 1970-71 to 2012-13, the
area under bajra in U.P. has been decreasing at the rate of 0.41% per annum.
The prospect of urd in Uttar Pradesh is quite satisfactory. The CAGR of area, production
and yield was quite significant across the different periods of the study. The CAGR of area,
production and yield of urd crop in U.P. was highest being 2.89%, 8.09% and 5.20%
respectively during period III.
It is also evident from Table 2.1.2(a) that area under urd in U.P. was increasing at the rate
of 3.42%, 2.81% and 2.89% during period I, II, and III respectively. The growth rate of
yield of this crop was negative during period I, but after that the growth rate of yield of this
crop was increasing at rate of 16.60% and 5.20% per annum during period II and III
respectively. On account of this, growth rate of production per annum of this crop was
higher than that of growth rate of area during period II and III. Over all period i.e. 1970-71
to 2012-13, the area, production and yield of urd have maintained the rising trends by
3.48%, 5.19% and 1.79% per annum respectively. The CAGR of area, production and yield
of sugarcane has registered significant increase in subsequent period.
The area under sugarcane was increasing at the rate of 1.50%, 1.44% and 0.60% per annum
during period I, II and III respectively, while the production of sugarcane was increasing
much faster than its area during corresponding periods.
The CAGR of area, production and yield of pulses in U.P. was positive during entire
periods of the study. The growth rate of area per annum was better during period I in
comparison to period II and III. While the growth rate of production per annum of pulses in
U.P. was more or less same during different periods of the study. The over all, growth rate
of area, production and yield of pulses in U.P. worked out to be 3.52%, 6.16% and 2.54%
per annum respectively.
It is also evident from Table 2.1.2 (a) that there was a marginal increase of area under food
grains in U.P. across the mentioned periods. The pace of growth in production of food
grains was faster than that of its area during different periods, over all, the area, production
and yield was increasing at the rate of 0.06%, 2.83% and 2.98% per annum respectively.
The position of oilseeds in Uttar Pradesh was very deplorable during all the periods. The
CAGR of area, production and yield of oilseeds in U.P. was worked out to be –0.35%,
-1.98% and -0.98% respectively during over all periods i.e. 1970-71 to 2012-13.
2.1.2 (b) Compound Annual Growth Rates (CAGR) for major kharif crops, 1970-71
to 2012-13 in sample district-I (Aligarh).
The CAGR of area, production and yield of major kharif crops of Aligarh district for
mentioned periods is worked out in Table 2.1.2 (b). The bajra was competing crop to paddy
crop of the district. Table reveals that the CAGR of area, production and yield of paddy
crop of the district was highest being 5.91%, 7.32% and 1.41% respectively during period
IInd
. The CAGR of area, production and yield of paddy crop was positive during the
different study periods. It is also evident from Table no. 2.1.2 (b) that the CAGR of area
under paddy was below from the CAGR of production during different periods. Table 2.1.2

(b) also shows that growth rate of production of paddy crop in the district was much better
than that of area during study periods.
The over all (1970-71 to 2012-13) the growth rate of area under paddy in the district was
4.11% per annum against 6.60% and 2.40% per annum growth rate of production and yield
respectively.
Table-2.1.2 (b)
Compound Annual Growth Rates (CAGR) for major kharif crops,
1970-71 to 2012-13, Sample district I (Aligarh)
(Percent/annum)
Period I, 1970-71 to
1984-85
Period II, 1985-86
to 1999-2000
Period III, 2000-
01 to 2012-13
Overall, 1970-71 to
2012-13 Crop
A P Y A P Y A P Y A P Y
Paddy 1.25 2.52 0.57 5.91 7.32 1.41 5.79 6.11 0.32 4.11 6.60 2.40
Maize -5.25 -6.55 -1.30 -2.71 1.26 5.29 -3.89 -1.78 2.11 -3.04 -0.01 3.08
Bajra 0.76 1.97 1.21 -0.35 2.99 3.34 3.32 6.15 2.83 -1.72 0.72 2.44
Urd 6.77 3.97 -2.71 -3.46 1.10 4.56 0.07 3.23 3.66 -1.21 0.71 1.91
Cotton -3.64 -12.11 2.55 -8.98 -11.45 -0.55 -2.90 -12.70 1.64 -7.14 -6.33 1.88
Sugar cane -0.71 1.98 2.69 -3.17 -0.68 2.49 -7.12 -1.00 -0.13 -1.70 -0.31 1.65
Pulses -8.65 -7.42 2.04 -1.01 2.60 3.63 0.98 4.34 3.36 -1.30 0.93 2.27
Total food
Grains -34.23 9.14 10.03 -0.50 2.85 3.35 1.40 2.96 1.56 -2.26 2.98 3.20
Total
oilseed -2.37 -9.75 -10.95 -18.84 -10.23 8.61 9.62 11.20 1.26 -9.11 -9.21 -0.43
Note: A: Area, P: Production and Y: Yield
The CAGR of area, production and yield of bajra crop in the district was maximum being
3.32%, 6.15% and 2.83% respectively during period-III. The CAGR of area of bajra has
registered negative growth during period II i.e. 1985-86 to 1999-2000. Except this, the
CAGR of area of bajra has registered positive growth in other two study periods. Table also
reveals that the CAGR of area, production and yield of paddy crop in the district was much
better than its competing bajra crop during the study periods. The growth rate of area under
paddy was increasing at the rate of 1.25% per annum during period-I followed by 5.91%

and 5.79% per annum during period II and III respectively. It shows that growth rate of
area under paddy per annum was much faster than its competing bajra crop.
The position of maize in the district was not satisfactory during study periods. The CAGR
of area under maize crop has registered negative growth during all the study periods. The
CAGR of area, production and yield of maize crop in the district was negative being -
5.25%, -6.55% and -1.30% respectively during period-I. Except this period, the CAGR of
production and yield has registered positive trends during IInd
and IIIrd
periods. The area
under maize has declined at the rate of -3.04% per annum during over all period (1970-71
to 2012-13) while yield of this crop has increased by 3.08% per annum during the
corresponding period. The CAGR of area under sugarcane was negative in different study
periods, while the production and yield of sugarcane had positive trends in different study
periods. It is also evident from table that there was negative growth per annum of area
under pulses, total foodgrains and oilseeds in the districts during over all period i.e. from
1970-71 to 2012-13. It may be concluded with this impression that CAGR of area,
production and yield of paddy crop in the district was positive and significant during
mentioned periods against its competing crop. It reflects that the farmers of the district had
been giving much weightage to paddy in the cropping pattern than other kharif crops.
2.1.2 (C ) Compound Annual Growth Rates (CAGR) for major kharif crops 1970-71
to 2012-13 in sample district II (Mathura)
The CAGR of area, production and yield of major kharif crops of Mathura district for
different periods is shown in Table 2.1.2 ©. The bajra was competing crop to paddy crop of
this district in the reference year. Table 2.1.2 © reveals that CAGR of area, production and
yield of paddy crop of Mathura district was much better than other kharif crops during
entire study periods. The CAGR of area, production and yield of paddy crop was highest
being 16.20%, 19.52%, 3.32% respectively during period II. The growth rate of area,
production and yield of paddy crop of this district had maintained positive trends from
1970-71 to 2012-13. However, the pace of CAGR of area, production and yield of paddy
crop of the district was much below during period III than that of period II. Table 2.1.2 (c )
also reveals that growth rate of area under paddy was much faster being 16.20% per annum
during period II against 2.68% and 0.86% per annum during period III and I respectively.

While the area under bajra was decreasing at the rate of 1.17% and 0.24% per annum
during period III and II respectively. The over all production of paddy was increasing at the
rate of 10.60 per annum against 7.90% per annum growth of its area.
Table 2.1.2 (c)
Compound Annual Growth Rates (CAGR) for major kharif crops, 1970-71 to 2012-
13, Sample district II (Mathura)
(Percent/annum)
Note: A: Area, P: Production and Y: Yield
It is evident from Table 2.1.2 (C) that the CAGR of area under bajra crop was negative
being -0.24% and -1.17% during period II and III respectively. In stead of this, CAGR of
production and yield of this crop was positive during corresponding periods. It is also
evident from table that area under maize had registered negative growth in every study
period. The CAGR of production of maize had also registered negative trends in almost all
the study periods. The CAGR of production and yield of urd crop was positive being
6.50%, 3.56% respectively during period-I but after that CAGR of area and production of
urd crop of the district had registered negative trends during period II and III.
It is also evident from Table 2.1.2 © that CAGR of area under sugarcane was negative
being -0.26%, -0.52% and -4.75% during period I, II and III respectively. There was much
down fall in the area of sugarcane of Mathura district in different study periods. The over
all performance of area, production and yield of total foodgrains in the district was
Period I, 1970-71 to 1984-85
Period II, 1985-86 to 1999-2000
Period III, 2000-01 to 2012-13
Overall, 1970-71 to 2012-13
Crop
A P Y A P Y A P Y A P Y
Paddy 0.86 2.09 1.66 16.20 19.52 3.32 2.68 3.52 0.84 7.90 10.60 2.79
Maize -12.34 -13.97 -1.63 -17.68 -10.84 4.54 -12.12 -9.78 2.33 -10.92 -5.59 5.25
Bajra 0.58 1.07 0.48 -0.24 5.39 5.62 -1.17 0.25 1.42 -1.55 1.63 3.18
Urd 6.50 3.56 -2.71 -6.13 -1.55 4.56 -7.87 -4.17 3.66 -4.77 -2.91 1.91
Cotton -5.54 -17.81 -1.27 -9.64 -9.25 2.14 0.24 -5.32 3.66 -4.75 -3.16 2.77
Sugar
cane -0.26 -2.34 -2.08 -0.52 2.51 3.03 -4.75 -4.85 -10.22 -4.20 -3.20 1.76

satisfactory. The area of pulses and oilseeds of the district was decreasing at rate of -6.45%
and -4.04% per annum respectively during over all period (1970-71 to 2012-13).
The above analysis reflects that paddy is still dominant crop in the district and has
maintained increasing trends during the study periods. The most of area under maize and
sugarcane of the district has gone in favour of paddy crop during the mentioned periods.
2.1.2 (d) Compound Annual Growth Rates (CAGR) for major Kharif crops, 1970-71
to 2012-13 in sample district-III (Buland Shahar)
The maize is main crop of kharif season of Buland Shahar district. It is also competing crop
to paddy crop. The CAGR of area, production and yield of major kharif crops of the district
is worked out in Table 2.1.2 (d) for mentioned periods. It is evident from table that CAGR
of area, production and yield of paddy crop of the district was negative being -10.26%, -
10.48% and -0.28% respectively during periods-I, while these were positive during period
II and III.
However, the period II and III were encouraging for the production and yield of paddy in
the district. The maximum CAGR of area, production and yield of paddy crop in the district
is witnessed during period II. The over all growth of area, production and yield of paddy
was positive in the district. The area, production and yield of paddy in the district have
increased at the rate of 4.05%, 6.91% and 2.83% per annum respectively during overall
period i.e. 1970-71 to 2012-13. The CAGR of area of maize was negative being -0.13%, -
3.00% and -4.00% during period I, II and III respectively. It was declining from one period
to other period. Against this, CAGR of production and yield of this crop was mostly found
positive during the corresponding periods. The overall period from (1970-71 to 2012-13)
the CAGR of area under maize was negative being 2.27% while it was positive in case of
yield. More or less same trends of area, production and yield of bajra crop were also
noticed from Table 2.1.2 (d). It reflects that the area under maize and bajra of the district
has registered a declining trends from period to period. The period II (1985-86 to 1999-
2000) was not favourable for almost all Kharif crops except paddy in the district. The
CAGR of area and production of maize, bajra and urd was negative during period II. It is
interesting to note that CAGR of yield of all major kharif crops of the district has

maintained rising trends across the selected periods. The above discussion reflects that
there is no alternative kharif crop to paddy crop in this district. Since period II to period IV
the CAGR of area, production and yield of paddy crop in the district has maintained
positive trends.
Table-2.1.2 (d)
Compound Annual Growth Rates (CAGR) for major kharif crops,
1970-71 to 2012-13, Sample district I (Buland Shahar)
(Percent/annum)
Period I, 1970-71 to 1984-85
Period II, 1985-86 to 1999-2000
Period III, 2000-01 to
2012-13
Overall, 1970-71 to 2012-13
Crop
A P Y A P Y A P Y A P Y
Paddy -10.26 -10.48 -0.28 8.49 14.84 6.36 7 8 0.83 4.05 6.91 2.83
Maize -0.13 2.50 2.63 -3.00 -2.57 1.28 -4 -3 1.34 -2.27 -0.60 1.70
Bajra -3.08 1.32 3.84 -5.14 -2.77 2.38 2 5 3.20 -3.90 0.04 3.86
Urd 5.11 5.20 0.13 -4.52 -0.56 3.94 4 10 5.20 1.74 2.92 1.19
Cotton -9.71 -21.27 -0.56 -11.46 -10.75 2.55 -8 -7 1.08 -10.28 -9.48 2.37
Sugar cane 2.02 3.95 1.93 -0.83 0.87 1.70 1 1 0.02 -0.07 1.05 1.12
Pulses -4.89 -5.19 -0.31 -1.17 2.91 4.08 -6 -5 1.00 1.14 2.62 1.48
Total food
Grains 3.18 25.28 18.35 -2.03 -0.61 1.43 2 3 1.32 -0.68 3.72 2.83
Total
oilseed 17.99 -0.97 -15.74 -17.69 -7.24 10.48 5 8 3.45 -13.08 -12.61 1.33
Note: A: Area, P: Production and Y: Yield
As a whole (from 1970-71 to 2012-13) the area under food grains, oilseeds and sugarcane
in the district has maintained negative growth being -0.68%, -13.08% and -0.07% per
annum respectively.
2.1.2 (e) Compound Annual Growth Rates (CAGR) for major Kharif crops, 1970-71
to 2012-13 in sample district-IV (Mainpuri)
Mainpuri district is famous for the production of coarse grain crops. Even then, the farmers
of the district are still devoting the maximum under paddy crop during kharif season. The
CAGR of area, production and yield of major kharif crops for four mentioned periods is
worked out in Table 2.1.2 (e). Table reveals that CAGR of area, production and yield of

paddy crop was positive being 3.01%, 4.87% and 1.64% respectively during period I which
were more or less similar during period II. The growth of area under paddy was 3.01 per
annum during period I which has decreased during period II and III. It is also evident from
table that growth of production of paddy was higher than its area. As a whole (1970-71 to
2012-13), the CAGR of area, production and yield of paddy was positive. The growth rate
of area, production and yield of paddy in the district was 1.00%, 3.78% and 3.02% per
annum respectively during over all period i.e. 1970-71 to 2012-13. Against this, growth
rates of area under maize has registered a negative trends during period I and II. It is also
evident from this table that growth of production and yield was also negative during
period-I. The period III was quite encouraging for maize crop in the district because CAGR
of area, production and yield has registered positive trends. However, the CAGR of area,
production and yield of the maize crop for over all period i.e. (from 1970-71 to 2012-13)
was estimated at -1.00%, 1.79% and 2.96% respectively.
Table-2.1.2 (e)
Compound Annual Growth Rates (CAGR) for major kharif crops,
1970-71 to 2012-13, Sample district I (Mainpuri)
(Percent/annum)
Period I, 1970-71 to
1984-85
Period II, 1985-86 to
1999-2000
Period III, 2000-
01 to 2012-13
Overall, 1970-71 to
2012-13 Crop
A P Y A P Y A P Y A P Y
Paddy 3.01 4.87 1.64 0.59 3.86 3.27 -0.61 2 2.78 1 3.78 3.02
Maize -2.14 -3.59 -1.45 -2.52 0.60 3.22 12.52 15 2.71 -1 1.79 2.96
Bajra 0.20 0.36 0.16 -7.38 -3.32 4.05 1.89 6 4.59 -4 -1.10 2.80
Urd 6.35 3.56 -2.71 -13.18 -8.60 4.57 5.58 11 5.20 -5 -3.08 1.85
Cotton -8.68 -19.19 0.66 -52.48 -45.88 -31.01 0.00 0 0.00 -27 -2.64 -16.09
Sugar
cane -3.58 -4.51 -0.92 -11.14 -5.03 6.11 0.74 -1 -1.25 -6 -4.80 1.10
Pulses -1.64 7.87 4.94 -12.83 -8.63 4.21 7.61 12 4.45 -7 -3.90 2.61
Total food
Grains 0.16 7.95 10.24 -2.18 1.83 4.02 0.29 3 2.80 -1 2.79 3.67
Total
oilseed 7.61 0.41 -5.21 -12.64 -6.02 6.61 20.78 26 5.00 -5 -4.80 0.78
Note: A: Area, P: Production and Y: Yield

Table 2.1.2 (e) also reveals that CAGR of area and production of bajra crop in the district
was negative during period II. Except this period, CAGR of area, production and yield of
this crop has registered positive growth during period I and II. As a whole, it was negative.
The growth of yield of bajra in the district was better than the growth of area and
production. As far as Urd crop is concerned, Table 2.1.2(e) shows that CAGR of area and
production of urd was negative during period-II while in other study periods, there was a
positive growth. The position of sugarcane was not satisfactory in the district during
selected periods. There was much downfall in area and production of sugarcane in the
district during period I and II. The CAGR of area and production of pulses in the district
was negative being -12.83% and -58.63% respectively during period-II. The area under
pulses, foodgrains and oilseeds was decreasing at rate of -7.00%, -1.00% and -5.00% per
annum respectively during over all period i.e. (1970-71 to 2012-13).
The period II was not found suitable for major kharif crops in the district except paddy
crop. It may be concluded with this result that the growth in area, production and yield of
paddy in the district has maintained rising trends during all the study periods. There was no
substitute of paddy crop in the district. It is still a dominant crop during kharif season.
2.1.2 (F) Compound Annual Growth Rates (CAGR) for major Kharif crops, 1970-71
to 2012-13 in sample district-V (Bareilly)
Paddy and sugarcane are principal crops of kharif season of the district. Since, it belongs to
Tarai region of Uttar Pradesh, so the paddy and sugarcane are very suitable crops for the
district. Urd is also grown in up lands of the district. It is also treated as competing crop to
paddy in the district. The CAGR of area, production and yield for major kharif crops of the
district are presented in table 2.1.2 (f). It is evident from Table 2.1.2 (f) that the CAGR of
area, production and yield of paddy crop in the district was positive during period-I and II.
However, the growth of area under paddy was negative during period III. The growth of
production and yield of paddy was positive during same period. The maximum growth in
area, production and yield is witnessed during period II. The period III was not suitable for
this crop. The over all period (1970-71 to 2012-13) CAGR of area, production and yield of
paddy was worked out to be 0.79%, 3.00% and 1.85% respectively.
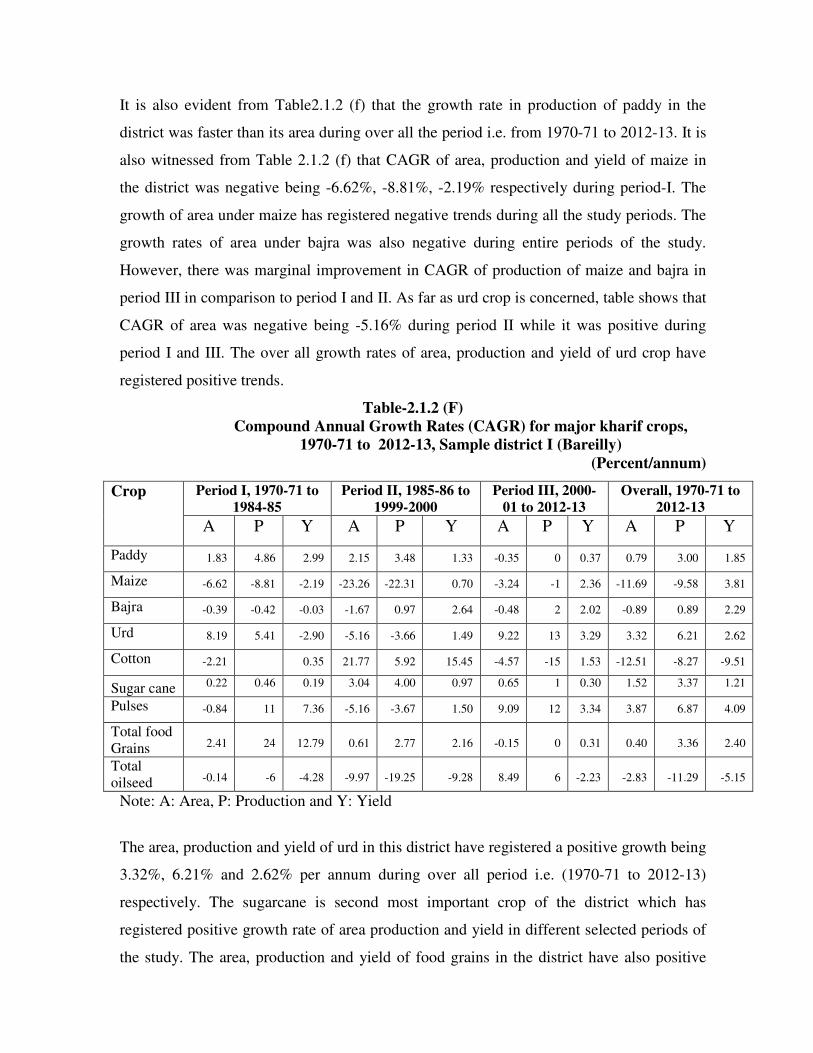
It is also evident from Table2.1.2 (f) that the growth rate in production of paddy in the
district was faster than its area during over all the period i.e. from 1970-71 to 2012-13. It is
also witnessed from Table 2.1.2 (f) that CAGR of area, production and yield of maize in
the district was negative being -6.62%, -8.81%, -2.19% respectively during period-I. The
growth of area under maize has registered negative trends during all the study periods. The
growth rates of area under bajra was also negative during entire periods of the study.
However, there was marginal improvement in CAGR of production of maize and bajra in
period III in comparison to period I and II. As far as urd crop is concerned, table shows that
CAGR of area was negative being -5.16% during period II while it was positive during
period I and III. The over all growth rates of area, production and yield of urd crop have
registered positive trends.
Table-2.1.2 (F)
Compound Annual Growth Rates (CAGR) for major kharif crops,
1970-71 to 2012-13, Sample district I (Bareilly)
(Percent/annum)
Period I, 1970-71 to 1984-85
Period II, 1985-86 to 1999-2000
Period III, 2000-01 to 2012-13
Overall, 1970-71 to 2012-13
Crop
A P Y A P Y A P Y A P Y
Paddy 1.83 4.86 2.99 2.15 3.48 1.33 -0.35 0 0.37 0.79 3.00 1.85
Maize -6.62 -8.81 -2.19 -23.26 -22.31 0.70 -3.24 -1 2.36 -11.69 -9.58 3.81
Bajra -0.39 -0.42 -0.03 -1.67 0.97 2.64 -0.48 2 2.02 -0.89 0.89 2.29
Urd 8.19 5.41 -2.90 -5.16 -3.66 1.49 9.22 13 3.29 3.32 6.21 2.62
Cotton -2.21 0.35 21.77 5.92 15.45 -4.57 -15 1.53 -12.51 -8.27 -9.51
Sugar cane 0.22 0.46 0.19 3.04 4.00 0.97 0.65 1 0.30 1.52 3.37 1.21
Pulses -0.84 11 7.36 -5.16 -3.67 1.50 9.09 12 3.34 3.87 6.87 4.09
Total food
Grains 2.41 24 12.79 0.61 2.77 2.16 -0.15 0 0.31 0.40 3.36 2.40
Total
oilseed -0.14 -6 -4.28 -9.97 -19.25 -9.28 8.49 6 -2.23 -2.83 -11.29 -5.15
Note: A: Area, P: Production and Y: Yield
The area, production and yield of urd in this district have registered a positive growth being
3.32%, 6.21% and 2.62% per annum during over all period i.e. (1970-71 to 2012-13)
respectively. The sugarcane is second most important crop of the district which has
registered positive growth rate of area production and yield in different selected periods of
the study. The area, production and yield of food grains in the district have also positive
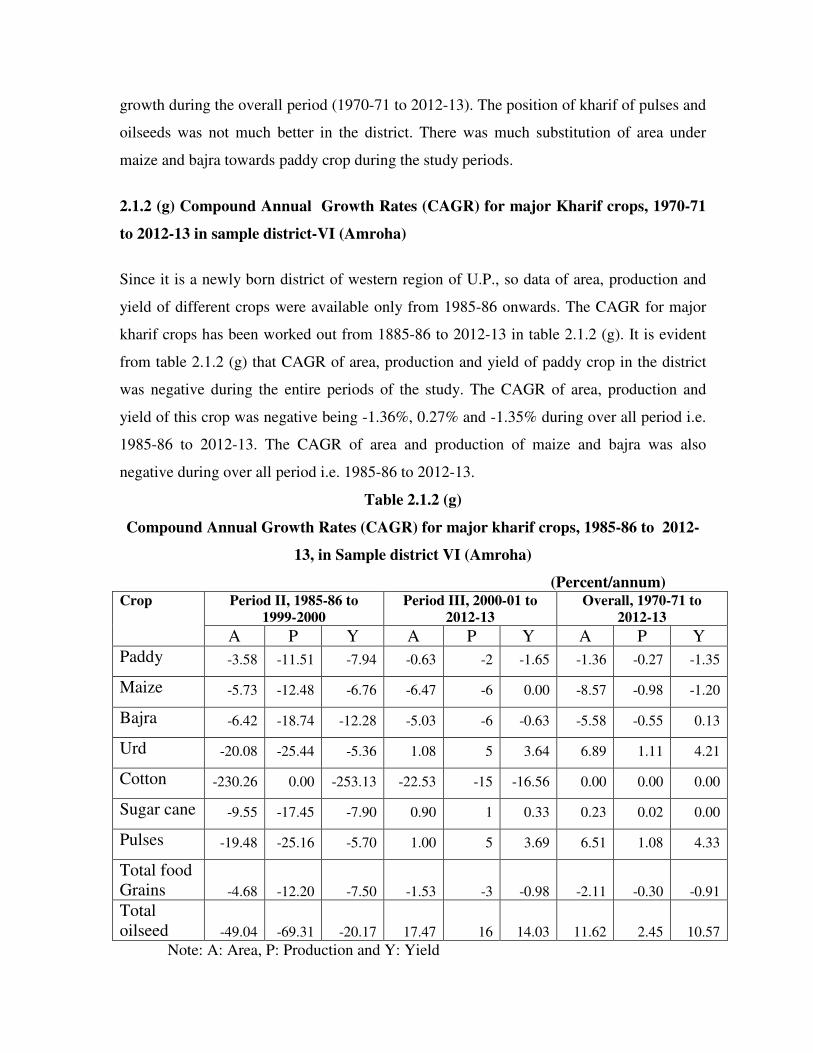
growth during the overall period (1970-71 to 2012-13). The position of kharif of pulses and
oilseeds was not much better in the district. There was much substitution of area under
maize and bajra towards paddy crop during the study periods.
2.1.2 (g) Compound Annual Growth Rates (CAGR) for major Kharif crops, 1970-71
to 2012-13 in sample district-VI (Amroha)
Since it is a newly born district of western region of U.P., so data of area, production and
yield of different crops were available only from 1985-86 onwards. The CAGR for major
kharif crops has been worked out from 1885-86 to 2012-13 in table 2.1.2 (g). It is evident
from table 2.1.2 (g) that CAGR of area, production and yield of paddy crop in the district
was negative during the entire periods of the study. The CAGR of area, production and
yield of this crop was negative being -1.36%, 0.27% and -1.35% during over all period i.e.
1985-86 to 2012-13. The CAGR of area and production of maize and bajra was also
negative during over all period i.e. 1985-86 to 2012-13.
Table 2.1.2 (g)
Compound Annual Growth Rates (CAGR) for major kharif crops, 1985-86 to 2012-
13, in Sample district VI (Amroha)
(Percent/annum) Period II, 1985-86 to
1999-2000 Period III, 2000-01 to
2012-13 Overall, 1970-71 to
2012-13 Crop
A P Y A P Y A P Y
Paddy -3.58 -11.51 -7.94 -0.63 -2 -1.65 -1.36 -0.27 -1.35
Maize -5.73 -12.48 -6.76 -6.47 -6 0.00 -8.57 -0.98 -1.20
Bajra -6.42 -18.74 -12.28 -5.03 -6 -0.63 -5.58 -0.55 0.13
Urd -20.08 -25.44 -5.36 1.08 5 3.64 6.89 1.11 4.21
Cotton -230.26 0.00 -253.13 -22.53 -15 -16.56 0.00 0.00 0.00
Sugar cane -9.55 -17.45 -7.90 0.90 1 0.33 0.23 0.02 0.00
Pulses -19.48 -25.16 -5.70 1.00 5 3.69 6.51 1.08 4.33
Total food
Grains -4.68 -12.20 -7.50 -1.53 -3 -0.98 -2.11 -0.30 -0.91
Total
oilseed -49.04 -69.31 -20.17 17.47 16 14.03 11.62 2.45 10.57
Note: A: Area, P: Production and Y: Yield

It is also surprising to note that CAGR of area and production of urd in the district has
registered a increasing growth during over all period i.e. 1985-86 to 2012-13. These were
increasing at the rate of 6.89% and 1.11% per annum respectively during over all period.
The CAGR of area, production and yield of urd was negative being -20.08%, -25.44% and
-5.36% respectively during period -II (1985-86 to 1999-2000. It is also witnessed from
Table 2.1.2 (g) that CAGR of area, production and yield of sugarcane, pulses, foodgrains
and oilseeds was negative during period II. It reflects that period-II was not favourable for
these crops. Overall the urd was acceptable crop in the district along with paddy crop.
2.2 Procurement of major Kharif Crops by Different Agencies from 1970-71 to
2010-11 in Uttar Pradesh
The details procurement of paddy crop from Uttar Pradesh during 1980-81, 1990-91, 2001-
02 and 2010-11 by different agencies is presented in Table 2.2. The paddy was only
procured by different agencies during the mentioned periods. The data of procurement of
paddy was not available for year 1970-71. Table 2.2 shows that State Government, U.P.
Cooperative Federation, U.P. State Food and Essential Commodities Corporation, U.P.
State Agro-Industrial Corporation, Development Corporation and Food Corporation of
India were important agencies to procure the paddy from the state during different years.
Among these agencies, the State Government and U.P. State Cooperative Federation were
main agencies to procure the paddy during 1980-81, 1990-91, 2000-01 and 2010-11. Out of
total procured quantity of paddy of 1385.523 thousand MT in 2010-11, 41.01% was
procured by State Government followed by 28.55%, 12.95%, 11.77%, 5.54% and 0.18% by
U.P. Cooperative Federation, Development Corporations other, U.P. State Agro-Industrial
Corporation, U.P. State Food and Essential Commodities Corporation and Food
Corporation of India respectively.
It is also noticed from Table 2.2 that State Government and U.P. Cooperative Federation
were main procurement agencies to procure major quantity of paddy during the study
periods. More than 90% of the total procured quantity of paddy was purchased by State
Government and U.P. Cooperative Federation during 1980-81, 1990-91 and 2000-01. Next
to these two agencies, U.P. State Agro-Industrial Corporation and Development

Corporation/ others had also purchased the paddy during 2010-11. Out of total procured
quantity of paddy during 2010-11, the share of Development Corporation/ others was
12.95% followed by 11.17% of U.P. State Agro-Industrial Corporation. The role of Food
Corporation of India was very negligible in procuring of paddy from U.P. during the stated
periods.
Table 2.2
Procurement of Paddy Crops by different Agencies, 1970-71 to 2010-11, State
(000’ tones)
Agencies 1970-71 1980-81 1990-91 2001-02 2010-11
Paddy
State government N.A. 476.76
(80.76)
4.592
(46.94)
514.40
(57.14)
568.03
(41.01)
U.P. Cooperative
Federation N.A.
89.75
(15.20)
3.68
(37.62)
298.60
(33.17)
395.55
(28.55)
U.P. State Food &
Essential Commodities
Corporation
N.A. 23.47
(3.98) - -
76.73
(5.54)
U.P. State agro-Industrial
Corporation N.A.
0.18
(0.03)
1.33
(13.60)
61.64
(6.85)
163.00
(11.71)
Development
Corporation/Others N.A. -
0.03
(0.31)
25.63
(2.84)
179.43
(12.95)
Food Corporation of India N.A. 0.16
(0.03)
0.15
(1.53) -
2.49
(0.18)
Total N.A. 590.32
(100.00)
9.782
(100.00)
900.27
(100.00)
1385.23
(100.00)
Note: Figures in brackets are percentage to total.

CHAPTER-3
Socio-Economic Characteristics of Growers
An attempt has been made in this chapter to know the socio-economic characteristics of
210 sample farmers of six selected districts of western region of Uttar Pradesh. It has
already been mentioned in first chapter of this report that 210 sample farmers were selected
randomly from six districts of western U.P. to know the “Possibility and constraints in
Adoption of Alternative Crops to Paddy in Green Revolution belt of North India”.
3.1. Demographic Characteristic of Sample Farmers
The demographic characteristic of 210 sample farmers is presented in Table-3.1. Table 3.1
shows that out of 210 sample farmers, small and marginal farmers accounted for 51.43%
followed by 42.86% and 5.71% for medium and large sample farmers respectively. Hence,
small and medium sample farmers jointly accounted for 94.29% of the total 210 sample
farmers. Number of large farmers available in the selected districts of western region of
U.P. were very less. The average size of members on sample farms was 9.21 which varied
from 8.86 to 13.42 members on small and large sample farms respectively. The age of head
of family was found maximum above 50 years across the size of farms. It is also witnessed
from table 3.1 that only few of head of family members were upto age of 30 years old
across the size of sample farms.
As far as educational status of head of sample farmers is concerned table 3.1 shows that
majority of head of families across the size of sample farms were educated upto matric
level. Of the total head of families of 210 households, 19.52% were educated upto graduate
and above. Maximum they belonged to medium sample farms. Table 3.1 also reveals that
about 21% of total head of families of small sample households were illiterate followed by
11% of medium sample households. None of the head of family of large sample households
was illiterate. It shows that educational status of head of families of medium and large
sample households were much better than that of small sample households. The main
occupation of head of families was agriculture across the size of sample farms. It is also

evident from table 3.1 that the agriculture as subsidiary occupation was adopted by only
4.63% head of families of small sample farms. No head of families belonging to medium
and large sample farms had adopted agriculture as subsidiary occupation on their farms
during the reference year.
Table: 3.1
General Characteristics of sample households, 2012-13
(Per cent)
Particulars Small Medium Large Overall
Age of Head (Years)
Up to 30 3.70 4.44 0 3.81
30-50 31.48 37.78 50.00 35.24
Above 50 64.82 57.78 50.00 60.95 Educational status of head of the family
Illiterate 21.30 11.11 0 15.72
Primary 11.11 7.78 8.33 9.52
Matric 43.52 25.56 41.67 35.72
Secondary 17.59 22.22 1.67 19.52
Graduate and above 6.48 33.33 3.33 19.52 Average Family Size (No.)
Males 4.47 4.70 7.17 4.78
Females 4.29 4.37 6.25 4.43
Total 8.86 9.07 13.42 9.21 Age of family members (Years)
Up to 18 40.44 35.54 370.27 38.11
18-35 31.14 30.27 24.84 30.25
35-60 22.15 26.47 32.92 24.87
Above 60 6.27 7.72 4.97 6.77 Occupation of Head of family Agriculture as Main
occupation 95.37 100.00 100.00 97.62
Agriculture as
Subsidiary
occupation
4.63 0.00 0.00 2.38
Permanent farm labour Male Number 0 2 3 5 Wages (Rs./month) Female Number 0 0 0 0 Wages (Rs./month) 0 0 0 0 Children Number 0 0 0 0 Wages (Rs./month) 0 0 0 0

The permanent farm labour was not engaged by the small sample farmers of six districts of
western U.P. during the reference year. However, large sample farmers had engaged 3
permanent labours followed by 2 by medium sample farmers. The engagement of casual
labours was much practiced to do the agricultural activities on the sample farms of the
study areas.
3.2 Average Land Holding of Sample Households 2012-13
The average land holding of sample households of six selected districts of western region
of U.P. during 2012-13 worked out in Table 3.2 indicates that over all, the average size of
owned land holding was estimated at 2.61 ha. which was fully irrigated. The average size
of owned land holding was highest being 10.29 ha. on large sample farms .followed by
3.34 ha and 1.26 ha. for medium and small sample farms respectively. Table 3.2 also
reveals that leased-in and leased-out land were not much prevalent on the sample farms.
Table: 3.2
Average land holding of sample households, 2012-13, State
(Hectares)
Particulars Small Medium Large Overall
Owned land
Irrigated 1.26 3.34 10.29 2.61
Unirrigated - - - -
Total 1.26 3.34 10.29 2.61
Leased-in land
Irrigated 0.08 0.40 3.25 0.40
Unirrigated - - - -
Total 0.08 0.40 3.25 0.40
Leased-out land
Irrigated 0.02 - 0.25 0.03
Unirrigated - - - -
Total 0.02 - 0.25 0.03
Current Fallow
Irrigated - - - -
Unirrigated - - - -
Total - -- - -
Total operational land
Irrigated 1.32 3.74 13.29 3.04
Unirrigated - - - -
Total 1.32 3.74 13.29 3.04

The large sample farmers had taken much area of leased-in land than small and medium
sample farmers. It is also noticed from Table 3.2 that area under current fallow was not left
across the size of sample farms during reference year. Over all, the average size of
operational holding was worked out to be 3.04 ha. against 13.29 ha., 3.74 ha. and 1.32 ha.
on large, medium and small size of sample farms respectively. Table 3.2 also reveals that
the area of operational holding was higher than that of owned area across the size of farms.
This was due to increase in area of leased-in land than the area of leased-out land. The total
operational area of 210 sample farmers was fully irrigated and cultivated.
3.3. Average Farm Inventory Ownership on Sample Farms 2012-13
The mechanization in agriculture has been increasing very fast since advent of Green
Revolution in the country. The Commercial Banks, Land Development Banks, Cooperative
Banks, Governments of Central and states etc. have been providing adequate loans to the
farmers to purchase tractors and its accessories, pump sets, spry pumps etc. Due to the
liberal system of loaning by institutional and non institutional banks etc, the farmers
irrespective of size of land holdings are purchasing agricultural assets to perform the
agricultural activities in scientific and efficient manner.
The maximum emphasis has been given on expansion of irrigation resources. The pump
sets of diesel and electric have been given at subsidized rate of interest to the farmers.
Therefore, the agriculture assets are generally found in much numbers on the farm across
the state at present which were rare before 1970-71. The farmers of western U.P. are
economically sound, so they possess the essential agricultural assets on their farms. The
average farm inventory ownership on the sample farms during 2012-13 is worked out in
table 3.3. Table 3.3 shows that the all the sample households of large farms had a tractor
while 50% and 7.41% of total sample households of medium and small households had
possessed tractors respectively. The over all, the average present value of a tractor was
estimated at Rs. 2,73,470 which varied between Rs. 2,28,125 and Rs. 3,84,667 on small
and large farms respectively.
It is also noticed from Table 3.3 that the each and very large sample farmer possessed
trolley and harrow along with tractor while it was not found in case of small and medium

sample farms. On an average, the present value of trolley, harrow and cultivator was
estimated at Rs. 64775, Rs. 19600 and Rs 12456 respectively. Out of 210 sample
household, 63.33% households had diesel engines while 31.90% sample households had
kept the electric motors on their farms. Few of them had kept both types of pump sets. Of
the total small sample farmers only 64.81% small sample farmers had kept both engines.
The number of diesel engines was more than electric motors on the small sample farms.
The value of a diesel engine was worked out to be Rs. 19,056 against Rs. 38,478 of a
electric motors. The per farm value of a diesel engine was Rs 12,164 while it was Rs. Rs
12,276 of a electric motor. Table 3.3 also shows that per farm value of a electric engine
was maximum being Rs. 35,833 on large farms which varied between Rs. 17,167 and Rs.
55833 on medium and small size of sample farms respectively. The spry pumps were also
purchased by sample farmers. Out of total sample households, 24.76% households possessed the
spry pumps. Out of total 52 spry pumps, 51.92% belonged to medium size of sample farms
followed by 32.69% and 15.38% on small and large size of sample farms respectively.
Table 3.3
Average Farm inventory ownership, sample households, 2012-13
(Per farm) Small Medium Large Overall Type of machine
No. PV No. PV No. PV No. PV
1. Tractor 0.07 16898 0.50 122233 1.25 480833 0.32 88552
2. Trolley 0.05 6481 0.34 20967 1.08 48917 0.23 15114
3. Harrow 0.06 1435 0.39 7476 1.00 17583 0.25 4947
4. Cultivator 0.07 1083 0.48 5724 1.08 13750 0.30 3796
5. Electric motor 0.20 5583 0.41 17167 0.67 35833 0.32 12276
6. Diesel Engine 0.44 7333 0.77 14694 1.33 36667 0.63 12164
7. Submersible
pump
- - 0.06 5056 - - 0.02 2167
8. Spray pump 0.16 97 0.30 183 - 758 0.25 171
9. Generator - - 0.01 222 - - 0.01 91
10. Cart 0.20 2532 0.28 6233 0.67 2250 0.23 4102
11. Drip System - - - - - - - -
12. Others 8.54 3678 10.17 7271 15.00 1183 9.62 5684
Note: PV is the Present value (Rs.)

The per farm present value of a spry pump was worked out to Rs. 758 on large sample
farms followed by Rs. 183 and Rs 97 on medium and small sample size of farms
respectively. The average current value of a spry pump was worked out to Rs. 692 which
varied between Rs. 1137 and Rs 615 and large and small size of sample farms respectively.
The above discussion reflects that the number of farm assets and its value increases with
increase in size of farms. The large sample farmers had better farm inventory than their
counter parts.
Table 3.3 (a)
Total Value of Farm inventory ownership, sample households, 2012-13
(Per farm) Small Medium Large Overall Type of machine
No. PV No. PV No. PV No. PV
1. Tractor 8 1825000
(228125)
45 11001000
(244466)
15 5770000
(384666)
68 18596000
(273471)
2. Trolley 5 700000
(140000)
31 1087000
(68871)
13 587000
(45154)
49 3174000
(64776)
3. Harrow 6 155000
(25883)
35 672800
(19223)
12 211000
(17583)
53 1038800
(19600)
4. Cultivator 8 117000
(25833)
43 515200
(11981)
13 165000
(12698)
64 797200
(12456)
5. Electric motor 22 603000
(27409)
37 1545000
(41757)
8 430000
(53750)
67 2578000
(38478)
6. Diesel Engine 48 792000
(16500)
69 1322500
(19167)
16 440000
(27500)
133 2554500
(19207)
7. Submersible pump - - 5 455000
(91000)
- - 5 455000
(91000)
8. Spray pump 17 10460
(615)
27 16430
(608)
8 9100
(1137)
52 35990
(692)
9. Generator - - 1 20000
(20000)
- - 1 20000
(20000)
10. Cart 22 273400
(12427)
25 561000
(22440
2 27000
(13500)
49 861400
(17580)
11. Drip System - - -- - -- - -- -
12. Others 922 397270
(431)
915 654430
(715)
183 142000
(776)
2020 1193700
(591)
Note: PV is the Present value (Rs.) Note: Figures in brackets are the present value per
inventory.
3.4.1 Cropping Pattern of Sample Households during 2012-13
The proportional share of area under different crops to net cropped area is presented in
Table 3.4.1. Table 3.4.1 reveals that wheat, paddy, bajra, vegetables, urd mustard and
maize were important crops on the sample farms which accounted for 56.64%, 41.02%,
17.44%, 12.42%, 11.24%, 10.69% and 10.67% to net cropped area respectively. Paddy,

bajra, maize, urd and sugarcane were important crops in kharif season while wheat,
rapeseed/mustard, vegetables were dominant crops in rabi season. This type of cropping
sequence was witnessed across the size of sample farms.
Table 3.4.1 reveals that paddy was dominant crop on all categories of sample farms in
Kharif season which had occupied 52.80% to net cropped area on small sample farms
followed by 41.76% and 28.91% on medium and large sample farms respectively. Next to
paddy, maize was an important crop on small sample farms while bajra was second
important crop on the medium and large farms during the study period. As far as urd crop
is concerned, Table 3.4.1 shows that it accounted for 16.90% to net cropped area on large
sample farms followed by 9.65% and 8.63% on medium and small sample farms
respectively. It shows that there was much diversion of net cropped area in favour of bajra,
maize and urd in the kharif season on large and medium sample farms. The shift of net
cropped area towards the maize, bajra and urd was not much prevalent on small sample
farms as compared to medium and large sample farms. The above discussion shows that the
large and medium sample farmers had devoted more area under bajra, maize, urd than
small sample farmers in the reference year. Wheat was most important crop in rabi season
across the sample farms. Out of net cropped area, wheat accounted for 66.83%, 54.00% and
53.12% on small, medium and large farms respectively during reference year.
Next to wheat crop, the vegetable and rapeseed/mustard were also important crops across
the sample size of farms in rabi season. Out of total net cropped area, the area under
vegetable accounted for 13.48% on large farms followed by 12.15% and 12.03% on small
and medium sample farms respectively. The area under rapeseed/mustard accounted for
12.79% to net cropped area on large farms followed by 10.12% and 8.50% on medium and
small sample farms respectively during the study period. Of the total net cropped area of
210 sample farmers of six districts of western U.P., 97.81% area was covered by kharif
crops in the study period against 89.90% of area under rabi crops. It shows that 10.10% and
2.19% of net cropped was not cultivated by sample farmers in rabi and kharif season
respectively. The analysis of cropping pattern reflects that bajra, maize and urd crops were
alternative crops to paddy crop in the six selected districts of western U.P.

Table 3.4.1
Cropping Pattern of sample households, 2012-13 (Per cent to Net cropped area) Season/Crops Small Medium Large Overall
A. Kharif
1. Paddy 52.80 41.76 28.91 41.02
2. Maize 16.01 9.31 8.78 10.67
3. Bajra 14.57 16.72 21.51 17.44
4. Jowar Fodder 3.94 6.45 1.29 4.60
5. Cotton - - - -
6. Sugarcane 3.72 10.90 7.95 8.57
7. Groundnut 0.63 0.74 0 0.53
8. Moong 0 0.07 0.63 0.20
9. Soyabean 0 0 0 0
10. Urd 8.63 9.65 16.90 11.24
11. Sorghum 0 0 0 0
12.Other 0.42 1.13 11.41 -97.81
B. Rabi
1. Wheat 66.83 54.00 53.12 56.64
2. Gram 0 0 0 0
3. Sunflower 0 0 0 0
4. Rapeseed &
Mustard
8.50 10.12 12.79 10.69
5. Vegetable 12.15 12.03 13.48 12.42
6. Berseem 4.94 4.40 1.32 3.75
7.Other 2.53 5.59 11.79 6.40
C. Summer 0 0 0 0
Crops 0 0 0 0
1. Maize 0 0 0 0
2. Bajra 0 0 0 0
3. Cowpea 0 0 0 0
4. Other___ 0 0 0 0
Net cropped area (ha.)
142.38 336.18 159.45 638.01

3.4.2 Potential Alternative crops to paddy crop as perceived by sample households.
2012-13
The potential alternative crops to paddy crop as perceived by sample farmers is analysed in
Table 3.4.2. Table 3.4.2 shows that bajra, maize and urd crops were main alternative crops
to paddy crop on all the sample size of farms. The percent multiple response of small
sample farmers was maximum in favour of maize and bajra. Table 3.4.2 indicates that
37.04%, 13.59% and 11.88% multiple responses of small farmers had gone in favour of
bajra, maize and urd as alternative crops respectively to paddy crop.
The multiple responses of medium sample farmers towards alternative crops to paddy crop
were bajra, urd and maize which accounted for 50%, 40% and 33.33% respectively.
However, the large sample farmers were given much weightage to bajra and urd as
alternative crops to paddy crop. Over all, bajra followed by maize crops were treated as
alternative crops to paddy crop on the sample farms of six districts of western region of
Uttar Pradesh.
Table 3.4.2
Potential alternative crops to paddy crop as perceived by Sample households, 2012-13
(Per cent multiple response)
Crops Small Medium Large Overall
1. Bajra 37.04 50.00 100.00 46.19
2. Maize 13.59 33.33 41.67 40.19
3. Cotton 0 0 0 0
4. Groundnut 0 0 0 0
5. Moong 0 0 0 0
6. Soyabean 0 0 0 0
7. Mash/urd 11.88 40.00 100.00 38.10
8. Forage legume 0 0 0 0
9. Other 0 0 0 0

3.5.1 (a) Production and Crop Retention Pattern of paddy on Sample households
2012-13
The per farm production and retention pattern of paddy crop on the sample households
during 2012-13 is worked out in Table 3.5.1 (a). Table 3.5.1 (a) shows that the per farm
production of paddy was highest being 166.42 qtls on large sample households followed by
71.91 qtls and 32.36 qtls on medium and small sample households respectively. The per
hectare production of paddy worked out to 46.49 qtls on small farms followed by 46.09 qtls
and 43.32 qtls on medium and large sample farms respectively. It shows that the per
hectare production of paddy decreases with increase in the size of farms. The per farm
production was highest on large sample farms and lowest on small sample farms. Out of
total per farm production of paddy being 32.36 qtls on small farms, 87.89% was sold and
12.11% was retained for self consumption and for the payment in kind. Out of total
retained quantity of 3.92 qtls per farm, self consumption accounted for 99.48% and rest
accounted for 0.52% for payment in kind. The small sample farmers had retained nominal
quantity of production of paddy for feed purpose during the study period. It increases with
increase in size of sample farms. The gap of production of paddy between lowest and
highest quantity was 134.06 qtls per farm.
In case of medium sample farms, Table 3.5.1 (a) shows that out of total per farm quantity
of production of paddy, 93.21% was sold and rest 6.79% was retained for self consumption
and payments in kind. The medium sample households had also not retained the production
of paddy for seed purposes. As far as large sample households are concerned, table 3.5.1
(a) shows that 94.14% of total production of paddy was sold and 5.86% was retained for
self consumption and payments in kind purposes. Over all, 91.82% of total production of
paddy was marketed and rest 8.18% was retained for self consumption and payments in
kind. None of sample households had retained any quantity of total production of paddy for
seed purposes during the reference year. It is emerged from above discussion that the
marketed quantity of production of paddy increases with increase in size of farms. There
was positive correlation between marketed surplus and farms size in the study areas. Paddy
was not stored for seed by the sample farmers in the reference year.

Table 3.5.1 (a)
Production and Crop retention pattern of Paddy, sample households, 2012-13
(Qtl/farm)
Crops Small Medium Large Overall
Production 32.36
(100.00)
71.91
(100.00)
166.42
(100.00)
56.97
(100.00)
Retention for
Self consumption 3.861
(11.93)
4.78
(6.65)
9.33
(5.61)
4.59
(8.06)
Seed - - - -
Feed 0.01
(0.03)
0.05
(0.07)
- 0.03
(0.05)
Payments in kind 0.05
(0.15)
0.05
(0.07)
0.42
(0.25)
0.05
(0.09)
Total retention 3.92
(12.11)
4.88
(6.79)
9.75
(5.86)
4.66
(8.18)
Total qty. sold 28.44
(87.89)
67.03
(93.21)
156.67
(94.14)
52.31
(91.82)
Note: Figures in brackets are percentage to total production.
3.5.1 (b) Production and Crop Retention Pattern of Competing crop-I (Bajra) on
sample households 2012-13
The bajra was second most important alternative crop to paddy on the sample farms during
study period. The per farm production and crop retention pattern of competing crop-I
(bajra) on the sample farms during 2012-13 is presented in Table 3.5.1 (b). Table 3.5.1 (b)
shows that at the aggregate level, the per hectare production of bajra was worked out to
32.88 qtls which ranged between 30.33 qtls and 32.92 qtls on medium and large sample
farms respectively. It shows that the per hectare production of bajra was more or less same
across the sample farms. However, the per farm production was lowest being 6.52 qtls on
small sample farms. The per farm production of bajra on medium sample farms was 20.46
qtls during the same period. Over all, the per farm production of bajra was estimated at
17.42 qtls. Out of total per farm production of 17.42 qtls marketed surplus accounted for
87.72% followed by 5.68%, 4.13% and 0.23% for self consumption, feed, seed and
payments in kind respectively. Table 3.5.1 (b) also reveals that more than 96.5%
production of bajra was sold by large sample farmers followed by 84.36% and 82.51% by
medium and small sample farmers respectively. It shows that the marketed surplus of bajra

increases with increase in size of farms. It is also noticed from Table that sample farmers
across the size farms had kept the bajra grain for seed and feed purposes but it was very
nominal quantity. It shows that the bajra was mostly produced for sale purpose in the study
areas.
Table 3.5.1 (b)
Production and Crop retention pattern of Competing crop -I (Bajra) sample
households, 2012-13
(Qtl/farm)
Crop Small Medium Large Overall
Production 6.52
(100.00)
20.46
(100.00)
92.82
(100.00)
17.42
(100.00)
Retention for
Self consumption 0.66
(10.12)
2.21
(10.80)
1.36
(1.47)
0.99
(5.68)
Seed 0.001
(0.01)
0.02
(0.09)
- 0.39
(2.24)
Feed 0.42
(6.44)
0.94
(4.59)
1.88
(2.03)
0.72
(4.13)
Payments in kind 0.06
(0.92)
0.03
(0.15)
- 0.04
(0.23)
Total retention 1.14
(17.49)
3.20
(15.64)
3.24
(3.49)
2.14
(12.28)
Total qty. sold 5.38
(82.51)
17.26
(84.36)
89.58
(96.51)
15.28
(87.72)
Note: Figures in brackets are percentage to total production.
3.5.1 (C) Production and Crop Retention Pattern of Competing crop II (Maize) on
Sample Households 2012-13
The maize is also competing crop to paddy crop in the selected districts of western region
of Uttar Pradesh. It is widely grown in few districts of the western region of U.P. The
production and retention of maize crop is illustrated in Table 3.5.1 ©. Table 3.5.1 (c )
shows that at the aggregate level, the per hectare production was estimated at 34.39 qtls
which was highest being 43.57 qtls on large sample farms followed by 32.64 qtls and 31.17
qtls on medium and small sample farms respectively. The per hectare production of maize
also increases with increase in size of farms. However, the per farm production of maize
was worked out to be 38.25 qtls, 11.35 qtls and 6.75 qtls on large, medium and small

sample farms respectively. The over all, per farm production was 10.52 qtls of which
88.22% was sold and rest 11.78% was retained for self consumption, feed etc. Table 3.5.1
(c) also reveals that out of per farm production, of maize, 97.28% was sold by large sample
farmers followed by 88.81% and 81.48% by medium and small sample farmers
respectively. The marketed surplus increases with increase in the size of farms. It was also
retained for self consumption, seed and feed by sample farmers. The large sample farmers
had retained maize in less quantity than medium and small sample farmers in the reference
year.
Table 3.5.1 (C)
Production and Crop retention pattern of Competing (Maize), sample households,
2012-13
(Qtl/farm)
Crop Small Medium Large Overall
Production
6.75
(100.00)
11.35
(100.00)
38.25
(100.00)
10.52
(100.00)
Retention for
Self consumption 0.75
(11.11)
0.66
(5.81)
0.67
(1.75)
0.70
(6.65)
Seed 0.01
(0.15)
0.02
(0.18)
0.17
(0.44)
0.02
(0.19)
Feed 0.49
(7.26)
0.56
(4.94)
0.20
(0.53)
0.50
(4.75)
Payments in kind - 0.03
(0.26)
- 0.02
(0.19)
Total retention 1.25
(18.52)
1.27
(11.19)
1.04
(2.72)
1.24
(11.78)
Total qty. sold 5.50
(81.48)
10.08
(88.81)
37.21
(97.28)
9.28
(88.22)
Note: Figures in brackets are percentage to total production.
3.5.1 (d) Production and Crop retention pattern of Competing Crop III (Urd) on
Sample Households 2012-13
Urd is an important kharif pulse in the selected districts. It is generally grown in up lands
and also requires less water. It is also competing crop to paddy in few selected districts of
western region. The per farm production and retention of urd of selected households in the
reference year is worked out in Table 3.5.1 (d). It is evident from Table 3.5.1 (d) that per
hectare production at aggregate level, was 11.76 qtls which was maximum being 12.32 qtls
on medium sample farms followed by 11.46 qtls and 11.07 qtls on large and small sample

farms respectively. It shows that per hectare production of urd was more or less same
across the sample size of farms. The per farm production of urd was highest being 25.75
qtls on large sample farms followed by 4.44 qtls and 1.26 qtls on medium and small sample
farms respectively. It shows that the per farm production of urd increases with increase in
the size of sample farms.
Out of total per farm production of urd of 4.02 qtls, 89.30% was sold and rest of 10.70%
was retained by the sample farmers. Table also reveals that large households had sold
93.20% of the total production of urd against 88.51% and 82.54% by medium and small
sample households respectively. The urd was also retained for self consumption by the
sample households.
Table 3.5.1 (d)
Production and Crop retention pattern of Competing crop III (Urd), sample
households, 2012-13
(Qtl/farm)
Crop Small Medium Large Overall
Production 1.26
(100.00)
4.44
(100.00)
25.75
(100.00)
4.02
(100.00)
Retention for - - - -
Self consumption 0.21
(16.67)
0.49
(11.04)
1.75
(6.80)
0.42
(10.45)
Seed - 0.01
(0.22)
- 0.002
(0.05)
Feed - 0.01
(0.23)
- 0.002
(0.05)
Payments in kind 0.01
(0.79)
- - 0.01
(0.25)
Total retention 0.22
(17.46)
0.51
(11.49)
1.75
(6.80)
0.43
(10.70)
Total qty. sold 1.04
(82.54)
3.93
(88.51)
24.00
(93.20)
3.59
(89.30)
Note: Figures in brackets are percentage to total production.
3.5.2 (a) Disposal Pattern of paddy on sample households 2012-13
The disposal pattern of paddy on the sample households in reference year is worked out in
Table 3.5.2 (a). This table shows that all quantity of paddy was sold to only local /private
traders. None of other marketing functionaries was involved in the marketing of paddy in
the study areas.

Table 3.5.2 (a)
Disposal pattern of paddy, sample households, 2012-13
Crop Small Medium Large Overall
Paddy 0 0 0 0
1. Local trader 0 0 0 0
Quantity 3071.70
(28.44)
6033.00
(67.03)
1880.00
(156.67)
10904.70
(51.92)
Price/Qtls 2188 2630 2711 2539
2.Govt. agency 0 0 0 0
Quantity 0 0 0 0
Price 0 0 0 0
3. Processor/Miller 0 0 0 0
Quantity 0 0 0 0
Price 0 0 0 0
4. Pvt. Company 0 0 0 0
Quantity 0 0 0 0
Price 0 0 0 0
5. Any other 0 0 0 0
Quantity 0 0 0 0
Price 0 0 0 0
6. Total 0 0 0 0
Quantity 0 0 0 0
Price 0 0 0 0 Note: Quantity indicate quantity of total produce sold (in quintals) through a particular market
functionary and Price is in Rs./q.
Note: Figures in brackets are Q/per farm..
The per qtl price of paddy at aggregate level was Rs. 2539 which ranged between Rs. 2188
and Rs. 2711 on small and large farms respectively. It shows that large sample farmers
received more Rs.523 per qtl sold price of paddy than the price received by small sample
farmers. There was wide gap between price received by large and small sample farmers
during same period.

3.5.2 (b) Disposal Pattern of Competing Crop I (Bajra) on the Sample Households-
2012-13
The disposal pattern of bajra on the sample farms in reference year is worked out in Table
3.5.2 (b). This table shows that the sample farmers had sold total the quantity of bajra to
only local/private traders in the reference year. None of other marketing agencies was
involved, in trading of bajra. Over all, the price of bajra per qtl worked out to be Rs. 1104.
The per qtl price of bajra was more or less same across the sample size of farms.
Table 3.5.2 (b)
Disposal pattern of Competing Crop-I (Bajra), sample households, 2012-13
Crop Small Medium Large Overall
Paddy 0 0 0 0
1. Local trader 0 0 0 0
Quantity 580.50
(14.51)
1553
(34.51)
1075.00
(89.58)
3208.50
(33.08)
Price/qtl 1107 1108 1095 1104
2.Govt. agency 0 0 0 0
Quantity 0 0 0 0
Price 0 0 0 0
3. Processor/Miller 0 0 0 0
Quantity 0 0 0 0
Price 0 0 0 0
4. Pvt. Company 0 0 0 0
Quantity 0 0 0 0
Price 0 0 0 0
5. Any other 0 0 0 0
Quantity 0 0 0 0
Price 0 0 0 0
6. Total 0 0 0 0
Quantity 0 0 0 0
Price 0 0 0 0 Note: Quantity indicate quantity of total produce sold (in quintals) through a particular market functionary
and Price is in Rs./q.
Note: Figures in brackets are Q/per farm..

3.5.2 (C) Disposal Pattern of Competing Crop II (Maize) on the Sample Households-
2012-13
The disposal pattern of maize crop is worked out in Table 3.5.2 ©. Table shows that all the
sample farms of different size groups had sold the total quantity of maize to only local
private traders. None of other marketing agencies was involved in marketing of maize in
reference year.
Table 3.5.2 (C)
Disposal pattern of Competing Crop-II (Maize), sample households, 2012-13
Crop Small Medium Large Overall
Paddy 0 0 0 0
1. Local trader 0 0 0 0
Quantity 594.00
(11.65)
907.50
(30.25)
446.50
(89.30)
1948.00
(22.65) Price/qtl 1347 1312 1336 1328
2.Govt. agency 0 0 0 0
Quantity 0 0 0 0
Price 0 0 0 0
3. Processor/Miller 0 0 0 0
Quantity 0 0 0 0
Price 0 0 0 0
4. Pvt. Company 0 0 0 0
Quantity 0 0 0 0
Price 0 0 0 0
5. Any other 0 0 0 0
Quantity 0 0 0 0
Price 0 0 0 0
6. Total 0 0 0 0
Quantity 0 0 0 0
Price 0 0 0 0 Note: Quantity indicate quantity of total produce sold (in quintals) through a particular market
functionary and Price is in Rs./q.
Note: Figures in brackets are Q/per farm.

The per qtl price of maize received was Rs. 1347 by small sample farmers followed by Rs
1336, Rs 1312 by medium and large sample farmers respectively. Over all, the per qtl price
of maize was Rs. 1328, which ranged between Rs. 1312 and Rs 1347 on medium and small
sample farms respectively. It shows that there was marginal difference in per qtl price of
maize across the size of farms.
3.5.2 (d) Disposal Pattern of Competing Crop III (Urd) on the Sample Households-
2012-13
The disposal pattern of competing crop-III urd on the sample farm is worked out in Table
3.5.2 (d). Table shows that on an aggregate level about 89% of the total production of urd
was sold by the sample farmers. Over all, the per qtl price received by sample farmers was
Rs. 3551 which ranged between Rs. 3659 and Rs 3530 on small and large sample farms
respectively The small sample farmers received more than Rs. 129 per qtls price from the
received price of Rs. 3530 per qtl by large sample farmers.
Table 3.5.2 (d)
Disposal pattern of Competing Crop-III (Urd), sample households, 2012-13
Crop Small Medium Large Overall
Paddy 0 0 0 0
1. Local trader 0 0 0 0
Quantity 112.70
(3.52)
353.75
(9.83)
300.00
(25.00)
766.45
(9.58)
Price/qtl 3659 3535 3530 3551
2.Govt. agency 0 0 0 0
Quantity 0 0 0 0
Price 0 0 0 0
3. Processor/Miller 0 0 0 0
Quantity 0 0 0 0
Price 0 0 0 0
4. Pvt. Company 0 0 0 0
Quantity 0 0 0 0
Price 0 0 0 0
5. Any other 0 0 0 0
Quantity 0 0 0 0
Price 0 0 0 0
6. Total 0 0 0 0
Quantity 0 0 0 0
Price 0 0 0 0 Note: Quantity indicate quantity of total produce sold (in quintals) through a particular market functionary
and Price is in Rs./q. Note: Figures in bracket are Q/per farm.

The per qtl price of urd was more or less same on the medium and large farms. It is also
witnessed from Table 3.5.2 (d) that all the sample farmers irrespective of size of farms had
sold urd to only local/private traders. No other market functionary was involved in
marketing of urd during the reference year in the study areas.

CHAPTER-4
Economics of Production for Paddy vis-à-vis Competing Crops on the
Sample Farms, 2012-13
This chapter contains input use pattern for major kharif crops and cost of cultivation for
paddy vis-à-vis competing crops. Apart from these, economic viability of paddy vis-à-vis
competing crops and resource use efficiency for major kharif crops have also been analysed
in this chapter.
4.1 (a) Input use pattern for paddy on sample households, 2012-13.
The input use pattern for cultivation of paddy on the sample farms is presented in Table 4.1
(a).
Table 4.1 (a)
Input use pattern for cultivation of paddy, sample households, 2012-13
(Per hectare) Inputs Unit Small Medium Large Overall
1. Human labor Mandays i) Hired 59.387 70.719 74.810 68.184 ii) Family 34.507 23.210 16.578 25.284 2. Machine labor Hours 13.881 11.372 12.430 12.088 3. Seed Kg. 16.652 16.353 17.527 16.646 4. FYM Quintals 79.210 34.224 24.512 45.437 5. Fertilizer Kg. i. Urea 243.017 211.951 220.607 222.401 ii. CAN 0 0 0 0 iii. DAP 136.903 127.593 114.317 127.928 iv. MOP 2.128 2.849 0 2.140 v. SSP 0 0 0 0 vi. Other 0 0 0 0 6. Micro Nutrient Kg. 19.77 16.65 16.27 17.48 7. Plant protection
measures Rs. 688 678 856 712
8. Irrigation Hours 53.285 39.423 44.707 44.337 9. Any other - - - - -

The Table shows that human and machine labour had been used intensively in the
cultivation of paddy in the study areas in the reference year. Over all, the per hectare use of
human labour days was 93 followed by 12 hours of machine labour in the cultivation of
paddy on the sample farms.
The seed rate per ha. was 16.65 Kg., 16.353 Kg, 17.527 Kg. on small, medium and large
farms respectively which was more or less same across the size of farms. The per hectare
use of FYM was maximum being 79 qtls on small size of farms followed by 34 qtls and 24
qtls on medium and large size of sample farms respectively. The per ha. use of urea was
maximum being 243 Kg on small farms followed by 220 Kg and 212 kg on the large and
medium sample farms respectively The per ha. use of DAP was 137 Kg on small sample
farms against 128 Kg and 114 Kg on medium and large farms respectively. Thus, per ha.
use of DAP decreases with increase in sample size of farms. The urea and DAP were used
in much quantities by small sample farmers in paddy than their counter parts.
It is also evident from Table 4.1 (a) that the expenditure on plant protection measures was
maximum Rs 856 per ha on the large sample farms followed by Rs 688 and Rs 678 per ha.
on small and medium sample farms respectively. The large sample farmers had applied
more plant protection measures in their paddy crop than the medium and small sample
farmers. The per ha. use of irrigation hours witnessed more on small sample farms than
medium and large farms. Over all, more than 44 hours were used in irrigation sources to
provide irrigation water to paddy. It shows that input use pattern for cultivation of paddy
crop was more or less similar across the size of sample farms. All the essential inputs were
fully used by all the categories of sample farmers to get the better production of paddy
from their farms.
4.1. (b) Input use pattern for cultivation of Competing Crop-I (Bajra) on the Sample
households-2012-13
The input use pattern in the cultivation of bajra on the sample farms is worked out in Table
4.1 (b) in the reference year. Table shows that per ha human labour days at the aggregate
level were 40 which was highest being 46 days on small farms. The per hectare family

labour days was also maximum on small farms against medium and large farms. The per
ha. machine labour hours was found more on large farms than that of medium and small
farms. It shows that large farmers had taken keen interest in the cultivation of bajra crop
than medium and small farmers. Over all, the machine labour hours worked out to be
11.067 per ha. which was more or less similar across the size of farms. The per ha. seed
rate at the aggregate level was worked out to 6 Kg which was more or less similar across
the size of sample farms. The FYM was also used by the sample farmers, though its per ha.
quantity was inadequate. The per ha. used quantity of FYM worked out to be 10 qtls at the
aggregate level.
Table 4.1 (b)
Input use pattern for cultivation of competing crop I (Bajra), sample households,
2012-13
(Per hectare) Inputs Unit Small Medium Large Overall
1. Human labor Mandays
i) Hired 19.2531 26.323 25.911 24.878
ii) Family 26.819 13.190 10.569 14.978
2. Machine labor Hours 11.578 10.435 11.793 11.067
3. Seed Kg. 5.422 6.317 5.729 5.969
4. FYM Quintals 10.843 12.90 5.539 10.247
5. Fertilizer Kg.
i. Urea 70.843 32.313 47.738 72.225
ii. CAN 0 0 10.204 3.146
iii. DAP 36.241 30.374 23.907 29.474
iv. MOP 0 0 0 0
v. SSP 0 0 0 0
vi. Other 0 0 0 0
6. Plant protection
measures
Rs. 0 4.09 243.00 76.989
7. Irrigation Hours 8.337 7.117 5.773 6.930
8. Any other - - - -

The urea and DAP were also used by almost all the sample farmers in the bajra crop. The
per ha used quantity of urea was maximum being 70.84 kg on small farms followed by
47.74 kg and 32.31 kg on large and medium farms respectively. It shows that per ha. use
of Urea in bajra crop decreases with increase in the size of sample farms. The per ha. use of
DAP was higher being 36 Kg on small sample farms followed by 30.38 Kg and 23.91 Kg
on medium and large farms respectively. It reflects that the use of urea and DAP were not
adequately used by large sample farmers in bajra crop in comparison to small and medium
sample farmers. Against this, plant protection measures were much applied by large sample
farmers in bajra crop than other categories of sample farmers. Since bajra does not require
much water hence, about 7 hours were given to the irrigation of bajra crop. The above
analysis shows that the sample farmers of different categories had used the sufficient
quantity of essential inputs in the cultivation of bajra crop in 2012-13.
4.1.C Input use pattern for cultivation of competing crop II (Maize) on the sample
households, 2012-13
The per ha. input use pattern for the cultivation of maize crop on the sample farms is shown
in Table 4.1.(c). It shows that all the essential inputs were used by all the categories of
sample farmers in the cultivation of maize crop in the reference year. It is also witnessed
from this table that per ha. use of inputs was more or less similar across the sample farms.
The family labour were more employed by small sample farmers in the cultivation of maize
in comparison to medium and large farmers. The per ha. use of machine labour hours was
higher on large sample farms than that of medium and small sample farms. The hired
labour days per ha. was worked out to be 23.32, 23.14 and 19.25 on large, medium and
small sample farm respectively. At the aggregate level, machine labour hours worked out to
be 9.95 which ranged between 10.63 and 9.38 hrs on large and medium farms respectively.
The per ha. seed rate is worked out to be 17.83 Kg. at the aggregate, which ranged
marginally across the size of farms. The per ha. use of urea was estimated at about 142 Kg
on the small sample farms against 124 kg and 45.71 Kg on medium and large sample farms
respectively. The per ha. use of DAP was maximum being 101.447 kg on small farms
against 91.853 Kg and 45.714 Kg on medium and large sample farms respectively. The use

of urea and DAP per ha. decreases with increase in the size of farms. The cost incurred on
plant protection measures was also highest being Rs. 501 per ha. on small farms while it
was Rs. 193 and Rs. 188 on large and medium sample farms respectively. Since, the maize
is a kharif crop, so it requires very less water. On account of this, overall, only 19 hours
had been devoted in the irrigation activities. The small sample farmers had devoted 23.55
hours in irrigation activities followed by 19 hours and 10.86 hours by medium and large
farmers respectively. The above discussion shows that the essential inputs were used more
by small farmers than medium and large sample farmers in maize crop. The maize crop
was intensively cultivated on the small sample farms than large sample farms in the
reference year.
Table 4.1 (C)
Input use pattern for cultivation of competing crop-II (Maize), sample households,
2012-13
(Per hectare) Inputs Unit Small Medium Large Overall
1. Human labor Mandays
i) Hired 19.253 23.317 23.143 24.878
ii) Family 28.542 11.621 7.679 16.478
2. Machine labor Hours 10.317 9.377 10.643 9.952
3. Seed Kg. 17.695 18.083 15.000 17.827
4. FYM Quintals 17.675 47.083 35.714 34.993
5. Fertilizer Kg.
i. Urea 141.798 124.12 45.714 111.718
ii. CAN 0 0 35.714 7.342
iii. DAP 101.447 91.853 45.714 75.962
iv. MOP 0 0 0 0
v. SSP 0 0 0 0
vi. Other 0 0 0 0
6. Plant protection
measures
Rs. 501.10 187.60 192.86 293.64
7. Irrigation Hours 23.553 19.291 10.857 19.00
8. Any other - - - - -

4.1. (d) Input use Pattern for cultivation Competing Crop III (Urd) on the Sample
Households 2012-13.
Urd is also a competing crop to paddy in the selected districts of western region of Uttar
Pradesh. It is an important Kharif pulse and it is generally grown in upland. It is also
profitable pulse crop, so the farmers prefer to devote some area under urd crop in every
year. The input use pattern for cultivation of urd on the sample farms is presented in Table
4.1 (d).
Table 4.1 (d)
Input use pattern for cultivation of competing crop III (Urd), sample households,
2012-13
(Per hectare) Inputs Unit Small Medium Large Overall
1. Human labor Mandays
i) Hired 18.165 10.955 21.299 16.080
ii) Family 26.912 19.800 9.954 17.318
2. Machine labor Hours 9.467 11.063 9.499 10.315
3. Seed Kg. 12.612 12.635 13.544 12.979
4. FYM Quintals 22.945 22.496 17.811 28.81
5. Fertilizer Kg.
i. Urea 56.956 28.505 64.935 47.078
ii. CAN 0 0 0 0
iii. DAP 28.885 28.659 39.318 32.710
iv. MOP 0 0 0 0
v. SSP 0 0 0 0
vi. Other 0 0 0 0
6. Plant protection
measures
Rs. 162.734 63.174 166.976 94.155
7. Irrigation Hours 1.790 3.359 4.787 3.327
8. Any other - - - - -
Table 4.1(d) shows that the over all human labour days per ha. was worked out to be 33.40
in the all activities of its cultivation. The per ha. family labour days was highest on the

small sample farms and lowest was on large sample farms. In case of per ha. use of hired
labour days, it was totally opposite. The per ha. seed rate was estimated at 13 Kg at the
aggregate level, which was marginally ranged across the size of sample farms. The per ha.
use of urea was estimated at 64.94 kg on the large sample farms against 56.956 Kg and
28.505 Kg on small and medium sample farms respectively. The per ha. use of DAP was
39.318 Kg on large sample farms followed by 28.885 Kg and 28.659 Kg on the small and
medium sample farms respectively. It shows that large sample farmers had used much
quantity of urea and DAP in urd crop than the small and medium sample farmers. The plant
protection measures were also applied by all categories of sample farmers. The cost
incurred on plant protection measure was maximum being Rs 167 on large farms followed
by Rs 163 and Rs 63 on small and medium sample farms respectively. The irrigation
source was very nominally used in urd crop by all the categories of sample farmers. The
irrigation sources were used only 3.327 hours at the aggregate level, which ranged between
1.790 and 4.787 hours on small and large sample farms respectively.
4.2(a) Cost of Cultivation (Variable Cost) of Paddy on Sample Farms in 2012-13
The per ha. cost of cultivation of paddy on the sample farms in the reference year is worked
out in Table 4.2 (a). Table shows that overall the value of variable costs in the paddy crop
was Rs 39,372 per ha. of which 46.35% was incurred on human labour followed by
17.56% on machine labour. The fertilizer and manure accounted for 14.93% of total cost of
Rs. 39372.26 per ha. followed by 5.26% and 7.79% for irrigation and seed respectively. It
is also witnessed from the table 4.2 (a) that the total per ha. variable cost was highest being
Rs 40,959 on small sample farms followed by Rs 38,849 and Rs 38,379 on medium and
large size of sample farms respectively. It shows that the total variable costs, decreases
with increase in the size of farms. Among per ha. variable costs human as well as machine
labour components accounted for maximum share than other input items in the cultivation
of paddy in all the selected sample farms. Next to this, irrigation manure and fertilizers and
seed were expensive inputs in the cultivation of paddy crop on selected sample farms.
Table also reveals that the ha. cost on plant protection measures was maximum beings 856
large sample farms followed by Rs 688 and 678 on small and medium sample farms
respectively.

Table 4.2 (a)
Cost of cultivation (Variable cost) of paddy, sample households, 2012-13
(Rs/ha) Inputs Small Medium Large Overall 1. Human labor i) Hired 12114.79
(29.58)
13065.94
(33.63)
14529.28
(37.86)
13050.47
(33.15) ii) Family 7111.333
(17.36)
4822.265
(12.41)
3216.92
(8.38)
5197.10
(13.20) 2. Machine labor 6855.746
(16.74)
7036.731
(18.11)
6631.236
(17.28)
6913.30
(17.56) 3. Seed 2222.001
(5.42)
2001.766
(5.15)
2030.369
(5.29)
2070.08
(5.26) 4. FYM 1346.103
(3.29)
1377.707
(3.55)
965.2928
(2.52)
1295.97
(3.29) 5. Fertilizer 5052.088
(12.33)
4470.321
(11.52)
4154.252
(10.82)
4581.78
(11.64) 6. micro nutrient 923.5967
(2.25)
652.849
(1.68)
671.5835
(1.75)
733.93
(1.86) 7. Plant protection
measures 687.6962
1.68)
678.0698
(1.75)
855.7918
(2.23)
712.14
(1.80) 8. Irrigation 2871.442
(7.02)
2989.259
(7.69)
3612.581
(9.40)
3065.22
(7.79) 9. Interest on
working capital 1175.539
(2.87)
1112.842
(2.86)
1100.022
(2.87)
1128.60
(2.87) 10. Misc. expenses* 598.5634
(1.46)
641.0256
(1.65)
611.7137
(1.60)
623.66
(1.58)
Total cost 40958.9
(100.00)
38848.77
(100.00)
38379.05
(100.00)
39372.26
(100.00)
Note: *- Transportation and marketing cost may be included.
Note: Figures in brackets are percentage to total cost.
The total variable cost per ha. was marginally higher on the small sample farms in
comparison to medium and large sample farms.
4.2 (b) Cost of cultivation (variable Cost) of Competing Crop-1 (bajra) on Sample
Farms in 2012-13
The per ha. cost of cultivation (variable cost) of bajra crop on the sample farms is estimated
in Table 4.2 (b). This table shows that the per ha. variable cost on an average was worked
out to be Rs 17,290 in bajra crop which was higher being Rs 17,954 on small sample farms
followed by Rs 17,177 and Rs 17,074 on medium and large sample farms respectively.

Among all inputs used, the human labour charge was maximum being Rs 7822 per ha
followed by Rs 5427 on machinery charge. It accounted for 45.24% of total variable costs
of Rs 17,290 followed by 31.39% on machinery charge. The manure and fertilizers
accounted for 9.88% followed by 4.55% and 3.34% for seed and irrigation charge
respectively. It shows that human labour and machine labour were major components of
variable costs in the cultivation of bajra crop on the selected farms in the reference year.
The per ha. variable cost was higher by 4.90% and 4.33% on small sample farms from per
ha. variable cost of Rs 117,074 and 17,177 on large and medium sample farms
respectively. It shows that the variable costs in the cultivation of bajra decreases with
increase in size of farms.
Table 4.2 (b)
Cost of cultivation (Variable cost) of Bajra, sample households, 2012-13
(Rs/ha) Inputs Small Medium Large Overall
1. Human labor
i) Hired 3889.16
(21.66)
5362.10
(31.22)
5031.20
(29.47)
4985.35
(28.83) ii) Family 5038.55
(28.06)
2617.79
(15.24)
1862.97
(10.91)
2836.58
(16.41) 2. Machine labor 5033.98
(28.04)
5078.29
(29.56)
6236.01
(36.52)
5426.97
(31.39) 3. Seed 791.57
(4.41)
827.05
(4.81)
715.01
(4.19)
785.89
(4.55) 4. FYM 424.10
(2.36)
533.45
(3.11)
541.11
(3.17)
515.42
(2.98) 5. Fertilizer 1333.30
(7.43)
1193.42
(6.95)
1108.02
(6.49)
1193.18
(6.90) 6. Plant protection
measures 0.00
(0.00)
4.09
(0.02)
243.00
(1.42)
76.99
(0.44) 7. Irrigation 802.89
(4.47)
625.09
(3.64)
363.99
(2.13)
577.75
(3.34) 8. Interest on
working capital 539.08
(3.00)
487.24
(2.84)
483.03
(2.83)
495.61
(2.87) 9. Misc. expenses* 101.20
(0.57)
448.40
(2.61)
489.80
(2.87)
396.40
(2.29)
Total cost 17953.83
(100.00)
17176.92
(100.00)
17074.14
(100.00)
17290.14
(100.00)
Note: *- Transportation and marketing cost may be included.
Note: Figures in brackets are percentage to total cost.

4.2 (c) Cost of Cultivation (Variable Cost) of Competing crop-II (Maize) on the
Sample farms in 2012-13
Maize is an important competing crop to paddy which is widely grown in the western
districts of U.P. It is a kharif crop and is generally sown in June and July. The per ha. cost
of cultivation (variable Costs) of maize crop on the sample farms is worked out in Table
4.2 (c )
Table 4.2 (C)
Cost of cultivation (Variable cost) of Maize, sample households, 2012-13
(Rs/ha) Inputs Small Medium Large Overall
1. Human labor i) Hired 3478.07
(16.17)
4690.10
(21.94)
4685.71
(23.78)
4283.41
(20.32) ii) Family 5743.42
(26.71)
3838.66
(17.96)
1535.71
(7.79)
4002.94
(18.99) 2. Machine labor 3973.68
(18.47)
4677.32
(21.88)
4571.43
(23.20)
4419.97
(20.97) 3. Seed 2513.82
(11.68)
2346.96
(10.98)
2785.71
(14.13)
2493.02
(11.83) 4. FYM 723.68
(3.37)
945.69
(4.43)
1685.71
(8.55)
1023.49
(4.86) 5. Fertilizer 2607.85
(12.13)
2997.28
(14.02)
2128.57
(10.80)
2688.31
(12.76) 6. Plant protection
measures 501.10
(2.33)
187.60
(0.88)
192.86
(0.98)
293.64
(1.39) 7. Irrigation 1207.02
(5.61)
850.96
(3.98)
928.57
(4.71)
986.12
(4.68) 8. Interest on
working capital 622.46
(2.89)
616.04
(2.88)
555.43
(2.82)
605.73
(2.87) 9. Misc. expenses* 135.09
(0.63)
225.24
(1.05)
637.86
(3.24)
279.88
(1.33)
Total cost 21506.18
(100.00)
21375.85
(100.00)
19707.57
(100.00)
21076.52
(100.00)
Note: *- Transportation and marketing cost may be included.
Note: Figures in brackets are percentage to total cost.
Table 4.2 (c ) shows that on an average variable cost in maize was estimated to Rs 21077
per ha. in reference year. The per ha. variable cost on small sample farms was higher by
8.36% from per ha. variable cost of Rs 19708 on large sample farms. The per ha. variable
cost on medium sample farms was worked out to be 21,376 which was less than Rs 130

from per ha variable cost of Rs 21,506 on small sample farms. It shows that the variable
cost per ha. was more or less similar on small and medium sample farms. Among different
component of inputs costs incurred in cultivation of maize crop on the sample farms, the
human labour charge accounted for maximum share being 39.32% followed by 20.97% of
machine charge. Out of total per ha variable cost of Rs 21,076, the manure and fertilizer
accounted for 17.64% followed by 11.83%, 4.68% and 1.39% for seed irrigation and plant
protection measures respectively. This type of cost structure was witnessed in different size
group of sample farms. It reflects that human labour and machine labour were most
expensive inputs in the cultivation of maize crop. It also reflects that small sample farmers
had incurred more amounts in the cultivation of maize crop than the medium and large
sample farmers in the reference year.
4.2 (d) Cost of Cultivation (Variable Cost) of competing crop-III (Urd) on the Sample
Farms in 2012-13
Urd is the only kharif pulse crop which is competing to paddy in the study areas. The per
ha. cost of cultivation of urd crop on the sample farms is worked out in Table 4.2 (d). It
shows that the average cost of cultivation of urd was estimated at Rs 15,637 per ha which
ranged between Rs 15,196 and Rs 16,946 on medium and small farms respectively. Thus
the per ha. cost of cultivation of urd on the small sample farm was higher by 10.33% and
8.11% than the per ha. of cost of cultivation on medium and large sample farms
respectively.
The reason for higher per ha. cost of cultivation on small farms was due to higher payment
to human labours in comparison to medium and large farms. Out of total per ha. cost of
cultivation of urd at the aggregate level, the human labour accounted for 42.10% followed
by 32.12% for machine labour. The manure and fertilizers accounted for 10.58% of total
per ha. cost of inputs followed by 8.30%, 2.13% and 0.76% for seed irrigation and plant
protection measures respectively. Thus, payment to human labour and machine labour was
maximum across the sample farms. There was marginal difference in cost components in
the cultivation of urd across the sample farms.
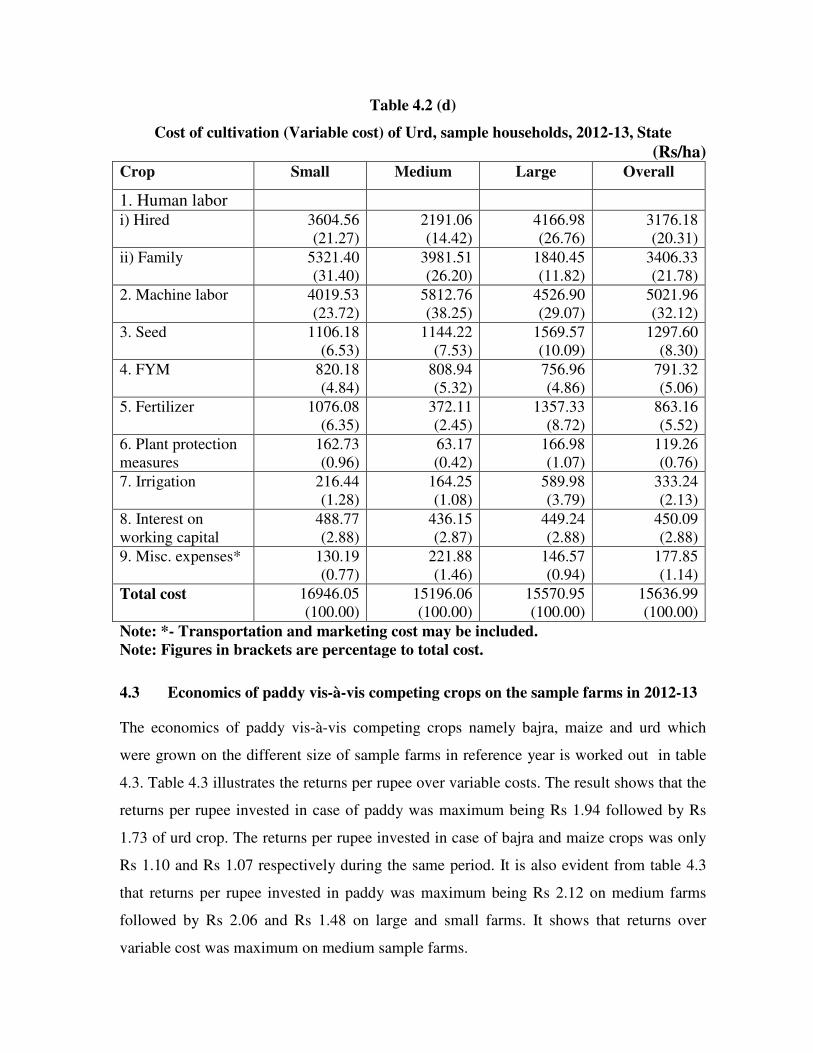
Table 4.2 (d)
Cost of cultivation (Variable cost) of Urd, sample households, 2012-13, State
(Rs/ha) Crop Small Medium Large Overall
1. Human labor i) Hired 3604.56
(21.27)
2191.06
(14.42)
4166.98
(26.76)
3176.18
(20.31)
ii) Family 5321.40
(31.40)
3981.51
(26.20)
1840.45
(11.82)
3406.33
(21.78)
2. Machine labor 4019.53
(23.72)
5812.76
(38.25)
4526.90
(29.07)
5021.96
(32.12)
3. Seed 1106.18
(6.53)
1144.22
(7.53)
1569.57
(10.09)
1297.60
(8.30)
4. FYM 820.18
(4.84)
808.94
(5.32)
756.96
(4.86)
791.32
(5.06)
5. Fertilizer 1076.08
(6.35)
372.11
(2.45)
1357.33
(8.72)
863.16
(5.52)
6. Plant protection
measures
162.73
(0.96)
63.17
(0.42)
166.98
(1.07)
119.26
(0.76)
7. Irrigation 216.44
(1.28)
164.25
(1.08)
589.98
(3.79)
333.24
(2.13)
8. Interest on
working capital
488.77
(2.88)
436.15
(2.87)
449.24
(2.88)
450.09
(2.88)
9. Misc. expenses* 130.19
(0.77)
221.88
(1.46)
146.57
(0.94)
177.85
(1.14)
Total cost 16946.05
(100.00)
15196.06
(100.00)
15570.95
(100.00)
15636.99
(100.00)
Note: *- Transportation and marketing cost may be included.
Note: Figures in brackets are percentage to total cost.
4.3 Economics of paddy vis-à-vis competing crops on the sample farms in 2012-13
The economics of paddy vis-à-vis competing crops namely bajra, maize and urd which
were grown on the different size of sample farms in reference year is worked out in table
4.3. Table 4.3 illustrates the returns per rupee over variable costs. The result shows that the
returns per rupee invested in case of paddy was maximum being Rs 1.94 followed by Rs
1.73 of urd crop. The returns per rupee invested in case of bajra and maize crops was only
Rs 1.10 and Rs 1.07 respectively during the same period. It is also evident from table 4.3
that returns per rupee invested in paddy was maximum being Rs 2.12 on medium farms
followed by Rs 2.06 and Rs 1.48 on large and small farms. It shows that returns over
variable cost was maximum on medium sample farms.

In case of bajra, the returns over variable costs was highest being 1.11 on medium sample
farms followed by Rs 1.09 and Rs 1.08 on small and large size of sample farms
respectively. The maximum returns over variable cost was Rs 1.22 on large size of sample
farms and minimum was 1.001 on small size of sample farms. Hence, it was not much
profitable crop on the sample farms in reference year.
In case of maize Table 4.3 reveals that returns over variable costs was also not gainful
across the size of sample farms The returns on variable costs of maize is worked out to be
Rs 1.01, Rs 1.06 and Rs 1.22 on small, medium and large farms respectively. It shows that
returns on variable costs were more or less same across the size of farm. It is also noticed
from Table 4.3 that returns per rupee invested in Urd crop was higher than that of bajra and
maize due to its higher price than bajra and maize.
The per ha. net income of paddy was Rs 76,254 at the aggregate level which was highest
being Rs 82,394 on medium sample farms followed by Rs 60,761 and Rs 79,062 on small
and large farms respectively. The average yield per ha. was worked out to be Rs 45.72 qtls
which is more or less similar across the sample size of farms. The net income of bajra was
Rs 19,021 at aggregate level which was less than 4 times from the per ha. net income of
paddy. The per ha. yield of bajra was also very much lower than the average yield of
paddy. The per ha net income of maize was also very much below from the net income of
paddy. The average yield per ha. of maize was worked out to be 32.44 qtls against 45.72
qtls per ha. of paddy. It shows that paddy was much profitable than maize on the sample
farms in the reference year. The per ha. net income of urd was estimated at Rs 27,117
against Rs 76,254 per ha. net income of paddy. The over all, per ha. yield of urd was
worked out to be 12.04 qtls which ranged between 11.07 qtls and 12.51 qtls on small and
medium size of sample farms. The above analysis shows that paddy was much more
remunerative crop across the sample size of farms than its competing crops during the
reference year. The higher yield and better market price of paddy were attributed to its
higher net income in comparison to alternative crops viz. bajra, maize, urd in the reference
year. Hence, the paddy is still dominant crop on the sample farms of selected districts of
western region of Uttar Pradesh

Table 4.3
Economics of paddy vis-à-vis competing crops, sample households, 2012-13 (Rs./ha)
Crops Small Medium Large Overall
Paddy
Yield(qtls/ha) 46.49 46.10 4332 45.72
Price(Rs/qtls) 2188 2630 2711 2529
Gross returns 101720 121243 117441 115626
Total Variable cost 40959 38849 38379 39372
Net Income 60761 82394 79062 76254
Returns over variable cost 1.48 2.12 2.06 1.94
Competing crop I Bajra
Yield(qtls/ha) 33.91 32.77 32.47 32.89
Price(Rs/qtls) 1107 1108 1095 1104
Gross returns 37538 36309 35555 36311
Total Variable cost 17954 17176 17074 17290
Net Income 19584 19133 18481 19021
Returns over variable cost 1.09 1.11 1.08 1.10
Competing crop II Maize
Yield(qtls/ha) 31.96 32.64 32.79 32.44
Price(Rs/qtls) 1347 13.47 1336 1345
Gross returns 43050 43966 43807 43632
Total Variable cost 21506 21376 19708 21077
Net Income 21544 22590 24099 22555
Returns over variable cost 1.001 1.06 1.22 1.07
Competing crop III Urd
Yield(qtls/ha) 11.07 12.51 11.95 12.04
Price(Rs/qtls) 3659 3535 3530 3551
Gross returns 40505 44223 42184 42754
Total Variable cost 16946 15196 15571 15637
Net Income 23559 29027 26613 27117
Returns over variable cost 1.39 1.91 1.71 1.73
.

4.4.1. Estimated yield function paddy viz-a viz competing crops, sample households,
2012-13.
The estimated yield function paddy vis-à-vis competing crops on the sample farms are
calculated in Table No. 4.4.1. Table No. 4.4.1 shows that human labour days and machine
hours were much higher in the cultivation of paddy crop than its competing crops across
the size of farms. Over all, 93 days of human labour per ha. were involved in the
cultivation of paddy while it was only 40 days, 42 days and 33 days were involved in the
cultivation of bajra, maize and urd respectively. The machine hours per ha. were more or
less same in paddy, bajra, maize and urd. It ranged between 9.95 and 12 hours per ha in the
cultivation of maize and paddy respectively. The per ha. expenditure on seed of maize was
maximum being Rs 2493 against Rs 2070 of paddy. The per ha. expenditure on seed of
bajra and urd was Rs 786 and Rs 1297 respectively. The per ha expenditure of fertilizers
was maximum being Rs 4582 in paddy crop against Rs 2688, Rs 1193 and Rs 863 in maize,
bajra and urd respectively. The per ha. expenditure on plant protection measures was also
maximum being Rs 712 in paddy against Rs 294, Rs 119 and Rs 77 in maize, urd and bajra
respectively.
The number of irrigation was also much involved in the cultivation of paddy than its
competing crops. The above analysis reflects that per hectare use of human labour days and
machine hours were much higher in paddy crop in comparison to its competing crop on the
sample farms. Apart from this, the per ha. expenditure on fertilizers and plant protection
measures were also costlier in paddy than maize, bajra and urd. It shows that paddy across
the size of sample farms was costlier crop than its competing crops. Next to paddy, maize
was found more expensive crop than bajra and urd on the sample farms.

Table 4.4.1
Estimated yield function paddy vis-à-vis competing crops, sample households, 2012-13
Particulars Small Medium Large Overall
Paddy
Intercept
Human labor (mandays/ha) 94 94 92 93
Machine labor (hours/ha) 14 11 12 12
Expenditure on seed (Rs/ha) 2222 2002 2031 2070
Fertilizer expenses (Rs/ha) 5052 4470 4154 4582
Plant protection expenses (Rs/ha) 688 678 856 712
No. of irrigations 3 3 3 3
R2 0.6476 0.8124 0.8151 0.8595
Σbi 1.1568 1.3151 1.2521 1.1445
Competing crop I (Bajra)
Intercept
Human labor (mandays/ha) 46 40 37 40
Machine labor (hours/ha) 11.59 10.45 11.79 11.07
Expenditure on seed (Rs/ha) 792 827 715 786
Fertilizer expenses (Rs/ha) 1330 11.43 1108 1193
Plant protection expenses (Rs/ha) 00 4 243 77
No. of irrigations 1 1 1 2
R2 0.717 0.7974 0.907 0.195371
Σbi 0.8702 1.028 1.2864 1.24796
Competing crop II (Maize)
Intercept
Human labor (mandays/ha) 48 35 31 42
Machine labor (hours/ha) 10.3 9.38 10.64 9.95
Expenditure on seed (Rs/ha) 2514 2347 2786 2493
Fertilizer expenses (Rs/ha) 2608 2997 2129 2688
Plant protection expenses (Rs/ha) 501 188 193 294
No. of irrigations 1 1 1 1
R2 0.9614 0.94 - 0.85369
Σbi 8.0678 -0.4897 - -0.054538
Competing crop III (Urd)
Intercept
Human labor (mandays/ha) 45 321 31 33
Machine labor (hours/ha) 9.45 11.06 9.50 10.32
Expenditure on seed (Rs/ha) 1106 1144 1570 1297
Fertilizer expenses (Rs/ha) 1076 372 1357 863
Plant protection expenses (Rs/ha) 163 63 167 119
No. of irrigations 0 0 0 0
R2 0.578 0.6802 0.919 0.7906
Σbi 1.06 1.13 -7.0432 0.98535

4.4.2 (a) The Marginal Value Product (MVP) and Marginal Factor Cost (MFC) for
important inputs for Paddy, Sample Farms, 2012-13
The MVP and MFC for important inputs for paddy on the sample farms in reference year
have been worked out through regression coefficient method in Table 4.4.2(a). In order to
show the efficiency of different inputs, the MVPs were also worked out at geometric mean
level. A perusal of table 4.4.2 (a) shows that the MVPs of human labour were higher than
that of other important inputs across the size of farms. This reflects that additional
investment would increase income through rice production. Table shows that MVPs of
inputs for paddy on the sample farms were positive and significant to influence on the
production of paddy. It is also evident from Table that one percent increase in human
labour will result in 1.19% increase in total production of rice keeping other factor constant
at their mean level. Similarly, at aggregate level one per cent increase in machine labour,
fertilizer, seed and pesticides will result in 1.02%, 1.03%, 0.81% and 0.25% in total
production of rice.
The estimates for return to scale were much higher and significantly different from unity
increase of human labour, machine labour and fertilizer, which indicates the increasing
returns to scale. However, the seed pesticides were lower from one, indicating the
decreasing returns to scale. The positive price response was more effective in increasing
the area under rice in comparison to other factors. The yield and price were equivalent
factor to acreage change of rice.
Resource Use Efficiency
The resource use efficiency of cultivation is worked out in Table 4.4.2 (a). Table shows
that ratio of MVPs to MFC for human labour, machine labour and fertilizers were greater
than one on the sample farms. This suggests that there is a scope to increase the gross
return from paddy production by using more human labour, machine labours and fertilizers,
keeping other inputs at their respective geometric mean level of use. It is also evident from
Table that seed and plant production measures were used uneconomically.
Hence it would not be profitable to further increase the use of these factors unless the other
factors of production varied. However, using of additional unit of human labour machine

labour, seed, fertilizer and plant protection chemical could increase the gross return from
paddy in small farm categories. Table also shows that the marginal value product to
marginal factor cost for human labour, machine labour, seed fertilizers pesticides and
irrigation were greater than one on the medium size of farms in reference year. It suggests
that there is a scope to increase the gross returns from paddy production by using the
mentioned inputs. In the large size of sample farms the ratio of MVPs to MFC for human
labour, machine labour, seed, fertilizers, pesticides and irrigation were also greater than
one. Therefore, there is a scope to increase gross return from paddy production by more use
of these inputs. The same result is also noticed on overall farm. Overall, using additional
unit of human labour, machine labour, seed and plant protection chemical could increase
the gross return from the paddy across the size of farms in the study areas.
Table 4.4.2 (a)
The Marginal Value Product (MVP) and Marginal Factor Cost (MFC) of important
inputs for paddy, sample households, 2012-13
Particulars Small Medium Large Overall
Human labor
MVP (Rs.) 1.036207 1.18219 1.247795 1.193749
MFC (Rs.) 1.10545 1.098763 1.217739 1.052496
MVP: MFC 1.066824 1.075928 1.024681 1.134208
Machine labor
MVP (Rs.) 0.88857 0.824872 0.85743 1.01939
MFC (Rs.) 0.735881 0.704212 0.736739 0.852655
MVP: MFC 1.207492 1.17134 1.163818 1.195547
Seed
MVP (Rs.) 0.547796 0.786622 0.967137 0.811071
MFC (Rs.) 0.531429 0.716788 0.834605 0.720106
MVP: MFC 0.970123 1.097427 1.158795 1.126322
Fertilizer
MVP (Rs.) 0.817877 0.921422 1.048807 1.0286054
MFC (Rs.) 0.741767 0.849454 0.946149 0.904832
MVP: MFC 1.102607 1.084723 1.108501 1.136846
Plant protection expenses
MVP (Rs.) 0.214554 0.534942 0.034299 0.258824
MFC (Rs.) 0.337882 0.402147 0.001216 0.226703
MVP: MFC 0.901934 1.330212 28.20425 1.141691
Irrigation
MVP (Rs.) 0.298868 0.38463 0.708156 -0.109124
MFC (Rs.) 0.282594 0.273063 0.662597 -0.082133
MVP: MFC 1.05759 1.408571 1.068758 1.328626

4.4.2 (b) The Marginal Value Product (MVP) and Marginal Factor Cost (MFC) for
important inputs for computing crop-I Bajra, Sample Farms, 2012-13
The MVP and MFC for important inputs for bajra on the sample farms in reference year is
worked out in Table-4.4.2 (b). Table 4.4.2 (b) shows that MVP and MFC of human labour,
machine labour and seed for bajra were positive and significant to influence on the
production of bajra.
The estimate for return to scale were much higher and significantly different farm unity in
case of human labour, machine labour and seed which shows the increasing returns to
scale. The price and yield were major important and significant factors to increase the area
under bajra. It is also evident from Table 4.4.2 (b) that MVP for human labour, machine
labour, seed and fertilizer and irrigation was higher than MFC across the size of farms. The
ratios were also greater than one across the sample farms. Therefore, there is a scope to
increase the gross return from bajra production by more use of these inputs.
Table 4.4.2 (b)
The Marginal Value Product (MVP) and Marginal Factor Cost (MFC) of important
inputs for competing crop I-Bajra, sample households, 2012-13
Particulars Small Medium Large Overall Human labor
MVP (Rs.) 1.023941 0.893758 1.229029 1.290455
MFC (Rs.) 1.023941 0.893758 1.229029 1.045898
MVP: MFC 1.000 1.00 1.00 1.233825
Machine labor
MVP (Rs.) 0.649467 0.885204 0.964739 1.285147
MFC (Rs.) 0.649467 0.885204 0.964739 0.727434
MVP: MFC 1.000 1.00 1.00 1.766685
Seed
MVP (Rs.) 0.741983 0.676458 0.797403 1.253443
MFC (Rs.) 0.741983 0.676458 0.797405 0.850272
MVP: MFC 1.000 1.00 1.00 1.474167
Fertilizer
MVP (Rs.) 0.157121 0.302239 0.316178 0.731263
MFC (Rs.) 0.157121 0.302239 0.316178 0.421272
MVP: MFC 1.000 1.00 1.00 1.735845
Plant protection expenses
MVP (Rs.) 0 0 0 0
MFC (Rs.) 0 0 0 0
MVP: MFC 0 0 0 0
Irrigation
MVP (Rs.) 0.338572 0.533461 0.320902 1.314724
MFC (Rs.) 0.338572 0.533461 0.320902 0.526462
MVP: MFC 1.000 1.00 1.00 2.49728
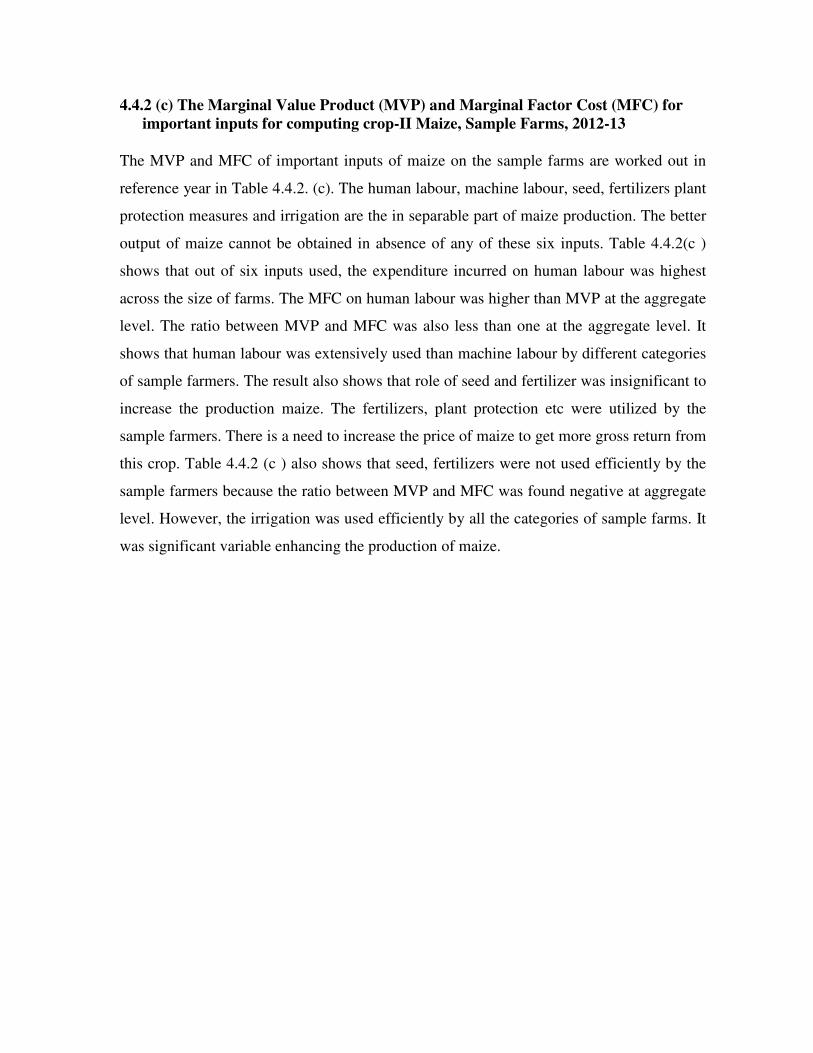
4.4.2 (c) The Marginal Value Product (MVP) and Marginal Factor Cost (MFC) for
important inputs for computing crop-II Maize, Sample Farms, 2012-13
The MVP and MFC of important inputs of maize on the sample farms are worked out in
reference year in Table 4.4.2. (c). The human labour, machine labour, seed, fertilizers plant
protection measures and irrigation are the in separable part of maize production. The better
output of maize cannot be obtained in absence of any of these six inputs. Table 4.4.2(c )
shows that out of six inputs used, the expenditure incurred on human labour was highest
across the size of farms. The MFC on human labour was higher than MVP at the aggregate
level. The ratio between MVP and MFC was also less than one at the aggregate level. It
shows that human labour was extensively used than machine labour by different categories
of sample farmers. The result also shows that role of seed and fertilizer was insignificant to
increase the production maize. The fertilizers, plant protection etc were utilized by the
sample farmers. There is a need to increase the price of maize to get more gross return from
this crop. Table 4.4.2 (c ) also shows that seed, fertilizers were not used efficiently by the
sample farmers because the ratio between MVP and MFC was found negative at aggregate
level. However, the irrigation was used efficiently by all the categories of sample farms. It
was significant variable enhancing the production of maize.

Table 4.4.2 (c)
The Marginal Value Product (MVP) and Marginal Factor Cost (MFC) of important
inputs for competing crop II- Maize, sample households, 2012-13
Particulars Small Medium Large Overall
Human labor MVP (Rs.) 1.17726 0.012281 0.85884 0.374948
MFC (Rs.) 1.14422 0.824478 1.109331 1.205219
MVP: MFC 1.028875 0.014895 0.774197 0.311103
Machine labor
MVP (Rs.) 0.703745 0.066842 0.960564 -0.006194
MFC (Rs.) 0.720191 0.789387 0.824972 0.931872
MVP: MFC 0.977165 0.084676 1.164361 -0.006647
Seed
MVP (Rs.) 0.869072 -0.0288 0.914466 -0.073026
MFC (Rs.) 0.826558 0.836741 0.878404 0.912497
MVP: MFC 1.051435 -0.034419 1.041055 -0.080028
Fertilizer
MVP (Rs.) 0.462023 0.019086 1.065448 -0.156903
MFC (Rs.) 0.496862 0.623568 0.974316 0.660678
MVP: MFC 0.929883 0.030608 1.893534 -0.237488
Plant protection expenses
MVP (Rs.) 0.426131 -0.188557 0.617861 1.68978
MFC (Rs.) 0.389497 0.366349 0.773776 0.32248
MVP: MFC 1.094054 -0.514691 0.798501 5.239948
Irrigation
MVP (Rs.) 0.661436 -0.025173 0.770701 0.116022
MFC (Rs.) 0.674624 0.347212 0.620705 0.700861
MVP: MFC 0.980451 -0.072499 1.241654 0.165542
4.4.2 (d) The Marginal Value Product (MVP) and Marginal Factor Cost (MFC) for
important inputs for computing crop-III Urd, Sample Farms, 2012-13
The MVP and MFC for urd crop on the sample farms in the reference year is worked out in
Table 4.4.2 (d). This table reveals that human and machine labour were intensively used by
sample farmers in the cultivation of urd. On account of this, the ratios between MVP and
MCF was more or less equal to one.
This reflects that the role of human and machine labour was positive and significant to
increase the production of urd on the sample farms. It shows that an increase of these inputs
in the urd would result in more than proportionate increase in total production of urd on the
sample farms. As far as seed of urd is concerned, table shows that MFC was higher than
MVP across the sample farms which shows that production of urd was not upto optimum
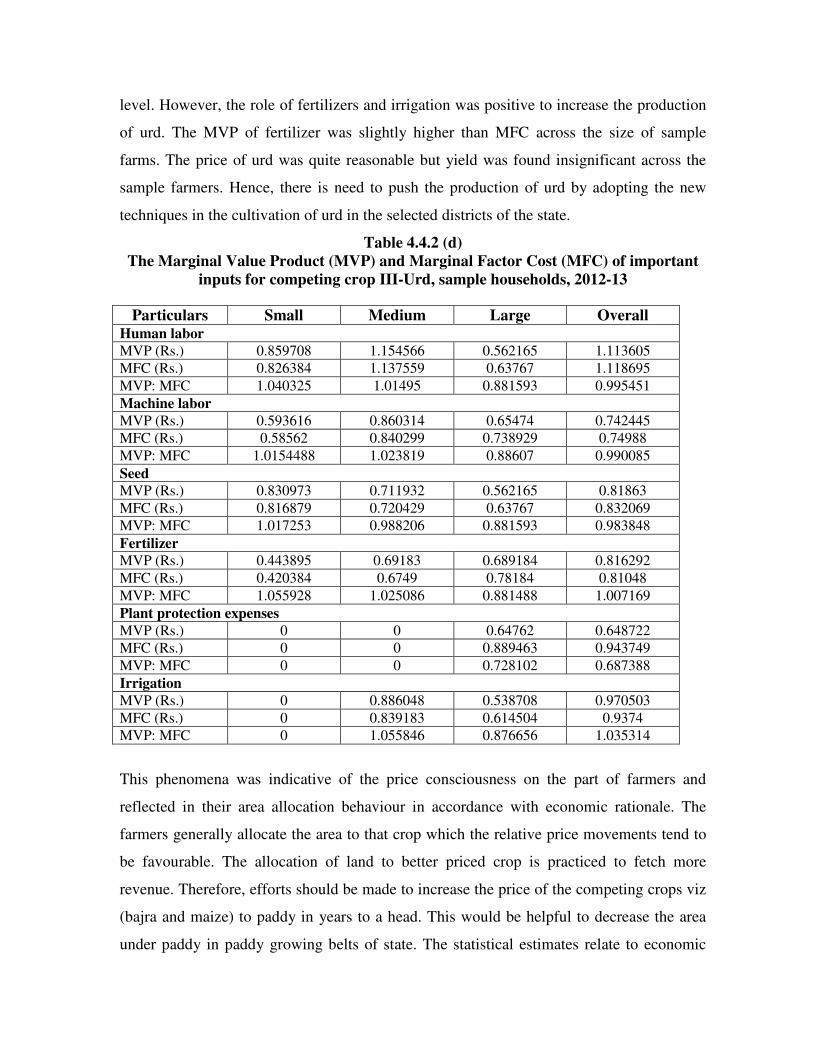
level. However, the role of fertilizers and irrigation was positive to increase the production
of urd. The MVP of fertilizer was slightly higher than MFC across the size of sample
farms. The price of urd was quite reasonable but yield was found insignificant across the
sample farmers. Hence, there is need to push the production of urd by adopting the new
techniques in the cultivation of urd in the selected districts of the state.
Table 4.4.2 (d)
The Marginal Value Product (MVP) and Marginal Factor Cost (MFC) of important
inputs for competing crop III-Urd, sample households, 2012-13
Particulars Small Medium Large Overall Human labor
MVP (Rs.) 0.859708 1.154566 0.562165 1.113605
MFC (Rs.) 0.826384 1.137559 0.63767 1.118695
MVP: MFC 1.040325 1.01495 0.881593 0.995451
Machine labor
MVP (Rs.) 0.593616 0.860314 0.65474 0.742445
MFC (Rs.) 0.58562 0.840299 0.738929 0.74988
MVP: MFC 1.0154488 1.023819 0.88607 0.990085
Seed
MVP (Rs.) 0.830973 0.711932 0.562165 0.81863
MFC (Rs.) 0.816879 0.720429 0.63767 0.832069
MVP: MFC 1.017253 0.988206 0.881593 0.983848
Fertilizer
MVP (Rs.) 0.443895 0.69183 0.689184 0.816292
MFC (Rs.) 0.420384 0.6749 0.78184 0.81048
MVP: MFC 1.055928 1.025086 0.881488 1.007169
Plant protection expenses
MVP (Rs.) 0 0 0.64762 0.648722
MFC (Rs.) 0 0 0.889463 0.943749
MVP: MFC 0 0 0.728102 0.687388
Irrigation
MVP (Rs.) 0 0.886048 0.538708 0.970503
MFC (Rs.) 0 0.839183 0.614504 0.9374
MVP: MFC 0 1.055846 0.876656 1.035314
This phenomena was indicative of the price consciousness on the part of farmers and
reflected in their area allocation behaviour in accordance with economic rationale. The
farmers generally allocate the area to that crop which the relative price movements tend to
be favourable. The allocation of land to better priced crop is practiced to fetch more
revenue. Therefore, efforts should be made to increase the price of the competing crops viz
(bajra and maize) to paddy in years to a head. This would be helpful to decrease the area
under paddy in paddy growing belts of state. The statistical estimates relate to economic

efficiency of resource in farming sector has also been described in nut-shell in following
manner:-
Assessment of Marginal Value Product and Marginal Factor Cost
The statistical estimates relate to economic efficiency of resource use in farming sector
across three groups of farmers (small, medium and large) and across four crops (paddy,
Bajra Maize and Urd . It focuses on the relationship between the respective crop outputs,
the revenue fetched from them and the various inputs used by the farmers, elasticity and
economic efficiency of resource used in production of the crops. The basic concepts
examined statistically are those of Marginal Value Product and Marginal Factor Cost for
each input used in each crop. A Cobb Douglas specification has been used and the data on
variables were transformed into logarithms to make the large number of estimations
required comparable across the crops and across the farmer groups.
The simplified specifications are:
1. For Marginal Value Product: Ri = f(Xi) where R is the revenue obtained from sale
of part of crop (value of retained output is not added) and X is the value or cost of
respective input.
2. For Marginal Factor Cost: Yi = f(Xi) where Y is the respective crop output and X is
the (same) value or cost of respective input.
For example, the estimated equations for Maize crop by Small farmers and Human Labour
Input are:
MVP lnR = -0.6985 + 1.17726 lnH
(-0.5994) (8.7914)
Adjusted R2 = 0.6071 F = 76.7273 n=50
MFC lnY = -2.77142 + 1.14422 lnH
(-3.39512) (12.15392)
Adjusted R2 = 0.7496 F = 147.7177 n=50
Where R is the revenue, H is the cost of human labour and Y is the physical output (kg).
Figures in brackets are the respective t-statistics for the coefficients. More critical to the
estimates is the Ratio MVP/MFC which is 1.02887. However, it may be noted that the null
hypothesis for each coefficient H0 is whether it is =0. More stringent tests will be required
to assess whether a coefficient is = 1 or not. Results are interpreted for the present null
hypothesis.
The above equation can be interpreted as MVP and MFC are significant for Maize Crop of
Small Farmers and the resource human labour is being efficiently used. Such estimates are
obtained for each input (two equations for MVP and MFC) for each farmer groups. A total
of 4 crops (Paddy, Maize, Urd and Bajra), 4 farmer groups (Small, Medium, Large and
Overall) and 6 inputs (Human Labour, Machine Labour, Seed, Fertilizers, Plant Protection
and Irrigation). Besides these, estimates of equations including all inputs are also obtained
for the 4 crops for the Overall (all groups combined) farmers data.
We assess the importance of various inputs for MVP and MFC firstly on the basis of
multiple regression results obtained for all inputs for the overall (total) sample of farmers.
Irrigation is not included in these equations as it is assumed to be made of some
components of human and machine labour only.
Paddy: On the basis of t-statistics of coefficients, the major contributors to revenue (MVP)
for paddy are Human Labour, Machine Labour and Fertilizers. For Cost, (MFC), the
significant inputs are Human Labour, Seed and Fertilizers. The overall results for this
estimation indicate existence of productive efficiency in paddy.
Bajra: For bajra MVP, significant input is only Machine Labour and for MFC, Human
Labour, Machine Labour and Seeds are significant. This may be indicating that
mechanization may be at the cost of human labour. In other words, the terms of trade for
human labour do not seem good in the case of bajra. The ratio (MVP/MFC), however still
indicates productive efficiency. The R2 in case of bajra MVP is also very poor, indicating
that the market terms of trade are good for the farmers but not for human labour which is
insignificant in the MVP equation but not in the MFC equation.
Maize: For the crop of maize, only plant protection and machine labour seem to be
significant contributors to revenue (MVP) while fertilizer shows a negative relationship.
For MFC, the major components of cost are being formed by seed and fertilizers only. The
ratio MVP/MFC is also not significant indicating inefficient use of resources in maize.

Urd: For Urd, significant contributers are the inputs Machine Labour and Seed while major
contributors to cost are again Machine Labour and Seed. The ratio indicates, however that
the resources combinations do maintain productive efficiency.
For closer interpretations, these results may be examined in the light of separate single
variable equations where for each farmer group and each crop, one input is taken at a time.

Overall Paddy all inputs MVP
Regression Statistics
Multiple R 0.927096
R Square 0.859506
Adjusted R Square 0.851613
Standard Error 0.341009
Observations 95
ANOVA df SS MS F Significance F
Regression 5 63.31593 12.66319 108.896 2.19E-36
Residual 89 10.34954 0.116287
Total 94 73.66546
Coefficients Standard
Error t Stat P-value Lower 95%
Upper 95%
Lower 95.0%
Upper 95.0%
Intercept 0.417277 0.573336 0.727804 0.468644 -0.72193 1.556484 -0.72193 1.556484
Hum Lab 0.56336 0.145181 3.880396 0.0002 0.274888 0.851832 0.274888 0.851832
Mach Lab 0.411404 0.106098 3.877597 0.000202 0.20059 0.622218 0.20059 0.622218
Seed 0.030258 0.072695 0.416236 0.678239 -0.11419 0.174702 -0.11419 0.174702
Fert 0.235282 0.105616 2.227723 0.02842 0.025426 0.445139 0.025426 0.445139
-0.09579 0.053069 -1.80493 0.074468 -0.20123 0.009661 -0.20123 0.009661
1.14452 Overall Paddy All Inputs MFC
Regression Statistics Multiple R 0.957162
R Square 0.916158
Adjusted R Square 0.911448 Standard Error 0.224467
Observations 95
ANOVA df SS MS F Significance F
Regression 5 49.00108 9.800216 194.5054 2.54E-46
Residual 89 4.484294 0.050385
Total 94 53.48538
Coefficients Standard
Error t Stat P-value Lower 95% Upper 95%
Lower 95.0%
Upper 95.0%
Intercept -1.16952 0.377395 -3.09894 0.0026 -1.9194 -0.41965 -1.9194 -0.41965
Hum Lab 0.585954 0.095565 6.131507 2.34E-08 0.39607 0.775839 0.39607 0.775839
Mach Lab 0.069691 0.069838 0.997896 0.321035 -0.06908 0.208458 -0.06908 0.208458
Seed 0.134322 0.047851 2.807094 0.006142 0.039243 0.229401 0.039243 0.229401
Fert 0.290198 0.069521 4.174256 6.95E-05 0.152061 0.428334 0.152061 0.428334
-0.06199 0.034932 -1.77451 0.079398 -0.1314 0.007422 -0.1314 0.007422
1.018178
Ratio 1.124086

Overall Bajra all inputs MVP
Regression Statistics
Multiple R 0.442008
R Square 0.195371
Adjusted R Square 0.15067
Standard Error 2.318909
Observations 77
ANOVA df SS MS F Significance F
Regression 4 94.00813 23.50203 4.370571 0.003209
Residual 72 387.1683 5.377337
Total 76 481.1764
Coefficients Standard
Error t Stat P-value Lower 95% Upper 95%
Lower 95.0%
Upper 95.0%
Intercept 3.705033 3.894998 0.951229 0.344671 -4.0595 11.46956 -4.0595 11.46956
Hum Lab -0.57182 0.816344 -0.70047 0.485893 -2.19917 1.055529 -2.19917 1.055529
Mach Lab 1.231758 0.602298 2.045097 0.044501 0.0311 2.432417 0.0311 2.432417
Seed 0.532398 0.557126 0.955615 0.342464 -0.57821 1.643007 -0.57821 1.643007
Fert 0.055631 0.347042 0.1603 0.873094 -0.63618 0.747446 -0.63618 0.747446
1.247965 Overall Bajra All Inputs MFC
Regression Statistics Multiple R 0.933821
R Square 0.872021
Adjusted R Square 0.864911
Standard Error 0.284518
Observations 77
ANOVA df SS MS F Significance F
Regression 4 39.71394 9.928484 122.6485 2.33E-31
Residual 72 5.828451 0.080951
Total 76 45.54239
Coefficients Standard
Error t Stat P-value Lower 95% Upper 95%
Lower 95.0%
Upper 95.0%
Intercept -0.47779 0.477897 -0.99977 0.320769 -1.43046 0.474881 -1.43046 0.474881
Hum Lab 0.454872 0.100161 4.541391 2.19E-05 0.255204 0.654539 0.255204 0.654539
Mach Lab 0.254799 0.073899 3.44794 0.000947 0.107484 0.402114 0.107484 0.402114
Seed 0.410617 0.068357 6.006986 7.04E-08 0.27435 0.546883 0.27435 0.546883
Fert -0.06279 0.04258 -1.47468 0.144657 -0.14767 0.02209 -0.14767 0.02209
1.057495 Ratio 1.180114
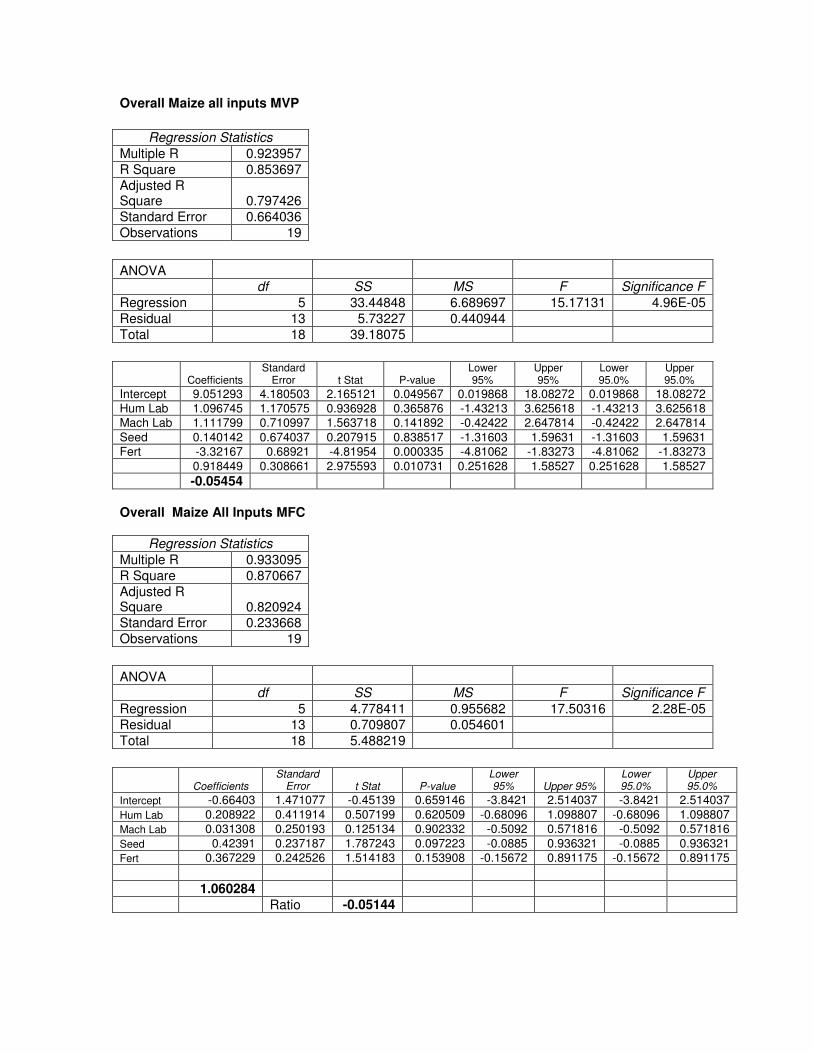
Overall Maize all inputs MVP
Regression Statistics
Multiple R 0.923957
R Square 0.853697
Adjusted R Square 0.797426
Standard Error 0.664036
Observations 19
ANOVA df SS MS F Significance F
Regression 5 33.44848 6.689697 15.17131 4.96E-05
Residual 13 5.73227 0.440944
Total 18 39.18075
Coefficients Standard
Error t Stat P-value Lower 95%
Upper 95%
Lower 95.0%
Upper 95.0%
Intercept 9.051293 4.180503 2.165121 0.049567 0.019868 18.08272 0.019868 18.08272
Hum Lab 1.096745 1.170575 0.936928 0.365876 -1.43213 3.625618 -1.43213 3.625618
Mach Lab 1.111799 0.710997 1.563718 0.141892 -0.42422 2.647814 -0.42422 2.647814
Seed 0.140142 0.674037 0.207915 0.838517 -1.31603 1.59631 -1.31603 1.59631
Fert -3.32167 0.68921 -4.81954 0.000335 -4.81062 -1.83273 -4.81062 -1.83273
0.918449 0.308661 2.975593 0.010731 0.251628 1.58527 0.251628 1.58527
-0.05454 Overall Maize All Inputs MFC
Regression Statistics Multiple R 0.933095
R Square 0.870667
Adjusted R Square 0.820924 Standard Error 0.233668
Observations 19
ANOVA df SS MS F Significance F
Regression 5 4.778411 0.955682 17.50316 2.28E-05
Residual 13 0.709807 0.054601
Total 18 5.488219
Coefficients Standard
Error t Stat P-value Lower 95% Upper 95%
Lower 95.0%
Upper 95.0%
Intercept -0.66403 1.471077 -0.45139 0.659146 -3.8421 2.514037 -3.8421 2.514037
Hum Lab 0.208922 0.411914 0.507199 0.620509 -0.68096 1.098807 -0.68096 1.098807
Mach Lab 0.031308 0.250193 0.125134 0.902332 -0.5092 0.571816 -0.5092 0.571816
Seed 0.42391 0.237187 1.787243 0.097223 -0.0885 0.936321 -0.0885 0.936321
Fert 0.367229 0.242526 1.514183 0.153908 -0.15672 0.891175 -0.15672 0.891175
1.060284
Ratio -0.05144

Overall Urd all inputs MVP
Regression Statistics
Multiple R 0.889191
R Square 0.79066
Adjusted R Square 0.776223
Standard Error 0.478032
Observations 63
ANOVA df SS MS F Significance F
Regression 4 50.0587 12.51467 54.76541 4.83E-19
Residual 58 13.25382 0.228514
Total 62 63.31252
Coefficients Standard
Error t Stat P-value Lower 95%
Upper 95%
Lower 95.0%
Upper 95.0%
Intercept 2.907174 0.925482 3.141254 0.002648 1.05462 4.759729 1.05462 4.759729
Hum Lab 0.133504 0.202606 0.658936 0.512545 -0.27206 0.539063 -0.27206 0.539063
Mach Lab 0.277261 0.093422 2.967824 0.004353 0.090256 0.464266 0.090256 0.464266
Seed 0.538196 0.123039 4.374171 5.14E-05 0.291905 0.784486 0.291905 0.784486
Fert 0.036388 0.138301 0.263109 0.793399 -0.24045 0.313227 -0.24045 0.313227
Overall Urd All Inputs MFC
Regression Statistics Multiple R 0.912933
R Square 0.833446
Adjusted R Square 0.82196
Standard Error 0.417982
Observations 63
ANOVA df SS MS F Significance F
Regression 4 50.70691 12.67673 72.55903 6.7E-22
Residual 58 10.13313 0.174709
Total 62 60.84004
Coefficients Standard
Error t Stat P-value Lower 95% Upper 95%
Lower 95.0%
Upper 95.0%
Intercept -0.55487 0.809225 -0.68568 0.495648 -2.17471 1.064971 -2.17471 1.064971
Hum Lab 0.120166 0.177155 0.678309 0.500273 -0.23445 0.474779 -0.23445 0.474779
Mach Lab 0.280379 0.081687 3.432369 0.00111 0.116865 0.443893 0.116865 0.443893
Seed 0.578319 0.107583 5.375539 1.42E-06 0.362968 0.793671 0.362968 0.793671
Fert 0.001367 0.120928 0.011302 0.991022 -0.2407 0.24343 -0.2407 0.24343
0.98023 Ratio 1.005221

CHAPTER-5
Constraints/Potentials Analysis for Various Alternative Crops
An attempt has been made in this chapter to know the constraints/potential in the
cultivation of paddy and its competing crops viz bajra, maize and urd. The views and
opinions of sample farmers had been collected with regard to constraints and potential in
the cultivation of paddy, bajra, maize and urd. It has already mentioned in first chapter of
this report that 210 sample farmers were exclusively paddy growers. Among them, 46.19%,
40.96% and 38.09% were also bajra, maize and urd growers respectively. The views and
opinions of sample growers have been analyzed properly in different tables. The ranks have
been given to each reason in order of their importance.
5.1.1 (a) Reasons for attraction to paddy cultivation on the sample farms, 2012-13
The reasons for attraction to paddy as revealed by sample farmers are analyzed in Table
5.1.1 (a). Table shows that attractive price of paddy in markets followed by suitable soil,
efforts of government and suitable climatic conditions were most important factors to
attract the sample farmers to devote maximum area under paddy crop. However, the sample
farmers have also given least important rank to residue use as fodder. This type of opinion
had been narrated by different categories of sample farmers.

Table 5.1.1 (a)
Reasons for attraction to paddy as revealed by farmers, sample farms, 2012-13
(% multiple response) Small Medium Large Overall Reason
1 2 3 1 2 3 1 2 3 1 2 3 Well adapted to
the climatic
conditions
(rainfall etc.)
18.52 4.63 4.63 16.67 17.78 16.67 0 0 0 16.67 10.00 9.52
Well adapted to
the soil type
27.78 27.78 27.78 22.22 20.00 16.67 0 0 8.33 23.81 22.86 21.91
Fetches an
attractive price in
the market
32.41 19.44 19.44 33.33 31.11 16.66 50.00 33.33 41.67 33.81 25.24 19.52
Government
stimulates its
growing
18.52 13.89 11.11 20.00 17.78 22.22 33.33 41.67 25.00 20.00 17.14 16.67
Fits well into
overall cropping
pattern
0 6.48 9.26 0 3.33 5.56 0 0 0 0 4.76 7.14
It allows for
multiple picking
0 0 0 0 0 0 0 0 0 0 0 0
The residue can
be used as fodder
2.77 27.78 27.78 7.78 10.00 22.22 16.67 25.00 25.00 5.71 20.00 25.24
Any other - - - - - - - - - - - -
Note: Ranks are in order of importance from 1 (most important), 2 ( important), to 3
(least important)
5.1.1 (b) Reasons for attraction to competing Crop-I (bajra) on the sample farms in
reference year
The reasons for attraction to bajra crop as revealed by sample farmers on their farms during
reference year have been analysed in Table 5.1.1(b). The percentage of multiple response
of sample of bajra growers have been worked out in Table 5.1.1 (b). Table reveals that
suitable soil and attractive price in the markets were most important reasons for attraction
to bajra crop on the sample farms. The climatic conditions (rainfall etc.) were least
important reasons for attraction to bajra as have been revealed by majority of sample
growers of bajra. These reasons for attraction to bajra were also witnessed across the size
of sample farms.

Table 5.1.1 (b)
Reasons for attraction to competing crop I (Bajra) as revealed by farmers, sample
farms, 2012-13
(% multiple response) Small Medium Large Overall Reason
1 2 3 1 2 3 1 2 3 1 2 3 Well adapted to
the climatic
conditions
(rainfall etc.)
12.50 15.00 12.50 11.11 11.11 13.33 16.67 8.33 8.33 12.37 12.37 12.37
Well adapted to
the soil type
27.50 22.50 20.00 26.67 22.25 17.78 41.67 33.33 25.00 28.87 23.71 20.62
Fetches an
attractive price
in the market
25.00 20.00 20.00 24.45 22.22 20.00 16.67 33.34 33.34 23.71 22.69 21.65
Government
stimulates its
growing
25.00 15.00 20.00 22.22 17.77 20.00 16.66 8.33 16.67 22.69 15.46 18.56
Fits well into
overall cropping
pattern
10.00 12.50 12.50 11.11 8.88 13.33 8.33 8.34 8.33 10.30 10.31 12.37
It allows for
multiple picking
0 0 0 0 0 0 0 0 0 0 0 0
The residue can
be used as
fodder
0 15.00 15.00 4.44 17.77 15.56 0 8.33 8.33 2.06 15.46 14.43
Any other 0 0 0 0 0 0 0 0 0 0 0 0
Note: Ranks are in order of importance from 1 (most important), 2 ( important), to 3
(least important)
5.1.1 (C) Reasons for attraction to competing Crop II (Maize) on the sample farms in
reference year.
The percentage of multiple responses of sample growers of maize with regard to reasons
for attraction to maize are presented in Table 5.1.1 (c). Table reveals that climatic
conditions and suitable soil were most important reasons for the attraction to maize on
sample farms. Apart from these, out of total sample growers of maize, 12.79% and 11.63%
growers had expressed their views in favour of government support and attractive price in
the markets respectively for attraction to maize on the sample farms.

Table 5.1.1 (c)
Reasons for attraction to competing crop II (Maize) as revealed by farmers, sample
farms, 2012-13
(% multiple response) Small Medium Large Overall Reason
1 2 3 1 2 3 1 2 3 1 2 3 Well adapted to
the climatic
conditions
(rainfall etc.)
23.53 19.61 11.76 20.00 20.00 26.67 20.00 40.00 40.00 22.09 20.93 18.60
Well adapted to
the soil type
35.30 17.65 15.69 13.33 6.67 13.33 40.00 20.00 20.00 27.91 13.95 15.12
Fetches an
attractive price
in the market
11.77 7.84 11.76 13.33 6.67 13.33 0 0 0 11.63 6.98 11.63
Government
stimulates its
growing
7.84 15.69 13.73 16.67 23.33 13.33 40.00 40.00 40.00 12.79 19.77 15.12
Fits well into
overall cropping
pattern
7.84 13.73 13.73 13.33 16.67 6.67 0 0 0 9.30 13.95 10.46
It allows for
multiple picking
3.92 11.76 13.72 10.00 16.66 16.67 0 0 0 5.81 12.79 13.95
The residue can
be used as
fodder
9.80 13.72 19.61 13.34 10.00 10.00 0 0 0 10.47 11.63 15.12
Any other 0 0 0 0 0 0 0 0 0 0 0 0
Note: Ranks are in order of importance from 1 (most important), 2 ( important), to 3
(least important)
5.1.1 (d) Reasons for Attraction to Competing Crop III (Urd) on the Sample
Farms
The reasons for attraction to urd crop as had been perceived by the sample growers are
illustrated in Table 5.1.1 (d). Table reveals that the attractive price in the marketed
followed by suitable soil were most important reasons for attraction to urd on the sample
farms during the reference year. Of the total sample growers of urd, 23.75% sample
growers had also given most important reason of government efforts for attraction to urd
crop on the sample farms. These types of reasons for attraction to urd crop were also
witnessed across the sample size of farms.

Table 5.1.1 (d)
Reasons for attraction to competing crop III (Urd) as revealed by farmers, sample
farms, 2012-13
(% multiple response)
Small Medium Large Overall Reason
1 2 3 1 2 3 1 2 3 1 2 3 Well adapted to
the climatic
conditions
(rainfall etc.)
0 0 0 0 0 0 0 0 0 0 0 0
Well adapted to
the soil type
31.25 40.63 28.13 27.78 41.67 33.33 25.00 41.67 25.00 28.75 41.25 30.00
Fetches an
attractive price
in the market
46.88 37.50 25.00 38.89 13.89 27.78 50.00 33.33 25.00 43.75 26.25 26.25
Government
stimulates its
growing
21.87 12.50 25.00 27.77 33.33 22.22 16.67 16.67 25.00 23.75 22.50 26.25
Fits well into
overall cropping
pattern
0 9.37 21.87 5.56 11.11 16.67 8.33 8.33 25.00 3.75 10.00 17.50
It allows for
multiple picking
0 0 0 0 0 0 0 0 0 0 0 0
The residue can
be used as
fodder
0 0 0 0 0 0 0 0 0 0 0 0
Any other 0 0 0 0 0 0 0 0 0 0 0 0
Note: Ranks are in order of importance from 1 (most important), 2 ( important), to 3
(least important)
5.1.2 (a) Main Problems faced during Production of Paddy as revealed by
Sample Farmers in 2012-13
The percentage of multiple responses of sample farmers with regard to main problem faced
during the production of paddy in the reference year are presented in Table5.1.2 (a) Table
5.1. 2(a) shows that out of total small sample of growers, 62% had revealed that marketing
of paddy was most important problem while 27.18% had treated it as important problem.
The environmental problems were treated important as had been revealed by 33.33% of
small sample farmers. The 50% of large sample farmers had also revealed that the
marketing was most important constraints in the production of paddy on their farms during

the reference year. The marketing problem was also most important constraints in the
cultivation of paddy across different categories of sample farms during 2012-13. The
diseases, pest/insects and weeds were least important problems in the cultivation of paddy
across the sample size of farms during reference years.
Table 5.1.2 (a)
Main problems faced during production of paddy as revealed by farmers, sample farms, 2012-13
(% multiple response)
Small Medium Large Overall Reason
1 2 3 1 2 3 1 2 3 1 2 3 Diseases 7.41 6.48 6.48 3.33 4.44 5.56 8.33 0 0 5.71 5.24 5.71
Insects/ pests 0 0 0 0 0 0 0 0 0 0 0 0
Weeds 9.26 9.26 18.52 10.00 22.22 13.33 8.33 16.67 25.00 9.52 15.24 16.67
Environmental
problems (drought,
waterlogging, high
temperature etc.)
9.26 33.33 28.70 20.00 24.45 30.00 16.67 25.00 25.00 14.29 29.05 29.05
Non-availability of
inputs (seeds,
fertilizer,chemicals
labour, credit etc.)
11.11 23.15 37.04 13.33 26.67 26.67 16.67 25.00 33.33 12.38 24.76 32.38
Marketing
problems (storage,
prices, information,
transport, demand
etc.)
62.96 27.78 9.26 53.34 22.22 24.44 50.00 33.33 16.67 58.10 25.71 16.19
Any other 0 0 0 0 0 0 0 0 0 0 0 0
Note: Ranks are in order of importance from 1 (most important), 2 ( important), to 3
(least important)
5.1.2 (b) Main problems faced during production of bajra as revealed by the
sample growers of bajra in 2012-13
The percentage multiple responses of sample growers of bajra in context to main problems
faced during production of bajra in the reference year are presented in Table 5.1.2 (b).
Table 5.1.2 (b) reveals that 42.26% of total 97 bajra growers of different categories of
farms had revealed that marketing problems were most important Constraints in the
cultivation of bajra on their farms during the reference year. Apart from this, weeds and
environment were also most important problems in the cultivation of bajra in the reference
year. These were also witnessed as most important problems across the size of sample
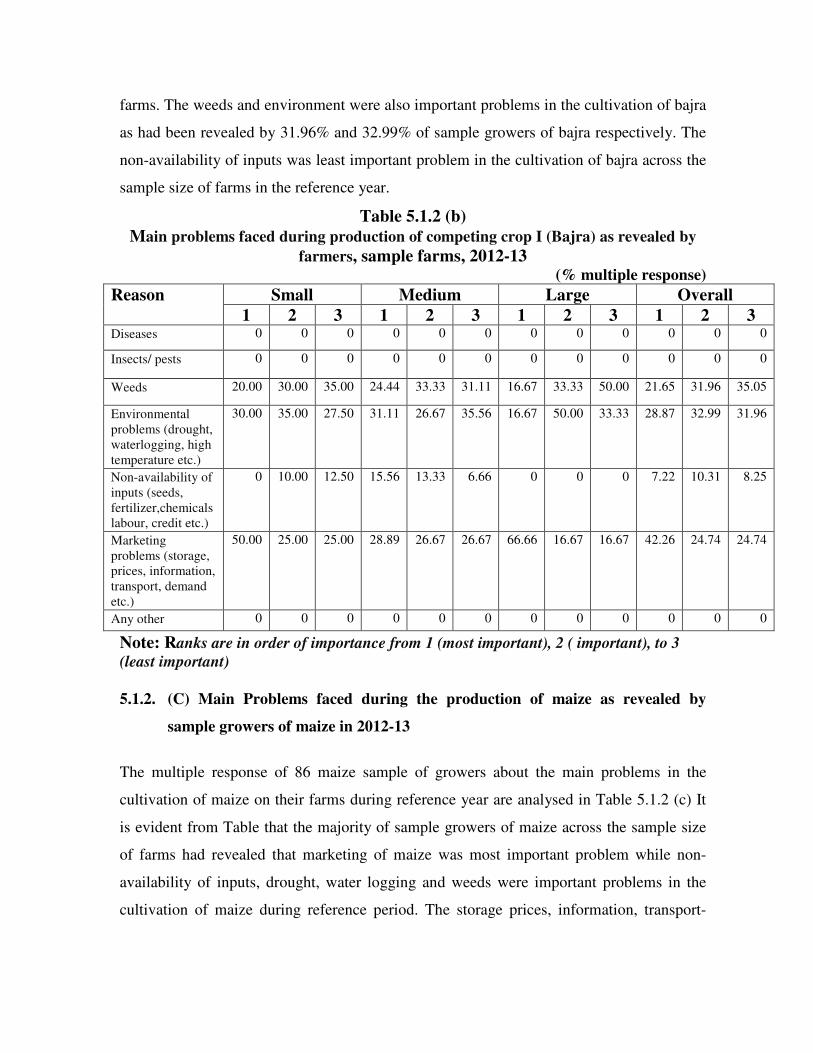
farms. The weeds and environment were also important problems in the cultivation of bajra
as had been revealed by 31.96% and 32.99% of sample growers of bajra respectively. The
non-availability of inputs was least important problem in the cultivation of bajra across the
sample size of farms in the reference year.
Table 5.1.2 (b)
Main problems faced during production of competing crop I (Bajra) as revealed by
farmers, sample farms, 2012-13 (% multiple response)
Small Medium Large Overall Reason
1 2 3 1 2 3 1 2 3 1 2 3 Diseases 0 0 0 0 0 0 0 0 0 0 0 0
Insects/ pests 0 0 0 0 0 0 0 0 0 0 0 0
Weeds 20.00 30.00 35.00 24.44 33.33 31.11 16.67 33.33 50.00 21.65 31.96 35.05
Environmental
problems (drought,
waterlogging, high
temperature etc.)
30.00 35.00 27.50 31.11 26.67 35.56 16.67 50.00 33.33 28.87 32.99 31.96
Non-availability of
inputs (seeds,
fertilizer,chemicals
labour, credit etc.)
0 10.00 12.50 15.56 13.33 6.66 0 0 0 7.22 10.31 8.25
Marketing
problems (storage,
prices, information,
transport, demand
etc.)
50.00 25.00 25.00 28.89 26.67 26.67 66.66 16.67 16.67 42.26 24.74 24.74
Any other 0 0 0 0 0 0 0 0 0 0 0 0
Note: Ranks are in order of importance from 1 (most important), 2 ( important), to 3
(least important)
5.1.2. (C) Main Problems faced during the production of maize as revealed by
sample growers of maize in 2012-13
The multiple response of 86 maize sample of growers about the main problems in the
cultivation of maize on their farms during reference year are analysed in Table 5.1.2 (c) It
is evident from Table that the majority of sample growers of maize across the sample size
of farms had revealed that marketing of maize was most important problem while non-
availability of inputs, drought, water logging and weeds were important problems in the
cultivation of maize during reference period. The storage prices, information, transport-

demand etc are witnessed to be most important constraints for all categories of sample
farms as more than 50 of sample farmers had revealed during the survey of the study.
Table 5.1.2 (c)
Main problems faced during production of competing crop II (Maize) as revealed by
farmers, sample farms, 2012-13 (% multiple response)
Small Medium Large Overall Reason
1 2 3 1 2 3 1 2 3 1 2 3 Diseases 0 0 0 3.33 6.67 0 0 0 0 1.16 2.23 0
Insects/ pests 0 0 00 0 0 0 0 0 0 0 0 0
Weeds 11.76 19.61 35.29 16.67 13.33 20.00 20.00 40.00 40.00 13.95 18.60 30.23
Environmental
problems (drought,
waterlogging, high
temperature etc.)
11.77 31.37 19.61 16.67 33.33 40.00 20.00 20.00 20.00 13.96 31.39 26.74
Non-availability of
inputs (seeds,
fertilizer,chemicals
labour, credit etc.)
9.80 29.41 31.37 20.00 26.67 20.00 0 20.00 20.00 12.79 27.91 26.75
Marketing
problems (storage,
prices, information,
transport, demand
etc.)
66.67 19.61 13.73 43.33 20.00 20.00 60.00 20.00 20.00 58.14 19.77 16.28
Any other 0 0 0 0 0 0 0 0 0 0 0 0
Note: Ranks are in order of importance from 1 (most important), 2 ( important), to 3
(least important)
5.1.2 (d) Main problems faced during the production of urd as revealed by the sample
growers of urd in 2012-13
The multiple response of 80 sample growers of urd about main problems in the cultivation
of urd on their farms during reference year are analysed in Table 5.1.2 (d). Table5.1.2 (d)
shows that about 62% and 50% of small and large ample farmers respectively had revealed
that marketing of urd was most important problem in the cultivation of urd on their farms
during the reference year. However, about 38% medium sample growers of urd had
revealed that environment and marketing were most important hurdle in way of proper
cultivation of urd on their farms during reference year. The weeds were also important
problems as had been faced by sample growers during the cultivation of urd on their farms.

Non availability of inputs was not considered as any problem. In case of diseases and
insects/pests about 96% of respondents were in the opinion that diseases and insects/pests
factors were no constraint in the urd cultivation.
Table 5.1.2 (d)
Main problems faced during production of competing crop III (Urd) as revealed by
farmers, sample farms, 2012-13 (% multiple response)
Small Medium Large Overall Reason
1 2 3 1 2 3 1 2 3 1 2 3 Diseases 0 0 0 0 0 8.33 0 0 0 0 0 3.75
Insects/ pests 0 0 0 0 0 0 0 0 0 0 0 0
Weeds 75.00 37.50 31.25 22.22 41.67 27.78 25.00 25.00 50.00 23.75 37.50 32.50
Environmental
problems (drought,
waterlogging, high
temperature etc.)
12.50 31.25 31.25 38.89 25.00 36.11 25.00 50.00 25.00 26.25 31.25 32.50
Non-availability of
inputs (seeds,
fertilizer,chemicals
labour, credit etc.)
62.50 31.25 37.50 38.89 33.33 27.78 50.00 25.00 25.00 50.00 50.00 31.25
Marketing
problems (storage,
prices, information,
transport, demand
etc.)
0 0 0 0 0 0 0 0 0 0 0 0
Any other 0 0 0 0 0 0 0 0 0 0 0 0
Note: Ranks are in order of importance from 1 (most important), 2 ( important), to 3
(least important)
5.1.3.1.(a) Problems of Diseases faced during rice production as revealed by
farmers, sample farms, 2012-13
The details of problems of diseases faced during rice production cycle on sample farms are
presented in Table 5.1.3.1. (a). The blast, foot rot, bacterial leaf spot, anthracnose, pod rot
etc. are major diseases of paddy. Among these, the blast, anthracnose and pod rot did not
occur during the last rice production cycle. However, bacterial leaf spot and pod rot
occurred during the last rice production cycle as had been reported by sample growers.
These diseases had produced slight problem. On account of this, only 0.80% and 0.85%
yield loss was occurred due to attack by foot rot and pod rot respectively. None of
mentioned diseases had created sever problem and very sever problems during last rice
production cycle on the sample farms.

Table 5.1.3.1 (a)
Problems of Diseases faced during basmati rice production as revealed by farmers, sample farms, 2012-13
(% multiple response)
Small Medium Large Overall Particulars
1 2 3 4 Y 1 2 3 4 Y 1 2 3 4 Y 1 2 3 4 Y Blast - - - - - - - - - - - - - - - - - - - -
Foot rot 97.22 2.78 - - 1.50 95.56 4.44 - - 1.00 1.00 - - - - 96.67 3.33 - - 0.80
Bacterial-
leaf spot
- - - - - - - - - - - - - - - - - - - -
Anthrac-
nose
- - - - - - - - - - - - - - - - - - - -
Pod Rot 93.52 6.48 - - 1.00 95.56 4.44 - - 1.00 1.00 - - - - 94.76 5.24 - - 0.85
Any other - - - - - - - - - - - - - - - - - - - -
Note: Ranks are in order of importance from 1 (No problem), 2 (slight problem), 3 (moderate problem), to 4 (severe problem) Y means Per cent yield loss.

5.1.3.1.(b) Problems of Insects/Pests faced during rice production as revealed by
farmers, sample farms 2012-13
The details of problems faced insects and pests during last rice production cycle on the
sample farms are reported in table 5.1.3.1.(b). Table 5.1.3.1(b) shows that rice hispa and
hairy caterpillar did not occur during last rice production cycle on the sample farms.
However, white fly, stem borer and leaf folder occurred during last rice production cycle on
the sample farms as had been revealed by 3.81%, 9.71% and 7.62% respectively. These had
produced only slight problem. On account of this, only 2.50%, 1.90% and 2.00% yield loss
occurred due to attack of white fly, stem borer and leaf folder respectively.
5.1.3.1.(C) Problems of Weeds faced during rice production as revealed by farmers,
sample farms 2012-13
Since, rice is generally transplanted in rainy season, therefore, the possibility of germination
of weeds in the field of rice is very high. The ltsit, mathana, bhakhra, motha, grass etc. are
important weeds in the fields of paddy. Among these, Motha and grass are much visible in
the fields of paddy. The position of problems of different types of weeds faced during last
rice production cycle on the sample farms are shown in table 5.1.3.1.(C). Table shows that
ltsit, mathana and bhakhra weeds did not occur during last rice production cycle while motha
and grass occurred during last rice production cycle on the sample farms as have been
reported by 18.10% and 18.57% of sample farmers. The impact of occurrence of motha and
grass was slight on the production of rice. The yield loss in paddy was reported 2.00% and
2.00% due to occurrence of motha and grass respectively on the sample farms.

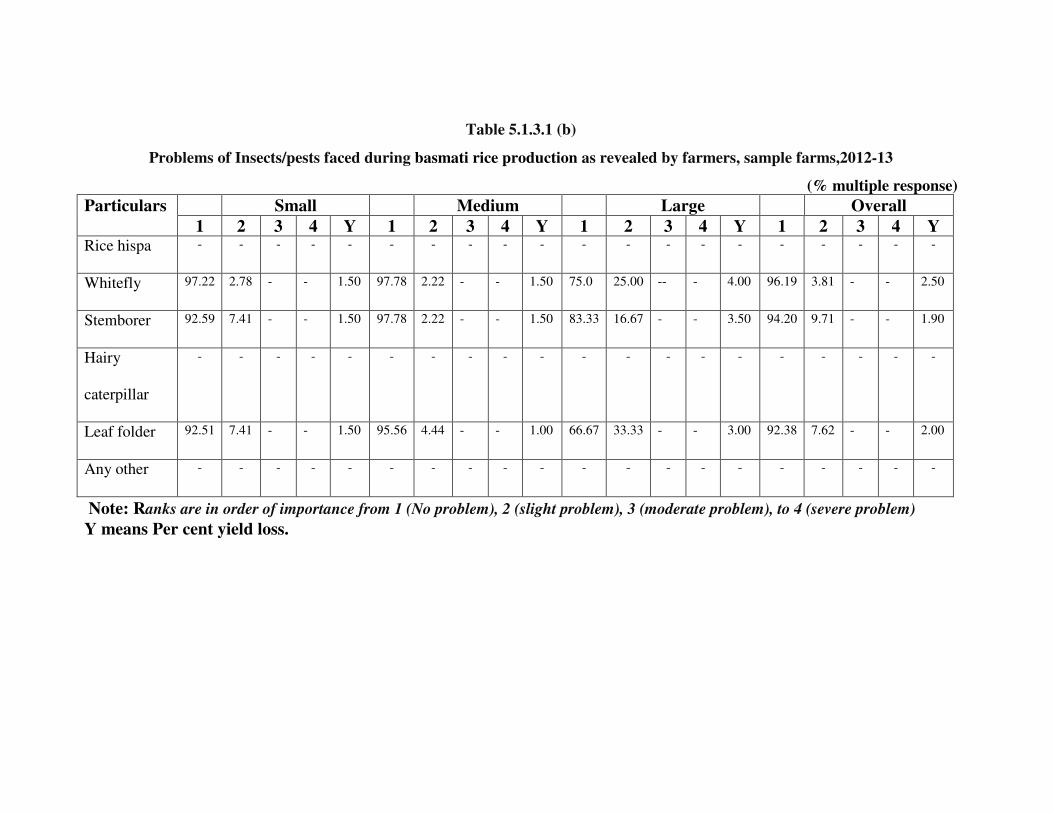
Table 5.1.3.1 (b)
Problems of Insects/pests faced during basmati rice production as revealed by farmers, sample farms,2012-13
(% multiple response)
Small Medium Large Overall Particulars
1 2 3 4 Y 1 2 3 4 Y 1 2 3 4 Y 1 2 3 4 Y Rice hispa - - - - - - - - - - - - - - - - - - - -
Whitefly 97.22 2.78 - - 1.50 97.78 2.22 - - 1.50 75.0 25.00 -- - 4.00 96.19 3.81 - - 2.50
Stemborer 92.59 7.41 - - 1.50 97.78 2.22 - - 1.50 83.33 16.67 - - 3.50 94.20 9.71 - - 1.90
Hairy
caterpillar
- - - - - - - - - - - - - - - - - - - -
Leaf folder 92.51 7.41 - - 1.50 95.56 4.44 - - 1.00 66.67 33.33 - - 3.00 92.38 7.62 - - 2.00
Any other - - - - - - - - - - - - - - - - - - - -
Note: Ranks are in order of importance from 1 (No problem), 2 (slight problem), 3 (moderate problem), to 4 (severe problem)
Y means Per cent yield loss.

Table 5.1.3.1 (c)
Problems of weeds faced during basmati rice production as revealed by farmers, sample farms, 2012-13
(% multiple response)
Small Medium Large Overall Particulars
1 2 3 4 Y 1 2 3 4 Y 1 2 3 4 Y 1 2 3 4 Y Itsit - - - - - - - - - - - - - - - - - - - -
Mathana - - - - - - - - - - - - - - - - - - - -
Bhakhra - - - - - - - - - - - - - - - - - - - -
Motha 83.33 16.67 - - 2.00 83.33 16.67 - - 2.50 38.33 41.67 - - 1.00 81.90 18.10 - - 2.00
Grass 83.33 16.67 - - 2.00 83.33 16.67 - - 2.50 50.00 50.00 - - 1.00 81.43 18.57 - - 2.00
Sonfa - - - - - - - - - - - - - - - - - - - -
Any other - - - - - - - - - - - - - - - - - - - -
Note: Ranks are in order of importance from 1 (No problem), 2 (slight problem), 3 (moderate problem), to 4 (severe problem)
Y means Per cent yield loss.

5.1.3.2.(a) Problems of Diseases faced during bajra production as revealed by
farmers, sample farms 2012-13
The powdery mildew, grain smut, ergot, late blight, pod rot etc are major diseases of bajra.
Among these diseases, grain smut and late blight are much common in the study areas. The
views of the respondents about the diseases presented a problem in last bajra production
cycle are shown in Table 5.1.3.2.(a). Table shows that 13.40% of sample growers had
reported that occurrence of grain smut was slight during last bajra production cycle, while
16.49% sample growers had reported that occurrence of late blight was not serious. On
account of this, 0.80% yield loss was occurred due to attack of grain smut while 0.80%, yield
loss occurred due to late blight disease.
5.1.3.2.(b) Problems of Insects/Pests faced during bajra production as revealed by
farmers, sample farms 2012-13
The problem of insects and pests faced during last bajra production cycle as had been
reported by sample growers are shown in table 5.1.3.2.(b). Table shows that root bug, hairy
cater pillar, maize borer and leaf folder did not attack during the last production cycle of
bajra. The occurrence of grass hopper had presented sight problem. On account of this,
1.20% loss in yield of bajra occurred
5.1.3.2.(C) Problems of weeds faced during bajra production as revealed by farmers,
sample farms 2012-13
The details of problems of weeds faced during last bajra production cycle on the sample
farms are presented in table 5.1.3.2.(c ). This table reveals that, among the weeds, grass and
motha had germinated during the last bajra production cycle on the sample farms. On
account of this, 2.00% loss occurred in the yield of bajra as had been reported by 37.17%
of sample farmers.


Table 5.1.3.2 (a)
Problems of Diseases faced during bajra production as revealed by farmers, sample farms, 2012-13
(% multiple response)
Small Medium Large Overall Particulars
1 2 3 4 Y 1 2 3 4 Y 1 2 3 4 Y 1 2 3 4 Y Powdery
mildew
- - - - - - - - - - - - - - - - - - - -
Grain smut 87.50 12.50 - - 1.00 88.89 11.11 - - 1.00 75.00 25.00 - - 1.00 86.60 13.40 - - 0.80
Ergot - - - - - - - - - - - - - - - - - - - -
Late blight 80.00 20.00 - - 1.00 88.89 11.11 - - 1.00 75.00 25.00 - - 1.00 83.51 16.49 - - 0.80
Pod Rot - - - - - - - - - - - - - - - - - - - -
Any other - - - - - - - - - - - - - - - - - - - -
Note: Ranks are in order of importance from 1 (No problem), 2 (slight problem), 3 (moderate problem), to 4 (severe problem)
Y means Per cent yield loss.

Table 5.1.3.2 (b)
Problems of Insects/pests faced during bajra production as revealed by farmers, sample farms, 2012-13
(% multiple response)
Small Medium Large Overall Particulars
1 2 3 4 Y 1 2 3 4 Y 1 2 3 4 Y 1 2 3 4 Y Root bug - - - - - - - - - - - - - - - - - - - -
Grass hopper 75.00 25.00 - - 2.00 82.22 17.78 - - 3.00 1.00 - - - - 81.44 18.56 - - 1.20
Maize borer - - - - - - - - - - - - - - - - - - - -
Hairy
caterpillar
- - - - - - - - - - - - - - - - - - - -
Leaf folder - - - - - - - - - - - - - - - - - - - -
Any other - - - - - - - - - - - - - - - - - - - -
Note: Ranks are in order of importance from 1 (No problem), 2 (slight problem), 3 (moderate problem), to 4 (severe problem)
Y means Per cent yield loss.

Table 5.1.3.2 (c)
Problems of weeds faced during bajra production as revealed by farmers, sample farms, 2012-13
(% multiple response)
Small Medium Large Overall Particulars
1 2 3 4 Y 1 2 3 4 Y 1 2 3 4 Y 1 2 3 4 Y Itsit - - - - - - - - - - - - - - - - - - - -
Mathana - - - - - - - - - - - - - - - - - - - -
Bhakhra - - - - - - - - - - - - - - - - - - - -
Motha 90.00 10.00 - - 1.00 82.22 17.78 - - 1.00 66.67 33.33 - - 1.00 83.51 16.49 - - 1.00
Grass 75.00 25.00 - - 1.00 82.22 17.78 - - 1.50 66.67 33.33 - - 1.00 77.32 22.68 - - 1.00
Sonfa - - - - - - - - - - - - - - - - - - - -
Any other - - - - - - - - - - - - - - - - - - - -
Note: Ranks are in order of importance from 1 (No problem), 2 (slight problem), 3 (moderate problem), to 4 (severe problem)
Y means Per cent yield loss.
5.1.3.3.(a) Problems of Diseases faced during maize production as revealed by
farmers, sample farms 2012-13
The powdery mildew, seed rot, leaf blight, late blight, pod rot etc are important diseases of
maize. The details of occurrence of mentioned diseases and their impact on yield of maize
during last maize production cycle are presented in table 5.1.3.3.(a). Table shows that seed
rot, late blight did not occur during last maize production cycle. These were not harmful for
maize. However, the occurrence of powdery mildew and leaf bright during last maize
production cycle had been report by 15.12% and 15.12% of sample farmers respectively.
These had created slight problem during last maize production cycle. The loss in yield in
maize was 1.50% and 1.50% due to occurrence of powdery mildew and leaf blight
respectively.
5.1.3.3(b) Problems of Insects/Pests faced during maize production as revealed by
farmers, sample farms 2012-13
The maize is not much affected by insects and pests. Even then, the occurrence of maize
shoot fly, thrips, maize, borer, hairy caterpillar, leaf folder etc. were visible in the maize. The
details of occurrence of mentioned insects/pests on maize production cycle as had been
reported by sample farmers are presented in table 5.1.3.3.(b). Table reflects that among the
five insects and pests, the maize borer and leaf folder had attacked on last maize production
cycle but there was a slight problem as had been reported by 8.60% and 17.44% of sample
farmers respectively. The loss in yield due to occurrence of leaf folder and maize borer was
estimated at 2.00% and 2.00% respectively.


Table 5.1.3.3 (a)
Problems of Diseases faced during maize production as revealed by farmers, sample farms, 2012-13
(% multiple response)
Small Medium Large Overall Particulars
1 2 3 4 Y 1 2 3 4 Y 1 2 3 4 Y 1 2 3 4 Y Powdery
mildew
88.24 11.76 - - 2.00 80.00 20.00 - - 2.00 80.00 20.00 - - 1.00 84.88 15.12 - - 1.50
Seed rot - - - - - - - - - - - - - - - - - - - -
Leaf blight 88.24 11.76 - - 2.00 80.00 20.00 - - 2.00 80.00 20.00 - - 1.00 84.88 15.12 - - 1.50
Late blight - - - - - - - - - - - - - - - - - - - -
Pod Rot - - - - - - - - - - - - - - - - - - - -
Any other - - - - - - - - - - - - - - - - - - - -
Note: Ranks are in order of importance from 1 (No problem), 2 (slight problem), 3 (moderate problem), to 4 (severe problem)
Y means Per cent yield loss.

Table 5.1.3.3 (b)
Problems of Insects/pests faced during maize production as revealed by farmers, sample farms, 2012-13
(% multiple response)
Small Medium Large Overall Particulars
1 2 3 4 Y 1 2 3 4 Y 1 2 3 4 Y 1 2 3 4 Y Maize shoot
fly
- - - - - - - - - - - - - - - - - - - -
Thrips - - - - - - - - - - - - - - - - - - - -
Maize borer 78.43 21.57 - - 3.00 86.67 13.33 - - 3.00 80.00 20.00 - - 1.00 81.40 18.60 - - 2.00
Hairy
caterpillar
- - - - - - - - - - - - - - - - - - - -
Leaf folder 76.47 23.53 - - 3.00 93.33 6.67 - - 3.00 80.00 20.00 - - 1.00 82.56 17.44 - - 2.00
Any other - - - - - - - - - - - - - - - - - - - -
Note: Ranks are in order of importance from 1 (No problem), 2 (slight problem), 3 (moderate problem), to 4 (severe problem)
Y means Per cent yield loss.

5.1.3.3 (C) Problems of weeds faced during maize production as revealed by farmers,
sample farms 2012-13
The weeds are major problem in the cultivation of maize. Therefore, inter-culture process is
important activities to get better growth of plant of maize. The details of views of the
respondents about problems of weeds during last maize, production cycle are presented in
table 5.1.3.3.(C). Table shows that occurrence of weeds was slight problem during last maize
production cycle. On account of this, 3.00% loss in yield occurred.
5.1.3.4.(a) Problems of disease faced during urd production as revealed by farmers,
sample farms 2012-13
The problems of disease faced during urd production as revealed by sample farmers are
presented in table 5.1.3.4(a). Table shows that mungbean yellow mosaic virus and cercospora
leaf spot occurred on urd crop on the sample farms in 2012-13. These diseases had erected
only slight problem as revealed by sample growers of urd. On account of occurrence of these
two diseases, only 2.05% yield loss is witnessed from table 5.1.3.4.(a)
5.1.3.4.(b) Problems of Insects/Pests faced during urd production as revealed by
farmers, sample farms 2012-13
The views of sample farmers regarding the problems of insects/pests faced during urd
production are reported in table 5.1.3.4. (b). Table shows that pod borer and hairy caterpillars
were only insects/pests which had damaged urd crop in 2012-13. The attack was only slight
as revealed by 35% of the sample farmers. On account of this, 2.00% loss in yield occurred.
5.1.3.4.(c) Problems of Weed faced during urd production as revealed by farmers,
sample farms 2012-13
The problems of weeds faced during urd production as revealed by sample farmers are
presented in Table 5.1.3.4 (c ). The table shows that grass had only created problems in the
urd production as revealed by 42.50% of sample farmers. The attack of grass was only slight
and on account of this, 2.00% loss in yield of urd occurred.

5.1.4. Environmental stress presented a problem during last production cycle of
competing crops to paddy crop on the sample farms
The impact of environmental stress is very effective on the production of crops. The
productions of crops are still depended on good and bad monsoon. The drought and excess
rains are most common across the country. The maximum area under kharif crops are
generally destroyed/damaged by the rains and drought in every alternative year. The kharif
crops are mostly effected by drought and excess rains in Uttar Pradesh. The rainfall has been
diminishing owning to climate change which are responsible to decrease the yield of kharif
crops in Uttar Pradesh. Making agricultural production sustainable is going to require new
technologies. Farming will have to become environmentally sustainable. Meanwhile climates
are seemingly ever less reliable and erratic. Agriculture has to become both environmentally
sustainable as well as compatible with climate change. The sample farmers were asked
regarding the environmental stress presented problem during last production cycle of bajra,
maize and urd which are presented in Table 5.1.4 (a), 5.1.4 (b) and 5.1.4 (c).
5.1. 4. (a) Problems of Environmental stress during last production cycle of
competing crop -I (Bajra) on the sample farms
The problem of environmental stress faced during last production cycle of bajra on the
sample farms are shown in table 5.1.4. (a). Table shows that environmental stress did not
occur during last production cycle of bajra on the sample farms. The drought and excess rain
and lower temperature did not occur from pre sowing to maturity stage during last production
of cycle bajra on the sample farms. However, the high temperature occurred during pod
development stage and on account of this, 1% loss occurred during last production cycle of
bajra on the sample farms.

Table 5.1.3.3 (c)
Problems of weeds faced during maize production as revealed by farmers, sample farms, 2012-13
(% multiple response)
Small Medium Large Overall Particulars
1 2 3 4 Y 1 2 3 4 Y 1 2 3 4 Y 1 2 3 4 Y Itsit - - - - - - - - - - - - - - - - - - - -
Mathana - - - - - - - - - - - - - - - - - - - -
Bhakhra - - - - - - - - - - - - - - - - - - - -
Motha 86.27 13.73 - - 2.00 83.33 16.67 - - 1.00 80.00 20.00 - - 2.00 84.88 15.12 - - 1.50
Grass 78.43 21.57 - - 2.00 80.00 20.00 - - 1.00 60.00 40.00 - - 2.00 77.91 22.09 - - 1.50
Sonfa - - - - - - - - - - - - - - - - - - - -
Any other - - - - - - - - - - - - - - - - - - - -
Note: Ranks are in order of importance from 1 (No problem), 2 (slight problem), 3 (moderate problem), to 4 (severe problem)
Y means Per cent yield loss.

Table 5.1.3.4 (a)
Problems of Diseases faced during Urd production as revealed by farmers, sample farms, 2012-13
(% multiple response)
Small Medium Large Overall Particulars
1 2 3 4 Y 1 2 3 4 Y 1 2 3 4 Y 1 2 3 4 Y Mungbean
yellow
mosaic virus
87.50 12.50 - - 2.00 83.33 16.67 - - 1.00 83.33 16.67 - - 1.00 85.00 1.50 - - 1.25
Cercospora
leaf spot
93.75 6.25 - - 1.00 94.44 5.56 - - 1.00 83.33 16.67 - - 1.00 92.50 7.50 - - 0.80
Bacterial
leaf spot
- - - - - - - - - - - - - - - - - - - -
Anthracnose - - - - - - - - - - - - - - - - - - - -
Pod Rot - - - - - - - - - - - - - - - - - - - -
Any other - - - - - - - - - - - - - - - - - - - -
Note: Ranks are in order of importance from 1 (No problem), 2 (slight problem), 3 (moderate problem), to 4 (severe problem)
Y means Per cent yield loss.

Table 5.1.3.4 (b)
Problems of Insects/pests faced during Urd production as revealed by farmers, sample farms, 2012-13
(% multiple response)
Small Medium Large Overall Particulars
1 2 3 4 Y 1 2 3 4 Y 1 2 3 4 Y 1 2 3 4 Y Thrips - - - - - - - - - - - - - - - - - - - -
Whitefly - - - - - - - - - - - - - - - - - - - -
Podborer 84.38 15.62 - - 2.00 83.33 16.67 - - 1.00 75.00 25.00 - - 1.00 82.50 17.50 - - 1.10
Hairy
caterpillar
84.38 15.62 - - 2.00 83.33 16.67 - - 1.00 75.00 25.00 - - 1.00 82.50 17.50 - - 1.10
Dhora - - - - - - - - - - - - - - - - - - - -
Any other - - - - - - - - - - - - - - - - - - - -
Note: Ranks are in order of importance from 1 (No problem), 2 (slight problem), 3 (moderate problem), to 4 (severe problem)
Y means Per cent yield loss.

Table 5.1.3.4 (c)
Problems of weeds faced during Urd production as revealed by farmers, sample farms, 2012-13
(% multiple response)
Small Medium Large Overall Particulars
1 2 3 4 Y 1 2 3 4 Y 1 2 3 4 Y 1 2 3 4 Y Itsit - - - - - - - - - - - - - - - - - - - -
Mathana - - - - - - - - - - - - - - - - - - - -
Bhakhra - - - - - - - - - - - - - - - - - - - -
Motha - - - - - - - - - - - - - - - - - - - -
Grass 62.50 37.50 - - 2.50 55.36 44.44 - - 2.00 30.00 50.00 - - 2.30 57.50 42.50 - - 2.00
Sonfa - - - - - - - - - - - - - - - - - - - -
Any other - - - - - - - - - - - - - - - - - - - -
Note: Ranks are in order of importance from 1 (No problem), 2 (slight problem), 3 (moderate problem), to 4 (severe problem)
Y means Per cent yield loss.

Table 5.1.4 (a)
Problems of environment stress faced during production of competing crop I (Bajra)as revealed by farmers, sample farms,
2012-13
(% multiple response)
Small Medium Large Overall Particulars
1 2 3 4 Y 1 2 3 4 Y 1 2 3 4 Y 1 2 3 4 Y Drought at
Pre-sowing
stage
100.00 - - - - 100.00 - - - - 100.00 - - - - 100.00 - - - -
Flowering
stage
100.00 - - - - 100.00 - - - - 100.00 - - - - 100.00 - - - -
Pod
development
stage
100.00 - - - - 100.00 - - - - 100.00 - - - - 100.00 - - - -
Early seeding
stage
100.00 - - - - 100.00 - - - - 100.00 - - - - 100.00 - - - -
Maturity
stage
- - - - - - - - - - - - - - - - - - - -
Rain at
Pre-sowing
stage
100.00 - - - - 100.00 - - - - 100.00 - - - - 100.00 - - - -
Flowering
stage
100.00 - - - - 100.00 - - - - 100.00 - - - - 100.00 - - - -
Pod
development
stage
100.00 - - - - 100.00 - - - - 100.00 - - - - 100.00 - - - -
Early seeding
stage
100.00 - - - - 100.00 - - - - 100.00 - - - - 100.00 - - - -
Maturity stage - - - - - - - - - - - - - - - - - - - -

High temperature at
Pre-sowing
stage
100.00 - - - - 100.00 - - - - 100.00 - - - - 100.00 - - - -
Flowering
stage
100.00 - - - - 100.00 - - - - 100.00 - - - - 100.00 - - - -
Pod
development
stage
92 5.00 - - 1.5 97.28 2.22 - - 0.90 100 - - - - 96.91 3.09 - - 1.00
Early seeding
stage
100.00 - - - - 100.00 - - - - 100.00 - - - - 100.00 - - - -
Maturity
stage
- - - - - - - - - - - - - - - - - - - -
Low temperature at
Pre-sowing
stage
100.00 - - - - 100.00 - - - - 100.00 - - - - 100.00 - - - -
Flowering
stage
100.00 - - - - 100.00 - - - - 100.00 - - - - 100.00 - - - -
Pod
development
stage
100.00 - - - - 100.00 - - - - 100.00 - - - - 100.00 - - - -
Early seeding
stage
100.00 - - - - 100.00 - - - - 100.00 - - - - 100.00 - - - -
Maturity
stage
100.00 - - - - 100.00 - - - - 100.00 - - - - 100.00 - - - -
Any other - - - - - - - - - - - - - - - - - - - -
Note: Ranks are in order of importance from 1 (No problem), 2 (slight problem), 3 (moderate problem), to 4 (severe problem)
Y means Per cent yield loss.
5.1.4.(b) Problems of Environmental stress faced during last production cycle of
competing crop -II (Maize) on the sample farms
The problems of environmental stress faced by sample farmers during last production cycle
of maize are presented in table 5.1.4 (b). It shows that drought and high temperature did not
occur at any stage during the last production cycle of maize on the sample farms. The rain
occurred at flowering stage and on account of this, 0.5% yield loss occurred in the total
production of maize.
5.1.4.(C) Problems of environmental stress faced during last production cycle of
competing crop –III (urd) on the sample farms
The problems of environmental stress faced by sample farmers during last production cycle
of urd are presented in table 5.1.4. (C). It is evident from this table that excess rains occurred
at the maturity stage of urd. It was only moderate problem as revealed by the sample growers
of urd. On account of this, 3% yield loss occurred. However drought, high and low
temperature did not occur during the last production cycle of urd on the sample farms.
5.2.1(a) Problems regarding inputs faced during production of competing Crop-I
(Bajra) on the sample farms, 2012-13
The details of problems regarding inputs faced during production of bajra as revealed by
different categories of sample farmers are presented in Table 5.2.1 (a). It is evident from
table 5.2.1 (a) that lack of irrigation facilities, shortage of labour, low yield and non
availability of disease resistant varieties were sever problems faced by 36.08%, 36.08%,
32.99% and 29.90% of sample growers during the production of bajra on their farms
respectively in the reference year. The availability of fertilizer was sufficient as had been
reported by 74.23% of sample growers while 25.77% of sample had faced a slight problem
during the production of bajra in reference year. The lack of credit and non-suitable of land
were also moderate problems as had been revealed by 52.58% and 35.05% of sample
growers respectively during the production of bajra in reference year.

Table 5.1.4 (b)
Problems of environment stress faced during production of competing crop II( Maize) as revealed by farmers, sample farms,
2012-13
(% multiple response)
Small Medium Large Overall Particulars
1 2 3 4 Y 1 2 3 4 Y 1 2 3 4 Y 1 2 3 4 Y Drought at
Pre-sowing
stage
100.00 - - - - 100.00 - - - - 100.00 - - - - 100.00 - - - -
Flowering
stage
100.00 - - - - 100.00 - - - - 100.00 - - - - 100.00 - - - -
Pod
development
stage
100.00 - - - - 100.00 - - - - 100.00 - - - - 100.00 - - - -
Early seeding
stage
100.00 - - - - 100.00 - - - - 100.00 - - - - 100.00 - - - -
Maturity stage 100.00 - - - - 100.00 - - - - 100.00 - - - - 100.00 - - - -
Rain at
Pre-sowing
stage
100.00 - - - - 100.00 - - - - 100.00 - - - - 100.00 - - - -
Flowering
stage
96.08 3.92 - - 1.00 96.67 3.33 - - 0.02 8.00 20.0 - - 0.03 96.51 3.49 - - 0.50
Pod
development
stage
100.00 - - - - 100.00 - - - - 100.00 - - - - 100.00 - - - -
Early seeding
stage
100.00 - - - - 100.00 - - - - 100.00 - - - - 100.00 - - - -
Maturity stage 100.00 - - - - 100.00 - - - - 100.00 - - - - 100.00 - - - -
High temperature at

Pre-sowing
stage
100.00 - - - - 100.00 - - - - 100.00 - - - - 100.00 - - - -
Flowering
stage
100.00 - - - - 100.00 - - - - 100.00 - - - - 100.00 - - - -
Pod
development
stage
100.00 - - - - 100.00 - - - - 100.00 - - - - 100.00 - - - -
Early seeding
stage
100.00 - - - - 100.00 - - - - 100.00 - - - - 100.00 - - - -
Maturity stage 100.00 - - - - 100.00 - - - - 100.00 - - - - 100.00 - - - -
Low temperature at
Pre-sowing
stage
100.00 - - - - 100.00 - - - - 100.00 - - - - 100.00 - - - -
Flowering
stage
100.00 - - - - 100.00 - - - - 100.00 - - - - 100.00 - - - -
Pod
development
stage
100.00 - - - - 100.00 - - - - 100.00 - - - - 100.00 - - - -
Early seeding
stage
100.00 - - - - 100.00 - - - - 100.00 - - - - 100.00 - - - -
Maturity stage 100.00 - - - - 100.00 - - - - 100.00 - - - - 100.00 - - - -
Any other - - - - - - - - - - - - - - - - - -- - -
Note: Ranks are in order of importance from 1 (No problem), 2 (slight problem), 3 (moderate problem), to 4 (severe problem)
Y means Per cent yield loss.

Table 5.1.4 (C)
Problems of environment stress faced during production of competing crop III(Urd) as revealed by farmers, sample farms,
2012-13
(% multiple response)
Small Medium Large Overall Particulars
1 2 3 4 Y 1 2 3 4 Y 1 2 3 4 Y 1 2 3 4 Y Drought at
Pre-sowing
stage
100.00 - - - - 100.00 - - - - 100.00 - - - - 100.00 - - - -
Flowering
stage
100.00 - - - - 100.00 - - - - 100.00 - - - - 100.00 - - - -
Pod
development
stage
100.00 - - - - 100.00 - - - - 100.00 - - - - 100.00 - - - -
Early seeding
stage
100.00 - - - - 100.00 - - - - 100.00 - - - - 100.00 - - - -
Maturity
stage
100.00 - - - - 100.00 - - - - 100.00 - - - - 100.00 - - - -
Rain at
Pre-sowing
stage
100.00 - - - - 100.00 - - - - 100.00 - - - - 100.00 - - - -
Flowering
stage
100.00 - - - - 100.00 - - - - 100.00 - - - - 100.00 - - - -
Pod
development
stage
100.00 - - - - 100.00 - - - - 100.00 - - - - 100.00 - - - -
Early seeding
stage
100.00 - - - - 100.00 - - - - 100.00 - - - - 100.00 - - - -
Maturity stage 87.50 12.50 - - 2.00 88.89 11.11 - - 4.00 83.33 16.67 - - - 87.50 12.50 - - 3.00

High temperature at
Pre-sowing
stage
100.00 - - - - 100.00 - - - - 100.00 - - - - 100.00 - - - -
Flowering
stage
100.00 - - - - 100.00 - - - - 100.00 - - - - 100.00 - - - -
Pod
development
stage
100.00 - - - - 100.00 - - - - 100.00 - - - - 100.00 - - - -
Early seeding
stage
100.00 - - - - 100.00 - - - - 100.00 - - - - 100.00 - - - -
Maturity
stage
100.00 - - - - 100.00 - - - - 100.00 - - - - 100.00 - - - -
Low temperature at
Pre-sowing
stage
100.00 - - - - 100.00 - - - - 100.00 - - - - 100.00 - - - -
Flowering
stage
100.00 - - - - 100.00 - - - - 100.00 - - - - 100.00 - - - -
Pod
development
stage
100.00 - - - - 100.00 - - - - 100.00 - - - - 100.00 - - - -
Early seeding
stage
100.00 - - - - 100.00 - - - - 100.00 - - - - 100.00 - - - -
Maturity
stage
100.00 - - - - 100.00 - - - - 100.00 - - - - 100.00 - - - -
Any other
Note: Ranks are in order of importance from 1 (No problem), 2 (slight problem), 3 (moderate problem), to 4 (severe problem)
Y means Per cent yield loss.

Table 5.2.1 (a)
Problems regarding inputs faced during production of competing crop I(Bajra) as revealed by farmers, sample farms, 2012-13
(% multiple response)
Small Medium Large Overall Reason
1 2 3 4 1 2 3 4 1 2 3 4 1 2 3 4 Lack of irrigation
facility
10.00 20.00 30.00 40.00 8.89 22.22 26.67 42.22 33.33 66.67 - - 12.37 26.81 24.74 36.08
Shortage of land 20.00 20.00 25.00 35.00 33.33 33.33 33.34 - 33.33 66.67 - - 27.84 31.96 25.77 14.43
Non-availability
of quality seeds
20.00 30.00 25.00 25.00 13.33 24.45 31.11 31.11 41.67 58.33 - - 19.59 30.93 24.74 24.74
Non-availability
of fertilizer
75.00 25.00 - - 66.67 33.33 - - 100.00 - - - 74.23 25.77 - -
Non-availability
of chemicals/
pesticides
15.00 15.00 45.00 25.00 - 33.33 44.45 22.22 - 50.00 50.00 - 6.19 27.83 45.36 20.62
Shortage of
labour
- 25.00 25.00 50.00 - 33.33 33.33 33.33 - 50.00 50.00 - - 31.96 31.96 36.08
Timeliness of
field operation
15.00 25.00 25.00 35.00 - 33.33 33.33 33.34 - 50.00 50.00 - 6.19 31.96 31.95 29.90
Availability
machinery
15.00 40.00 35.00 10.00 17.78 35.56 35.56 11.11 - 50.00 50.00 - 14.43 39.18 37.11 9.28
Lack of credit - - 45.00 55.00 17.78 22.22 60.00 - - 50.00 50.00 - 8.25 16.49 52.58 22.68
Non Suitable
Land
37.50 20.00 32.50 10.00 11.11 40.00 31.11 17.78 - 41.67 58.33 - 20.62 31.96 35.05 12.37
Low Yield 25.00 25.00 25.00 25.00 17.78 17.77 26.67 37.78 16.67 16.67 25.00 41.66 20.62 20.62 25.77 32.99
Non availability
of disease
resistant varieties
25.00 25.00 25.00 25.00 20.00 20.00 26.67 33.33 - 33.33 33.33 33.34 19.59 23.71 26.80 29.90
Note: Ranks are in order of importance from 1 (No problem), 2 (slight problem), 3 (moderate problem), to 4 (severe problem)

5.2.1 (b) Problems regarding inputs faced during production of competing Crop-II
(Maize) on the sample farms, 2012-13
The problems regarding inputs faced during production of maize as revealed by different
categories of sample farmers are presented in Table 5.2.1 (b). Table 5.2.1(b) shows that non-
availability of chemical/pesticides, shortage of labour, lack of irrigation facilities and
shortage of land were severe problems as had been revealed by 47.68%, 38.37%, 22.09% and
32.56% of sample growers respectively during the production of maize on their farms in
reference year.
It is also evident from table 5.2.1 (b) that the fertilizer, machinery and credit were mostly
available during the production of maize on their farms as had been reported by 53.49%,
38.37% and 37.21% of the sample growers respectively. Apart from these, 46.51%, 32.56%,
29.07% and 26.75% of sample growers had reported that non-availability of fertilizers, low
yield, lack of credit and timelines of field operation were slight problems during the
production of maize on their farms in reference year. The non-availability of credit, non
suitable land, non-availability of machinery and shortage of labour were moderate problem
during the production of maize as had been reported by 19.77%, 27.91%, 25.28% and
23.26% of sample farmers respectively.
5.2.1 (c) Problems regarding inputs faced during production of competing Crop-III
(Urd) on the sample farms 2012-13.
The problems regarding inputs faced during the production of urd are worked out by the
percentage multiple response of respondents in the table 5.2.1(C). Table shows that non
availability of disease resistant varieties, shortage of labour, non availability of quality seeds
and shortage of land were severe problem during the production of urd as had been reported
by 33.75%, 27.50%, 20.00% and 20.00% of sample farmers respectively in the reference
year.


Table 5.2.1 (B)
Problems regarding inputs faced during production of competing crop II(Maize) as revealed by farmers, sample farms,
2012-13
(% multiple response)
Small Medium Large Overall Reason
1 2 3 4 1 2 3 4 1 2 3 4 1 2 3 4 Lack of irrigation
facility
15.69 19.61 29.41 35.29 10.00 46.67 40.00 3.33 80.00 20.00 - - 17.44 29.07 31.40 22.09
Shortage of land 17.65 19.61 19.61 43.14 13.33 20.00 46.67 20.00 - 40.00 60.00 - 15.12 20.93 31.40 32.56
Non-availability of
quality seeds
23.53 23.53 29.41 23.33 36.67 30.00 20.00 13.33 20.00 80.00 - - 27.91 29.07 24.42 18.60
Non-availability of
fertilizer
60.78 39.22 - - 33.33 66.67 - - 100.00 - - - 53.49 46.51 - -
Non-availability of
chemicals/
pesticides
- 19.61 35.29 45.10 - - 40.00 60.00 60.00 40.00 - - 3.49 13.95 34.88 47.68
Shortage of labour 25.49 19.61 19.61 35.29 16.67 16.67 33.33 33.33 - - - 100.00 20.93 17.44 23.26 38.37
Timeliness of field
operation
29.41 19.61 35.29 15.69 16.67 43.33 26.67 13.33 100.00 - - - 29.07 26.75 30.23 13.95
Availability
machinery
35.30 23.53 29.41 11.76 33.33 26.67 23.33 16.67 100.00 - - - 38.37 23.26 25.58 12.79
Lack of credit 33.33 29.41 23.53 13.73 33.33 33.33 16.67 16.67 100.00 - - - 37.21 29.07 19.77 13.95
Non Suitable Land 29.41 29.41 2.49 15.69 26.67 26.67 26.66 20.00 - 40.00 60.00 - 26.75 29.07 27.91 16.28
Low Yield 35.29 31.37 19.61 13.73 40.00 33.33 20.00 6.67 - 40.00 60.00 - 34.88 32.56 22.09 10.47
Non availability of
disease resistant
varieties
6.67 30.00 53.33 10.00 - 20.00 20.00 60.00 10.47 29.07 41.86 18.60
Note: Ranks are in order of importance from 1 (No problem), 2 (slight problem), 3 (moderate problem), to 4 (severe problem)

Table 5.2.1 (C)
Problems regarding inputs faced during production of competing crop III (Urd) as revealed by farmers, sample farms,
2012-13
(% multiple response)
Small Medium Large Overall Reason
1 2 3 4 1 2 3 4 1 2 3 4 1 2 3 4 Lack of irrigation
facility
31.25 31.25 37.50 - 33.33 33.33 33.34 - 50.00 50.00 - - 35.00 35.00 30.00 -
Shortage of land 12.50 37.50 18.75 37.50 33.33 22.22 11.11 - 33.33 66.67 - - 25.00 37.50 17.50 20.00
Non-availability of
quality seeds
37.50 25.00 25.00 12.50 16.67 27.78 22.22 33.33 33.33 66.67 - - 27.50 32.50 20.00 20.00
Non-availability of
fertilizer
56.25 31.25 12.50 - 22.22 33.33 44.45 - 100.00 - - - 47.50 27.50 25.00 -
Non-availability of
chemicals/
pesticides
21.88 46.87 31.25 - 22.22 33.33 33.33 11.11 100.00 - - - 33.75 33.75 27.50 5.00
Shortage of labour 25.00 25.00 25.00 25.00 16.67 27.78 27.78 27.78 - 33.33 33.33 33.34 17.50 27.50 27.50 27.50
Timeliness of field
operation
37.50 25.00 25.00 12.50 38.89 27.78 22.22 11.11 - 33.33 33.33 33.34 32.50 27.50 25.00 15.00
Availability
machinery
37.50 21.88 21.87 18.75 44.45 22.22 22.22 11.11 50.00 50.00 - - 42.50 26.25 18.75 12.50
Lack of credit 37.50 25.00 25.00 12.50 27.78 27.78 33.33 11.11 50.00 50.00 - - 35.00 30.00 25.00 10.00
Non Suitable Land 31.25 31.25 21.88 15.12 27.78 38.89 22.22 11.11 33.33 66.67 - - 30.00 40.00 18.75 11.25
Low Yield 31.25 31.25 25.00 12.50 27.78 38.89 25.00 8.33 - - 33.33 66.67 25.00 30.00 26.25 18.75
Non availability of
disease resistant
varieties
6.25 31.25 21.88 40.62 5.56 33.33 22.22 38.89 16.67 33.33 50.00 - 7.50 32.50 26.25 33.75
Note: Ranks are in order of importance from 1 (No problem), 2 (slight problem), 3 (moderate problem), to 4 (severe problem)

It is also evident from table that most of inputs for the production of urd did not pose any
problem. The non- suitable land, shortage of land, lack of irrigation facilities, non availability
of chemical/pesticides, posed slight problems during the production of urd as had been
revealed by 40.00%, 37.50%, 35.00% and 33.75% of the sample farmers respectively. The
non availability of disease resistant varieties, low yield, lack of credit, lack of irrigation
facilities, shortage of labour and timelines of field operation had posed moderate problems
during the production of urd as had been reported by 26.25%, 26.25%, 25.00%, 30.00%,
27.50% and 25.00% of sample growers respectively in the reference year.
5.2.2 (a) Problems faced during marketing of produce for competing Crop-I (Bajra) as
revealed by farmers on the sample farms, 2012-13
No doubt the production of each and every crop has increased significantly but the farmers do not get
remunerative prices of their produce. The farmers are still facing number of problems during
marketing of their produces in markets as well as at door. The problems faced during the marketing of
bajra as reported by sample growers are worked out by percentage multiple response in Table 5.2.2
(a) Table shows that the majority of different categories of sample farmers did not face severe
problems during the marketing of bajra. However, 16.49%, 9.28%, 7.22% and 5.15% of the
respondents had reported that they were facing the severe problems due to non-availability of markets
near by village, lack of transport facilities, lack of packing materials and low demand of produce in
the markets respectively. It is also evident from the table that most of respondents had faced only
slight and moderate problems during marketing of bajra in the reference year. It is also evident from
the table that small sample farmers did not face much problems during the marketing of bajra as
compared to medium and large sample farmers.
5.2.2 (b) Problems faced during marketing of produce for competing Crop-II (Maize) as revealed by farmers on the sample farms, 2012-13
The multiple response of sample farmers regarding the problems faced during the marketing of maize
are worked out in table 5.2.2 (b). Table shows that majority of small and medium sample farmers did
not get adequate information about prevailing price of maize of different markets. The non-
availability of markets nearby village, losses during the storage, variability of price and low demand
in the markets were severe problems during marketing of produce of maize as had been reported by
20.93%, 20.93%, 16.63% and 4.65% of the sample farmers respectively. It is also evident from the
table that small sample farmers had faced much problems during the marketing of maize than that of
medium and large sample farmers.

Table 5.2.2 (a)
Problems faced during marketing of produce for competing crop I (Bajra) as revealed by farmers, sample farms, 2012-13
(% multiple response)
Small Medium Large Overall Reason
1 2 3 4 1 2 3 4 1 2 3 4 1 2 3 4
Difficult to access
information on price
25.00 37.50 37.50 - - 44.44 44.44 11.11 - 100.00 - - 30.93 48.45 20.62 -
Variability of price - 50.00 50.00 - - 44.44 44.44 11.11 - 100.00 - - 53.61 41.24 5.15 -
Losses during
storage
37.50 37.50 25.00 - 33.33 33.34 22.22 11.11 - 00.00 - - 30.93 43.30 20.62 5.15
High labor needs for
sorting/ packaging
40.00 30.00 30.00 - 31.11 26.67 26.67 15.55 - 66.67 33.33 - 30.93 32.99 28.86 7.22
Transport to market 45.00 37.50 17.50 - 26.67 26.67 26.66 20.00 66.67 33.33 - - 39.17 31.96 19.59 9.28
Low market demand 45.00 35.00 20.00 - 40.00 26.67 22.22 11.11 83.33 16.67 - - 47.42 28.87 18.56 5.15
No nearby markets 20.00 30.00 30.00 20.00 31.11 26.67 24.44 17.78 33.33 33.33 33.34 - 26.80 28.87 27.84 16.49
Other - - - - - - - - - - - - - - - -
Note: Ranks are in order of importance from 1 (No problem), 2 (slight problem), 3 (moderate problem), to 4 (severe problem)

Table 5.2.2 (b)
Problems faced during marketing of produce for competing crop II (Maize) as revealed by farmers, sample farms, 2012-13
(% multiple response)
Small Medium Large Overall Reason
1 2 3 4 1 2 3 4 1 2 3 4 1 2 3 4
Difficult to access
information on
price
- 47.06 52.94 - - - 100.00 - - 80.00 20.00 - - 32.56 67.44 -
Variability of price 19.61 35.29 25.49 19.61 20.00 33.33 46.67 - - - 100.00 - 18.60 37.21 32.56 16.63
Losses during
storage
23.53 23.53 17.65 35.29 20.00 33.33 46.67 - - 80.00 20.00 - 20.93 30.23 27.91 20.93
High labor needs
for sorting/
packaging
33.33 33.33 33.34 - - 40.00 40.00 20.00 40.00 60.00 - - 22.09 37.21 33.72 6.98
Transport to
market
39.22 33.33 27.45 - 33.33 33.33 33.34 - 40.00 60.00 - - 37.21 34.88 27.91 -
Low market
demand
35.29 29.41 27.45 7.84 33.33 33.33 33.34 - 100.00 - - - 38.37 29.07 27.91 4.65
No nearby markets - 45.10 19.61 35.29 16.67 50.00 33.33 - 40.00 60.00 - - 8.14 47.67 23.26 20.93
Other - - - - - - - - - - - - - - - -
Note: Ranks are in order of importance from 1 (No problem), 2 (slight problem), 3 (moderate problem), to 4 (severe problem)

5.2.2 (c) Problems faced during marketing of produce for competing Crop-III (Urd) as revealed by farmers on the sample farms 2012-13
The multiple problems faced during marketing of urd are worked out in Table 5.2.2 (c). The table
shows that most of the problems faced during the marketing of urd during reference year were slight
in nature. However, the non-availability of labour, sorting packing and lack of information were
severe problems during the marketing of urd as had been revealed by 17.50% and 17.50% of sample
farmers respectively. It is also evident from the table that small sample farmers had faced more
problems during the marketing of urd as compared to medium and large farmers.

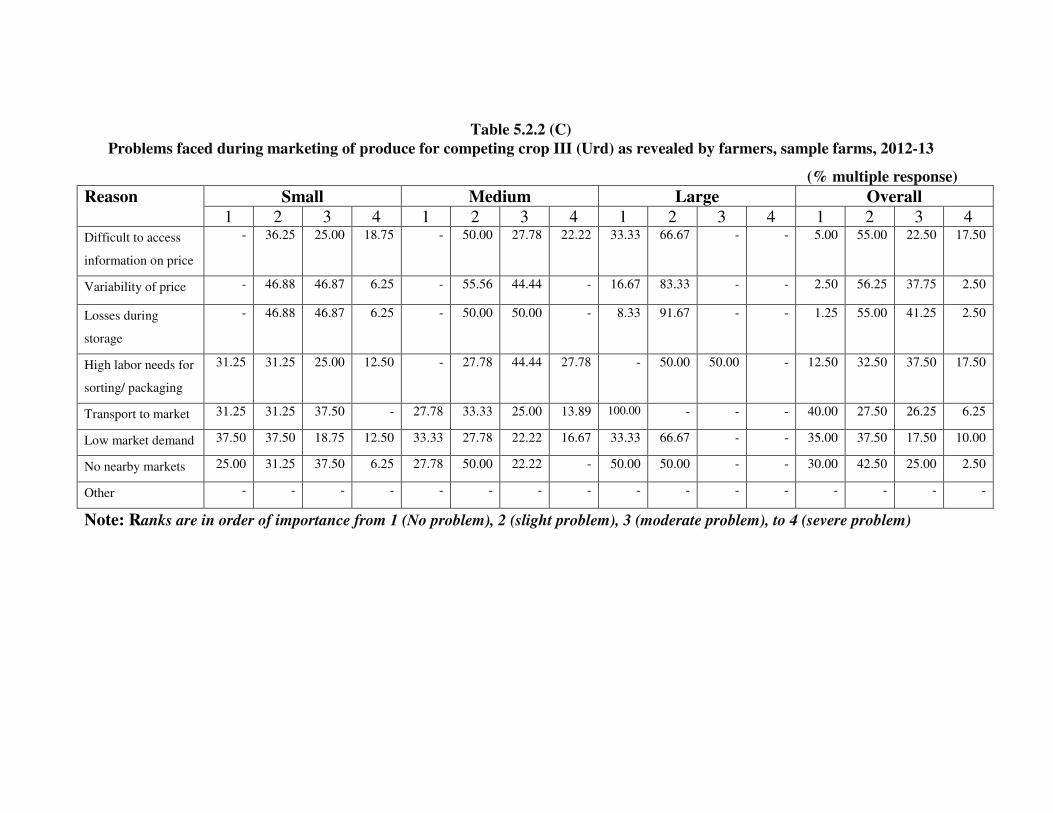
Table 5.2.2 (C)
Problems faced during marketing of produce for competing crop III (Urd) as revealed by farmers, sample farms, 2012-13
(% multiple response)
Small Medium Large Overall Reason
1 2 3 4 1 2 3 4 1 2 3 4 1 2 3 4 Difficult to access
information on price
- 36.25 25.00 18.75 - 50.00 27.78 22.22 33.33 66.67 - - 5.00 55.00 22.50 17.50
Variability of price - 46.88 46.87 6.25 - 55.56 44.44 - 16.67 83.33 - - 2.50 56.25 37.75 2.50
Losses during
storage
- 46.88 46.87 6.25 - 50.00 50.00 - 8.33 91.67 - - 1.25 55.00 41.25 2.50
High labor needs for
sorting/ packaging
31.25 31.25 25.00 12.50 - 27.78 44.44 27.78 - 50.00 50.00 - 12.50 32.50 37.50 17.50
Transport to market 31.25 31.25 37.50 - 27.78 33.33 25.00 13.89 100.00 - - - 40.00 27.50 26.25 6.25
Low market demand 37.50 37.50 18.75 12.50 33.33 27.78 22.22 16.67 33.33 66.67 - - 35.00 37.50 17.50 10.00
No nearby markets 25.00 31.25 37.50 6.25 27.78 50.00 22.22 - 50.00 50.00 - - 30.00 42.50 25.00 2.50
Other - - - - - - - - - - - - - - - -
Note: Ranks are in order of importance from 1 (No problem), 2 (slight problem), 3 (moderate problem), to 4 (severe problem)

CHAPTER-6
Suggestions to increase the yield of competing crops
This chapter contains the suggestions to increase yield of competing crops (bajra, maize and
urd) as revealed by sample farmers during the investigation of study. The suggestions related
to availability of inputs for the competing crops have been described in the chapter. Apart
from this, suggestions to researchers and extension agencies have also been discussed in this
chapter.
6.1 (a) Suggestions to increase the yield of Competing Crop-I (Bajra) on the Sample
Farms
The yield of bajra can be increased from present level through use of new varieties and new
techniques of crop production. The suggestions to increase yield of bajra as revealed by
sample of bajra growers are presented in Table-6.1 (a). This table shows that timely planting/
sowing of bajra followed by timely weeding are most important inputs to increase the yield
of bajra. On the whole, 45.36% of sample growers of bajra had revealed that timely sowing
of the crop is most important input to increase the yield of bajra while 30.93% had
considered it as an important input. Timely weeding and timely irrigation are also important
factors to increase the yield of bajra as had been revealed by 21.65% and 20.62% of sample
bajra growers respectively. The application of fertilizer is considered least important factor of
production of bajra as had been reported by 26.80% of the samples of bajra growers. It is also
evident from table 6.1. (a) that 50% sample of small growers followed by 50% large growers
and 40% medium sample growers had given first priority to timely sowing of bajra as most
important factor to increase the yield of bajra.
6.1.(b) Suggestions to increase the yield of Competing Crop-II (Maize) on the Sample
Farms
The suggestions to increase yield of maize as revealed by the sample of maize growers are
reported in Table 6.1.(b). To maintain stable growth in yield of maize, the technology

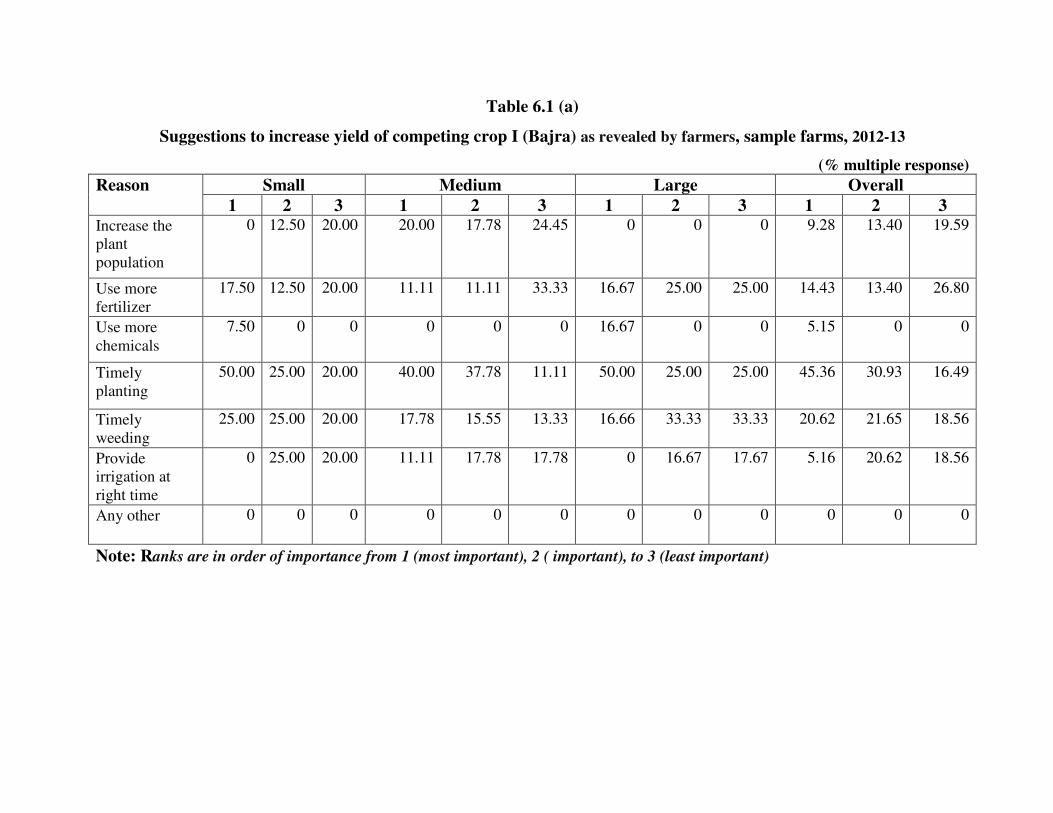
Table 6.1 (a)
Suggestions to increase yield of competing crop I (Bajra) as revealed by farmers, sample farms, 2012-13
(% multiple response)
Small Medium Large Overall Reason
1 2 3 1 2 3 1 2 3 1 2 3 Increase the
plant
population
0 12.50 20.00 20.00 17.78 24.45 0 0 0 9.28 13.40 19.59
Use more
fertilizer
17.50 12.50 20.00 11.11 11.11 33.33 16.67 25.00 25.00 14.43 13.40 26.80
Use more
chemicals
7.50 0 0 0 0 0 16.67 0 0 5.15 0 0
Timely
planting
50.00 25.00 20.00 40.00 37.78 11.11 50.00 25.00 25.00 45.36 30.93 16.49
Timely
weeding
25.00 25.00 20.00 17.78 15.55 13.33 16.66 33.33 33.33 20.62 21.65 18.56
Provide
irrigation at
right time
0 25.00 20.00 11.11 17.78 17.78 0 16.67 17.67 5.16 20.62 18.56
Any other
0 0 0 0 0 0 0 0 0 0 0 0
Note: Ranks are in order of importance from 1 (most important), 2 ( important), to 3 (least important)
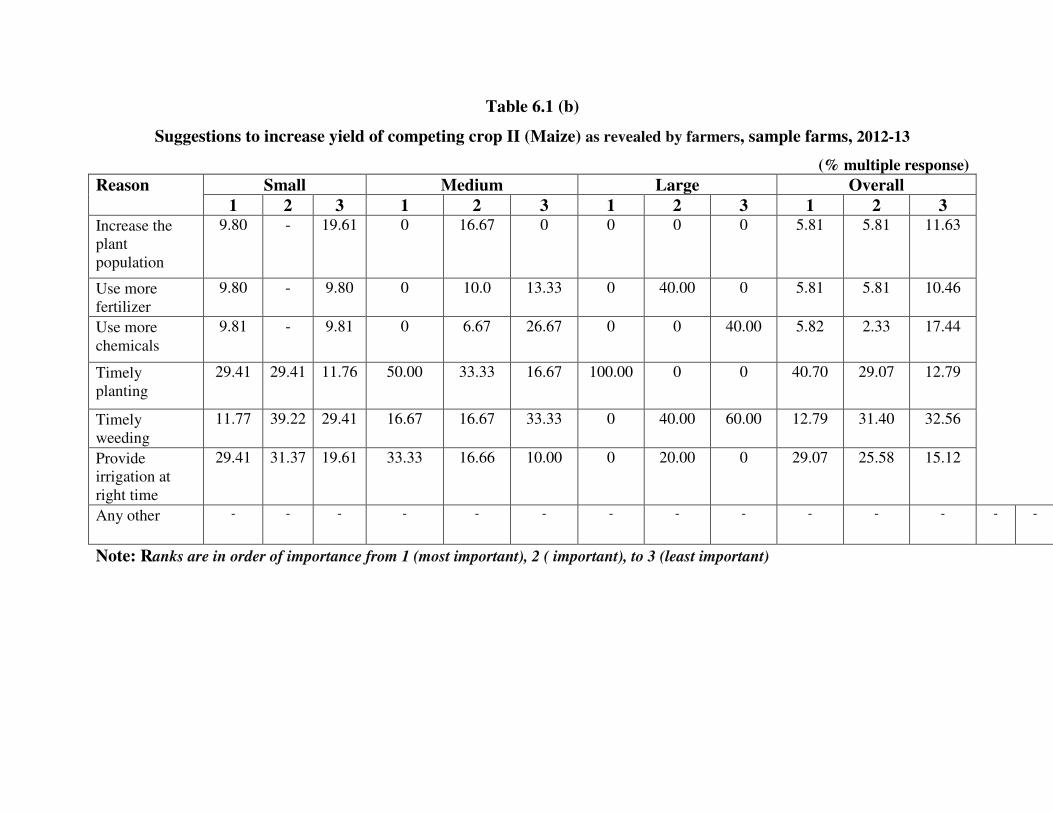
Table 6.1 (b)
Suggestions to increase yield of competing crop II (Maize) as revealed by farmers, sample farms, 2012-13
(% multiple response)
Small Medium Large Overall Reason
1 2 3 1 2 3 1 2 3 1 2 3 Increase the
plant
population
9.80 - 19.61 0 16.67 0 0 0 0 5.81 5.81 11.63
Use more
fertilizer
9.80 - 9.80 0 10.0 13.33 0 40.00 0 5.81 5.81 10.46
Use more
chemicals
9.81 - 9.81 0 6.67 26.67 0 0 40.00 5.82 2.33 17.44
Timely
planting
29.41 29.41 11.76 50.00 33.33 16.67 100.00 0 0 40.70 29.07 12.79
Timely
weeding
11.77 39.22 29.41 16.67 16.67 33.33 0 40.00 60.00 12.79 31.40 32.56
Provide
irrigation at
right time
29.41 31.37 19.61 33.33 16.66 10.00 0 20.00 0 29.07 25.58 15.12
Any other
- - - - - - - - - - - - - -
Note: Ranks are in order of importance from 1 (most important), 2 ( important), to 3 (least important)
improvements are most important input to push the yield of maize on the sample farms.
Table 6.1.(b) shows that 40.70% of sample growers were of the opinion that timely sowing of
maize is most important factor of production to increase the yield of maize while 29.07% of
sample growers had considered it as an important factor to increase the yield of maize.
Instead of this, timely irrigation is also most important factor of production to increase the
yield of maize as revealed by 29.07% of sample growers.
6.1.(c) Suggestions to increase the yield of Competing Crop-III (Urd) on the Sample
Farms
The suggestions to increase yield of urd as reported by sample growers of urd are presented
in Table 6.1.(c). It is evident from Table 6.1.(c) that majority of sample of urd growers had
expressed their views that timely sowing of urd and coupled with timely weeding are most
important catalyze inputs to raise the yield of urd. Apart from these, suggestion, the proper
application of fertilizers in urd crop is also most important input to increase the yield of urd
as had been revealed by 17.50% of the sample growers. However, 22.50% of the sample
growers had considered it was an important input to raise the yield of urd. In U.P.
Technology improvements in terms of high yielding varieties of urd would be required to
increase the yield further.
6.2. Suggestions to researchers to increase yield of competing crops (Bajra, Maize and
Urd) as revealed by farmers, sample farms, 2012-13
Promotion of sustainable land use should be agenda of research and extension services. The
researchers are advised to evolve such varieties of bajra, maize and urd which should be local
based. The researchers should take sincere efforts to evolve short duration drought tolerant
and excess moisture tolerant varieties of bajra, maize and urd at par with evolved varieties of
paddy. On account of this, the production of completing crops will increase in coming years.
These will also be assured crops as similar as paddy crop. The suggestions to researchers to
increase the yield of competing crops viz bajra, maize and urd as had been revealed by
sample farmers are presented in Table 6.2 (a), 6.2 (b) and (6.2 (c) respectively.


Table 6.1 (c)
Suggestions to increase yield of competing crop III (Urd) as revealed by farmers, sample farms, 2012-13
(% multiple response)
Small Medium Large Overall Reason
1 2 3 1 2 3 1 2 3 1 2 3 Increase the
plant
population
12.50 9.38 18.75 11.11 5.56 11.11 0 0 0 10.00 6.25 12.50
Use more
fertilizer
25.00 25.00 9.38 16.67 16.67 11.11 0 33.33 16.67 17.50 22.50 11.25
Use more
chemicals
12.50 21.87 12.50 22.22 27.78 25.00 25.00 16.67 25.00 18.75 23.75 20.00
Timely
planting
34.38 25.00 28.12 33.33 27.77 27.78 58.33 16.67 25.00 37.50 25.00 27.50
Timely
weeding
15.62 18.75 31.25 16.67 22.22 25.00 16.67 33.33 33.33 16.25 22.25 28.75
Provide
irrigation at
right time
0 0 0 0 0 0 0 0 0 0 0 0
Any other
- - - - - - - - - - - -
Note: Ranks are in order of importance from 1 (most important), 2 ( important), to 3 (least important)

6.2. (a) Suggestions to researchers to increase yield of competing crop-I (Bajra) as
revealed by sample farmers, 2012-13
Table 6.2 (a) suggestions to researchers to increase yield of competing crop I (Bajra) as
revealed by sample farmers, 2012-13 are presented in table 6.2 (a). It is noticed from table
6.2.(a) that the farmers had suggested to research scientists to evolve the short duration,
drought tolerant and disease resistant varieties of bajra because it was most important input to
increase the yield of bajra. Out of total sample growers, 37.50% and 22.22% of small and
medium growers respectively had also suggested researchers to develop, excess moisture
tolerant varieties of bajra because it was also important inputs to increase the yield of bajra.
6.2. (b) Suggestions to researchers to increase yield of competing crop-II (Maize) as
revealed by sample farmers, 2012-13
The suggestions of different categories of sample farmers to researchers regarding
development of new varieties of maize are presented in Table 6.2 (b). This table shows that
the sample farmers of maize had suggested to research scientists to develop, short duration,
drought tolerant and disease resistant varieties of maize. These varieties were much
demanded by sample farmers. These were also most important choice of sample growers.
The other suggestions related to development of varieties of maize were least important in
eyes of sample farmers.
6.2. (c) Suggestions to researchers to increase yield of competing crop-III (Urd) as
revealed by sample farmers, 2012-13
The suggestions to researchers to increase yield of urd as revealed by sample farmers are
presented in table 6.2 (c). The eight suggestions are mentioned in Table 6.2 (c) of which
three were reported by sample growers of urd. They were of the opinion that development of
short duration varieties, drought tolerant varieties and disease resistant varieties are most
important inputs to increase the production of urd. Hence, they had requested researchers to
evolve the mentioned varieties to increase the production of urd.
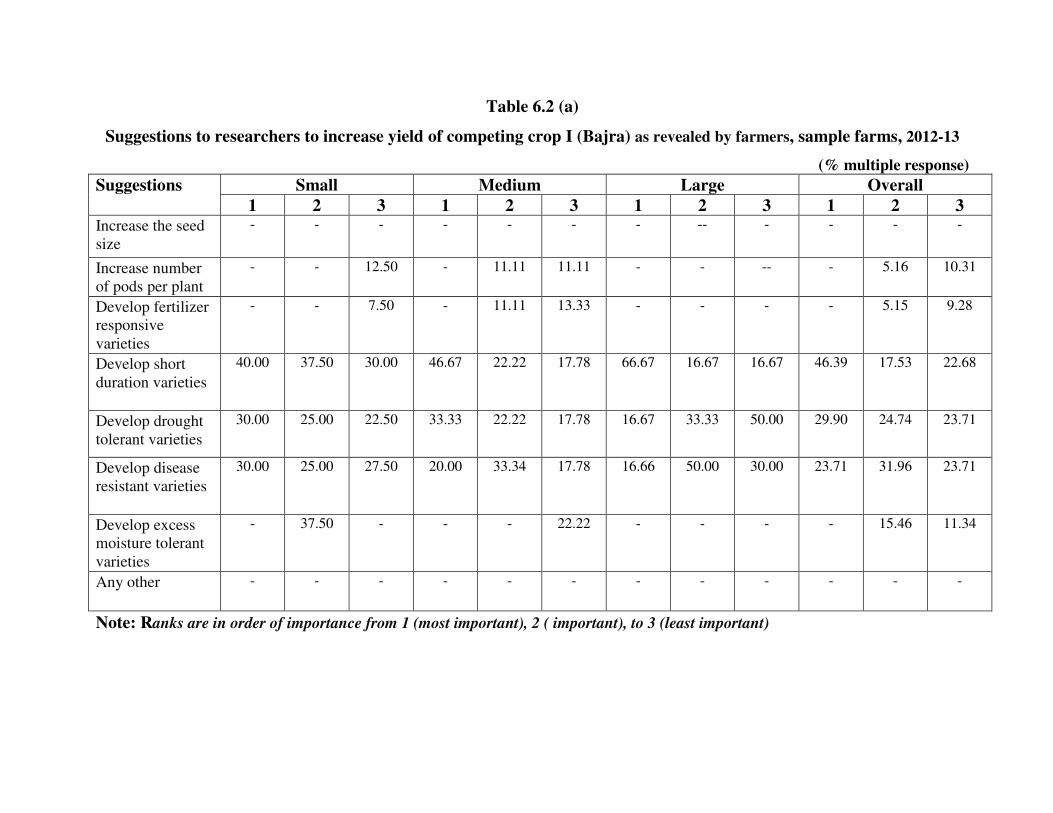
Table 6.2 (a)
Suggestions to researchers to increase yield of competing crop I (Bajra) as revealed by farmers, sample farms, 2012-13
(% multiple response)
Small Medium Large Overall Suggestions
1 2 3 1 2 3 1 2 3 1 2 3 Increase the seed
size - - - - - - - -- - - - -
Increase number
of pods per plant
- - 12.50 - 11.11 11.11 - - -- - 5.16 10.31
Develop fertilizer
responsive
varieties
- - 7.50 - 11.11 13.33 - - - - 5.15 9.28
Develop short
duration varieties
40.00 37.50 30.00 46.67 22.22 17.78 66.67 16.67 16.67 46.39 17.53 22.68
Develop drought
tolerant varieties
30.00 25.00 22.50 33.33 22.22 17.78 16.67 33.33 50.00 29.90 24.74 23.71
Develop disease
resistant varieties
30.00 25.00 27.50 20.00 33.34 17.78 16.66 50.00 30.00 23.71 31.96 23.71
Develop excess
moisture tolerant
varieties
- 37.50 - - - 22.22 - - - - 15.46 11.34
Any other
- - - - - - - - - - - -
Note: Ranks are in order of importance from 1 (most important), 2 ( important), to 3 (least important)

Table 6.2 (b)
Suggestions to researchers to increase yield of competing crop II (Maize) as revealed by farmers, sample farms,
2012-13
(% multiple response)
Small Medium Large Overall Suggestions
1 2 3 1 2 3 1 2 3 1 2 3 Increase the seed
size - - - - - - - - - - - -
Increase number
of pods per plant
- - 13.73 - - - - - - - - 8.14
Develop fertilizer
responsive
varieties
- - 15.69 - - 13.33 - - - - 12.99 13.95
Develop short
duration varieties
39.22 21.57 23.53 40.00 26.67 30.00 40.00 40.00 20.00 39.54 23.26 25.58
Develop drought
tolerant varieties
35.29 19.61 23.53 33.33 40.00 26.67 40.00 20.00 40.00 34.88 32.56 25.58
Develop disease
resistant varieties
25.49 29.41 23.52 26.67 33.33 30.00 20.00 40.00 40.00 25.58 31.40 26.75
Develop excess
moisture tolerant
varieties
- 29.41 - - - - - - - - - -
Any other
- - - - - - - - - - - -
Note: Ranks are in order of importance from 1 (most important), 2 ( important), to 3 (least important)

Table 6.2 (C)
Suggestions to researchers to increase yield of competing crop III (Urd) as revealed by farmers, sample farms, 2012-13
(% multiple response)
Small Medium Large Overall Suggestions
1 2 3 1 2 3 1 2 3 1 2 3 Increase the seed
size - - - - - - - - - - - -
Increase number
of pods per plant
- - - - - - - - - - - -
Develop fertilizer
responsive
varieties
- - - - - - - - - - - -
Develop short
duration varieties
43.75 40.63 15.62 41.67 27.78 30.56 41.67 25.00 33.33 42.50 32.50 25.00
Develop drought
tolerant varieties
31.25 28.12 40.63 25.00 38.89 36.11 33.33 41.67 25.00 28.75 35.00 36.25
Develop disease
resistant varieties
25.00 31.25 43.75 33.33 33.33 33.33 25.00 33.33 41.67 28.75 32.50 38.75
Develop excess
moisture tolerant
varieties
- - - - - - - - - - - -
Any other
- - - - - - - - - - - -
Note: Ranks are in order of importance from 1 (most important), 2 ( important), to 3 (least important)
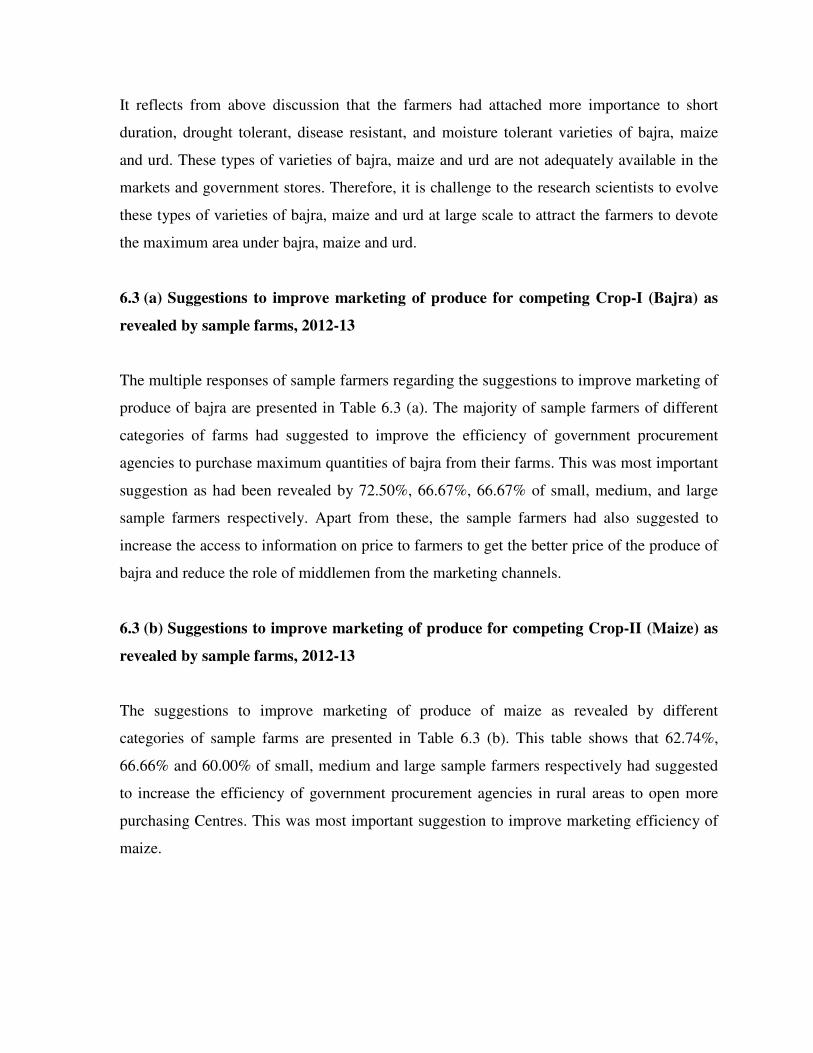
It reflects from above discussion that the farmers had attached more importance to short
duration, drought tolerant, disease resistant, and moisture tolerant varieties of bajra, maize
and urd. These types of varieties of bajra, maize and urd are not adequately available in the
markets and government stores. Therefore, it is challenge to the research scientists to evolve
these types of varieties of bajra, maize and urd at large scale to attract the farmers to devote
the maximum area under bajra, maize and urd.
6.3 (a) Suggestions to improve marketing of produce for competing Crop-I (Bajra) as
revealed by sample farms, 2012-13
The multiple responses of sample farmers regarding the suggestions to improve marketing of
produce of bajra are presented in Table 6.3 (a). The majority of sample farmers of different
categories of farms had suggested to improve the efficiency of government procurement
agencies to purchase maximum quantities of bajra from their farms. This was most important
suggestion as had been revealed by 72.50%, 66.67%, 66.67% of small, medium, and large
sample farmers respectively. Apart from these, the sample farmers had also suggested to
increase the access to information on price to farmers to get the better price of the produce of
bajra and reduce the role of middlemen from the marketing channels.
6.3 (b) Suggestions to improve marketing of produce for competing Crop-II (Maize) as
revealed by sample farms, 2012-13
The suggestions to improve marketing of produce of maize as revealed by different
categories of sample farms are presented in Table 6.3 (b). This table shows that 62.74%,
66.66% and 60.00% of small, medium and large sample farmers respectively had suggested
to increase the efficiency of government procurement agencies in rural areas to open more
purchasing Centres. This was most important suggestion to improve marketing efficiency of
maize.


Table 6.3 (a)
Suggestions to improve marketing of produce for competing crop I (Bajra) as revealed by farmers, sample farms,
2012-13
(% multiple response)
Small Medium Large Overall Suggestions
1 2 3 1 2 3 1 2 3 1 2 3 Increase the access to
information on price
27.50 5.00 50.00 33.33 33.33 44.44 - 50.00 50.00 26.81 23.71 44.48
Decrease Losses during
storage
- - - - - - - - - - - -
Improve the grading
facilities
- 70.00 30.00 - 44.45 44.45 33.33 33.33 33.33 4.12 53.61 35.05
Effective procurement
by Govt. agencies
72.50 25.00 20.00 66.67 22.22 11.11 66.67 16.67 16.67 69.07 22.68 15.47
Decrease Losses during
storage
- - - - - - - - - - -
Any other
- - - - - - - - - - -
Note: Ranks are in order of importance from 1 (most important), 2 ( important), to 3 (least important)

Table 6.3 (b)
Suggestions to improve marketing of produce for competing crop II (Maize) as revealed by farmers, sample farms, 2012-13
(% multiple response)
Small Medium Large Overall Suggestions
1 2 3 1 2 3 1 2 3 1 2 3 Increase the access to
information on price
13.73 52.94 56.86 16.67 46.67 60.00 20.00 20.00 60.00 15.12 48.84 58.14
Decrease Losses during
storage
- - -- - - - - - - - - -
Improve the grading
facilities
23.53 23.53 29.41 16.67 30.00 30.00 20.00 60.00 20.00 20.93 27.90 29.07
Effective procurement by
Govt. agencies
62.74 23.53 13.73 66.66 23.33 10.00 60.00 20.00 20.00 63.95 23.26 12.79
Decrease Losses during
storage
- - - - - - - - - - - -
Any other
- - - - - - - - - - - -
Note: Ranks are in order of importance from 1 (most important), 2 ( important), to 3 (least important)

It is also noticed from table 6.3 (b) that the improvements of grading facilities were also
suggested by 23.53%, 16.67% and 20.00 small, medium and large categories of farms
respectively. They were of the opinion that this was most important aspect to improve
marketing of produce of maize in rural areas. Increase the access to information to improve
marketing of produce of maize was also among important suggestions.
6.3 (c) Suggestions to improve marketing of produce for competing Crop-III (Urd) as
revealed by sample farms, 2012-13
The multiple response of sample farmers regarding their suggestions to improve marketing
efficiency of urd are shown in Table 6.3(c). Table 6.3.(c) reveals that the strengthening of
government procurement agencies is a need of present scenario. It is most important aspect
of marketing of urd. There is a need to establish more and more purchasing centres in remote
villages. Increase the access to information on price at grass root level is very essential and
important. Therefore, it requires more improvement. The grading is also an important
function of marketing of produce of urd to get better price. Hence, improving the grading
facilities in rural areas is also required.
6.4. Suggestions to improve extension activities for competing crops viz bajra, maize
and urd as revealed by sample farmers, 2012-13.
Making agricultural production sustainable is going to require new technologies. There is
less scope for increasing land area than there is for improving yields. The production of
wheat and paddy is based on the unsustainable exploitation of water resources. Hence there is
need to manage land and water resources sustainable. Since, paddy is very water intensive
crop and on account of this, the water table has been going down in paddy growing belts of
western region of Uttar Pradesh. Apart from this, the soil structure is also deteriorating very
fast in the paddy growing belts. In order to over come on this prevailing situation, the farmers
should be advised to grow alternative crops to paddy. The extension department of the state
should take necessary action to promote the alternative crops to paddy. The views of
respondents regarding their suggestions to improve extension activities for competing crops
are presented in Table 6.4. Table shows that the majority of sample farmers of different
categories in a view that the training programmes and

information regarding HYVs should be organized and disseminated on large scale
respectively to motivate the farmers to devote more and more area to bajra, maize and urd
crops. Table 6.4 also reveals that more than 49.48% of the sample growers of bajra were in a
view to increase number of training programmes because it was most important extension
activities to attract the farmers to denote the maximum area under bajra crop. Apart from
this, the information regarding HYVs should also be given to the farmers because it is also
most important activity of extension as has been reported by 34.02% of the sample farmers.
The sample of small, medium and large farmers had revealed that the increase in number of
training programme and dissemination, the information regarding HYVs were most
important extension activities to increase the area under bajra.
As far as maize and urd crops are concerned Table 6.4 shows that the majority of sample
growers of both crops had suggested to increase the number of training programmes and
dissemination of information regarding HYVs as they were more important to motivate the
farmers to substitute the area from paddy to maize and urd. A number of sample farmers
were realizing that these are most important extension activities to increase the production of
maize and urd on their farms (Table 6.4)


Table 6.3 (c)
Suggestions to improve marketing of produce for competing crop III (Urd) as revealed by farmers, sample farms,
2012-13
(% multiple response)
Small Medium Large Overall Suggestions
1 2 3 1 2 3 1 2 3 1 2 3 Increase the access to
information on price
12.50 37.50 50.00 16.67 36.11 47.22 - 66.67 83.35 12.50 41.25 53.75
Decrease Losses during
storage
- - - - - - - - - - - -
Improve the grading
facilities
25.00 50.00 25.00 25.00 50.00 25.00 25.00 16.67 8.33 25.00 45.00 22.50
Effective procurement by
Govt. agencies
62.50 12.50 25.00 38.33 13.89 27.78 75.00 16.66 8.34 62.50 13.75 23.75
Decrease Losses during
storage
- - - - - - - - - - - -
Any other
- - - - - - - - - - - -
Note: Ranks are in order of importance from 1 (most important), 2 ( important), to 3 (least important)

Table 6.4
Suggestions to improve extension activities for the competing crops as revealed by farmers, sample farms, 2012-13
(% multiple response)
Small Medium Large Overall Suggestions
1 2 3 1 2 3 1 2 3 1 2 3
Competing crop I (Bajra)
Increase the number of
training programmes
55.00 20.00 25.00 44.44 22.22 33.33 50.00 33.33 16.67 49.48 22.68 17.53
Information regarding HYVs 30.00 42.50 27.50 35.56 40.00 24.45 41.67 33.33 25.00 34.02 40.21 25.78
Any other 15.00 37.50 47.50 20.00 37.78 42.22 8.33 33.34 58.33 16.50 37.11 46.39
Competing crop II (Maize) Increase the number of
training programmes
47.06 27.45 25.49 46.67 40.00 13.33 40.00 20.00 40.00 46.51 31.40 22.09
Information regarding HYVs 37.26 43.14 19.61 46.67 33.33 20.00 40.00 40.00 20.00 40.70 39.53 19.77
Any other 15.68 29.41 54.90 6.66 26.67 66.67 20.00 40.00 40.00 12.79 29.07 58.14
Competing crop III (Urd)
Increase the number of
training programmes
56.25 31.25 12.50 50.00 25.00 25.00 33.33 41.67 25.00 50.00 30.00 20.00
Information regarding HYVs 31.25 31.25 37.50 36.11 33.33 30.56 50.00 25.00 25.00 36.25 31.25 32.50
Any other 12.50 37.50 50.00 13.89 41.67 44.44 16.67 33.33 50.00 13.75 41.25 45.00
Note: Ranks are in order of importance from 1 (most important), 2 ( important), to 3 (least important)

CHAPTER-7
Summary, Conclusion, Major Findings and Policy Implications
Major findings and Policy Implications to Promote Various Alternative Crops
With the introduction of Green Revolution in India, the use of HYVS, fertilizers,
pesticides and expansion of irrigation networks have increased in manifold which are
core responsible to boost the productivity of rice and wheat in the country. The area
under rice was 37.68 million hectares in 1969-70 in the country which has increased to
44.01 million hectares in 2011-12, thereby showing 16.80% increase over the period. The
area under wheat was 16.63 million hectares in 1969-70 in the country which has gone
upto 29.86 million hectares, showing 79.55% increase over the period. Against this, the
area under coarse cereals in the country has decreased by 44.07% in 2011-12 from the
area of 47.24% million hectares in 1969-70. The rice and wheat are still dominant crops
across the country. Of the total area under foodgrains being 123.57 million hectares in
1969-70 in the country, the share of rice accounted for 30.49% which has increased to
35.28% in 2011-12. The share of area under wheat to total area under foodgrains was
13.45% and 23.94% in 1969-70 and 2011-12 respectively. Thus, area under rice and
wheat jointly accounted for 59.22% to total area of foodgrains in 2011-12 against 43.94%
in 1969-70. On account of higher production, low risk, high margin of profit, better
marking efficiency etc. the farmers were inclined to shift the cropping pattern in favour
of rice and wheat. The cropping pattern on farms has become unbalanced. The soil
health, soil texture etc. are much degraded because of mono cropping system. The
fertility of land has been degrading because of the neglect of pulses and coarse grain
crops in cropping pattern. The continuation of cultivation of rice-wheat in cropping
system is cause of the stagnancy in wheat rice yield, infestation of weeds, depletion of
water tables, incidence of pests and diseases and deterioration of soil health in original
Green Revolution states of the country. Besides these, the net profit of both crops has
been decreasing or stagnant due to adoption of mono cropping sequence such as rice-

wheat. The yield of both crops is more or less stagnant since last few years. Keeping in
view of the importance of above mentioned problems, the Government of India has
launched a programme for crop Diversification in original Green Revolution states of the
country during 2013-14. The finance Ministry has provided an amount Rs 500 crores for
this programme in 9 major rice growing states of the country. Punjab, Haryana and Uttar
Pradesh have also been covered under this programme during 2013-14. The rice-wheat
rotation is very much prevalent across the states of Uttar Pradesh. The state was main
producer of coarse cereals, pulses and oilseeds prior to introduction of Green Revolution.
There was a drastic change in cropping pattern in favour of rice and wheat during post
Green revolution in the state. More than 60% of GCA during 2009-10 was occupied by
rice and wheat crops.
The area under rice and wheat has been continuously increasing in U.P. from 1970-71 to
2010-11. The increase of area of wheat in U.P. is due to decrease in area of rabi coarse
cereals and pulses while cause of increase in area under rice is due to decrease in millet
crops and pulses. The continuing cultivation of paddy has resulted maximum depletion of
groundwater in western districts of Uttar Pradesh. Therefore, the diversification of
cropping pattern from paddy to maize, bajra, urd etc. is much needed in the districts of
western region of Uttar Pradesh. This would be fruitful in improving soil fertility check
depletion of ground water and enhancement of farm income in years to come. In wake of
this emerging scenario in the country, the government of India has advised the states to
motivate the farmers to shift some area towards the production of other crops.
Diversification of cropping pattern specially from paddy towards environment friendly
crops with emphasis on quality output and promotion of agro-processing output and
promotion of agro-processing industry is need of hour.
2. Objectives of the Study
The following objectives have been framed for the study.
1. To examine the production and procurement pattern of paddy in U.P.
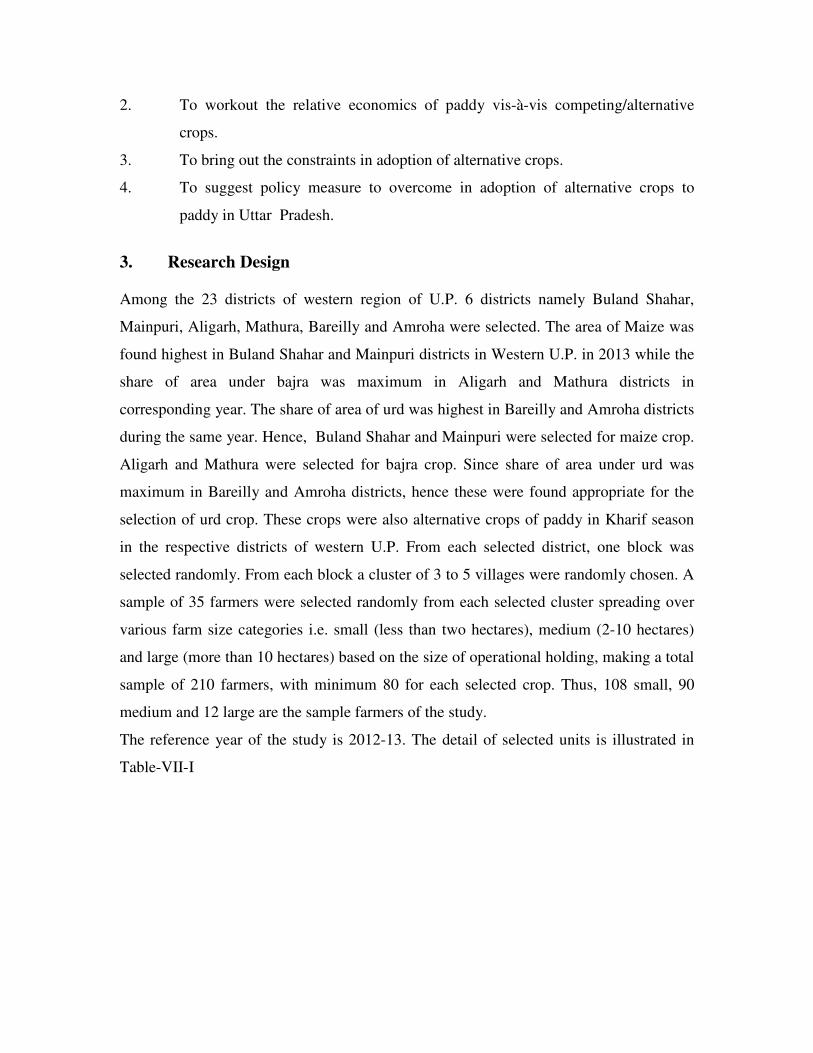
2. To workout the relative economics of paddy vis-à-vis competing/alternative
crops.
3. To bring out the constraints in adoption of alternative crops.
4. To suggest policy measure to overcome in adoption of alternative crops to
paddy in Uttar Pradesh.
3. Research Design
Among the 23 districts of western region of U.P. 6 districts namely Buland Shahar,
Mainpuri, Aligarh, Mathura, Bareilly and Amroha were selected. The area of Maize was
found highest in Buland Shahar and Mainpuri districts in Western U.P. in 2013 while the
share of area under bajra was maximum in Aligarh and Mathura districts in
corresponding year. The share of area of urd was highest in Bareilly and Amroha districts
during the same year. Hence, Buland Shahar and Mainpuri were selected for maize crop.
Aligarh and Mathura were selected for bajra crop. Since share of area under urd was
maximum in Bareilly and Amroha districts, hence these were found appropriate for the
selection of urd crop. These crops were also alternative crops of paddy in Kharif season
in the respective districts of western U.P. From each selected district, one block was
selected randomly. From each block a cluster of 3 to 5 villages were randomly chosen. A
sample of 35 farmers were selected randomly from each selected cluster spreading over
various farm size categories i.e. small (less than two hectares), medium (2-10 hectares)
and large (more than 10 hectares) based on the size of operational holding, making a total
sample of 210 farmers, with minimum 80 for each selected crop. Thus, 108 small, 90
medium and 12 large are the sample farmers of the study.
The reference year of the study is 2012-13. The detail of selected units is illustrated in
Table-VII-I

Table-7-1
Selected Units Name of selected
Crops
Name of Selected Districts
% of area under
selected crops to area under
kharif crops
No. of block selected
No. of village selected
No. of samples selected according to size of farmers
Competing crop-wise selected farmers
<2.00 2-10 More
than 10
Hect.
Total Paddy Bajra Maize Urd
Aligarh 47.09 1 3 16 11 8 35 35 35 16 10 Bajra
Mathura 44.03 1 3 17 18 - 35 35 35 -
B. Shahar 31.00 1 3 18 17 - 35 35 9 35 - Maize
Mainpuri 34.00 1 3 26 9 - 35 35 4 35 -
Bareilly 6.98 1 4 14 17 4 35 35 12 - 35 Urd
Amroha 8.70 1 3 17 18 - 35 35 2 - 35
Total - 6 19 108 90 12 210 210 97 86 80
Note:- All the samples are paddy growers. Few sample farmers had also grown more than
two selected crops on their farms during reference year 2012-13.
4. Major Findings
Since this study is based on secondary and primary data, hence, the findings have been
given separately.
4.A Finding based on secondary data
The trends in area, production and yield for major kharif crops from TE 1970-71 to TE
2012-13 in U.P. and six selected districts of West U.P. have been worked out. The trends
in area, production and yield of paddy and its competing crops during study periods are
given below:

4.A.I The trends in area, production and yield of paddy in U.P. have maintained rising
trends during the study periods. The maximum rate of growth in area and production of
paddy in U.P. was witnessed during TE 2000-01. The pace of growth in production of
paddy was found more than its area and yield during entire periods of study. However,
the area and production of maize in U.P. have maintained decreasing trends during the
corresponding periods. The area under bajra has decreased by 14.74% in TE 2012-13
from the area of 1064.90 thousand hectares in TE 1970-71, while the production and
yield of bajra have maintained rising trends during different study periods.
4.A.II. The area, production and yield of urd in U.P. have also maintained the increasing
trends across the study periods. As far as other important kharif crops in U.P. are
concerned, the area, production and yield have positive growth during the study periods.
Among the major kharif crops in U.P., the maximum down fall in area of maize was
witnessed followed by bajra in U.P. during the study periods.
As far as the trends in area, production and yield of major kharif crops in the selected
districts during mentioned periods are concerned, the following findings have been
observed:-
4.A.III. The area under maize, bajra and oilseeds has maintained decreasing trends
in almost all six selected districts. The area under maize, bajra, pulses and oilseed has
shifted in favour of paddy crop across the selected districts.
4.A.IV. The maximum down fall in area under maize and bajra was witnessed in the
selected districts.
4.A.V. The yield of almost all important kharif crops has maintained rising trends from
period to period.

4.B. Compound annual Growth Rates (CAGR) for major kharif crops in U.P. and six
selected districts has also been estimated at different periods i.e. I (1970-71 to 1984-85),
II (1985-86 to 1999-2000), III (2000-01 to 2012-13) and IV (1970-71-2012-13).
4.B.I. The CAGR of area, production and yield of paddy in U.P. was positive during all
the mentioned periods. Against this, CAGR of area under maize in U.P. was negative
during entire periods of study. The area under bajra in U.P. has been decreasing at the
rate of 0.41% per annum. In contrast of this, the yield of maize and bajra has maintained
rising trends during the mentioned periods.
4.B.II. The CAGR of area, production and yield of urd in U.P. was quite significant
across the different periods of the study. The area, production and yield of urd in U.P.
have maintained rising trends by 3.48%, 5.19% and 1.79% per annum respectively during
the over all period (1970-71 to 2012-13).
4.B.III. The CAGR of area, production and yield of sugarcane has recorded a significant
increase in subsequent period. The area under sugarcane was increasing at the rate of
1.50%, 1.44% and 0.60% per annum during periods -I, II and III respectively.
4.B.IV. The CAGR of area, production and yield of pulses in U.P. was positive during
the entire periods of the study. However, there was a marginal increase in area,
production and yield of foodgrains across the mentioned periods. The area, production
and yield of kharif foodgrains was increasing at the rate of 0.06%, 2.83% and 2.98% per
annum respectively during over all mentioned periods. The position of oilseed in U.P.
was very deplorable during all the periods. The area, production and yield of kharif
oilseeds was decreasing at the rate of 0.35%, 1.98% and 0.98% per annum, during over
all period i.e 1970-71 to 2012-13.
4.C. The selected district-wise compound annual growth rate of area, production and
yield have also been worked out in different periods which are as follows.

4.C.I. The CAGR of area, production and yield of paddy in Aligarh district was found
positive during 4 mentioned periods. However, over all (1970-71 to 2012-13), the annual
growth rate of area under paddy was estimated at 4.11% against 6.60% and 2.40% per
annum growth rate of production and yield respectively. Against this the CAGR of area,
production and yield of bajra (competing crop to paddy) in the district was worked out to
be -1.72%, 0.72% and 2.44% during over all periods i.e. 1970-71 to 2012-13. The growth
rate of area under paddy per annum was much faster than its competing bajra crop in
different periods of the study.
4.C.II. The bajra was also competing crop to paddy in the Mathura district. The growth
rate of area, production and yield of paddy was faster than that of bajra crop during the
study periods. The bajra and maize were not much preferred by farmers of this district
due to lower yield than paddy.
4.C.III. The maize was competing crop to paddy in Bulandshahar and Mainpuri
districts. The area under maize had maintained decreasing trends in four mentioned
periods, while the area under paddy had maintained increasing trends during
corresponding periods. Higher yield, low risk, higher profit etc. of paddy than maize are
being compiled to farmers to devote more area under paddy than maize and other kharif
crops in Buland Shahar and Mainpuri districts.
4.C.IV. The urd was competing crop to paddy in Bareilly and Amroha districts.
The area, production and yield of urd have maintained increasing trends across the
selected periods of the study. However, pace of growth was slow in comparison to paddy
in both districts. The CAGR of area, production and yield of urd was found positive in
different periods. Against this, CAGR of area, production and yield of maize and bajra
was found negative in different study periods in both districts. The increase in area under
paddy in both districts was due to decrease in area of bajra, maize etc. The paddy was
found dominant crop in both districts.

4.C.V. There was no challenge to paddy crop from its competing crops in U.P. as a
whole and six selected districts. However, the pace of growth of area under paddy was
not so fast as it was found in production during different periods of the study.
5. Findings based on Primary Data
As it has already been mentioned that 210 sample households were randomly selected
from six districts of western region of Uttar Pradesh for the study. The following findings
have emerged from the analysis of primary data.
5.I. Out of total 210 sample households, the small households accounted for 51.43%
followed by 42.86% and 5.71% of medium and large households respectively.
5.II. The average size of members on sample household was 9.21 which varied from
8.86 to 13.42 members on small and large sample households respectively. The age of
heads of family members was found maximum above 50 years across the size of
households. The majority of heads of families across the size of sample households were
educated upto metric level. However, 21% of heads of the families of small sample
households were illiterate followed by 11% of medium sample households. The main
occupation of heads of families was agriculture across the size of sample farms.
5.III. The average size of land holding of 210 households was 2.61 hectares which was
fully irrigated. Over all, the average size of operational holdings was worked out to be
3.04 hectares against 13.29 ha., 3.74 ha. and 1.32 ha. on large, medium and small size of
sample households. The operational holdings across the sample farms were fully irrigated
and cultivated.
5.IV. The farm inventory across the size of sample households was sound. Almost all
essential farm assets had been kept by the sample farmers, however large sample farmers
had better farm inventory than medium and small sample farmers. The tractors, trolly,

harrow, electric and diesel engines, spry pumps etc, were adequate in numbers across the
size of farms.
5.V. The cropping intensity was about 200% across the sample size of farms. The
paddy and wheat were dominant crops which accounted for 56.64% and 41.02% to net
cropped area respectively during reference year. The important crops on the sample farms
were bajra, vegetables, mustard, maize, urd, sugarcane across the size of sample farms.
Out of total area under kharif season across the sample farms, bajra, maize and urd
accounted for 17.83%, 10.91% and 14.4% respectively. The diversion of net area towards
bajra, maize and urd was not much popular on small size of sample farms but it was
found more on large size of sample farms.
5.VI. The sample farmers have been giving importance to bajra and maize in the
cropping pattern.
5.VII. The average production of paddy per farm was 56.97 qtls against 17.42 qtls and
10.52 qtls and 4.02 qtls of bajra, maize and urd respectively. Out of total production of
paddy being 56.97 qtls per farm, 91.82% was sold and 8.12% retained. None of sample
farmers had retained paddy for seed purpose during reference year. Out of total per farm
production of bajra, 89.90% was sold and rest 10.10% retained for different purposes.
Against this, 88.21 per farm of total production of maize was sold and rest 11.79%
retained by sample farmers. The bajra and maize were also retained for self consumption,
seed feed etc. Out of total per farm production of urd, 89.30% was sold and 10.70%
retained.
5.VIII. The per qtls price of paddy was Rs 2539 against per qtl price of Rs 1328 of maize
followed by Rs 1104 of bajra. The per qtls price of urd was Rs 3551 in reference year.
5.IX. The paddy, bajra, maize and urd were sold to only local traders by the sample
farmers. None of other marketing functionaries was involved in purchasing of paddy,
bajra, maize in the study areas.

5.X. The input use pattern for paddy was more or less common across the size of farms.
The human labour and machine labour were major components of inputs for paddy crop.
The human labour days were per ha. was 93 in paddy against 42.40 and 33 days per ha. in
maize, bajra and urd respectively. However the machine labour hours was marginally
higher being 12 hrs on paddy against 11.07 hrs, 10.52 hrs, 9.95 hrs in bajra, urd and
maize respectively. The fertilizers pesticides and irrigation were also used by sample
farmers in paddy, bajra, maize and urd. The per ha. expenditure on fertilizer was Rs 4,582
in paddy against Rs 2688, Rs 1,193 and Rs 863 in maize bajra and urd respectively. The
expenditure seed was maximum in maize followed by paddy. The family labour days
were much engaged by small farmers than medium and large farmers in the cultivation of
paddy, bajra, maize and urd while the machine labour days were much used by the large
sample farmers than the medium and small farmers. The per ha. variable cost is worked
out to be Rs 39,372 in the cultivation of paddy against Rs. 21,077, Rs 17,290 and Rs
15,637 in maize, bajra and urd respectively. The per ha. yield of paddy was 45.72 qtls
against 32.89 qtls, 32.44 qtls and Rs. 12.04 qtls in bajra, maize and urd respectively. The
per qtl price of paddy, maize, bajra and urd was Rs 2519, Rs 1345, Rs 1104 and Rs 3551
respectively during the reference year. It shows that per qtls price of paddy was higher by
46.8% and 56.35% over its price of maize and bajra respectively.
5.XI. The per ha. net income of paddy is worked out to be Rs 76,254 against Rs 27,117,
Rs 22,555 and Rs 19,021 in urd, maize and bajra respectively. It reflects that per ha. net
income from paddy is higher by 64.44%, 70.42% and 75.60% from per ha. net income of
urd, maize and bajra respectively. The returns over variable cost was maximum being Rs.
1.94 in paddy followed by Rs 1.73, Rs 1.10 and 1.07 in urd, bajra and maize respectively.
It reflects that paddy is much more remunerative crop across the sample size of farms
than its competing crops during reference years. The higher yield and better market price
of paddy were attributed to higher net income in comparison to its competing crops viz
bajra, maize and urd. Hence, the paddy was dominant crop on the sample farms of
selected districts of western region of U.P.

5.XII. The attractive price in the markets suitable soil, climatic conditions and
government support were most important reasons for attraction for competing crops on
the sample farms.
5.XIII. The marketing of produce of paddy, bajra, maize and urd was most important
problems as had been revealed by sample farmers. The weeds, environment and non
availability of inputs were important problems in the cultivation of competing crops. The
diseases, pests, weeds etc were only slight problem in the cultivation of competing crops
during reference year.
5.XIV. The environmental stress was not sever problems on the sample farms. It was
only moderate problems in the reference year.
5.XV. Non-availability of disease resistant varieties shortage of labour, non-availability
of quality seeds and shortage of land were seven problem during the production of
competing crops.
6. Policy Implications
Since the paddy is a dominant crop in Kharif season in almost all the districts of western
region of Uttar Pradesh, therefore, depletion of ground water, attack of pests and
diseases, infestation of weeds etc. are the common phenomena for this region. The
fertility of land has also been decreasing year by year in rice growing belts of western
U.P. On account of this, the yield of rice has been decreasing or it is more or less stagnant
since last decade. The eco-agro system is also deteriorating due to adoption of mono crop
rotation. The maize, bajra, urd etc are the competing crops to paddy crop of western
region of U.P. In order to popularize the maize, bajra, urd etc in cropping pattern in place
of paddy crop, the following suggestions have been recommended to motivate the
farmers to devote some area to its competing crops, namely maize, bajra, urd etc.
I. There is a need to increase the production and marketing efficiency of maize,
bajra and urd to provide the best scientific techniques to the farmers.
II. The marketing structures of competing crops are not well developed at par with
paddy crop. Therefore, the state government should improve the existing
infrastructure facilities to provide better access to maize, bajra and urd in the
markets.
III. The coarse cereals, pulses and oilseeds can not be grown in low laying areas and
flooded fields. Therefore, drainage net works should be expanded in low laying
and flooded areas to enable the farmers to grow the maize and bajra in place of
paddy during kharif season.
IV. The per hectare average yield of paddy is about 45.72 qtls against the average
yield of 35.44 qtls, 33.18 qtls, 11.78 qtls of maize, bajra and urd. It shows that the
average yield of paddy is much higher than its competing crops. Therefore, the
high yield of seeds of maize, bajra and urd should be available at reasonable
prices and well before sowing times. The Seed Replacing Rates (SRR) of maize,
bajra and urd is much less as compared to SRR of paddy. Therefore, an effort
should made by research scientists to make available certificate seeds of maize,
bajra, urd etc at par with certified seeds of paddy.
V. The extension department of state should organize training programme at village
level to tell farmers about the bad consequence due to repetition of rice and wheat
crop rotation. The farmers should be advised to devote some area to maize, bajra
and urd to maintain dynamic, equilibrium of agro-system.
VI. The demonstration and promotion of improved production techniques of
alternative crops should be organized at grass root level for diversion of paddy
cultivation.
VII. The farmers should be advised to grow leguminous crops to restore the soil
fertility.

VIII. The guidelines for crop diversification in original Green Revolution states issued
by Government of India should be implemented in rice growing belts of the state.
This will motivate the farmers to choose appropriate crop alternatives.
IX. The total assistance of crop Diversification Programme should be available to
farmers to establish agro-based food processing units to generate additional
income and restore soil fertility.
X. There is a need to increase the MSP of bajra, maize and urd to attract the farmers
to devote the maximum area under bajra, maize, urd crops during kharif season.
XI. The researchers should take sincere efforts to evolve short duration drought
tolerant and excess moisture tolerant varieties of bajra, maize and urd at par with
evolved varieties of paddy.
XII. There is a need to improve the efficiency of government procurement agencies to
purchase maximum quantities of produce of bajra, maize and urd at minimum
support price from the farmers.

References
Books
1. Asthana B.N. and Srivastava S.S. – Applied Statistics of India, Chaitana
Publishing House, Allahabad
2. Dhondyal S.P. and Tandon R.K.- Principals and Methodology of Farm
Management Published by Joshi 34/24 Azad Nagar, Kanpur, 1974.
3. Dhondyal S.P. and Will.s J.E - A guide to Research Methodology in Agricultural
Economics and Other Social Sciences Published by Lions Publications Civil
Lines, Kanpur, 1967.
4. Dixit R.S. -Agricultural Marketing in India Published by Shubhi Publication 15
A.K. D Towers Sector-14 Gurgaon. Haryana.
5. Govil R.K. and Tripathi B.K. - Agricultural Economy of India Published by
Kitab Mahal, 22 Sarogani Naidu Marg, Allahabad (2010)
6. Singh H.K. and Singh Meera - Marketing Management Published by A, P.H.
Publishing Corporation, 5, Ansari Road Daryaganj, New Delhi (2005)
Publications and Research Papers
1. Directorate of Economics and Statistics, Department of agriculture and
Cooperation, Ministry of Agriculture, Government of India :–
Agricultural Statistics at a glance 2008
2. Directorate of Economics and Statistics, Department of agriculture and
Cooperation, Ministry of Agriculture, Government of India :–
Agricultural Statistics at a glance 2010
3. Directorate of Economics and Statistics, Department of agriculture and
Cooperation, Ministry of Agriculture, Government of India :–
Agricultural Statistics at a glance 2013
4. Economics and Statistics Department, State Planning Institute:-
Uttar Pradesh, Statistical Diary (2006)
5. Economics and Statistics Department, State Planning Institute:-
Uttar Pradesh, Statistical Diary (2011)
6. Economics and Statistics Department, State Planning Institute:-
Uttar Pradesh, Statistical Diary (2012)
7. U.P. Government, Department of Agriculture, Krishi Bhawan, Lucknow, Uttar
Pradesh:-
Intensive Cultivation of Kharif Crops (2011)
Research Paper
1. Dimension of Food Security in a Selected State- Uttar Pradesh by Rukhsana
2. Growth and Inequality in Agriculture (August 1984) by Govil R.K., Department
of Economics, University of Allahabad (Research Study Project ICSSR) Printed
at Seshsewa Press 10 Sammelan Marg, Allahabad.
Journals
1. Agricultural Situation in India Nov. 2007, Directorate of Economics and
Statistics, Department of Agriculture and Cooperation, Ministry of Agriculture,
Govt. of India.
2. Agricultural Situation in India, December 2007, Directorate of Economics and
Statistics, Department of Agriculture and Cooperation, Ministry of Agriculture,
Govt. of India.
3. Agricultural Situation in India, November, 2012, Directorate of Economics and
Statistics, Department of Agriculture and Cooperation, Ministry of Agriculture,
Govt. of India.

4. Agricultural Out Look and Situation, Analysis Reports June 2014 (Third Semi-
annual) Medium-Term, Agricultural Outlook Report Prepared by National –
Council of Applied Economic Research.
5. Crop Diversification Programme in Haryana, Punjab and Western Uttar Pradesh,
Sustainable Agriculture with increased productivity and profitability 2013-14.
Govt. of India, Ministry of Agriculture and Cooperation, Crops Division, Krishi
Bhawan, New Delhi 110011.
6. Rural 21, The International Journal for Rural Development No4/2013, Volume
47, ISSN 1866-8011, D205066 F Agricultural Policies- Finding the Right
Approach.

Appendix-1
Comments on the report “Possibilities and Constraints in Adoption of Alternative
Crops to Paddy in Green Revolution belt of North India (Western U.P.)” submitted
by AERC, Allahabad
1. Title of the Draft report examined:
Possibilities and Constraints in Adoption of Alternative Crops to Paddy in Green
Revolution belt of North India (Western U.P.)
2. Date of receipt of the Draft report: March 2, 2015
3. Date of dispatch of the report: March 16, 2015
4. Comments on the Objectives of the study:
The study addresses all the four objectives set forth for the study.
5. Comments on the methodology
The study has adopted a common methodology proposed for all the coordinating centres.
The details of statistical analysis carried out in the report is missing which can be
incorporated.
6. Comments on analysis, organization, presentation etc.
Report is analytically good and presents the results in a lucid manner. For
compilation/consolidation of the report, I request you to address to the following gaps
and inadequacies, so that uniformity may be maintained which will immensely help in
compilation/ consolidation of the report by our centre.
I. In Table 3.5.1 (a to c) and 4.2 (a to c) the percentage to total may be
incorporated to draw meaningful information.
II. In Tables related to CAGR, the level of significance may be incorporated to
facilitate uniformity in consolidated of the report.
III. The prices provided in table 3.5.2 (a), seems to be mixed for paddy and
basmati-paddy, which need to be separated out for indepth analysis as for
other competing crops viz. maize, bajra and cotton. This basmati paddy crops
may be treated as one of the alternative crop to paddy to explore the
possibilities of further acreage expansion under the crop.
IV. Table 2.2 seems to be related to paddy crop, whereas shows kharif crops.
V. In Table 3.3 the total present value may also be incorporated to draw
meaningful conclusion.
VI. In Table 3.5,2 the quantity may be provided on Q/Farm basis to facilitate
uniformity in consolidation of the report.
VII. The regression analysis studying the factors affecting crop productivities
needs to be revisited and modify Table 4.4.1 and 4.4.2 accordingly. For your

reference/assistance the analysis done by AERC, Ludhiana is being sent to
you for doing the needful.
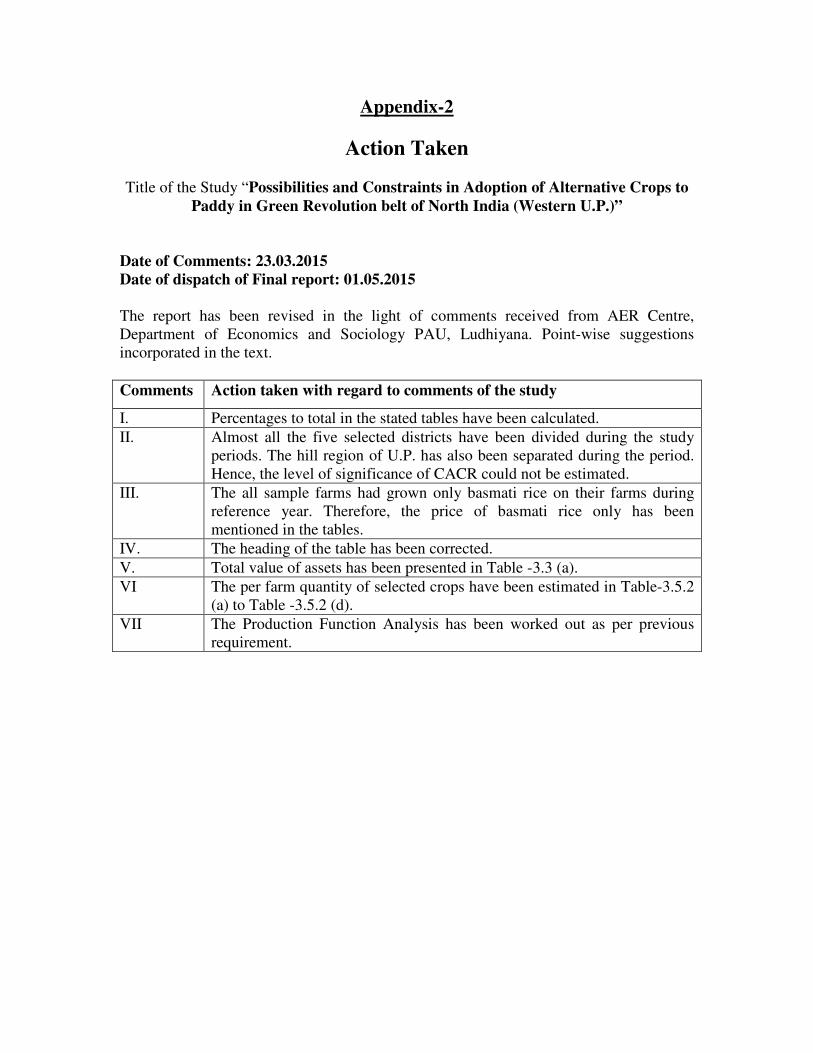
Appendix-2
Action Taken
Title of the Study “Possibilities and Constraints in Adoption of Alternative Crops to
Paddy in Green Revolution belt of North India (Western U.P.)”
Date of Comments: 23.03.2015
Date of dispatch of Final report: 01.05.2015
The report has been revised in the light of comments received from AER Centre,
Department of Economics and Sociology PAU, Ludhiyana. Point-wise suggestions
incorporated in the text.
Comments Action taken with regard to comments of the study
I. Percentages to total in the stated tables have been calculated.
II. Almost all the five selected districts have been divided during the study
periods. The hill region of U.P. has also been separated during the period.
Hence, the level of significance of CACR could not be estimated.
III. The all sample farms had grown only basmati rice on their farms during
reference year. Therefore, the price of basmati rice only has been
mentioned in the tables.
IV. The heading of the table has been corrected.
V. Total value of assets has been presented in Table -3.3 (a).
VI The per farm quantity of selected crops have been estimated in Table-3.5.2
(a) to Table -3.5.2 (d).
VII The Production Function Analysis has been worked out as per previous
requirement.

Study No. 142 Publication No. 190
Executive Summary
Possibilities and Constraints in Adoption of Alternative
Crops to Paddy in Green Revolution belt of North India
(Western U.P.)
Prof. Ramendu Roy
2014
AgroAgroAgroAgro----Economic Research CentreEconomic Research CentreEconomic Research CentreEconomic Research Centre
University of AllahabadUniversity of AllahabadUniversity of AllahabadUniversity of Allahabad AllahabadAllahabadAllahabadAllahabad----211002 211002 211002 211002

Executive Summary
Summary, Conclusion, Major Findings and Policy Implications
Major findings and Policy Implications to Promote Various Alternative Crops
With the introduction of Green Revolution in India, the use of HYVS, fertilizers,
pesticides and expansion of irrigation networks have increased in manifold which are
core responsible to boost the productivity of rice and wheat in the country. The area
under rice was 37.68 million hectares in 1969-70 in the country which has increased to
44.01 million hectares in 2011-12, thereby showing 16.80% increase over the period. The
area under wheat was 16.63 million hectares in 1969-70 in the country which has gone
upto 29.86 million hectares, showing 79.55% increase over the period. Against this, the
area under coarse cereals in the country has decreased by 44.07% in 2011-12 from the
area of 47.24% million hectares in 1969-70. The rice and wheat are still dominant crops
across the country. Of the total area under foodgrains being 123.57 million hectares in
1969-70 in the country, the share of rice accounted for 30.49% which has increased to
35.28% in 2011-12. The share of area under wheat to total area under foodgrains was
13.45% and 23.94% in 1969-70 and 2011-12 respectively. Thus, area under rice and
wheat jointly accounted for 59.22% to total area of foodgrains in 2011-12 against 43.94%
in 1969-70. On account of higher production, low risk, high margin of profit, better
marking efficiency etc. the farmers were inclined to shift the cropping pattern in favour
of rice and wheat. The cropping pattern on farms has become unbalanced. The soil
health, soil texture etc. are much degraded because of mono cropping system. The
fertility of land has been degrading because of the neglect of pulses and coarse grain
crops in cropping pattern. The continuation of cultivation of rice-wheat in cropping
system is cause of the stagnancy in wheat rice yield, infestation of weeds, depletion of
water tables, incidence of pests and diseases and deterioration of soil health in original
Green Revolution states of the country. Besides these, the net profit of both crops has
been decreasing or stagnant due to adoption of mono cropping sequence such as rice-
wheat. The yield of both crops is more or less stagnant since last few years. Keeping in

view of the importance of above mentioned problems, the Government of India has
launched a programme for crop Diversification in original Green Revolution states of the
country during 2013-14. The finance Ministry has provided an amount Rs 500 crores for
this programme in 9 major rice growing states of the country. Punjab, Haryana and Uttar
Pradesh have also been covered under this programme during 2013-14. The rice-wheat
rotation is very much prevalent across the states of Uttar Pradesh. The state was main
producer of coarse cereals, pulses and oilseeds prior to introduction of Green Revolution.
There was a drastic change in cropping pattern in favour of rice and wheat during post
Green revolution in the state. More than 60% of GCA during 2009-10 was occupied by
rice and wheat crops.
The area under rice and wheat has been continuously increasing in U.P. from 1970-71 to
2010-11. The increase of area of wheat in U.P. is due to decrease in area of rabi coarse
cereals and pulses while cause of increase in area under rice is due to decrease in millet
crops and pulses. The continuing cultivation of paddy has resulted maximum depletion of
groundwater in western districts of Uttar Pradesh. Therefore, the diversification of
cropping pattern from paddy to maize, bajra, urd etc. is much needed in the districts of
western region of Uttar Pradesh. This would be fruitful in improving soil fertility check
depletion of ground water and enhancement of farm income in years to come. In wake of
this emerging scenario in the country, the government of India has advised the states to
motivate the farmers to shift some area towards the production of other crops.
Diversification of cropping pattern specially from paddy towards environment friendly
crops with emphasis on quality output and promotion of agro-processing output and
promotion of agro-processing industry is need of hour.
2. Objectives of the Study
The following objectives have been framed for the study.
1. To examine the production and procurement pattern of paddy in U.P.
2. To workout the relative economics of paddy vis-à-vis competing/alternative
crops.
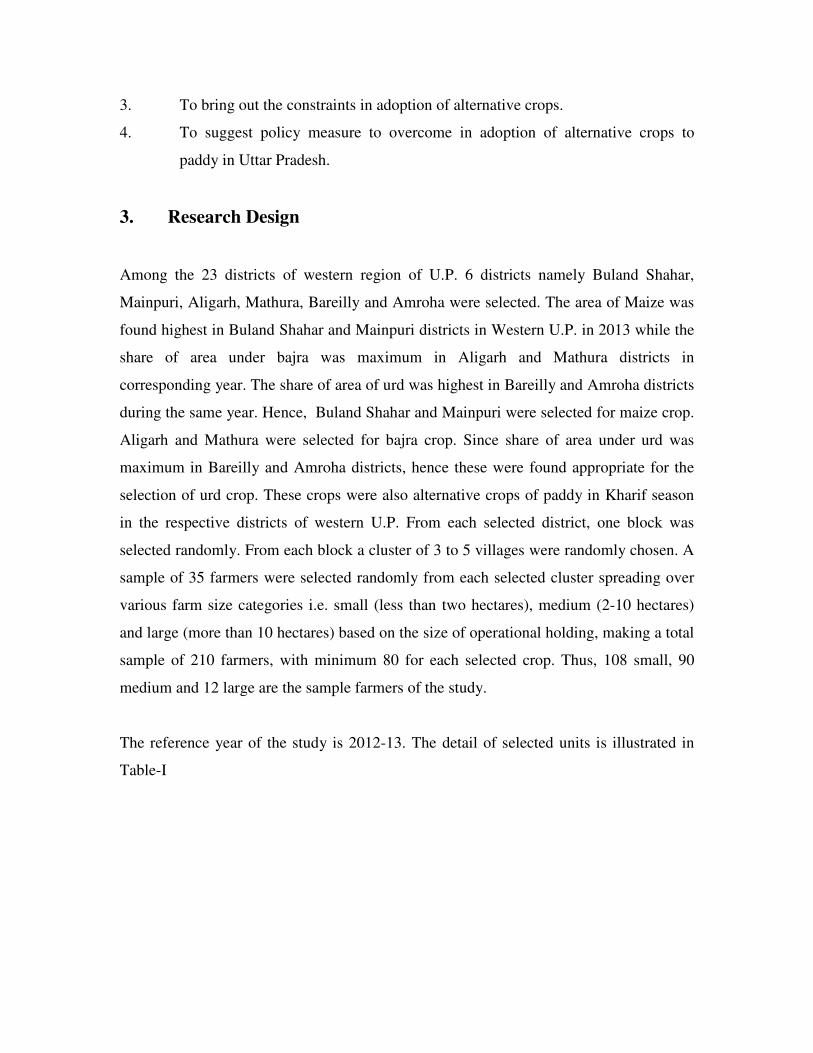
3. To bring out the constraints in adoption of alternative crops.
4. To suggest policy measure to overcome in adoption of alternative crops to
paddy in Uttar Pradesh.
3. Research Design
Among the 23 districts of western region of U.P. 6 districts namely Buland Shahar,
Mainpuri, Aligarh, Mathura, Bareilly and Amroha were selected. The area of Maize was
found highest in Buland Shahar and Mainpuri districts in Western U.P. in 2013 while the
share of area under bajra was maximum in Aligarh and Mathura districts in
corresponding year. The share of area of urd was highest in Bareilly and Amroha districts
during the same year. Hence, Buland Shahar and Mainpuri were selected for maize crop.
Aligarh and Mathura were selected for bajra crop. Since share of area under urd was
maximum in Bareilly and Amroha districts, hence these were found appropriate for the
selection of urd crop. These crops were also alternative crops of paddy in Kharif season
in the respective districts of western U.P. From each selected district, one block was
selected randomly. From each block a cluster of 3 to 5 villages were randomly chosen. A
sample of 35 farmers were selected randomly from each selected cluster spreading over
various farm size categories i.e. small (less than two hectares), medium (2-10 hectares)
and large (more than 10 hectares) based on the size of operational holding, making a total
sample of 210 farmers, with minimum 80 for each selected crop. Thus, 108 small, 90
medium and 12 large are the sample farmers of the study.
The reference year of the study is 2012-13. The detail of selected units is illustrated in
Table-I

Table-1
Selected Units Name of selected
Crops
Name of Selected Districts
% of area under
selected crops to area under
kharif crops
No. of block selected
No. of village selected
No. of samples selected according to size of farmers
Competing crop-wise selected farmers
<2.00 2-10 More
than 10
Hect.
Total Paddy Bajra Maize Urd
Aligarh 47.09 1 3 16 11 8 35 35 35 16 10 Bajra
Mathura 44.03 1 3 17 18 - 35 35 35 -
B. Shahar 31.00 1 3 18 17 - 35 35 9 35 - Maize
Mainpuri 34.00 1 3 26 9 - 35 35 4 35 -
Bareilly 6.98 1 4 14 17 4 35 35 12 - 35 Urd
Amroha 8.70 1 3 17 18 - 35 35 2 - 35
Total - 6 19 108 90 12 210 210 97 86 80
Note:- All the samples are paddy growers. Few sample farmers had also grown more than
two selected crops on their farms during reference year 2012-13.
4. Major Findings
Since this study is based on secondary and primary data, hence, the findings have been
given separately.
4.A Finding based on secondary data
The trends in area, production and yield for major kharif crops from TE 1970-71 to TE
2012-13 in U.P. and six selected districts of West U.P. have been worked out. The trends
in area, production and yield of paddy and its competing crops during study periods are
given below:
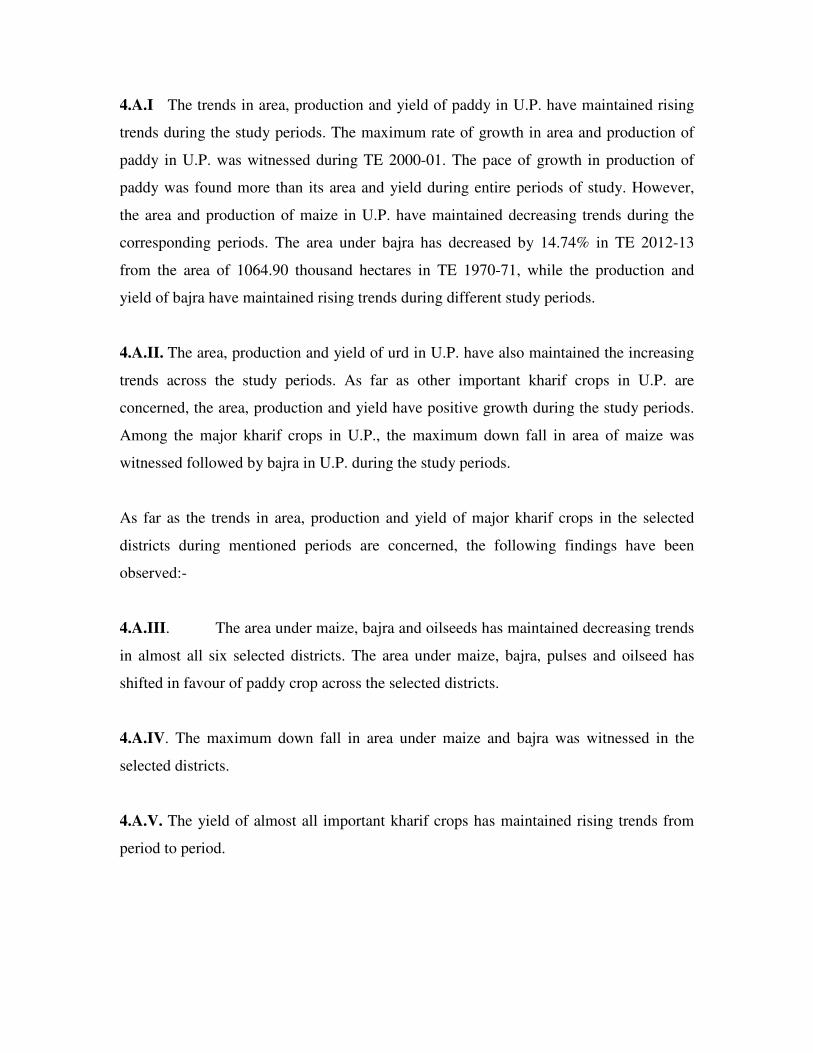
4.A.I The trends in area, production and yield of paddy in U.P. have maintained rising
trends during the study periods. The maximum rate of growth in area and production of
paddy in U.P. was witnessed during TE 2000-01. The pace of growth in production of
paddy was found more than its area and yield during entire periods of study. However,
the area and production of maize in U.P. have maintained decreasing trends during the
corresponding periods. The area under bajra has decreased by 14.74% in TE 2012-13
from the area of 1064.90 thousand hectares in TE 1970-71, while the production and
yield of bajra have maintained rising trends during different study periods.
4.A.II. The area, production and yield of urd in U.P. have also maintained the increasing
trends across the study periods. As far as other important kharif crops in U.P. are
concerned, the area, production and yield have positive growth during the study periods.
Among the major kharif crops in U.P., the maximum down fall in area of maize was
witnessed followed by bajra in U.P. during the study periods.
As far as the trends in area, production and yield of major kharif crops in the selected
districts during mentioned periods are concerned, the following findings have been
observed:-
4.A.III. The area under maize, bajra and oilseeds has maintained decreasing trends
in almost all six selected districts. The area under maize, bajra, pulses and oilseed has
shifted in favour of paddy crop across the selected districts.
4.A.IV. The maximum down fall in area under maize and bajra was witnessed in the
selected districts.
4.A.V. The yield of almost all important kharif crops has maintained rising trends from
period to period.

4.B. Compound annual Growth Rates (CAGR) for major kharif crops in U.P. and six
selected districts has also been estimated at different periods i.e. I (1970-71 to 1984-85),
II (1985-86 to 1999-2000), III (2000-01 to 2012-13) and IV (1970-71-2012-13).
4.B.I. The CAGR of area, production and yield of paddy in U.P. was positive during all
the mentioned periods. Against this, CAGR of area under maize in U.P. was negative
during entire periods of study. The area under bajra in U.P. has been decreasing at the
rate of 0.41% per annum. In contrast of this, the yield of maize and bajra has maintained
rising trends during the mentioned periods.
4.B.II. The CAGR of area, production and yield of urd in U.P. was quite significant
across the different periods of the study. The area, production and yield of urd in U.P.
have maintained rising trends by 3.48%, 5.19% and 1.79% per annum respectively during
the over all period (1970-71 to 2012-13).
4.B.III. The CAGR of area, production and yield of sugarcane has recorded a significant
increase in subsequent period. The area under sugarcane was increasing at the rate of
1.50%, 1.44% and 0.60% per annum during periods -I, II and III respectively.
4.B.IV. The CAGR of area, production and yield of pulses in U.P. was positive during
the entire periods of the study. However, there was a marginal increase in area,
production and yield of foodgrains across the mentioned periods. The area, production
and yield of kharif foodgrains was increasing at the rate of 0.06%, 2.83% and 2.98% per
annum respectively during over all mentioned periods. The position of oilseed in U.P.
was very deplorable during all the periods. The area, production and yield of kharif
oilseeds was decreasing at the rate of 0.35%, 1.98% and 0.98% per annum, during over
all period i.e 1970-71 to 2012-13.
4.C. The selected district-wise compound annual growth rate of area, production and
yield have also been worked out in different periods which are as follows.
4.C.I. The CAGR of area, production and yield of paddy in Aligarh district was found
positive during 4 mentioned periods. However, over all (1970-71 to 2012-13), the annual
growth rate of area under paddy was estimated at 4.11% against 6.60% and 2.40% per
annum growth rate of production and yield respectively. Against this the CAGR of area,
production and yield of bajra (competing crop to paddy) in the district was worked out to
be -1.72%, 0.72% and 2.44% during over all periods i.e. 1970-71 to 2012-13. The growth
rate of area under paddy per annum was much faster than its competing bajra crop in
different periods of the study.
4.C.II. The bajra was also competing crop to paddy in the Mathura district. The growth
rate of area, production and yield of paddy was faster than that of bajra crop during the
study periods. The bajra and maize were not much preferred by farmers of this district
due to lower yield than paddy.
4.C.III. The maize was competing crop to paddy in Bulandshahar and Mainpuri
districts. The area under maize had maintained decreasing trends in four mentioned
periods, while the area under paddy had maintained increasing trends during
corresponding periods. Higher yield, low risk, higher profit etc. of paddy than maize are
being compiled to farmers to devote more area under paddy than maize and other kharif
crops in Buland Shahar and Mainpuri districts.
4.C.IV. The urd was competing crop to paddy in Bareilly and Amroha districts.
The area, production and yield of urd have maintained increasing trends across the
selected periods of the study. However, pace of growth was slow in comparison to paddy
in both districts. The CAGR of area, production and yield of urd was found positive in
different periods. Against this, CAGR of area, production and yield of maize and bajra
was found negative in different study periods in both districts. The increase in area under
paddy in both districts was due to decrease in area of bajra, maize etc. The paddy was
found dominant crop in both districts.

4.C.V. There was no challenge to paddy crop from its competing crops in U.P. as a
whole and six selected districts. However, the pace of growth of area under paddy was
not so fast as it was found in production during different periods of the study.
5. Findings based on Primary Data
As it has already been mentioned that 210 sample households were randomly selected
from six districts of western region of Uttar Pradesh for the study. The following findings
have emerged from the analysis of primary data.
5.I. Out of total 210 sample households, the small households accounted for 51.43%
followed by 42.86% and 5.71% of medium and large households respectively.
5.II. The average size of members on sample household was 9.21 which varied from
8.86 to 13.42 members on small and large sample households respectively. The age of
heads of family members was found maximum above 50 years across the size of
households. The majority of heads of families across the size of sample households were
educated upto metric level. However, 21% of heads of the families of small sample
households were illiterate followed by 11% of medium sample households. The main
occupation of heads of families was agriculture across the size of sample farms.
5.III. The average size of land holding of 210 households was 2.61 hectares which was
fully irrigated. Over all, the average size of operational holdings was worked out to be
3.04 hectares against 13.29 ha., 3.74 ha. and 1.32 ha. on large, medium and small size of
sample households. The operational holdings across the sample farms were fully irrigated
and cultivated.
5.IV. The farm inventory across the size of sample households was sound. Almost all
essential farm assets had been kept by the sample farmers, however large sample farmers
had better farm inventory than medium and small sample farmers. The tractors, trolly,

harrow, electric and diesel engines, spry pumps etc, were adequate in numbers across the
size of farms.
5.V. The cropping intensity was about 200% across the sample size of farms. The
paddy and wheat were dominant crops which accounted for 56.64% and 41.02% to net
cropped area respectively during reference year. The important crops on the sample farms
were bajra, vegetables, mustard, maize, urd, sugarcane across the size of sample farms.
Out of total area under kharif season across the sample farms, bajra, maize and urd
accounted for 17.83%, 10.91% and 14.4% respectively. The diversion of net area towards
bajra, maize and urd was not much popular on small size of sample farms but it was
found more on large size of sample farms.
5.VI. The sample farmers have been giving importance to bajra and maize in the
cropping pattern.
5.VII. The average production of paddy per farm was 56.97 qtls against 17.42 qtls and
10.52 qtls and 4.02 qtls of bajra, maize and urd respectively. Out of total production of
paddy being 56.97 qtls per farm, 91.82% was sold and 8.12% retained. None of sample
farmers had retained paddy for seed purpose during reference year. Out of total per farm
production of bajra, 89.90% was sold and rest 10.10% retained for different purposes.
Against this, 88.21 per farm of total production of maize was sold and rest 11.79%
retained by sample farmers. The bajra and maize were also retained for self consumption,
seed feed etc. Out of total per farm production of urd, 89.30% was sold and 10.70%
retained.
5.VIII. The per qtls price of paddy was Rs 2539 against per qtl price of Rs 1328 of maize
followed by Rs 1104 of bajra. The per qtls price of urd was Rs 3551 in reference year.
5.IX. The paddy, bajra, maize and urd were sold to only local traders by the sample
farmers. None of other marketing functionaries was involved in purchasing of paddy,
bajra, maize in the study areas.

5.X. The input use pattern for paddy was more or less common across the size of farms.
The human labour and machine labour were major components of inputs for paddy crop.
The human labour days were per ha. was 93 in paddy against 42.40 and 33 days per ha. in
maize, bajra and urd respectively. However the machine labour hours was marginally
higher being 12 hrs on paddy against 11.07 hrs, 10.52 hrs, 9.95 hrs in bajra, urd and
maize respectively. The fertilizers pesticides and irrigation were also used by sample
farmers in paddy, bajra, maize and urd. The per ha. expenditure on fertilizer was Rs 4,582
in paddy against Rs 2688, Rs 1,193 and Rs 863 in maize bajra and urd respectively. The
expenditure seed was maximum in maize followed by paddy. The family labour days
were much engaged by small farmers than medium and large farmers in the cultivation of
paddy, bajra, maize and urd while the machine labour days were much used by the large
sample farmers than the medium and small farmers. The per ha. variable cost is worked
out to be Rs 39,372 in the cultivation of paddy against Rs. 21,077, Rs 17,290 and Rs
15,637 in maize, bajra and urd respectively. The per ha. yield of paddy was 45.72 qtls
against 32.89 qtls, 32.44 qtls and Rs. 12.04 qtls in bajra, maize and urd respectively. The
per qtl price of paddy, maize, bajra and urd was Rs 2519, Rs 1345, Rs 1104 and Rs 3551
respectively during the reference year. It shows that per qtls price of paddy was higher by
46.8% and 56.35% over its price of maize and bajra respectively.
5.XI. The per ha. net income of paddy is worked out to be Rs 76,254 against Rs 27,117,
Rs 22,555 and Rs 19,021 in urd, maize and bajra respectively. It reflects that per ha. net
income from paddy is higher by 64.44%, 70.42% and 75.60% from per ha. net income of
urd, maize and bajra respectively. The returns over variable cost was maximum being Rs.
1.94 in paddy followed by Rs 1.73, Rs 1.10 and 1.07 in urd, bajra and maize respectively.
It reflects that paddy is much more remunerative crop across the sample size of farms
than its competing crops during reference years. The higher yield and better market price
of paddy were attributed to higher net income in comparison to its competing crops viz
bajra, maize and urd. Hence, the paddy was dominant crop on the sample farms of
selected districts of western region of U.P.

5.XII. The statistical estimates relate to economic efficiency of resource use in farming
sector across three groups of farmers (small, medium and large) and across four crops
(paddy, Bajra, Maize and Urd).
Paddy: On the basis of t-statistics of coefficients, the major contributors to revenue
(MVP) for paddy are Human Labour, Machine Labour and Fertilizers. For Cost, (MFC),
the significant inputs are Human Labour, Seed and Fertilizers. The overall results for this
estimation indicate existence of productive efficiency in paddy.
Bajra: For bajra MVP, significant input is only Machine Labour and for MFC, Human
Labour, Machine Labour and Seeds are significant. This may be indicating that
mechanization may be at the cost of human labour. In other words, the terms of trade for
human labour do not seem good in the case of bajra. The ratio (MVP/MFC), however still
indicates productive efficiency. The R2 in case of bajra MVP is also very poor, indicating
that the market terms of trade are good for the farmers but not for human labour which is
insignificant in the MVP equation but not in the MFC equation.
Maize: For the crop of maize, only plant protection and machine labour seem to be
significant contributors to revenue (MVP) while fertilizer shows a negative relationship.
For MFC, the major components of cost are being formed by seed and fertilizers only.
The ratio MVP/MFC is also not significant indicating inefficient use of resources in
maize.
Urd: For Urd, significant contributers are the inputs Machine Labour and Seed while
major contributors to cost are again Machine Labour and Seed. The ratio indicates,
however that the resources combinations do maintain productive efficiency.
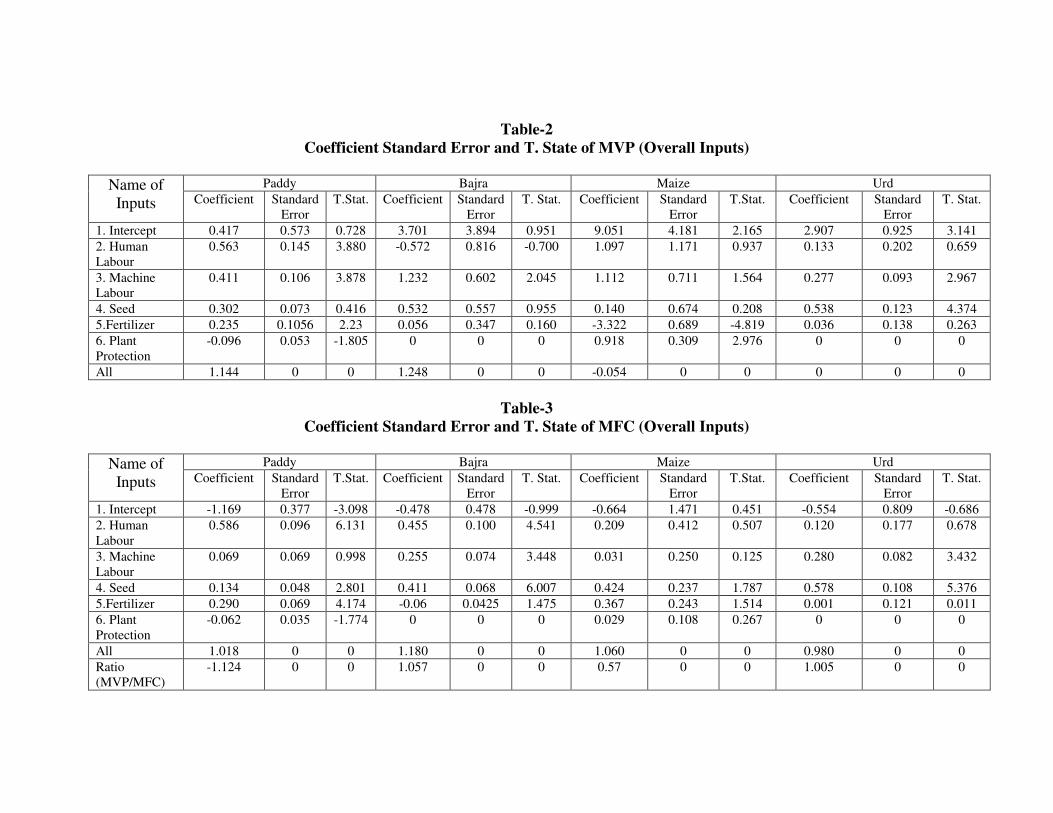
Table-2
Coefficient Standard Error and T. State of MVP (Overall Inputs)
Paddy Bajra Maize Urd Name of
Inputs Coefficient Standard
Error
T.Stat. Coefficient Standard
Error
T. Stat. Coefficient Standard
Error
T.Stat. Coefficient Standard
Error
T. Stat.
1. Intercept 0.417 0.573 0.728 3.701 3.894 0.951 9.051 4.181 2.165 2.907 0.925 3.141
2. Human
Labour
0.563 0.145 3.880 -0.572 0.816 -0.700 1.097 1.171 0.937 0.133 0.202 0.659
3. Machine
Labour
0.411 0.106 3.878 1.232 0.602 2.045 1.112 0.711 1.564 0.277 0.093 2.967
4. Seed 0.302 0.073 0.416 0.532 0.557 0.955 0.140 0.674 0.208 0.538 0.123 4.374
5.Fertilizer 0.235 0.1056 2.23 0.056 0.347 0.160 -3.322 0.689 -4.819 0.036 0.138 0.263
6. Plant
Protection
-0.096 0.053 -1.805 0 0 0 0.918 0.309 2.976 0 0 0
All 1.144 0 0 1.248 0 0 -0.054 0 0 0 0 0
Table-3
Coefficient Standard Error and T. State of MFC (Overall Inputs)
Paddy Bajra Maize Urd Name of
Inputs Coefficient Standard
Error
T.Stat. Coefficient Standard
Error
T. Stat. Coefficient Standard
Error
T.Stat. Coefficient Standard
Error
T. Stat.
1. Intercept -1.169 0.377 -3.098 -0.478 0.478 -0.999 -0.664 1.471 0.451 -0.554 0.809 -0.686
2. Human
Labour
0.586 0.096 6.131 0.455 0.100 4.541 0.209 0.412 0.507 0.120 0.177 0.678
3. Machine
Labour
0.069 0.069 0.998 0.255 0.074 3.448 0.031 0.250 0.125 0.280 0.082 3.432
4. Seed 0.134 0.048 2.801 0.411 0.068 6.007 0.424 0.237 1.787 0.578 0.108 5.376
5.Fertilizer 0.290 0.069 4.174 -0.06 0.0425 1.475 0.367 0.243 1.514 0.001 0.121 0.011
6. Plant
Protection
-0.062 0.035 -1.774 0 0 0 0.029 0.108 0.267 0 0 0
All 1.018 0 0 1.180 0 0 1.060 0 0 0.980 0 0
Ratio
(MVP/MFC)
-1.124 0 0 1.057 0 0 0.57 0 0 1.005 0 0
5.XIII. The attractive price in the markets suitable soil, climatic conditions and government
support were most important reasons for attraction for competing crops on the sample farms.
5.XIV. The marketing of produce of paddy, bajra, maize and urd was most important
problems as had been revealed by sample farmers. The weeds, environment and non
availability of inputs were important problems in the cultivation of competing crops. The
diseases, pests, weeds etc were only slight problem in the cultivation of competing crops
during reference year.
5.XV. The environmental stress was not sever problems on the sample farms. It was only
moderate problems in the reference year.
5.XVI. Non-availability of disease resistant varieties shortage of labour, non-availability of
quality seeds and shortage of land were seven problem during the production of competing
crops.
6. Policy Implications
Since the paddy is a dominant crop in Kharif season in almost all the districts of western
region of Uttar Pradesh, therefore, depletion of ground water, attack of pests and diseases,
infestation of weeds etc. are the common phenomena for this region. The fertility of land has
also been decreasing year by year in rice growing belts of western U.P. On account of this,
the yield of rice has been decreasing or it is more or less stagnant since last decade. The eco-
agro system is also deteriorating due to adoption of mono crop rotation. The maize, bajra, urd
etc are the competing crops to paddy crop of western region of U.P. In order to popularize
the maize, bajra, urd etc in cropping pattern in place of paddy crop, the following suggestions
have been recommended to motivate the farmers to devote some area to its competing crops,
namely maize, bajra, urd etc.
I. There is a need to increase the production and marketing efficiency of maize, bajra
and urd to provide the best scientific techniques to the farmers.

II. The marketing structures of competing crops are not well developed at par with
paddy crop. Therefore, the state government should improve the existing
infrastructure facilities to provide better access to maize, bajra and urd in the markets.
III. The coarse cereals, pulses and oilseeds can not be grown in low laying areas and
flooded fields. Therefore, drainage net works should be expanded in low laying and
flooded areas to enable the farmers to grow the maize and bajra in place of paddy
during kharif season.
IV. The per hectare average yield of paddy is about 45.72 qtls against the average yield of
35.44 qtls, 33.18 qtls, 11.78 qtls of maize, bajra and urd. It shows that the average
yield of paddy is much higher than its competing crops. Therefore, the high yield of
seeds of maize, bajra and urd should be available at reasonable prices and well before
sowing times. The Seed Replacing Rates (SRR) of maize, bajra and urd is much less
as compared to SRR of paddy. Therefore, an effort should made by research scientists
to make available certificate seeds of maize, bajra, urd etc at par with certified seeds
of paddy.
V. The extension department of state should organize training programme at village
level to tell farmers about the bad consequence due to repetition of rice and wheat
crop rotation. The farmers should be advised to devote some area to maize, bajra and
urd to maintain dynamic, equilibrium of agro-system.
VI. The demonstration and promotion of improved production techniques of
alternative crops should be organized at grass root level for diversion of paddy
cultivation.
VII. The farmers should be advised to grow leguminous crops to restore the soil fertility.
VIII. The guidelines for crop diversification in original Green Revolution states issued by
Government of India should be implemented in rice growing belts of the state. This
will motivate the farmers to choose appropriate crop alternatives.
IX. The total assistance of crop Diversification Programme should be available to farmers
to establish agro-based food processing units to generate additional income and
restore soil fertility.
X. There is a need to increase the MSP of bajra, maize and urd to attract the farmers to
devote the maximum area under bajra, maize, urd crops during kharif season.
XI. The researchers should take sincere efforts to evolve short duration drought tolerant
and excess moisture tolerant varieties of bajra, maize and urd at par with evolved
varieties of paddy.
XII. There is a need to improve the efficiency of government procurement agencies to
purchase maximum quantities of produce of bajra, maize and urd at minimum support
price from the farmers.