Positive the Subsurface Direct Chill Cast 7050 Aluminum
24
Characterization of Positive Macrosegregation at the Subsurface of Direct‐Chill Cast 7050 Aluminum Forging Billets Aaron Youril Advisor: Prof. Blair London Industry Sponsor: Weber Metals, Inc.
Transcript of Positive the Subsurface Direct Chill Cast 7050 Aluminum

Characterization of Positive
Macrosegregation at the Subsurface
of Direct‐Chill Cast 7050 Aluminum
Forging Billets
Aaron Youril
Advisor: Prof. Blair London
Industry Sponsor: Weber Metals, Inc.

Approval Page
Project Title: Characterization of Positive Macrosegregation at the Subsurface of
Direct-Chill Cast 7050 Aluminum Forging Billets
Author: Aaron Youril
Date Submitted: June 1st, 2012
CAL POLY STATE UNIVERSITY
Materials Engineering Department
Since this project is a result of a class assignment, it has been graded and accepted as
fulfillment of the course requirements. Acceptance does not imply technical accuracy or
reliability. Any use of the information in this report, including numerical data, is done at the
risk of the user. These risks may include catastrophic failure of the device or infringement
of patent or copyright laws. The students, faculty, and staff of Cal Poly State University,
San Luis Obispo cannot be held liable for any misuse of the project.
Prof. Blair London ____________________________
Faculty Advisor Signature
Prof. Trevor Harding ____________________________
Department Chair Signature
Youril Page i
Abstract
Segregation of alloying elements during casting of forging billets may persist to the final forged
component leading to unacceptable surface appearance. Determination of the elements or compounds
that segregate is the essential first step to solving this problem. Differential Scanning Calorimetry (DSC)
was used to determine a composition profile of the macrosegregation occurring at the subsurface of an
as‐cast 7050 aluminum alloy billet. Data collection was carried out by separating 10 to 20 mg samples
from the outer centimeter along the radius of the billet, as well as samples from the bulk interior of the
billet for comparison with the nominal alloy composition. DSC analysis was performed using platinum
capsules on the Exstar DSC6000, from 20°C to 600°C at a rate of 5°C/min over the temperature range of
interest. DSC scans showed heat flow peaks for incipient melting and crystallization transformations for
Al2CuMg (S‐phase). Size comparison of DSC peaks provided data about the relative masses at each
distance from the surface. The partial heat of fusion of samples of several depth profiles was used to
determine relative mass fractions as compared to a bulk sample. A sharp increase in S‐phase
concentration was observed near the surface and a drastic decrease at approximately 3 mm from the
surface, followed by a return to bulk alloy values after 5 mm due to shrinkage‐induced flow in the
casting process.
Keywords: Materials Engineering, Aluminum, 7050, Macrosegregation, Liquation, Forging, Differential
Scanning Calorimetry, DSC Shrinkage, Thermo‐Solutal Convection, Fusion, Casting
Youril Page ii

Table of Contents
Approval Page ................................................................................................................................................ i
Abstract ......................................................................................................................................................... ii
Table of Contents ......................................................................................................................................... iii
List of Figures ............................................................................................................................................... iv
List of Tables ................................................................................................................................................. v
Introduction .................................................................................................................................................. 1
Problem Statement ............................................................................................................................. 1
Weber Metals...................................................................................................................................... 2
Realistic Constraints1 ........................................................................................................................... 2
Economic ................................................................................................................................... 2
Health and Safety ...................................................................................................................... 2
7050 Aluminum ................................................................................................................................... 3
Semicontinuous Direct‐Chill Casting ................................................................................................... 4
Ingot Solidification ..................................................................................................................... 5
Macrosegregation ............................................................................................................................... 6
Shrinkage‐Induced Flow ............................................................................................................ 7
Thermo‐Solutal Convection ....................................................................................................... 8
Characterization Using Differential Scanning Calorimetry (DSC) ........................................................ 9
Experimental Procedure ............................................................................................................................. 10
Microstructural Analysis ................................................................................................................... 10
Differential Scanning Calorimetry ..................................................................................................... 10
Results ......................................................................................................................................................... 12
S‐Phase Evolution in As‐Cast Billets .................................................................................................. 12
Depth Profiling .................................................................................................................................. 13
Analysis ....................................................................................................................................................... 15
Conclusions ................................................................................................................................................. 16
Acknowledgements ..................................................................................................................................... 17
References .................................................................................................................................................. 18
Youril Page iii

List of Figures
Figure 1 ‐ Finished Weber forging showing bands of high‐ and low‐solute regions, an artifact from
macrosegregation at the surface of the ingot. ....................................................................................... 1
Figure 2 ‐ As‐cast microstructure showing occurrence of S‐phase precipitates (black). .............................. 4
Figure 3 ‐ Schematic of the semicontinuous direct‐chill method of casting. This shows how the liquid is
fed into the mold, encapsulated by the solidified shell, water‐cooled, and the solid casting is then
drawn out of the mold(Rooy). ................................................................................................................ 5
Figure 4 – (a) Sketch of ingot structures showing chill zone, columnar zone, and equiaxed zone
(Flemings) and (b) Schematic of dendrite growth in the columnar zone (Hurtuk). ............................... 6
Figure 5 ‐ Diagram of the segregation pattern seen in DC cast 7050 alloys (Q. Du). ................................... 7
Figure 6 ‐ Schematic representation of the shrinkage‐induced flow macrosegregation mechanism. ......... 8
Figure 7 – Schematic view of thermo‐solutal convection. Heavy elements such as zinc and copper
reinforce the existing convection current and penetrate deeper into the solidification front, while
lighter magnesium counteracts it and penetrates less deeply. ............................................................. 9
Figure 8 ‐ Representative data from a DSC test run. Peaks indicate changes in heat flow, indicating the
presence of phase changes and other phenomena (Jansen). .............................................................. 10
Figure 9 ‐ Sample cutting procedure. Grey sections indicate the section of material taken for cutting in
the next step. ........................................................................................................................................ 11
Figure 10 ‐ DSC scan of a bulk sample of an as‐cast billet. The large peaks occurring at 478°C denote
melting and crystallization of S‐phase intermetallics........................................................................... 12
Figure 11 ‐ Crystallization peaks of DSC scans at three different locations of a single profile on one ingot.
The high surface fraction, drop, and return to nominal values can be seen. ...................................... 13
Figure 12 – A) Plot of partial latent heats by distance as compared to the bulk sample, revealing an
extremely high surface fraction, followed by a sharp decrease. B) Plot of S‐phase mass fractions
relative to the bulk sample, directly proportional to that of partial latent heat. ................................ 14
Figure 13 ‐ Microstructures at key depths for comparison to DSC mass fraction results. A) 1 mm depth.
B) 3 mm depth and C) 5 mm depth. ................................................................................................... 15
Youril Page iv

Youril Page v
List of Tables
Table I ‐ Table of Composition and Properties of Wrought 7050 Aluminum (Properties of Wrought
Aluminum and Aluminum Alloys). .......................................................................................................... 3
Table II ‐ Temperatures and Rates for DSC Method ................................................................................... 11

Introduction
Problem Statement
The goal of this project was to characterize the chemical and microstructural composition of the
stock aluminum 7050 ingots used by Weber Metals (Paramount, CA) for their forged components. Many
of these ingots contain a defect in which the subsurface layer of the ingot exhibits an undesirably high
concentration of alloying elements and constituent particles due to macrosegregation. This
phenomenon is commonly seen in direct‐chill cast ingots, and is generally corrected for by machining
processes such as turning to remove the outer segregated material layer of material. However,
machining processes do not always successfully remove all of the segregated material due to imprecise
alignment during the turning process or due to shallow cuts. Furthermore, the high‐solute segregated
region cannot be seen until the surface has been etched, which cannot practically be done until the
forging process is complete. Consequently, an ingot containing this defect can undergo the entire
forging process and the problem is only revealed during the final etching step. This completed part will
then show bands or stripes of light and dark (low‐solute and high‐solute) material on its surface due to
the shaping process (Figure 1). Because the mechanical properties of this defect are unknown, finished
parts that exhibit this banding cannot be confidently sold to clients, and must be scrapped.
Figure 1 ‐ Finished Weber forging showing bands of high‐ and low‐solute regions, an artifact from
macrosegregation at the surface of the ingot.
Youril Page 1

Weber Metals
Weber Metals specializes primarily in aluminum and titanium forgings in the aerospace,
semiconductor, and automotive industries. They are acknowledged as industry leaders in aluminum
hand (open die) forgings. The forge offers four open‐die presses, capable of applying forces from 1200
to 5000 tons, with a capacity for up to 8600 pound parts. Additionally, there are five closed‐die presses
that range in maximum force from 1500 to 33000 tons, accommodating titanium forgings up to 2500
square inches.
Realistic Constraints1
The goal this project hopes to achieve is to create a starting point for research into whether or not
this segregated material has detrimental effects on mechanical properties of forgings. If the effect is
below what is considered acceptable for the forged part applications, then the parts may not need to be
scrapped. The effects of the macrosegregation in forged parts are apparent to Weber Metals, but its
exact effect is not. Understanding what these effects are may allow them to create more lax quality
control for this type of defect, or prove that the tight controls they currently use are necessary. Either
way, the realistic constraints discussed in the next section are dependent on this knowledge.
Economic
The presence of economic constraints is straightforward. As parts are forged and completed, some
display visible signs of macrosegregation. Because the effect on mechanical properties of these high‐
solute regions has not been studied, any finished forgings exhibiting this problem must be scrapped. All
of these parts represent unnecessary loss for the company. Ensuring that these problems are not seen
in finished parts, or proving that the segregation is a purely cosmetic issue allows for less waste and a
more profitable business.
Health and Safety
The other present constraint of health and safety is related to the economic constraint. In short, the
effects of the presence of macrosegregation in finished forgings on mechanical properties are not fully
understood, and as such, cannot be confidently sold to customers. These parts could fail in situations
that unaffected parts would not, and because Weber forgings are primarily used in the automotive and
aerospace industries, this presents a potential risk to the safety of anyone operating a vehicle containing
Weber’s parts. For this reason, any forging that exhibits this problem is scrapped and recycled to ensure
safety.
Youril Page 2

7050 Aluminum
7050 aluminum is a heat‐treatable alloy typically used in aircraft structural components, and similar
applications in which high‐strength, formability and low‐density are required.
Table I ‐ Table of Composition and Properties of Wrought 7050 Aluminum2.
AA7050, Wrought Aluminum Alloy
Composition Zinc Copper Magnesium Other (< 0.2% each)
5.6 – 6.7% 2.0 – 2.6% 1.9 – 2.6% Fe, Si, Mn, Zr, Ti, Cr, other
Mechanical Properties
Yield Strength Tensile Strength Elongation Young’s Modulus
446 MPa 524 MPa 15% 70.3 GPa
Table I details the composition and general mechanical properties of 7050 Aluminum, but some
discussion of its intermediate phases and strengthening mechanisms is necessary for an understanding
of the importance of the macrosegregation problem. 7050 Aluminum is an age‐hardening aluminum
alloy, meaning that it is strengthened by aging heat treatments in order to precipitate intermediate
intermetallic phases. In 7XXX‐series aluminum alloys, MgZn2 (η‐phase) is the principal strengthening
precipitate. During casting, Zinc and Aluminum are largely soluble, and a different intermetallic phase
dominates the microstructure, Al2CuMg (S‐phase)3 (Figure 2). During the aging process, 7050 Aluminum
is solutionized at 477° C at approximately the S‐phase melting point, causing dissolution. It is then age
hardened to precipitate out fine η‐phase precipitates, resulting in greater strength due to precipitation
strengthening.
Youril Page 3

Figure 2 ‐ As‐cast microstructure showing occurrence of S‐phase precipitates (black).
Semicontinuous Direct‐Chill Casting
The most common process for the fabrication of aluminum ingots is the semicontinous direct‐chill
(DC) casting method (Figure 3). In this process, molten alloy is poured through a distributor which is
generally a flat plate with holes to distribute the liquid. The liquid drains through the distributor into a
short water‐cooled mold of the desired cross‐section. The process starts with a dummy block closing off
the bottom of the mold to prevent molten alloy flowing out. Water streams contact the mold surface to
draw heat from the ingot and through the mold; this is called primary cooling. Once the outer edges of
the ingot have begun to solidify, the dummy block is drawn downward, and the solidified metal
encapsulates further liquid entering the mold, resulting in a hollow shell containing the melt. As the
ingot is pulled down, water jets are fired at the bottom of the ingot through holes in the bottom of the
mold; this is called secondary cooling. Finally, as it continues being drawn down, it is lowered into a
pool of standing water to complete the cooling process. Casting is complete when the billet reaches its
bottom position4.
Youril Page 4

Figure 3 ‐ Schematic of the semicontinuous direct‐chill method of casting. This shows how the liquid is
fed into the mold, encapsulated by the solidified shell, water‐cooled, and the solid casting is then
drawn out of the mold4.
Ingot Solidification
Ingot solidification in the case of advanced engineering alloys is a complex process involving a
variety of different reactions. The two largest factors defining the microstructure of a DC cast billet are
those of standard supercooling, in which the liquid remains in the liquid state below its equilibrium
freezing temperature, and constitutional supercooling. Constitutional supercooling occurs as material
begins to solidify, expelling excess solute into the liquid where it is more soluble, resulting in liquid with
a higher relative solute concentration. This, in turn, results in a lower freezing temperature, creating
larger and larger supercooling as the process continues5. The freezing process begins once the melt is
poured into the mold, and makes contact with the room‐temperature mold wall. Because the outer wall
of the mold is continuously cooled, liquid material nearest this wall cools rapidly, falling well below the
equilibrium freezing temperature of the alloy, resulting in considerable supercooling. In the presence of
large supercooling, dendritic growth becomes favorable, and the numerous nucleation sites cause the
crystals to impinge upon each other quickly, limiting their growth. This region close to the mold wall
consisting of small crystals is known as the chill zone (Figure 4a). Moving further from the wall, the
cooling rate, and consequently the amount of supercooling, is much lower. Because fusion generates
heat at the liquid‐solid interface, dendrite arms that form perpendicular to the mold wall will grow the
Youril Page 5

most rapidly. Similarly, the heat of fusion generated at their surface further inhibits the growth of
dendrites in other directions6. The result is that dendrite arms perpendicular to the mold wall become
heavily favored, and because the nucleation rate decreases due to the decreased supercooling, these
arms are able to grow to a large size, forming columnar grains (Figure 4b). This region beyond the chill
zone is referred to as the columnar zone. Beyond this region, in the center of the ingot, is the point
where the decreased cooling rate overcomes the constitutional effect and the liquid is no longer
supercooled. At this point, equilibrium cooling takes place, and primarily equiaxed grains form. This
interior region is known as the equiaxed zone.
Figure 4 – (a) Sketch of ingot structures showing chill zone, columnar zone, and equiaxed zone
(Flemings) and (b) Schematic of dendrite growth in the columnar zone7.
Macrosegregation
Macrosegregation, at its foundation, occurs only due to the existence of microsegregation, in which
solute elements are separated to different concentrations between the solid and liquid phases during
solidification, as discussed in the overview of ingot freezing. The extent to which microsegregation, and
consequently macrosegregation, occurs can most easily be quantified using the partition coefficients, K,
defined as the slope of the solidus line over the slope of the liquidus line for a given binary phase
system. The closer the partition coefficient is to unity, the lower the occurrence of microsegregation. In
the case of 7050 aluminum, K is 0.17 for copper, 0.43 for magnesium, and 0.45 for zinc, resulting in an
enrichment of the liquid with solute as seen in the DC cast billet8. The effect of solute enrichment as
solidification begins at the mold wall and moves inward, however, seems to imply a segregation of
Youril Page 6

solute material to the center of the ingot, rather than at the surface as seen in the 7050 aluminum
billets. It is only after considering the effects of several different fluid flow mechanisms, coupled with
the channels created by the formation of a dendritic structure, that this specific pattern of
macrosegregation can be understood (Figure 5). There are three primary accepted mechanisms of
macrosegregation, and each contributes in a different way. Two forms cause negative centerline
segregation, in which the center of the ingot is solute‐lean, and the surface subsequently becomes
solute‐rich. A third causes the opposite effect, positive‐centerline segregation. It is the superposition of
these effects, with varying magnitude, that results in the general segregation profile seen below.
Figure 5 ‐ Diagram of the segregation pattern seen in DC cast 7050 alloys8.
Shrinkage‐Induced Flow
The most influential flow mechanism by which solute‐rich liquid is transported to the surface of the
ingot is that of shrinkage‐induced flow. There are three types of shrinkage that occur as a melt is
poured into a mold and then solidified: liquidus, solidification, and solidus shrinkage. Liquidus and
solidus shrinkage, as the names imply, are associated with the change in volume that occurs as a
material cools. Solidification shrinkage, similarly, is the change in volume that occurs during the
solidification of the liquid into a denser solid9. It is solidification shrinkage that contributes most to this
form of flow, both because it is the largest volumetric change, and because of the existence of both
liquid and solid phases during solidification. As the liquid nearest the mold wall begins to solidify and
subsequently shrink, as much as 6‐8% change by volume, consider the liquid immediately preceding the
solidification front, recalling that it is being enriched in solute material. Because of the compression on
the liquid due to the shrinkage of the solid, this liquid is drawn through channels created by the
Youril Page 7

interdendritic regions, which have yet to solidify, and out toward the surface to fill the now‐empty space
at the mold wall (Figure 6). While the penetration distance of the liquid in this two‐phase region,
referred to as the mushy zone, is relatively low, the process is continually repeating as more solid is
formed and more shrinkage occurs8. This allows for solute‐rich liquid to migrate large distances in the
duration of ingot solidification. The net result of this flow mechanism is a high solute concentration at
the surface of the ingot, and a low solute concentration just below the surface.
Figure 6 ‐ Schematic representation of the shrinkage‐induced flow macrosegregation mechanism.
Thermo‐Solutal Convection
As with any fluid system involving a thermal gradient, thermal convection is a large force influencing
fluid flow. The flow pattern is as expected, in which cooler, and thus denser liquid sinks and hotter, less
dense liquid rises. The cooler liquid at the wall begins to sink downward along the sloped solidification
front, creating a momentum that draws the rising low‐solute center region back down against the
solidification front (Figure 7). Because the solidification front consists of the permeable mushy zone, as
seen in shrinkage‐induced flow, the low‐solute liquid that flows toward this front is driven in, where it
solidifies, changing the overall concentration in this region.
Youril Page 8

Figure 7 – Schematic view of thermo‐solutal convection. Heavy elements such as zinc and copper
reinforce the existing convection current and penetrate deeper into the solidification front, while
lighter magnesium counteracts it and penetrates less deeply.
The buoyancy of different elements also has an effect on the overall convection current in much the
same way. If the solute or solutes present in the enriched liquid have a density higher than that of the
solvent metal, such as zinc and copper in aluminum, the thermal convection current is reinforced,
causing deeper penetration. If however, the solutes are lighter than the solvent, the opposite is true, as
in the case of magnesium8. The combination of thermal convection and solutal convection, in general,
result in positive centerline segregation and negative surface segregation, opposite the effect of
shrinkage‐induced flow.
Characterization Using Differential Scanning Calorimetry (DSC)
As discussed above, the occurrence of macrosegregation is an artifact of the DC casting process.
There are process parameters that can reduce the effect, but many of these decrease production and
increase cost to a point where it is no longer economically feasible for a manufacturer such as Weber
Metals to require them from an ingot supplier. For this reason, characterization and understanding of
the effects of macrosegregation are of prime importance, rather than controlling it. One effective way
of characterizing a sample of material sample is through analysis using a DSC. A DSC works by using a
small sample of material, generally on the order of 10 to 20 milligrams. This sample is set in a pan, and
heating at a constant rate next to a reference sample, generally an empty pan of the same type. As the
sample of interest is subjected to the same temperature change, its change in heat flow can be
Youril Page 9

measured in comparison to the reference sample (Figure 8). This heat flow data then shows a number
of peaks and deviations which correspond to latent heat released or absorbed during phase changes,
recrystallization, and other phenomena10. This data can then be interpreted using reference data to
determine a number of sample properties, such as specific heats, or in this case, mass fractions of
intermediate phases.
Figure 8 ‐ Representative data from a DSC test run. Peaks indicate changes in heat flow, indicating the
presence of phase changes and other phenomena10.
Experimental Procedure
Microstructural Analysis
Microstructural analysis was carried out using standard metallographic practice. A section of aluminum
billet normal to the surface was taken and mounted in mineral‐filled diallyl phthalate and polished
through sandpaper grits and diamond suspensions down to a 1 μm diamond suspension. This sample
was then etched using a dilute Keller’s Reagent (95 mL water, 2.5 mL HNO3, 1.5 mL HCl, 1.0 mL HF),
diluted to 80% water. Optical microscopy was then used to take images at 500x magnification at
locations of interest on the sample. These microstructures provided corroboration for the analysis of
DSC results.
Differential Scanning Calorimetry
Sample preparation for the DSC from semicircular billet sections was carried out as described in (Figure
9), involving three cuts. A thin profile section was taken out of the billet section normal to the outer
Youril Page 10

diameter (OD) using an abrasive saw. Sample sections were then cut from this profile section at
approximately 2 mm intervals, down to 6 mm using a diamond wafering saw. From the sample sections,
DSC samples of approximately 15 mg were clipped with bolt cutters, or cut with the diamond saw when
necessary. In total, three depth profiles, each containing three 2 mm steps, were taken from across two
ingots. Prepared samples were then loaded into open platinum pans in a Seiko Exstar 6000 DSC. The
temperature control was set as detailed in Table II. OD
OD of ingot
OD
Figure 9 ‐ Sample cutting procedure. Grey sections indicate the section of material taken for cutting in
the next step.
Table II ‐ Temperatures and Rates for DSC Method
Step Start Temperature End Temperature Rate
Ramp‐Up 20°C 400°C 30°C/min
Hold 400°C 400°C 0°C/min
Heating Measurement
400°C 600°C 5°C/min
Cooling Measurement
600°C 400°C 5°C/min
Ramp‐Down 400°C 20°C 30°C/min
Youril Page 11

Results
S‐Phase Evolution in As‐Cast Billets
While η‐phase precipitates are the main strengthening mechanism for 7050 Aluminum, it is the S‐
phase mass fraction that is of interest in this project. The Al‐Zn‐Cu‐Mg alloy system is complex, and
because of this, the microstructure during processing changes drastically, not only in the character of
precipitates, but in their nature. In the as‐cast state, much of the copper and magnesium precipitate
into course S‐phase precipitates, and the zinc remains in solution with aluminum. It is only after
solutionizing and aging that the strengthening η‐phase precipitates are formed. For this reason, the S‐
phase precipitates are of primary interest. This can be made most clear in the DSC scan of an ingot bulk
sample (Figure 10).
‐5
‐4
‐3
‐2
‐1
0
1
2
3
4
5
400 425 450 475 500 525 550 575 600
DSC
(mW)
Temperature (°C)
Bulk DSC Sample
S‐phase Crystallization Cooling
Heating S‐phase Melt
Figure 10 ‐ DSC scan of a bulk sample of an as‐cast billet. The large peaks occurring at 478°C denote
melting and crystallization of S‐phase intermetallics.
Large peaks in heat input occur at 478°C corresponding to the melting point, and thus melting and
crystallization, of the S‐phase. The other smaller peaks that appear above correspond loosely to other
minor constituents, but their results register barely above baseline, and likely lie outside the sensitivity
of this experiment. In short, it is clear that S‐phase precipitates dominate the microstructure, as
expected.
Youril Page 12

Depth Profiling
As discussed in the macrosegregation section, as the surface of the ingot is profiled, there should
appear a large fraction of S‐phase occurring near the surface, followed by a sharp drop below the bulk
fraction, and up to normal values. Comparing the DSC results of crystallization peaks from the cooling
curves at samples of average depth of 1.01 mm, 3.66 mm, and 6.06 mm, this trend is seen as described
(Figure 11).
Figure 11 ‐ Crystallization peaks of DSC scans at three different locations of a single profile on one
ingot. The high surface fraction, drop, and return to nominal values can be seen.
By integrating the area under the crystallization peaks, the latent heat of fusion of the S‐phase
solidification in each sample, further referred to as the partial latent heat, can be determined. Note that
the partial latent heat refers to the heat evolved due to the S‐phase transforming in the 7050 sample,
and not the latent heat of fusion of the S‐phase transformation in general, which is a fundamental
chemical property. In many cases, it is possible to determine the mass fraction of S‐phase by using the
partial latent heat. However, this process involves an equipment calibration process that was not
available in the scope of this project. Instead, relative mass fractions were determined against the bulk
0.20
1.20
2.20
3.20
4.20
450 455 460 465 470 475 480 485 490 495 500
DSC
(mW)
Temperature (°C)
Crystallization Peaks at Different Depths
1.01 mm
3.66 mm
6.06 mm
Youril Page 13
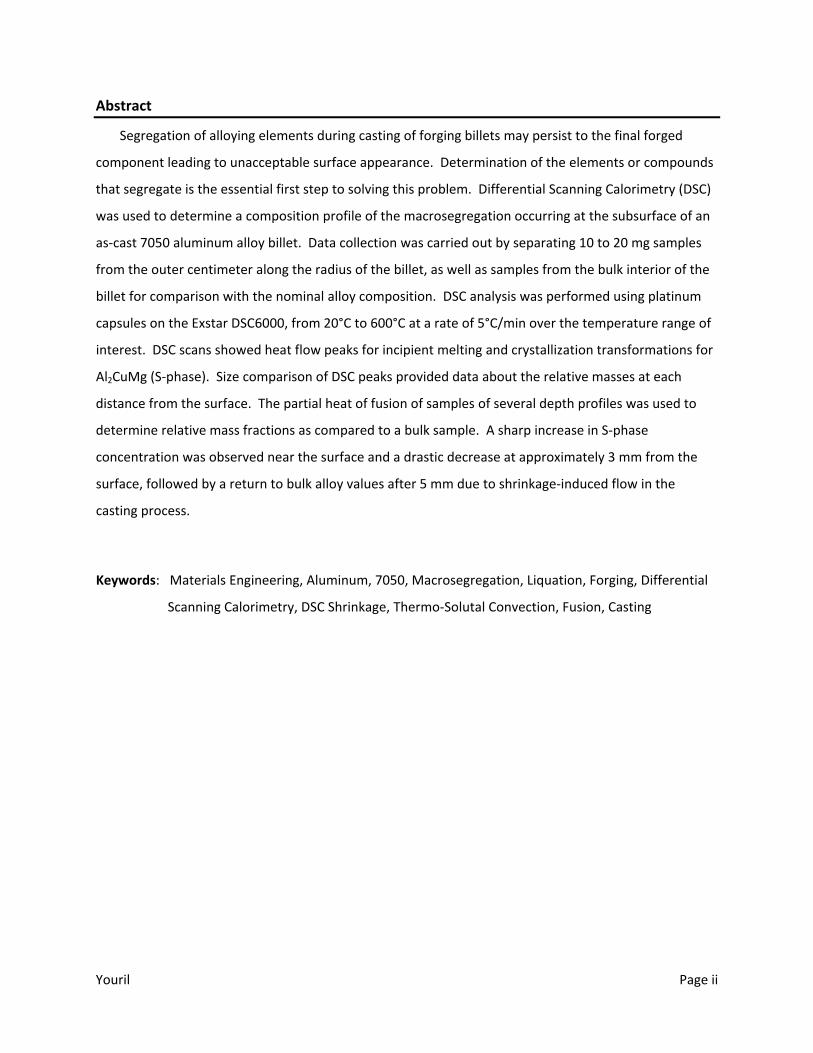
results. By integrating the area under this curve and plotting against the depth of the sample, a clear
trend is shown (Figure 12).
0.00
1.00
2.00
3.00
4.00
5.00
6.00
7.00
8.00
9.00
0 10 20 30 40 50
Partial Spe
cific
Heat (J/g)
Distance From Surface (mm)
Sample Partial Latent Heat
0.00
0.50
1.00
1.50
2.00
2.50
3.00
3.50
4.00
0 10 20 30 40 5
Relative M
ass Fraction
Distance From Surface (mm)
Relative Mass Fraction
0
Figure 12 – A) Plot of partial latent heats by distance as compared to the bulk sample, revealing an
extremely high surface fraction, followed by a sharp decrease. B) Plot of S‐phase mass fractions
relative to the bulk sample, directly proportional to that of partial latent heat.
Youril Page 14

CBA
Figure 13 ‐ Microstructures at key depths for comparison to DSC mass fraction results. A) 1 mm depth.
B) 3 mm depth and C) 5 mm depth.
In order to verify the results of initial DSC scans, microstructural analysis was conducted at depths
corresponding to the major changes in the trend. The microstructures at 1 mm, 3 mm, and 5 mm
(Figure 13) show visually the changing S‐phase mass fraction agreeing closely with the trend plotted
above.
Analysis
The data collected using the DSC and metallography conform closely to the S‐phase mass fraction
trend expected from shrinkage‐induced flow. As the ingot solidified, the first material to solidify on the
mold wall shrunk inward, causing high solute liquid to be pulled toward the surface, creating the rise in
S‐phase mass fraction to above 350% of normal bulk values. Consequently, this low‐solute solid that
shrank inward caused a region just inside the surface, approximately 2‐4 mm from the surface in this
ingot, with a marked decrease in S‐phase, to as low as 25% of bulk values. Further from the melt wall,
approximately 5‐6 mm deep, S‐phase concentrations are at nominal values, and remain reasonably
constant into the ingot interior.
The effects of thermo‐solutal convection could not be discussed due to testing methodology.
Because S‐phase is an intermetallic compound with a 1:1 ratio of copper and magnesium, specific
concentrations could not be separated with DSC or metallographic results. Similarly, zinc being
dissolved in the α‐phase solid solution, it was not picked up on the DSC scans. Other characterization
techniques would be required to examine these effects. Additionally, floating grain migration was not
seen in this experiment, as it is a phenomenon that occurs toward the center of the ingot, rather than at
the surface, which was the focus of this project.
Youril Page 15

Conclusions
1. Nominal alloying element concentrations occur approximately 5 mm from the surface.
2. The S‐Phase (Al2CuMg) mass fraction at the surface appears as high as 3.5 times that of bulk
material.
3. S‐Phase mass fraction drops drastically to near 0.25 times that of the bulk material at approximately
3 mm from the surface.
4. High S‐phase concentrations at the surface suggest an adverse effect on mechanical properties in
this region, though the exact effect, because of the complex microstructural evolution through
processing is unclear.
Youril Page 16

Acknowledgements
I would like to thank the people that made this project possible. My advisor, Professor Blair London,
helped to keep me organized and on track for completion within the time frame, and for his advice on
technical matters and editing. I would also like to thank my sponsors at Weber Metals, Lauren Moody
and Mark Timko. They were critical in my understanding of the problem, and in much of my analysis.
Additionally, I would like to thank Tim Johnson at DSC Consumables, for his exceptional customer service
in handling the delivery of my platinum capsules for testing. Finally, there are several other professors
and fellow students who helped me through the process, and I could not have done it without their
support. Thank you.
Youril Page 17

Youril Page 18
References
1. ABET Criteria for Accrediting Engineering Programs 2010‐13, General Criteria for Baccalaureate Level
Programs, General Criteria 3: Student Outcomes (c), www.abet.org/engineering‐criteria‐2012‐2013.
2. "Properties of Wrought Aluminum and Aluminum Alloys." Properties and Selection: Nonferrous
Alloys and Special‐Purpose Materials, ASM Handbook. Vol. 2. ASM International, 1990. 62‐122.
3. Robson, J. D. "Microstructural evolution in aluminium alloy 7050 during processing." Materials
Science and Engineering: A (September 2004): 112‐121.
4. Rooy, E. "Aluminum Alloy Ingot Casting and Continuous Processes." Casting, ASM Handbook. Vol. 15.
ASM International, 2008. 1001‐1008.
5. Abbaschian, Abbaschian, and Reed‐Hill. "Solidification of Metals." Physical Metallurgy Principles.
Stamford, CT: Cengage Learning, 2009. 429‐451.
6. Flemings, T.F. and M.C. Trains. AIME. Vol. 239. 1967. 1620.
7. Hurtuk, D.J. "Steel Ingot Casting." Casting, ASM Handbook. Vol. 15. ASM International, 2008. 911‐
917.
8. Q. Du, D.G. Eskin, et al. "Macrosegregation in direct‐chill casting of aluminum alloys." Progress in
Materials Science 53 (2008): 421‐480.
9. Gwyn, Michael. "Casting Design and Geometry." Casting Design and Performance, ASM
International. 2009. 101‐119.
10. Jansen, Jeffrey A. "Differential Scanning Calorimetry." Failure Analysis and Prevention, ASM
Handbook. Vol. 11. ASM International, 2002.