Portland, Oregon Review of Lents Park Site and …bojack.org/images/hvslentsreport.pdfPortland,...
39
Portland, Oregon Review of Lents Park Site and Proforma The City of Portland (“City”) initially considered two sites for the proposed AAA ballpark to replace PGE Park: 1) the site of the existing Memorial Coliseum in the Rose Quarter and 2) the Lents Park site. The city subsequently decided on the Lents Park site and is currently in discussions with Peregrine LLC on a funding and development plan for the chosen site. Peregrine LLC had originally submitted a generic proforma for the ballpark on January 16, 2009. Subsequently, a site for the ballpark was defined within Lents Park and Peregrine LLC submitted a revised proforma to the City. Having performed analysis on the proposal for a AAA ballpark in Portland, HVS was asked to review the revised proforma, compare it to the original proforma, and consider the impact of the Lent’s Park site on the revised proforma. All of the proforma numbers discussed herein were prepared by consultants to Peregrine LLC. Peregrine LLC has agreed to provide $17.5 million in cash to the project in exchange for paying no rent and no user fees in Years 8-25 of the operation of the proposed ballpark. This agreement also involves the rent payment and the user fees for PGE Park where a renovation would convert it to a Major League Soccer stadium. Subsequent to the submission of the revised ballpark pro forma from Peregrine LLC, the City negotiated an increase of $100,000 (from $400,000 to $500,000) per year in rent for the ballpark. Ten miles southeast of downtown Portland (via interstate), the Lents community was annexed from Multnomah County and incorporated into the City of Portland in 1912. Lents Park is owned by the City and located at S.E. 92nd Avenue at Holgate Boulevard near Interstate 205. In 1953, the City prepared a plan for Lents Park, proposing locations for a baseball stadium, athletic playing fields, tennis courts, community buildings, pathways, and parking areas. Construction on the stadium began in 1956. Walker Stadium currently occupies a portion of the site. The Lents Park site is roughly 10 miles from downtown Portland and this distance will have an impact on attendance at the proposed ballpark. The Lents Park site does not have the major public transportation facilities available, as does the Memorial Coliseum site. However, a new MAX Light Rail Station Introduction Overview of Lents Park
Transcript of Portland, Oregon Review of Lents Park Site and …bojack.org/images/hvslentsreport.pdfPortland,...
Portland, Oregon Review of Lents Park Site and Proforma
The City of Portland (“City”) initially considered two sites for the proposed AAA ballpark to replace PGE Park: 1) the site of the existing Memorial Coliseum in the Rose Quarter and 2) the Lents Park site. The city subsequently decided on the Lents Park site and is currently in discussions with Peregrine LLC on a funding and development plan for the chosen site.
Peregrine LLC had originally submitted a generic proforma for the ballpark on January 16, 2009. Subsequently, a site for the ballpark was defined within Lents Park and Peregrine LLC submitted a revised proforma to the City. Having performed analysis on the proposal for a AAA ballpark in Portland, HVS was asked to review the revised proforma, compare it to the original proforma, and consider the impact of the Lent’s Park site on the revised proforma. All of the proforma numbers discussed herein were prepared by consultants to Peregrine LLC.
Peregrine LLC has agreed to provide $17.5 million in cash to the project in exchange for paying no rent and no user fees in Years 8-25 of the operation of the proposed ballpark. This agreement also involves the rent payment and the user fees for PGE Park where a renovation would convert it to a Major League Soccer stadium. Subsequent to the submission of the revised ballpark pro forma from Peregrine LLC, the City negotiated an increase of $100,000 (from $400,000 to $500,000) per year in rent for the ballpark.
Ten miles southeast of downtown Portland (via interstate), the Lents community was annexed from Multnomah County and incorporated into the City of Portland in 1912. Lents Park is owned by the City and located at S.E. 92nd Avenue at Holgate Boulevard near Interstate 205. In 1953, the City prepared a plan for Lents Park, proposing locations for a baseball stadium, athletic playing fields, tennis courts, community buildings, pathways, and parking areas. Construction on the stadium began in 1956. Walker Stadium currently occupies a portion of the site.
The Lents Park site is roughly 10 miles from downtown Portland and this distance will have an impact on attendance at the proposed ballpark. The Lents Park site does not have the major public transportation facilities available, as does the Memorial Coliseum site. However, a new MAX Light Rail Station
Introduction
Overview of Lents Park

HVS REVIEW OF LENTS PARK SITE AND REVISED PROFORMA June 3, 2009
Page 2 of 24
adjacent to the facility, which is planned to open in 2009, could help improve the park's accessibility. Figure 1 shows an aerial view of Lents Park and downtown Portland.
Figure 1 Lents Park and Downtown Portland
The 1,000-seat Charles B. Walker Stadium is currently located at Lents Park. Under the proposed plan, the existing stadium would be demolished, and the new ballpark would be located on the same northeast corner of Lents Park. The Lents Park site does not currently contain sufficient parking for patrons of the proposed ballpark. As of this writing, the location of additional parking for the ballpark, the number of parking spaces, and the split of the parking revenues between the City and Peregrine LLC have not been resolved. Figure 2 shows an aerial view of Lents Park.
Proposed Ballpark at Lents Park

HVS REVIEW OF LENTS PARK SITE AND REVISED PROFORMA June 3, 2009
Page 3 of 24
Figure 2 Lents Park
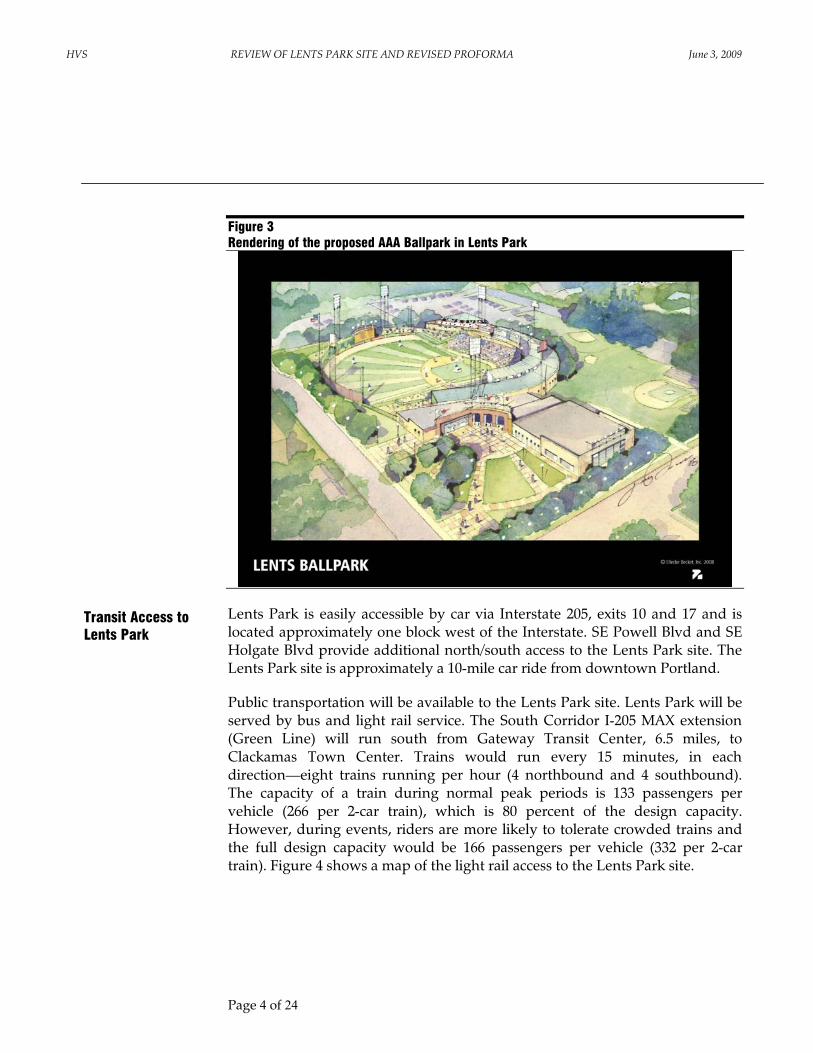
The proposal from the team owners calls for a lighted field built 15-feet below grade to minimize noise, lighting, and other impacts on the surrounding residential neighborhood. Figure 3 shows a rendering of the proposed AAA Ballpark.
HVS REVIEW OF LENTS PARK SITE AND REVISED PROFORMA June 3, 2009
Page 4 of 24
Figure 3 Rendering of the proposed AAA Ballpark in Lents Park
Lents Park is easily accessible by car via Interstate 205, exits 10 and 17 and is located approximately one block west of the Interstate. SE Powell Blvd and SE Holgate Blvd provide additional north/south access to the Lents Park site. The Lents Park site is approximately a 10-mile car ride from downtown Portland.
Public transportation will be available to the Lents Park site. Lents Park will be served by bus and light rail service. The South Corridor I-205 MAX extension (Green Line) will run south from Gateway Transit Center, 6.5 miles, to Clackamas Town Center. Trains would run every 15 minutes, in each direction—eight trains running per hour (4 northbound and 4 southbound). The capacity of a train during normal peak periods is 133 passengers per vehicle (266 per 2-car train), which is 80 percent of the design capacity. However, during events, riders are more likely to tolerate crowded trains and the full design capacity would be 166 passengers per vehicle (332 per 2-car train). Figure 4 shows a map of the light rail access to the Lents Park site.
Transit Access to Lents Park

HVS REVIEW OF LENTS PARK SITE AND REVISED PROFORMA June 3, 2009
Page 5 of 24
Figure 4 Access Lents Park Site
Four bus lines run near the park. During peak periods, these buses have a total capacity of around 1,500 in the peak direction and over 900 during off-peak times. Park and Ride lots along the new Green Line will provide 2,320 spaces. The availability of rail and bus service to Lents Park would 1) reduce the required parking at the proposed ballpark, and 2) reduce the team's parking income. Figure 1-4 shows the regional rail system.
The Peregrine LLC proposal assumes that 30 to 35 percent of attendees would travel to the site on public transportation. Assuming peak game attendance of approximately 8,000, public transit passenger demand would range from 2,400 to 2,800. It appears that the combination of bus and light rail lines would have ample capacity to accommodate demand on days of peak attendance. For PGE Park nearly half of the attendees arrive on public transit and for the Rose Quarter nearly one third arrive by public transit.
The northern part of the Lents Park site on SE Holgate Blvd is primarily residential. The eastern border of the Lents Park has modest commercial development at the corner of SE Holgate Blvd and SE 92nd Ave with single family homes down the remainder of the east side of Lents Park except for commercial development at SE Schiller St. and SE Mitchell St.. The south side of Lents Park, SE Steele St. is primarily single family homes as is SE 88th Ave on the west side of the Lents Park. Interstate 205 runs one block east of Lents Park in a north/south direction.
The residential nature of the surrounding community limits the ability to park cars outside of Lents Park. The surrounding residential housing will also limit
Surrounding Land Uses at Lents Park

HVS REVIEW OF LENTS PARK SITE AND REVISED PROFORMA June 3, 2009
Page 6 of 24
the timing of concerts, the park's ability to book larger exhibition games, and the types of promotions permitted at the ballparks such as fireworks. The City anticipates establishing a parking permit zone around the proposed ballpark to limit the impact of on street parking from patrons of the ballpark.
HVS gathered data on the opening year, seat capacity, and 2008 attendance at all AAA stadiums in the US. See Table 1.
Other AAA Ballparks

HVS REVIEW OF LENTS PARK SITE AND REVISED PROFORMA June 3, 2009
Page 7 of 24
Table 1 AAA Baseball in 2008
City Year Opened Capacity (1)Attendance
2008Suburban
Opened 2000 and therafter
1 Albuquerque 1969 10,510 593,606 593,606
2 Buffalo 1988 21,050 590,386
3 Charlotte 1990 10,000 312,290 312,290
4 Colorado Springs 1988 6,100 303,048 303,048
5 Columbus 1932 15,000 537,889
6 Durham 1995 10,000 514,281
7 Fresno 2002 12,500 526,754 526,7548 Indianapolis 1996 15,500 606,166
9 Iowa 1992 10,500 493,513
10 Las Vegas 1983 9,334 374,780 374,780
11 Lehigh Valley 2008 10,000 602,033 602,03312 Louisville 2000 13,800 638,777 638,77713 Memphis 2000 14,320 569,172 569,17214 Nashville 1978 12,000 354,662
15 New Orleans 1997 10,000 355,395 355,395
16 Norfolk 1993 12,000 433,767
17 Oklahoma 1998 13,300 493,548
18 Omaha 1948 23,145 349,376 349,376
19 Pawtucket 1942 10,000 643,049
20 Portland 1928 23,000 392,512
21 Richmond (1) 1985 12,134 289,570
22 Rochester 1996 10,840 490,806
23 Round Rock / Austin 2000 7,816 668,623 668,623 668,62324 Sacramento 2000 10,400 744,299 744,29925 Salt Lake 1994 15,500 510,859
26 Scranton/WB 1989 10,800 496,658 496,658
27 Syracuse 1997 11,200 392,028
28 Tacoma 1960 10,000 327,871
29 Toledo 2002 10,000 584,596 584,59630 Tucson (3) 1998 11,500 245,121
Totals 59,548 14,435,435 3,453,776 4,334,254
Average 481,181 431,722 619,179
Percent change from overal attendance -10% 29%
(1) Source: Revenue From Sports Venues 2008 Edition
In 2008, overall attendance in Portland (392,512) was 18 percent less than the average of all AAA teams (481,181). HVS compared overall annual attendance in 2008 with attendance in suburban stadiums and in newly built stadiums
HVS REVIEW OF LENTS PARK SITE AND REVISED PROFORMA June 3, 2009
Page 8 of 24
(opened after 2000). Suburban stadiums drew 10 percent less attendance than the overall average. New stadiums drew nearly 30 percent more attendees. The implication for a new stadium at Lents Park is that due to its suburban location, attendance may not increase as much as other new stadiums in urban locations.
HVS reviewed the existing AAA ballparks for examples of suburban sites similar to the Lents Park location. A number of AAA ballparks are not located in the downtown portion of the major city in their metropolitan statistical area. Ballparks such as the Dell Diamond and the new Gwinnett Braves Stadium are located in nearby communities from the major population centers of Austin and Atlanta, respectively. Ballparks such as Isotope Park in Albuquerque or Johnny Rosenblatt Stadium in Omaha are located within the city but are separated from the downtown core.
The major funding source for most new or renovated minor league ballparks is the local government in which the ballpark is located. The site location chosen for a minor league ballpark is driven by the overall economic needs of the community as much as the best location for ticket sales. In recent years, the desires of certain local governments to use a ballpark development as an anchor for a larger economic renewal project has caused many new ballparks to be constructed within the downtown core. Baseball is unique among professional sports for the large number of games played on an annual basis. The activity generated by a ballpark creates customers for nearby restaurants, shopping and entertainment establishments.
The projected game day paid attendance of 3,222 at the proposed Portland ballpark is significantly below both the AAA average of 6,683 or the average of the suburban ballparks of 5,996 for 2008, but these average estimates include unpaid attendance. Unfortunately, no industry wide data is available on paid attendance. Table 2 shows an overview of suburban ballparks.
Suburban Ballparks

HVS REVIEW OF LENTS PARK SITE AND REVISED PROFORMA June 3, 2009
Page 9 of 24
Table 2 Overview of Suburban AAA Ballparks
StadiumMiles from City Center
City Capacity Opened2008
Attendance
MSA Population
20071 Cashman Field 4.4 Las Vegas 9,334 1983 374,780 1,848,0002 Dell Diamond 22.9 Austin 7,815 2000 668,623 1,554,0003 Isotopes Park 2.9 Albuquerque 10,510 1969/2003 593,606 859,0004 Johnny Rosenblatt Stadium 3.2 Omaha 23,145 1948 349,376 833,0005 Security Service Field 7.1 Colorado Springs 6,100 1988 303,048 609,0006 Zephyr Field 9.4 New Orleans 10,000 1997 355,395 1,045,0007 Knights Stadium 15.8 Charlotte 10,000 1990 312,290 1,616,0008 PNC Field 5.5 Scranton 10,800 1989 496,658 552,000
Average 8.9 10,963 431,722 1,114,500Lents Park 10.0Average per 72 Game Season 5,996
Project Average Portland per 72 Game Season 3,222
Average of the 30 AAA Teams 481,181Average per 72 Game Season 6,683
Ballparks opened 2000 and thereafter (2008 season) 619,179Average per 72 Game Season 8,600
Following is a brief description of each of the eight suburban ballparks listed above.
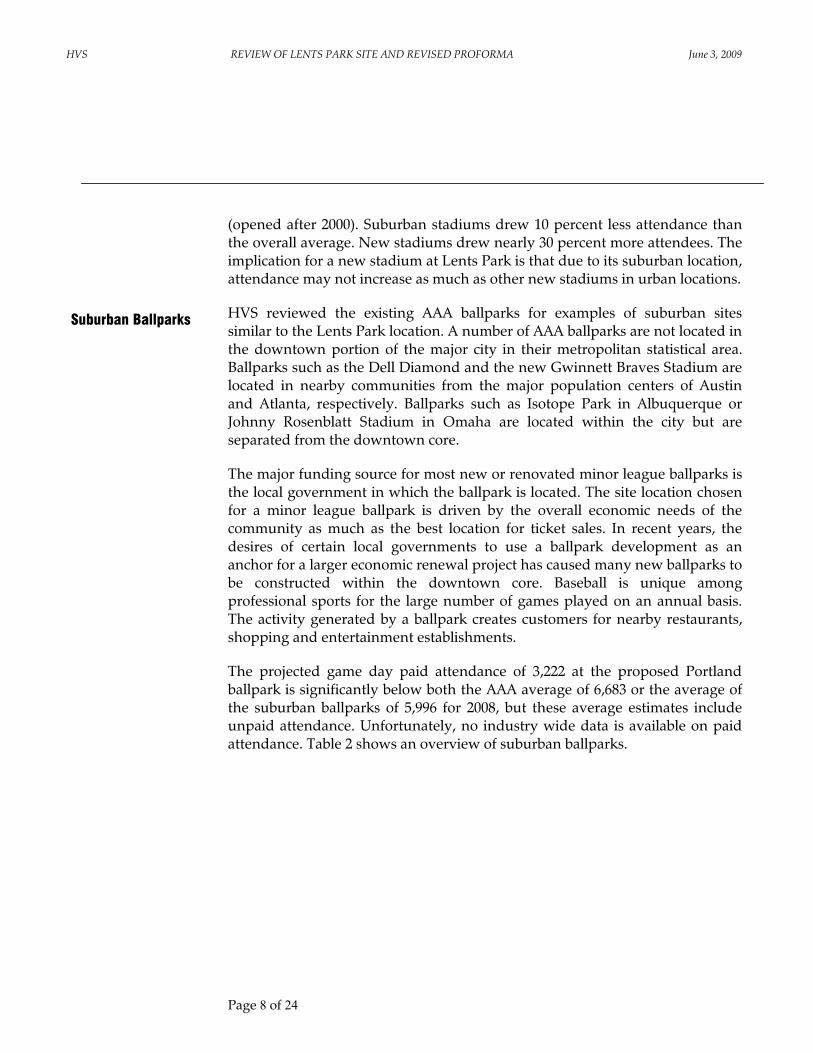
Cashman Field in Las Vegas, Nevada is owned and operated by the Las Vegas Convention and Visitors Authority. Cashman Field opened in 1983 and has a maximum capacity of 9,334. Figure 5 shows an aerial view of Cashman Field.
Cashman Field
HVS REVIEW OF LENTS PARK SITE AND REVISED PROFORMA June 3, 2009
Page 10 of 24
Figure 5 Cashman Field - Las Vegas, Nevada
Cashman Field is part of a larger complex that includes a 100,000 square foot convention center, a 1,954-seat theatre, and other city facilities. The ballpark was originally near the city center but as the major entertainment facilities moved to South Las Vegas Blvd, the site became suburban in nature.
Opened in 2000, the Dell Diamond is built on 85 acres of former farmland on the east side of Round Rock, Texas. The city-owned ballpark has seating capacity of 7,816. The Dell Diamond is about 23 miles outside of downtown Austin, Texas. Figure 6 shows an aerial view of Dell Diamond.
Dell Diamond

HVS REVIEW OF LENTS PARK SITE AND REVISED PROFORMA June 3, 2009
Page 11 of 24
Figure 6 Dell Diamond – Round Rock, Texas
Nolan Ryan, part owner of the Express, wanted a stadium in Austin, but could not get votes for city funds to be used to help build the ballpark. The city of Round Rock contributed $7.35 million to the $20 - 25 million cost of the ballpark. The city gave the Express a 38-year lease. The ballpark is an attendance leader among AAA facilities.
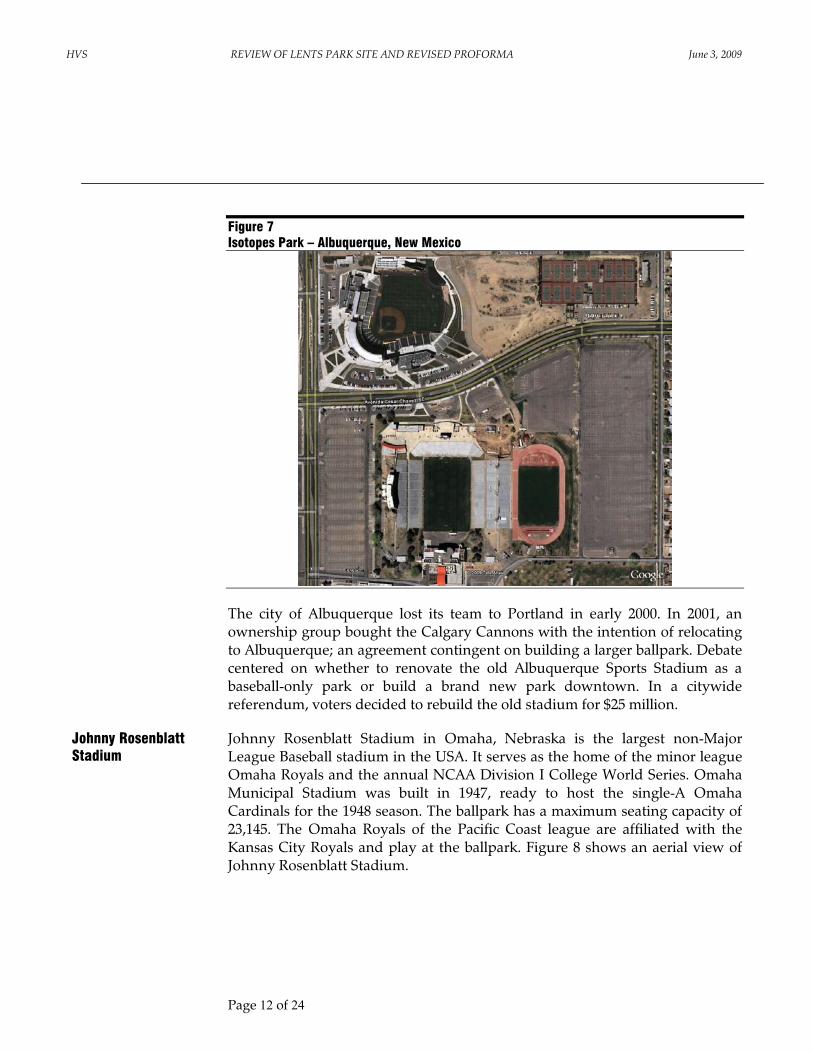
Opened in 1969 and later completely rebuilt in 2003, Isotopes Park is located in Albuquerque, New Mexico and is home to the AAA affiliate of the Los Angeles Dodgers. The ballpark has a seating capacity of 10,510. Figure 7 shows an aerial view of Isotopes Park.
Isotopes Park
HVS REVIEW OF LENTS PARK SITE AND REVISED PROFORMA June 3, 2009
Page 12 of 24
Figure 7 Isotopes Park – Albuquerque, New Mexico
The city of Albuquerque lost its team to Portland in early 2000. In 2001, an ownership group bought the Calgary Cannons with the intention of relocating to Albuquerque; an agreement contingent on building a larger ballpark. Debate centered on whether to renovate the old Albuquerque Sports Stadium as a baseball-only park or build a brand new park downtown. In a citywide referendum, voters decided to rebuild the old stadium for $25 million.
Johnny Rosenblatt Stadium in Omaha, Nebraska is the largest non-Major League Baseball stadium in the USA. It serves as the home of the minor league Omaha Royals and the annual NCAA Division I College World Series. Omaha Municipal Stadium was built in 1947, ready to host the single-A Omaha Cardinals for the 1948 season. The ballpark has a maximum seating capacity of 23,145. The Omaha Royals of the Pacific Coast league are affiliated with the Kansas City Royals and play at the ballpark. Figure 8 shows an aerial view of Johnny Rosenblatt Stadium.
Johnny Rosenblatt Stadium

HVS REVIEW OF LENTS PARK SITE AND REVISED PROFORMA June 3, 2009
Page 13 of 24
Figure 8 Johnny Rosenblatt Stadium – Omaha, Nebraska
The city has been in discussion with the team owners for years concerning the construction of a new stadium in downtown Omaha. The team owners feel the existing stadium is too large for minor league baseball. The city is unwilling to downsize the existing stadium due to the needs of the College World Series.
Security Service Field, formerly known as Sky Sox Stadium, on the eastern edge of Colorado Springs, Colorado is a professional baseball stadium. The stadium is the home of the Colorado Springs Sky Sox, the AAA-level affiliate of the Colorado Rockies Major League Baseball team. Sky Sox Stadium was constructed in time for the 1988 season at a cost of $3.7 million. The ballpark has a seating capacity of 6,100. Figure 9 shows an aerial view of Security Service Field.
Security Service Field

HVS REVIEW OF LENTS PARK SITE AND REVISED PROFORMA June 3, 2009
Page 14 of 24
Figure 9 Security First Field – Colorado Springs, Colorado
From 2004 to 2007, the Sky Sox undertook $8 million in renovations for the ballpark. With only 6,000 fixed seats, it is the smallest stadium in AA A-level baseball.
Zephyr Field is a 10,000-seat baseball park in Metairie, Louisiana, a suburb of New Orleans, that hosted its first regular season baseball game in the spring of 1997. The newly constructed practice facility, used by the New Orleans Saints National Football League team, is located adjacent to the ballpark. Figure 10 shows an aerial view of Zephyr Field.
Zephyr Field

HVS REVIEW OF LENTS PARK SITE AND REVISED PROFORMA June 3, 2009
Page 15 of 24
Figure 10 Zephyr Field – Metairie, Louisiana
The ballpark sustained significant damage from hurricane Katrina. In 2006, the state of Louisiana approved $21 million to recover Zephyr Field from the affects of Katrina.
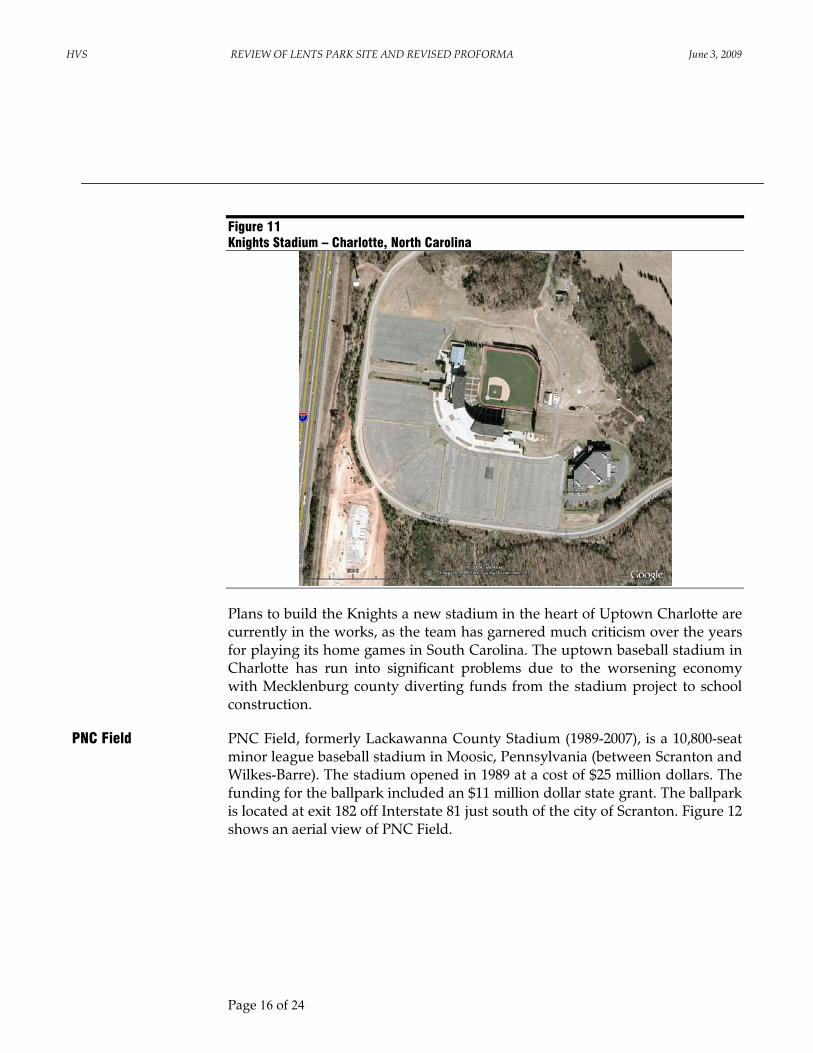
Knights Stadium is the home of the International League's Charlotte Knights, the AAA affiliate of the Chicago White Sox. It was opened in 1990 and seats 10,000 fans. The park is across the state line from Charlotte, North Carolina in Fort Mill, South Carolina. Figure 11 shows an aerial view of Knights Stadium.
Knights Stadium
HVS REVIEW OF LENTS PARK SITE AND REVISED PROFORMA June 3, 2009
Page 16 of 24
Figure 11 Knights Stadium – Charlotte, North Carolina
Plans to build the Knights a new stadium in the heart of Uptown Charlotte are currently in the works, as the team has garnered much criticism over the years for playing its home games in South Carolina. The uptown baseball stadium in Charlotte has run into significant problems due to the worsening economy with Mecklenburg county diverting funds from the stadium project to school construction.
PNC Field, formerly Lackawanna County Stadium (1989-2007), is a 10,800-seat minor league baseball stadium in Moosic, Pennsylvania (between Scranton and Wilkes-Barre). The stadium opened in 1989 at a cost of $25 million dollars. The funding for the ballpark included an $11 million dollar state grant. The ballpark is located at exit 182 off Interstate 81 just south of the city of Scranton. Figure 12 shows an aerial view of PNC Field.
PNC Field

HVS REVIEW OF LENTS PARK SITE AND REVISED PROFORMA June 3, 2009
Page 17 of 24
Figure 12 PNC Field – Moosic, Pennsylvania
The team owners and managers are currently in discussion with city and state officials concerning the construction of a new ballpark at the existing location. The proposed cost of the new stadium would be $35 to $50 million dollars. The development would also include retail, restaurants, and offices. Scranton Mayor Chris Doherty, argued that building a stadium in downtown Scranton would have far more community benefits.
The suburban stadiums all have significant on-site parking for customers of the ballpark; as such, ease of parking and road access are significant factors in the financial success of every ballpark. HVS gathered data on four of the suburban facilities. See Table 3.
Parking Capacity

HVS REVIEW OF LENTS PARK SITE AND REVISED PROFORMA June 3, 2009
Page 18 of 24
Table 3
F ieldA p pro x im ate
n u m b er o f spaces
C o m m en ts
C ashman F ie ld 2,730 P a rking lot owned and ope ra ted by the Las V egas C V BD e ll D iamond 4,000 3,500 paved and 500 grave l spacesKnights S tadium 4,000Z ephry F ie ld 3,400 2,800 paved plus 600 spots on grass and back lots
Source: Respective Facilities
The four suburban stadiums average approximately 3,500 spaces and the aerial photos shown in this report indicate that the other the suburban stadiums have similar amounts of parking.
Comparable suburban venues share some key characteristics that would be important to the Lents Park development.
! Access – All suburban sites have excellent highway access which is similar to the access to the Lents Park site.
! Parking – All sites have ample parking, which is currently not shown in the rendering of the Lents Park development. As of this writing a specific parking plan has not been put in place. Given its suburban location, ample parking will be essential to the success of the venue. It is not clear that the Lents Park site has capacity for a viable parking plan.
! Attendance – Among the AAA ballparks, suburban sites have lower than average attendance and attendance forecasts of the Lents Park site should reflect this reality
! Neighborhood Compatibility – Unlike urban locations, the suburban sites appear to have a distinct separation from adjoining neighborhoods. Unlike the Lents Park site, none of them are located in a neighborhood park immediately surrounded by residential land uses. The residential neighborhood surrounding Lents Park raises potential issues common to many urban stadiums that are likely to arise during game day operations including: noise, congestion, traffic, parking, and security.
! Economic Impact – The visitor spending associated with game day activities will be limited initially because the site is not adjacent to restaurants and other entertainment amenities. Limited opportunities
Comparable Venue Conclusions
HVS REVIEW OF LENTS PARK SITE AND REVISED PROFORMA June 3, 2009
Page 19 of 24
exist for economic redevelopment at 92nd and Holgate and along the east side of 92nd Ave which borders Lents Park. Most of the post and pre-game activity would most likely occur on site rather than in the surrounding neighborhood thereby increasing the potential for food and beverage revenue within the stadium.
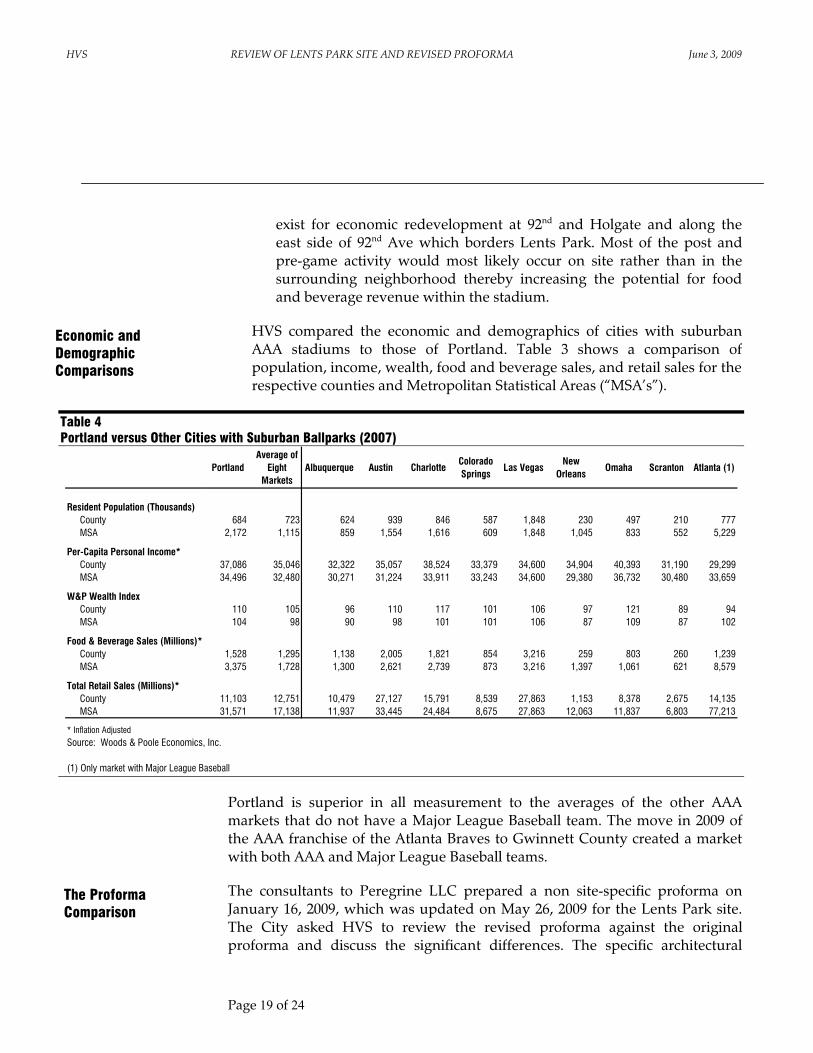
HVS compared the economic and demographics of cities with suburban AAA stadiums to those of Portland. Table 3 shows a comparison of population, income, wealth, food and beverage sales, and retail sales for the respective counties and Metropolitan Statistical Areas (“MSA’s”).
Table 4 Portland versus Other Cities with Suburban Ballparks (2007)
PortlandAverage of
Eight Markets
Albuquerque Austin CharlotteColorado Springs
Las VegasNew
OrleansOmaha Scranton Atlanta (1)
Resident Population (Thousands)County 684 723 624 939 846 587 1,848 230 497 210 777MSA 2,172 1,115 859 1,554 1,616 609 1,848 1,045 833 552 5,229
Per-Capita Personal Income*County 37,086 35,046 32,322 35,057 38,524 33,379 34,600 34,904 40,393 31,190 29,299MSA 34,496 32,480 30,271 31,224 33,911 33,243 34,600 29,380 36,732 30,480 33,659
W&P Wealth IndexCounty 110 105 96 110 117 101 106 97 121 89 94MSA 104 98 90 98 101 101 106 87 109 87 102
Food & Beverage Sales (Millions)*County 1,528 1,295 1,138 2,005 1,821 854 3,216 259 803 260 1,239MSA 3,375 1,728 1,300 2,621 2,739 873 3,216 1,397 1,061 621 8,579
Total Retail Sales (Millions)*County 11,103 12,751 10,479 27,127 15,791 8,539 27,863 1,153 8,378 2,675 14,135MSA 31,571 17,138 11,937 33,445 24,484 8,675 27,863 12,063 11,837 6,803 77,213
* Inflation AdjustedSource: Woods & Poole Economics, Inc.
(1) Only market with Major League Baseball
Portland is superior in all measurement to the averages of the other AAA markets that do not have a Major League Baseball team. The move in 2009 of the AAA franchise of the Atlanta Braves to Gwinnett County created a market with both AAA and Major League Baseball teams.
The consultants to Peregrine LLC prepared a non site-specific proforma on January 16, 2009, which was updated on May 26, 2009 for the Lents Park site. The City asked HVS to review the revised proforma against the original proforma and discuss the significant differences. The specific architectural
The Proforma Comparison
Economic and Demographic Comparisons

HVS REVIEW OF LENTS PARK SITE AND REVISED PROFORMA June 3, 2009
Page 20 of 24
plans for the development of the ballpark have not yet been prepared for the project. HVS assumed the final development will incorporate the elements needed to generate the revenues shown in the proforma; specifically, suites, club seats, general seating, concessions, team store, and parking.
The revised ticket sales at the proposed ballpark show a total decrease of over 15 percent as compared to the original forecast:
! The general ticket sales show a decrease of 502 tickets a game (over 16 percent) for a total decrease of 36,158 tickets on an annual basis in the revised proforma for years 2013 and thereafter.
! The club seat sales show no decrease in the revised proforma. HVS has concluded that a modest decrease in club seat sales could be expected at the Lents Park site.
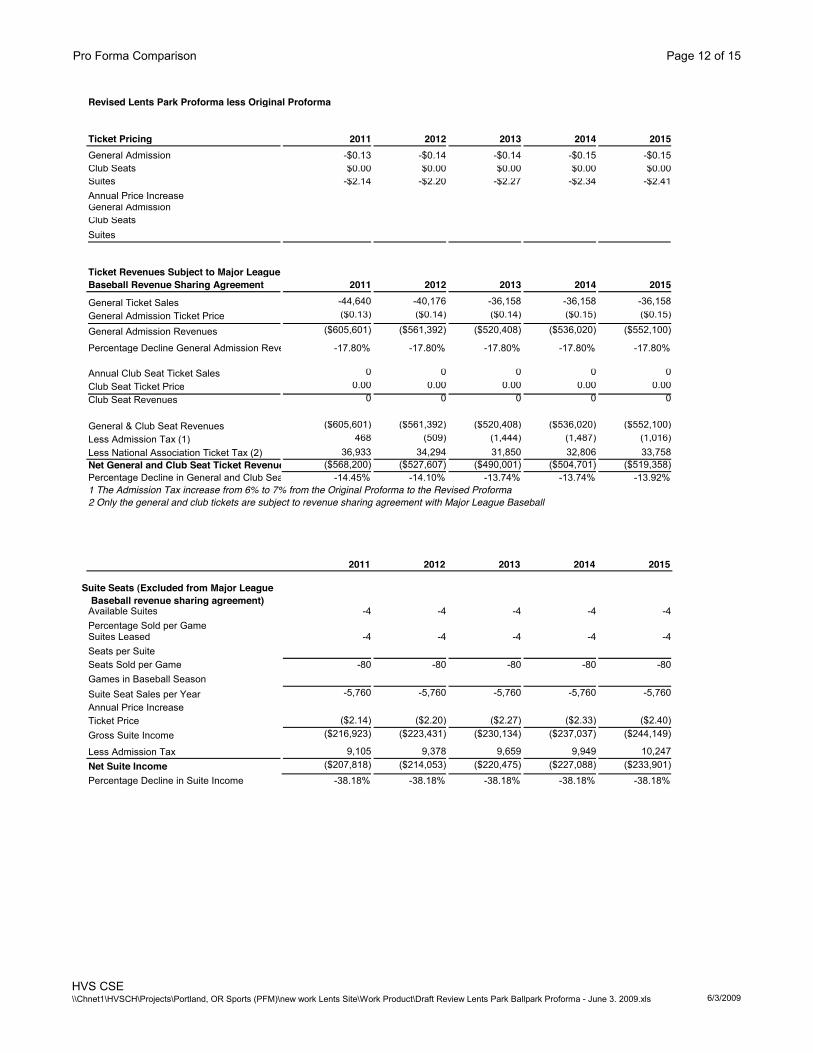
! The suite ticket sales show a decrease of 80 tickets a game (over 33 percent) for a total decrease of 5,760 tickets on an annual basis in the revised proforma for years 2013 and thereafter.
The revised AAA baseball ticket prices show a modest decrease as compared to the original forecast:
! The general ticket prices show a decrease of 14 cents per ticket in the revised proforma for year 2013. The decrease increases at the rate of inflation in subsequent years.
! The club seat ticket prices show no decrease in the revised proforma. HVS has concluded that a modest decrease in club seat ticket prices could be expected at the Lents Park site.
! The suite ticket sales show a decrease of $2.27 per tickets in the revised proforma for the year 2013. The decrease increases at the rate of inflation in subsequent years.
Ticket revenues decrease due to the reduction in ticket sales and ticket prices in the revised proforma.
! The general ticket revenues show a decrease of $520,408 in the revised proforma for the year 2013. The decrease increases at the rate of inflation in subsequent years.
Ticket Sales
Ticket Prices
Ticket Revenues

HVS REVIEW OF LENTS PARK SITE AND REVISED PROFORMA June 3, 2009
Page 21 of 24
! The club seat revenues show no decrease in the revised proforma. HVS has concluded that a modest decrease in club seat revenues could be expected at the Lents Park site.
! The suite ticket revenues show a decrease of $220,475 in the year 2013. The decrease increases at the rate of inflation in subsequent years.
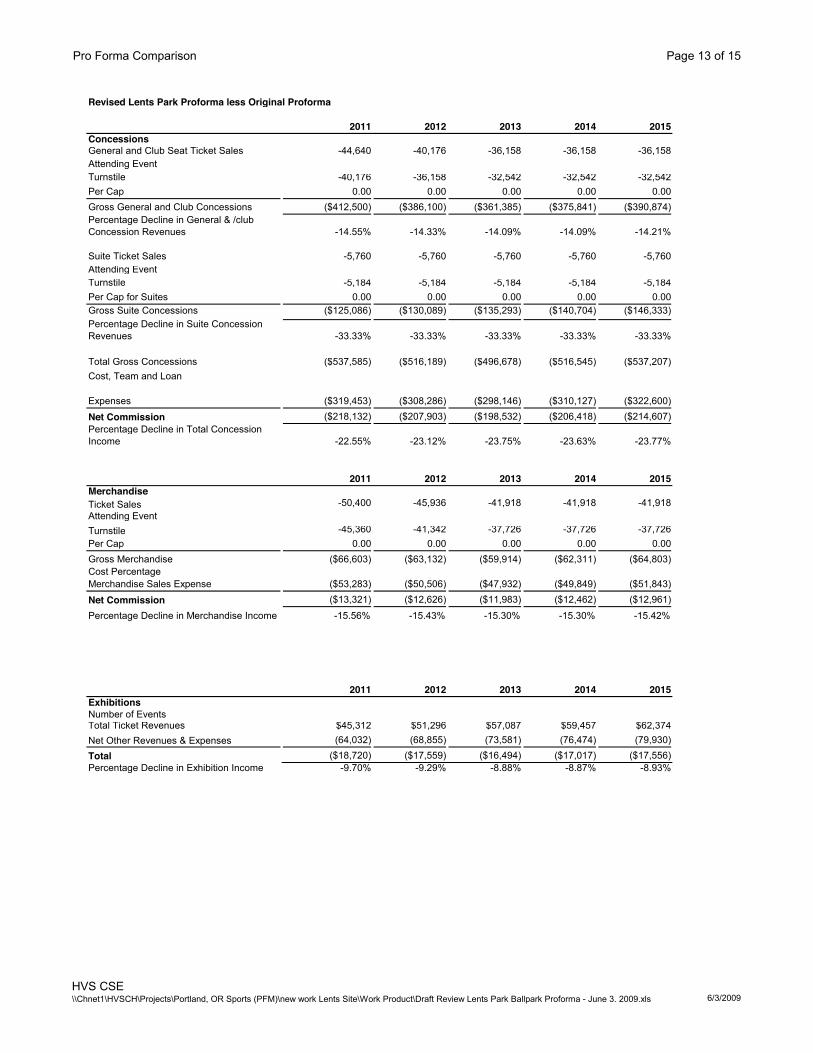
Concession sales show a significant decrease of over 16 percent due to the reduction in ticket sales for general seating and suites seats.
! The general seats gross concession revenues show a decrease of $361,385 in the revised proforma for the year 2013. The decrease increases at the rate of inflation in subsequent years.
! The club seat concession revenues show no decrease in the revised proforma. HVS has concluded that a modest decrease in club seat concession revenues could be expected at the Lents Park site.
! The suite ticket gross concession revenues show a decrease of $135,295 in the year 2013. The decrease increases at the rate of inflation in subsequent years.
Merchandise sales show a significant decrease of over 15 percent due to the reduction in ticket sales for general seating and suites seats.
! The gross merchandise revenues show a decrease of $59,914 in the revised proforma for the year 2013. The decrease increases at the rate of inflation in subsequent years.
! The club seat related merchandise revenues show no decrease in the revised proforma. HVS has concluded that a modest decrease in club seat merchandise revenues could be expected at the Lents Park site.
Exhibition related revenues show a modest decrease of $16,494 in 2013 that continues to increase at approximately the project rate of inflation.
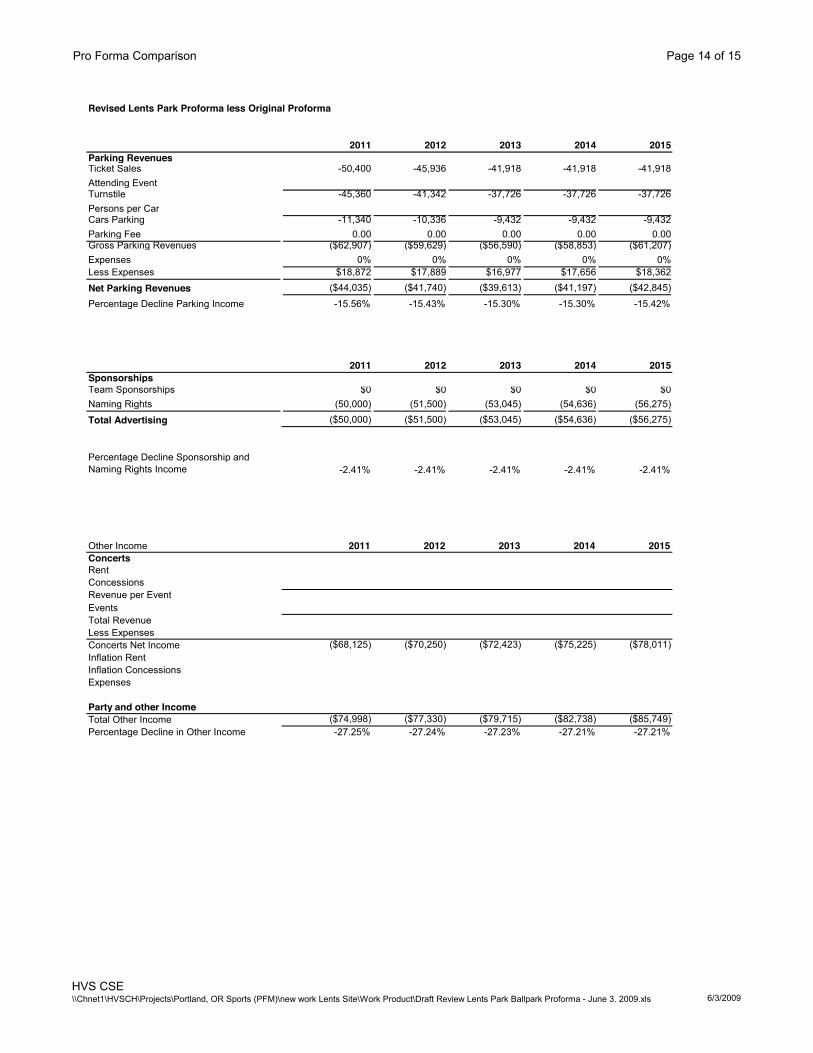
Parking revenues and parking income shows a decrease of over 15 percent from the earlier generic proforma.
! The inventory of parking spaces available for sale by the team has not yet been established.
Concessions Sales
Merchandise Sales
Exhibition Revenues
Parking Revenues

HVS REVIEW OF LENTS PARK SITE AND REVISED PROFORMA June 3, 2009
Page 22 of 24
! The availability/pricing of other parking inventory within the neighborhood has not yet been established.
Sponsorships and naming rights show a modest decrease of over 2%.
! The projected sponsorship income is not decreased in the revised proforma. HVS estimates a modest decrease in sponsorship income would be expected due to the reduction in projected attendance at the proposed ballpark.
! The value of the naming rights is reduced by $50,000 in the year 2011 and increases at the rate of inflation thereafter.
Other income shows a decrease of over 27 percent per year.
! The primary reason for the reduction in other income is one fewer concert on an annual basis at the Lents Park site.
Total revenues show a decrease of over 13 percent for the first five years projected.
! The primary reason for the reduction in revenues is the decline in projected attendance at the Lents Park site.
Expenses, other than rent, do not show any declines due to the Lents Park site.
! HVS would expect a modest decline in expenses due to the lower attendance projected for the proposed ballpark.
EBIDTA shows a very significant decline of over 80 percent in year 2013 and thereafter.
! The decline in projected attendance at the proposed ballpark is the primary cause in the decline in projected revenues.
! Expenses are not projected to decline at the same rates as revenues causing a significant reduction in EBIDTA.
The Lents Park site represents a change in the location of the proposed ballpark from the current urban location to a suburban location within Portland. The trend in AAA baseball has been to locate new ballparks close to the center of a major city. The city center locations were chosen in many cases to provide an
Sponsorships and Naming Rights Revenue
Other Income
Total Revenues
Total Expenses
EBIDTA
Summary
HVS REVIEW OF LENTS PARK SITE AND REVISED PROFORMA June 3, 2009
Page 23 of 24
anchor for an economic renewal rather than for a superior ability to generate ticket sales for the team. The large number of games per year in AAA baseball generates a consistent flow of people to a ballpark, creating potential customers for nearby businesses.
A minor league team in many ways is comparable to marketing a baseball themed restaurant in the local marketplace. The primary goal of minor league baseball is player development for the major league team rather than a winning record. A downtown location provides a greater amount of competition for the dining dollar both before and after a game. The high cost of marketing team ticket sales makes concessions one of the primary income sources for many minor league teams. A suburban location should enable the team to capture the dining dollars of customers inside the ballpark.
Parking limitation in the urban core of a large city such as Portland can discourage customers who would like to drive to a game. Often a suburban location can offer better parking facilities due to a greater availability of land, which can help to compensate for longer driving times. The development of sufficient parking at the proposed ballpark location would be a critical factor in the financial success of the park.
The proposed pro forma for the Lents Park site prepared by the consultants for Peregrine LLC project over a 15 percent drop in attendance from the earlier proforma submitted to the City. The drop in projected attendance results in a reduction in concessions and merchandise sales of approximately the same amount. Other income is also reduced due to a decrease from three to two concerts per year. Sponsorship and naming rights revenues are also reduced due to a reduction in the value of naming rights in the proforma. Total revenues are decreased by over 1.1 million dollars per year.
Expenses in the revised proforma are maintained at the same level except for a reduction in rent of $125,000 a year. The significant reduction in revenues and the modest reduction in expense cause EBITDA to be reduced by approximately 80 percent on an annual basis. The team is still expected to generate a positive EBITDA flow on an annual basis before the cost of acquiring the team is taken into consideration. When the cost of acquiring the team is included, the annual net cash flow after financing is approximately a one million dollar loss per year. The ability to provide parking to patrons of the proposed ballpark and the ability of the team to earn the parking income will be an important factor in obtaining the financial results projected in the revised proforma.

HVS REVIEW OF LENTS PARK SITE AND REVISED PROFORMA June 3, 2009
Page 24 of 24
The projected attendance at the Lents Park site is modest based on the reported attendance of other AAA teams. The Portland MSA has higher population and income than many of the other market with AAA teams. The revised proforma does project significant losses after the cost of financing the team’s acquisition is taken into consideration. The City needs to receive assurances from Peregrine LLC that these levels of losses are sustainable over years one through seven.
The current proposed financing has Peregrine LLC prepaying rent and tickets admission fees for the 8-25th year. Beginning in the eighth year the team proforma will show a significant increase in revenues due to the elimination of rent and ticket admission fees.
Attachment
Exhibit 1 Pro forma Comparison

Pro Forma Comparison Page 1 of 15
Original Ballpark Proforma
2011 2012 2013 2014 2015
Type of EventAAA Baseball 72.0 72.0 72.0 72.0 72.0Exhibition Baseball Games 0.5 0.5 0.5 0.5 0.5Concerts 3.0 3.0 3.0 3.0 3.0Total 75.5 75.5 75.5 75.5 75.5
Average AttendanceAAA Baseball 4,500 4,134 3,805 3,805 3,775
Exhibition Baseball Games (Estimated) 9,000 9,000 9,000 9,000 9,000Concerts (Estimated) 5,000 5,000 5,000 5,000 5,000
Total AttendanceBaseball Regular Season 324,000 297,648 273,960 273,960 271,800Exhibition Baseball Games 4,500 4,500 4,500 4,500 4,500Concerts 15,000 15,000 15,000 15,000 15,000Total 343,500 317,148 293,460 293,460 291,300
Ticket Sales 2011 2012 2013 2014 2015General AdmissionTicket Sales per Game 3,660 3,294 2,965 2,965 2,965Games 72 72 72 72 72Baseball Season 263,520 237,168 213,451 213,451 213,451
Club SeatsInventory per Game Club Seats 850 850 850 850 850Percentage of Inventory Sold 71% 71% 71% 71% 67%Ticket Sales per Game 600 600 600 600 570Games 72 72 72 72 72Baseball Season 43,200 43,200 43,200 43,200 41,040
SuitesInventory 280 280 280 280 280Percentage of Inventory Sold 85.7% 85.7% 85.7% 85.7% 85.7%Ticket Sales per Game 240 240 240 240 240Games 72 72 72 72 72
Baseball Season 17,280 17,280 17,280 17,280 17,280
Total Ticket Sales AAA Baseball 324,000 297,648 273,931 273,931 271,771
HVS CSE\\Chnet1\HVSCH\Projects\Portland, OR Sports (PFM)\new work Lents Site\Work Product\Draft Review Lents Park Ballpark Proforma - June 3. 2009.xls 6/3/2009
Pro Forma Comparison Page 2 of 15
Original Ballpark Proforma
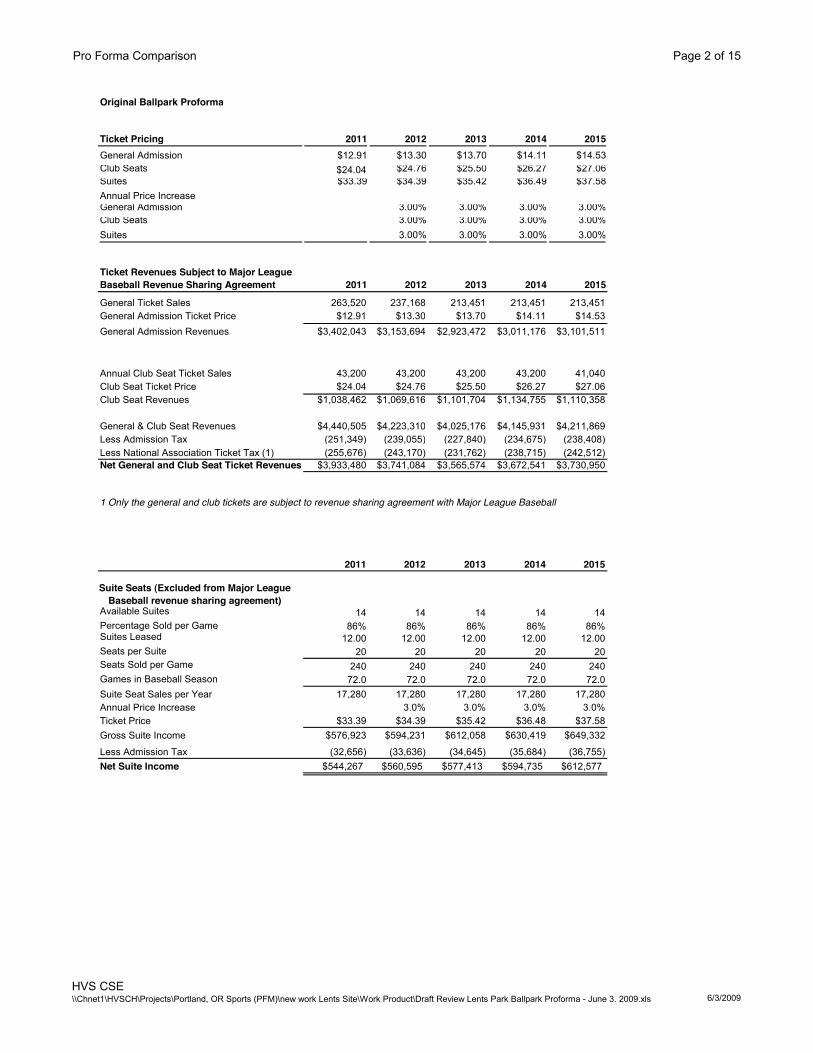
Ticket Pricing 2011 2012 2013 2014 2015General Admission $12.91 $13.30 $13.70 $14.11 $14.53 Club Seats $24.04 $24.76 $25.50 $26.27 $27.06 Suites $33.39 $34.39 $35.42 $36.49 $37.58
General Admission 3.00% 3.00% 3.00% 3.00%Club Seats 3.00% 3.00% 3.00% 3.00%Suites 3.00% 3.00% 3.00% 3.00%
Ticket Revenues Subject to Major League Baseball Revenue Sharing Agreement 2011 2012 2013 2014 2015
General Ticket Sales 263,520 237,168 213,451 213,451 213,451General Admission Ticket Price $12.91 $13.30 $13.70 $14.11 $14.53General Admission Revenues $3,402,043 $3,153,694 $2,923,472 $3,011,176 $3,101,511
Annual Club Seat Ticket Sales 43,200 43,200 43,200 43,200 41,040Club Seat Ticket Price $24.04 $24.76 $25.50 $26.27 $27.06Club Seat Revenues $1,038,462 $1,069,616 $1,101,704 $1,134,755 $1,110,358
General & Club Seat Revenues $4,440,505 $4,223,310 $4,025,176 $4,145,931 $4,211,869Less Admission Tax (251,349) (239,055) (227,840) (234,675) (238,408)Less National Association Ticket Tax (1) (255,676) (243,170) (231,762) (238,715) (242,512)Net General and Club Seat Ticket Revenues $3,933,480 $3,741,084 $3,565,574 $3,672,541 $3,730,950
1 Only the general and club tickets are subject to revenue sharing agreement with Major League Baseball
2011 2012 2013 2014 2015
Available Suites 14 14 14 14 14Percentage Sold per Game 86% 86% 86% 86% 86%Suites Leased 12.00 12.00 12.00 12.00 12.00Seats per Suite 20 20 20 20 20Seats Sold per Game 240 240 240 240 240Games in Baseball Season 72.0 72.0 72.0 72.0 72.0Suite Seat Sales per Year 17,280 17,280 17,280 17,280 17,280Annual Price Increase 3.0% 3.0% 3.0% 3.0%Ticket Price $33.39 $34.39 $35.42 $36.48 $37.58Gross Suite Income $576,923 $594,231 $612,058 $630,419 $649,332
Less Admission Tax (32,656) (33,636) (34,645) (35,684) (36,755)Net Suite Income $544,267 $560,595 $577,413 $594,735 $612,577
Annual Price Increase
Suite Seats (Excluded from Major League Baseball revenue sharing agreement)
HVS CSE\\Chnet1\HVSCH\Projects\Portland, OR Sports (PFM)\new work Lents Site\Work Product\Draft Review Lents Park Ballpark Proforma - June 3. 2009.xls 6/3/2009
Pro Forma Comparison Page 3 of 15
Original Ballpark Proforma
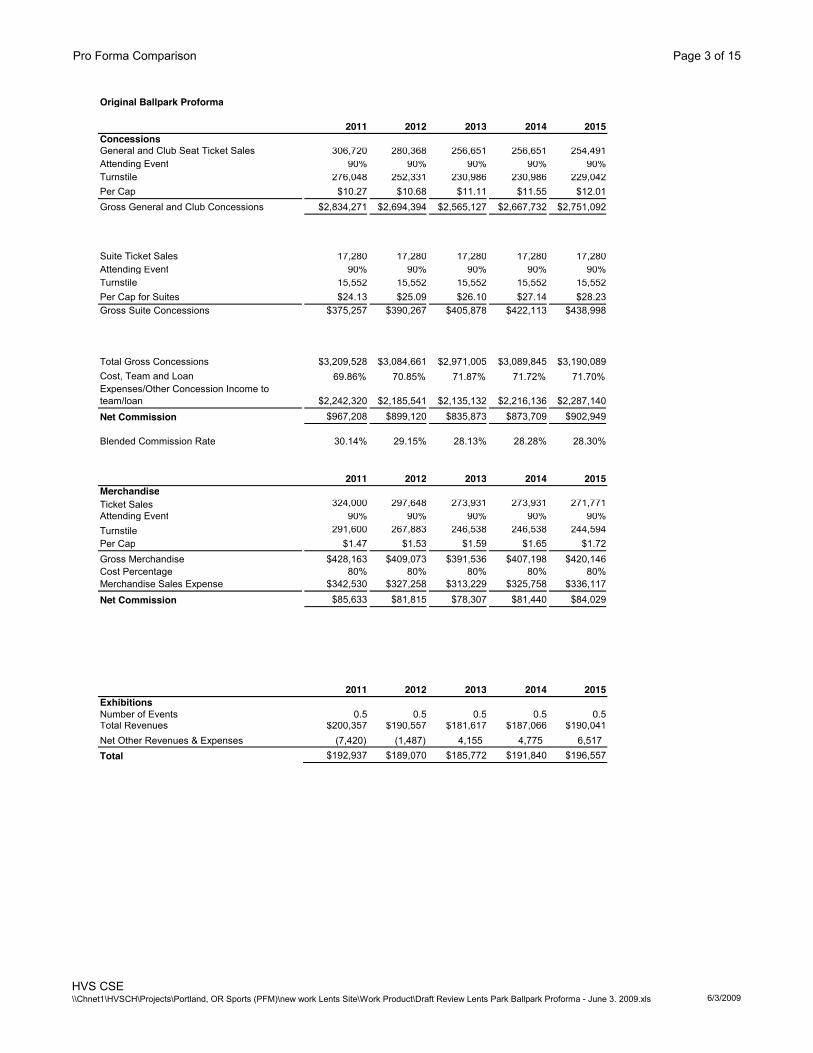
2011 2012 2013 2014 2015ConcessionsGeneral and Club Seat Ticket Sales 306,720 280,368 256,651 256,651 254,491Attending Event 90% 90% 90% 90% 90%Turnstile 276,048 252,331 230,986 230,986 229,042Per Cap $10.27 $10.68 $11.11 $11.55 $12.01 Gross General and Club Concessions $2,834,271 $2,694,394 $2,565,127 $2,667,732 $2,751,092
Suite Ticket Sales 17,280 17,280 17,280 17,280 17,280Attending Event 90% 90% 90% 90% 90%Turnstile 15,552 15,552 15,552 15,552 15,552Per Cap for Suites $24.13 $25.09 $26.10 $27.14 $28.23 Gross Suite Concessions $375,257 $390,267 $405,878 $422,113 $438,998
Total Gross Concessions $3,209,528 $3,084,661 $2,971,005 $3,089,845 $3,190,089 Cost, Team and Loan 69.86% 70.85% 71.87% 71.72% 71.70%Expenses/Other Concession Income to team/loan $2,242,320 $2,185,541 $2,135,132 $2,216,136 $2,287,140
Net Commission $967,208 $899,120 $835,873 $873,709 $902,949
Blended Commission Rate 30.14% 29.15% 28.13% 28.28% 28.30%
2011 2012 2013 2014 2015MerchandiseTicket Sales 324,000 297,648 273,931 273,931 271,771Attending Event 90% 90% 90% 90% 90%Turnstile 291,600 267,883 246,538 246,538 244,594Per Cap $1.47 $1.53 $1.59 $1.65 $1.72 Gross Merchandise $428,163 $409,073 $391,536 $407,198 $420,146 Cost Percentage 80% 80% 80% 80% 80%Merchandise Sales Expense $342,530 $327,258 $313,229 $325,758 $336,117
Net Commission $85,633 $81,815 $78,307 $81,440 $84,029
2011 2012 2013 2014 2015ExhibitionsNumber of Events 0.5 0.5 0.5 0.5 0.5Total Revenues $200,357 $190,557 $181,617 $187,066 $190,041 Net Other Revenues & Expenses (7,420) (1,487) 4,155 4,775 6,517Total $192,937 $189,070 $185,772 $191,840 $196,557
HVS CSE\\Chnet1\HVSCH\Projects\Portland, OR Sports (PFM)\new work Lents Site\Work Product\Draft Review Lents Park Ballpark Proforma - June 3. 2009.xls 6/3/2009

Pro Forma Comparison Page 4 of 15
Original Ballpark Proforma
2011 2012 2013 2014 2015Parking RevenuesTicket Sales 324,000 297,648 273,931 273,931 271,771Attending Event 90% 90% 90% 90% 90%Turnstile 291,600 267,883 246,538 246,538 244,594Persons per Car 4.00 4.00 4.00 4.00 4.00 Cars Parking 72,900 66,971 61,634 61,634 61,148 Parking Fee $5.55 $5.77 $6.00 $6.24 $6.49 Gross Parking Revenues $404,401 $386,370 $369,807 $384,599 $396,829 Expenses 30% 30% 30% 30% 30%Less Expenses ($121,320) ($115,911) ($110,942) ($115,380) ($119,049)
Net Parking Revenues $283,081 $270,459 $258,865 $269,219 $277,780
Net Parking Percentage 70% 70% 70% 70% 70%Average per Game 1,013 930 856 856 849
2011 2012 2013 2014 2015SponsorshipsTeam Sponsorships $1,421,323 $1,463,963 $1,507,882 $1,553,118 $1,599,712 Naming Rights 650,000 669,500 689,585 710,273 731,581
Total Advertising $2,071,323 $2,133,463 $2,197,467 $2,263,392 $2,331,293 Inflation Team Sponsorships 3.00% 3.00% 3.00% 3.00%Inflation Naming Rights 3.00% 3.00% 3.00% 3.00%
2011 2012 2013 2014 2015ConcertsRent $23,472 $24,300 $25,166 $25,921 $26,542Concessions Commission per Event 48,610 49,876 51,141 53,306 55,474Revenue per Event $72,082 $74,176 $76,307 $79,227 $82,016 Events 3.00 3.00 3.00 3.00 3.00Total Revenue $216,246 $222,528 $228,921 $237,681 $246,048Less Expenses (20,623) (21,242) (21,879) (22,536) (23,211)Concerts Net Income $195,623 $201,286 $207,042 $215,145 $222,837Inflation Rent 3.5% 3.6% 3.0% 2.4%Inflation Concessions 2.6% 2.5% 4.2% 4.1%Expenses 9.5% 9.5% 9.6% 9.5% 9.4%
Party and other Income $79,635 $82,615 $85,706 $88,917 $92,247Total Other Income $275,258 $283,901 $292,748 $304,062 $315,084
HVS CSE\\Chnet1\HVSCH\Projects\Portland, OR Sports (PFM)\new work Lents Site\Work Product\Draft Review Lents Park Ballpark Proforma - June 3. 2009.xls 6/3/2009

Pro Forma Comparison Page 5 of 15
Original Ballpark Proforma
2011 2012 2013 2014 2015Revenues
General & Club Tickets $3,933,480 $3,741,084 $3,565,574 $3,672,541 $3,730,950 Suites 544,267 560,595 577,413 594,735 612,577Concessions 967,208 899,120 835,873 873,709 902,949Merchandise 85,633 81,815 78,307 81,440 84,029Pre/Post/Exhibitions 192,937 189,070 185,772 191,840 196,557Parking 283,081 270,459 258,865 269,219 277,780Advertising and Sponsorships 1,421,323 1,463,963 1,507,882 1,553,118 1,599,712Naming Rights 650,000 669,500 689,585 710,273 731,581Other Event Revenues 275,258 283,901 292,748 304,062 315,084Other Non-Ballpark Revenues 35,086 36,489 37,949 39,467 41,045
Total Revenues $8,388,272 $8,195,996 $8,029,968 $8,290,404 $8,492,265Inflation Total Revenues -2.3% -2.0% 3.2% 2.4%
2011 2012 2013 2014 2015Team Expenses
Team Operations $595,380 $613,242 $631,639 $650,588 $670,106 Sales and Advertising 3,051,154 2,514,151 2,589,575 2,667,263 2,747,280G&A 864,478 785,177 808,732 832,994 857,984Total Team Expenses $4,511,012 $3,912,570 $4,029,946 $4,150,845 $4,275,370
Ballpark ExpensesBallpark Operations $1,988,255 $2,047,903 $2,109,340 $2,172,620 $2,237,797 Stadium Rent 625,000 650,000 675,000 700,000 725,000
Total Stadium Operations $2,613,255 $2,697,903 $2,784,340 $2,872,620 $2,962,797 Total Expenses $7,124,267 $6,610,473 $6,814,286 $7,023,465 $7,238,167
Inflation Total Expenses -7.21% 3.08% 3.07% 3.06%
EBITDA $1,264,005 $1,585,523 $1,215,682 $1,266,939 $1,254,098
HVS CSE\\Chnet1\HVSCH\Projects\Portland, OR Sports (PFM)\new work Lents Site\Work Product\Draft Review Lents Park Ballpark Proforma - June 3. 2009.xls 6/3/2009
Pro Forma Comparison Page 6 of 15
Revised Ballpark Proforma for Lents Park Site
2011 2012 2013 2014 2015
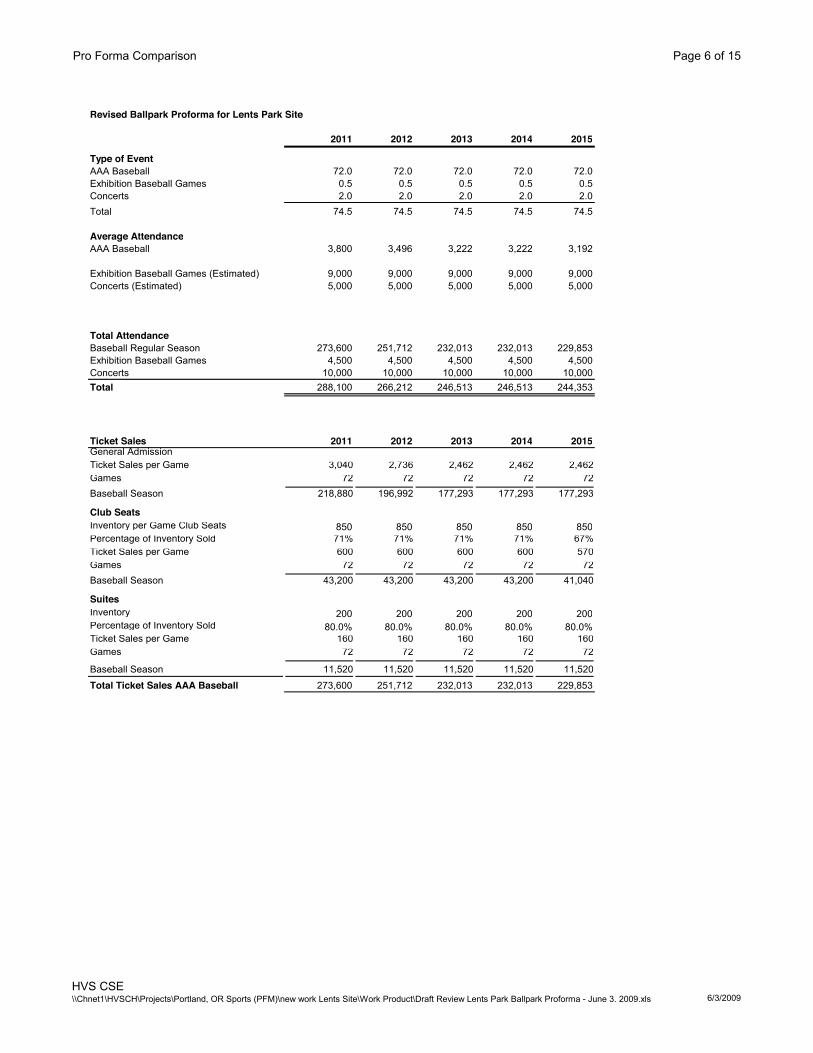
Type of EventAAA Baseball 72.0 72.0 72.0 72.0 72.0Exhibition Baseball Games 0.5 0.5 0.5 0.5 0.5Concerts 2.0 2.0 2.0 2.0 2.0Total 74.5 74.5 74.5 74.5 74.5
Average AttendanceAAA Baseball 3,800 3,496 3,222 3,222 3,192
Exhibition Baseball Games (Estimated) 9,000 9,000 9,000 9,000 9,000Concerts (Estimated) 5,000 5,000 5,000 5,000 5,000
Total AttendanceBaseball Regular Season 273,600 251,712 232,013 232,013 229,853Exhibition Baseball Games 4,500 4,500 4,500 4,500 4,500Concerts 10,000 10,000 10,000 10,000 10,000Total 288,100 266,212 246,513 246,513 244,353
Ticket Sales 2011 2012 2013 2014 2015General AdmissionTicket Sales per Game 3,040 2,736 2,462 2,462 2,462Games 72 72 72 72 72Baseball Season 218,880 196,992 177,293 177,293 177,293
Club SeatsInventory per Game Club Seats 850 850 850 850 850Percentage of Inventory Sold 71% 71% 71% 71% 67%Ticket Sales per Game 600 600 600 600 570Games 72 72 72 72 72Baseball Season 43,200 43,200 43,200 43,200 41,040
SuitesInventory 200 200 200 200 200Percentage of Inventory Sold 80.0% 80.0% 80.0% 80.0% 80.0%Ticket Sales per Game 160 160 160 160 160Games 72 72 72 72 72
Baseball Season 11,520 11,520 11,520 11,520 11,520
Total Ticket Sales AAA Baseball 273,600 251,712 232,013 232,013 229,853
HVS CSE\\Chnet1\HVSCH\Projects\Portland, OR Sports (PFM)\new work Lents Site\Work Product\Draft Review Lents Park Ballpark Proforma - June 3. 2009.xls 6/3/2009
Pro Forma Comparison Page 7 of 15
Revised Ballpark Proforma for Lents Park Site
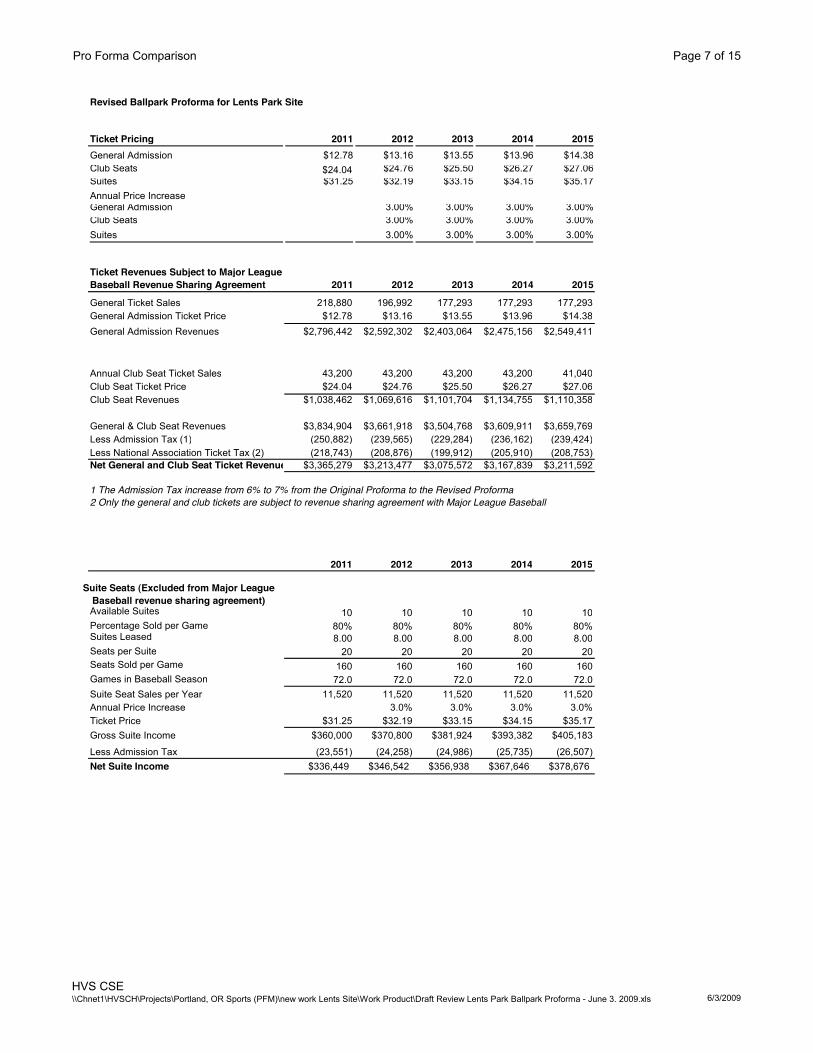
Ticket Pricing 2011 2012 2013 2014 2015General Admission $12.78 $13.16 $13.55 $13.96 $14.38 Club Seats $24.04 $24.76 $25.50 $26.27 $27.06 Suites $31.25 $32.19 $33.15 $34.15 $35.17
General Admission 3.00% 3.00% 3.00% 3.00%Club Seats 3.00% 3.00% 3.00% 3.00%Suites 3.00% 3.00% 3.00% 3.00%
Ticket Revenues Subject to Major League Baseball Revenue Sharing Agreement 2011 2012 2013 2014 2015
General Ticket Sales 218,880 196,992 177,293 177,293 177,293General Admission Ticket Price $12.78 $13.16 $13.55 $13.96 $14.38General Admission Revenues $2,796,442 $2,592,302 $2,403,064 $2,475,156 $2,549,411
Annual Club Seat Ticket Sales 43,200 43,200 43,200 43,200 41,040Club Seat Ticket Price $24.04 $24.76 $25.50 $26.27 $27.06Club Seat Revenues $1,038,462 $1,069,616 $1,101,704 $1,134,755 $1,110,358
General & Club Seat Revenues $3,834,904 $3,661,918 $3,504,768 $3,609,911 $3,659,769Less Admission Tax (1) (250,882) (239,565) (229,284) (236,162) (239,424)Less National Association Ticket Tax (2) (218,743) (208,876) (199,912) (205,910) (208,753)Net General and Club Seat Ticket Revenues $3,365,279 $3,213,477 $3,075,572 $3,167,839 $3,211,592
1 The Admission Tax increase from 6% to 7% from the Original Proforma to the Revised Proforma2 Only the general and club tickets are subject to revenue sharing agreement with Major League Baseball
2011 2012 2013 2014 2015
Available Suites 10 10 10 10 10Percentage Sold per Game 80% 80% 80% 80% 80%Suites Leased 8.00 8.00 8.00 8.00 8.00Seats per Suite 20 20 20 20 20Seats Sold per Game 160 160 160 160 160Games in Baseball Season 72.0 72.0 72.0 72.0 72.0Suite Seat Sales per Year 11,520 11,520 11,520 11,520 11,520Annual Price Increase 3.0% 3.0% 3.0% 3.0%Ticket Price $31.25 $32.19 $33.15 $34.15 $35.17Gross Suite Income $360,000 $370,800 $381,924 $393,382 $405,183
Less Admission Tax (23,551) (24,258) (24,986) (25,735) (26,507)Net Suite Income $336,449 $346,542 $356,938 $367,646 $378,676
Annual Price Increase
Suite Seats (Excluded from Major League Baseball revenue sharing agreement)
HVS CSE\\Chnet1\HVSCH\Projects\Portland, OR Sports (PFM)\new work Lents Site\Work Product\Draft Review Lents Park Ballpark Proforma - June 3. 2009.xls 6/3/2009

Pro Forma Comparison Page 8 of 15
Revised Ballpark Proforma for Lents Park Site
2011 2012 2013 2014 2015ConcessionsGeneral and Club Seat Ticket Sales 262,080 240,192 220,493 220,493 218,333Attending Event 90% 90% 90% 90% 90%Turnstile 235,872 216,173 198,444 198,444 196,500Per Cap $10.27 $10.68 $11.11 $11.55 $12.01 Gross General and Club Concessions $2,421,771 $2,308,294 $2,203,742 $2,291,892 $2,360,217
Suite Ticket Sales 11,520 11,520 11,520 11,520 11,520Attending Event 90% 90% 90% 90% 90%Turnstile 10,368 10,368 10,368 10,368 10,368Per Cap for Suites $24.13 $25.09 $26.10 $27.14 $28.23 Gross Suite Concessions $250,171 $260,178 $270,585 $281,409 $292,665
Total Gross Concessions $2,671,943 $2,568,472 $2,474,327 $2,573,300 $2,652,883 Cost, Team and Loan 71.97% 73.09% 74.24% 74.07% 74.05%
Expenses $1,922,867 $1,877,255 $1,836,986 $1,906,009 $1,964,541
Net Commission $749,076 $691,217 $637,341 $667,291 $688,342
Blended Commission Rate 28.03% 26.91% 25.76% 25.93% 25.95%
2011 2012 2013 2014 2015MerchandiseTicket Sales 273,600 251,712 232,013 232,013 229,853Attending Event 90% 90% 90% 90% 90%Turnstile 246,240 226,541 208,812 208,812 206,868Per Cap $1.47 $1.53 $1.59 $1.65 $1.72 Gross Merchandise $361,560 $345,940 $331,622 $344,887 $355,343 Cost Percentage 80% 80% 80% 80% 80%Merchandise Sales Expense $289,248 $276,752 $265,297 $275,909 $284,274
Net Commission $72,312 $69,188 $66,324 $68,977 $71,069
2011 2012 2013 2014 2015ExhibitionsNumber of Events 0.5 0.5 0.5 0.5 0.5Total Revenues $245,668 $241,852 $238,704 $246,522 $252,414 Net Other Revenues & Expenses (71,451) (70,341) (69,426) (71,699) (73,413)Total $174,217 $171,511 $169,278 $174,823 $179,001
HVS CSE\\Chnet1\HVSCH\Projects\Portland, OR Sports (PFM)\new work Lents Site\Work Product\Draft Review Lents Park Ballpark Proforma - June 3. 2009.xls 6/3/2009

Pro Forma Comparison Page 9 of 15
Revised Ballpark Proforma for Lents Park Site
2011 2012 2013 2014 2015Parking RevenuesTicket Sales 273,600 251,712 232,013 232,013 229,853Attending Event 90% 90% 90% 90% 90%Turnstile 246,240 226,541 208,812 208,812 206,868Persons per Car 4.00 4.00 4.00 4.00 4.00 Cars Parking 61,560 56,635 52,203 52,203 51,717 Parking Fee $5.55 $5.77 $6.00 $6.24 $6.49 Gross Parking Revenues $341,494 $326,741 $313,217 $325,746 $335,622 Expenses 30% 30% 30% 30% 30%Less Expenses ($102,448) ($98,022) ($93,965) ($97,724) ($100,687)
Net Parking Revenues $239,046 $228,719 $219,252 $228,022 $234,935
Net Parking Percentage 70% 70% 70% 70% 70%Average per Game 855 787 725 725 718
2011 2012 2013 2014 2015SponsorshipsTeam Sponsorships $1,421,323 $1,463,963 $1,507,882 $1,553,118 $1,599,712 Naming Rights 600,000 618,000 636,540 655,637 675,306
Total Advertising $2,021,323 $2,081,963 $2,144,422 $2,208,756 $2,275,018 Inflation Team Sponsorships 3.00% 3.00% 3.00% 3.00%Inflation Naming Rights 3.00% 3.00% 3.00% 3.00%
2011 2012 2013 2014 2015ConcertsRent $24,005 $24,915 $25,871 $26,647 $27,269Concessions Commission per Event 46,618 47,683 48,732 50,825 52,881Revenue per Event $70,624 $72,598 $74,603 $77,472 $80,150 Events 2.00 2.00 2.00 2.00 2.00Total Revenue $141,247 $145,197 $149,205 $154,944 $160,300Less Expenses (13,749) (14,161) (14,586) (15,024) (15,474)Concerts Net Income $127,498 $131,036 $134,619 $139,920 $144,826Inflation RentInflation ConcessionsExpenses
Party and other Income $72,762 $75,535 $78,414 $81,404 $84,509Total Other Income $200,260 $206,571 $213,033 $221,324 $229,335
HVS CSE\\Chnet1\HVSCH\Projects\Portland, OR Sports (PFM)\new work Lents Site\Work Product\Draft Review Lents Park Ballpark Proforma - June 3. 2009.xls 6/3/2009

Pro Forma Comparison Page 10 of 15
Revised Ballpark Proforma for Lents Park Site
2011 2012 2013 2014 2015Revenues
General & Club Tickets $3,365,279 $3,213,477 $3,075,572 $3,167,839 $3,211,592 Suites 336,449 346,542 356,938 367,646 378,676Concessions 749,076 691,217 637,341 667,291 688,342Merchandise 72,312 69,188 66,324 68,977 71,069Pre/Post/Exhibitions 174,217 171,511 169,278 174,823 179,001Parking 239,046 228,719 219,252 228,022 234,935Advertising and Sponsorships 1,421,323 1,463,963 1,507,882 1,553,118 1,599,712Naming Rights 600,000 618,000 636,540 655,637 675,306Other Event Revenues 200,260 206,571 213,033 221,324 229,335Other Non-Ballpark Revenues 35,086 36,489 37,949 39,467 41,045
Total Revenues $7,193,048 $7,045,677 $6,920,110 $7,144,145 $7,309,012Inflation Total Revenues -2.0% -1.8% 3.2% 2.3%
2011 2012 2013 2014 2015Team Expenses
Team Operations $595,380 $613,242 $631,639 $650,588 $670,106 Sales and Advertising 3,051,154 2,514,151 2,589,575 2,667,263 2,747,280G&A 864,478 785,177 808,732 832,994 857,984Total Team Expenses $4,511,012 $3,912,570 $4,029,946 $4,150,845 $4,275,370
Ballpark ExpensesBallpark Operations $1,988,255 $2,047,903 $2,109,340 $2,172,620 $2,237,797 Stadium Rent 500,000 525,000 550,000 575,000 600,000
Total Stadium Operations $2,488,255 $2,572,903 $2,659,340 $2,747,620 $2,837,797 Total Expenses $6,999,267 $6,485,473 $6,689,286 $6,898,465 $7,113,167
Inflation Total Expenses -7.34% 3.14% 3.13% 3.11%
EBITDA $193,781 $560,204 $230,824 $245,680 $195,845
HVS CSE\\Chnet1\HVSCH\Projects\Portland, OR Sports (PFM)\new work Lents Site\Work Product\Draft Review Lents Park Ballpark Proforma - June 3. 2009.xls 6/3/2009

Pro Forma Comparison Page 11 of 15
Revised Lents Park Proforma less Original Proforma
2011 2012 2013 2014 2015
Type of EventAAA Baseball 0.0 0.0 0.0 0.0 0.0Exhibition Baseball Games 0.0 0.0 0.0 0.0 0.0Concerts -1.0 -1.0 -1.0 -1.0 -1.0Total -1.0 -1.0 -1.0 -1.0 -1.0
Average AttendanceAAA Baseball -700 -638 -583 -583 -583Percentage Decrease Baseball Attendance per Game -15.56% -15.43% -15.31% -15.31% -15.43%Exhibition Baseball Games (Estimated) 0 0 0 0 0Concerts (Estimated) 0 0 0 0 0
Total AttendanceBaseball Regular Season -50,400 -45,936 -41,947 -41,947 -41,947Exhibition Baseball Games 0 0 0 0 0Concerts -5,000 -5,000 -5,000 -5,000 -5,000Total -55,400 -50,936 -46,947 -46,947 -46,947
Percentage Decline in Total Attendance -16.13% -16.06% -16.00% -16.00% -16.12%
Ticket Sales 2011 2012 2013 2014 2015General AdmissionTicket Sales per Game -620 -558 -502 -502 -502Games 0 0 0 0 0Baseball Season -44,640 -40,176 -36,158 -36,158 -36,158
Club SeatsInventory per Game Club Seats 0 0 0 0 0Percentage of Inventory Sold 0% 0% 0% 0% 0%Ticket Sales per Game 0 0 0 0 0Games 0 0 0 0 0Baseball Season 0 0 0 0 0
SuitesInventory -80 -80 -80 -80 -80Percentage of Inventory SoldTicket Sales per Game -80 -80 -80 -80 -80Games
Baseball Season -5,760 -5,760 -5,760 -5,760 -5,760
Total Ticket Sales AAA Baseball -50,400 -45,936 -41,918 -41,918 -41,918Percentage Decline in Baseball Attendance -15.56% -15.43% -15.30% -15.30% -15.42%
HVS CSE\\Chnet1\HVSCH\Projects\Portland, OR Sports (PFM)\new work Lents Site\Work Product\Draft Review Lents Park Ballpark Proforma - June 3. 2009.xls 6/3/2009
Pro Forma Comparison Page 12 of 15
Revised Lents Park Proforma less Original Proforma
Ticket Pricing 2011 2012 2013 2014 2015General Admission -$0.13 -$0.14 -$0.14 -$0.15 -$0.15Club Seats $0.00 $0.00 $0.00 $0.00 $0.00Suites -$2.14 -$2.20 -$2.27 -$2.34 -$2.41
General AdmissionClub SeatsSuites
Ticket Revenues Subject to Major League Baseball Revenue Sharing Agreement 2011 2012 2013 2014 2015
General Ticket Sales -44,640 -40,176 -36,158 -36,158 -36,158General Admission Ticket Price ($0.13) ($0.14) ($0.14) ($0.15) ($0.15)
General Admission Revenues ($605,601) ($561,392) ($520,408) ($536,020) ($552,100)
Percentage Decline General Admission Revenues -17.80% -17.80% -17.80% -17.80% -17.80%
Annual Club Seat Ticket Sales 0 0 0 0 0Club Seat Ticket Price 0.00 0.00 0.00 0.00 0.00Club Seat Revenues 0 0 0 0 0
General & Club Seat Revenues ($605,601) ($561,392) ($520,408) ($536,020) ($552,100)Less Admission Tax (1) 468 (509) (1,444) (1,487) (1,016)Less National Association Ticket Tax (2) 36,933 34,294 31,850 32,806 33,758 Net General and Club Seat Ticket Revenues ($568,200) ($527,607) ($490,001) ($504,701) ($519,358)Percentage Decline in General and Club Seat Revenues -14.45% -14.10% -13.74% -13.74% -13.92%1 The Admission Tax increase from 6% to 7% from the Original Proforma to the Revised Proforma2 Only the general and club tickets are subject to revenue sharing agreement with Major League Baseball
2011 2012 2013 2014 2015
Available Suites -4 -4 -4 -4 -4Percentage Sold per GameSuites Leased -4 -4 -4 -4 -4Seats per SuiteSeats Sold per Game -80 -80 -80 -80 -80Games in Baseball SeasonSuite Seat Sales per Year -5,760 -5,760 -5,760 -5,760 -5,760Annual Price IncreaseTicket Price ($2.14) ($2.20) ($2.27) ($2.33) ($2.40)Gross Suite Income ($216,923) ($223,431) ($230,134) ($237,037) ($244,149)
Less Admission Tax 9,105 9,378 9,659 9,949 10,247 Net Suite Income ($207,818) ($214,053) ($220,475) ($227,088) ($233,901)Percentage Decline in Suite Income -38.18% -38.18% -38.18% -38.18% -38.18%
Annual Price Increase
Suite Seats (Excluded from Major League Baseball revenue sharing agreement)
HVS CSE\\Chnet1\HVSCH\Projects\Portland, OR Sports (PFM)\new work Lents Site\Work Product\Draft Review Lents Park Ballpark Proforma - June 3. 2009.xls 6/3/2009
Pro Forma Comparison Page 13 of 15
Revised Lents Park Proforma less Original Proforma
2011 2012 2013 2014 2015ConcessionsGeneral and Club Seat Ticket Sales -44,640 -40,176 -36,158 -36,158 -36,158Attending EventTurnstile -40,176 -36,158 -32,542 -32,542 -32,542Per Cap 0.00 0.00 0.00 0.00 0.00Gross General and Club Concessions ($412,500) ($386,100) ($361,385) ($375,841) ($390,874)Percentage Decline in General & /club Concession Revenues -14.55% -14.33% -14.09% -14.09% -14.21%
Suite Ticket Sales -5,760 -5,760 -5,760 -5,760 -5,760Attending EventTurnstile -5,184 -5,184 -5,184 -5,184 -5,184Per Cap for Suites 0.00 0.00 0.00 0.00 0.00Gross Suite Concessions ($125,086) ($130,089) ($135,293) ($140,704) ($146,333)Percentage Decline in Suite Concession Revenues -33.33% -33.33% -33.33% -33.33% -33.33%
Total Gross Concessions ($537,585) ($516,189) ($496,678) ($516,545) ($537,207)Cost, Team and Loan
Expenses ($319,453) ($308,286) ($298,146) ($310,127) ($322,600)
Net Commission ($218,132) ($207,903) ($198,532) ($206,418) ($214,607)Percentage Decline in Total Concession Income -22.55% -23.12% -23.75% -23.63% -23.77%
2011 2012 2013 2014 2015MerchandiseTicket Sales -50,400 -45,936 -41,918 -41,918 -41,918Attending EventTurnstile -45,360 -41,342 -37,726 -37,726 -37,726Per Cap 0.00 0.00 0.00 0.00 0.00Gross Merchandise ($66,603) ($63,132) ($59,914) ($62,311) ($64,803)Cost PercentageMerchandise Sales Expense ($53,283) ($50,506) ($47,932) ($49,849) ($51,843)
Net Commission ($13,321) ($12,626) ($11,983) ($12,462) ($12,961)
Percentage Decline in Merchandise Income -15.56% -15.43% -15.30% -15.30% -15.42%
2011 2012 2013 2014 2015ExhibitionsNumber of EventsTotal Ticket Revenues $45,312 $51,296 $57,087 $59,457 $62,374 Net Other Revenues & Expenses (64,032) (68,855) (73,581) (76,474) (79,930)
Total ($18,720) ($17,559) ($16,494) ($17,017) ($17,556)Percentage Decline in Exhibition Income -9.70% -9.29% -8.88% -8.87% -8.93%
HVS CSE\\Chnet1\HVSCH\Projects\Portland, OR Sports (PFM)\new work Lents Site\Work Product\Draft Review Lents Park Ballpark Proforma - June 3. 2009.xls 6/3/2009
Pro Forma Comparison Page 14 of 15
Revised Lents Park Proforma less Original Proforma
2011 2012 2013 2014 2015Parking RevenuesTicket Sales -50,400 -45,936 -41,918 -41,918 -41,918Attending EventTurnstile -45,360 -41,342 -37,726 -37,726 -37,726Persons per CarCars Parking -11,340 -10,336 -9,432 -9,432 -9,432Parking Fee 0.00 0.00 0.00 0.00 0.00Gross Parking Revenues ($62,907) ($59,629) ($56,590) ($58,853) ($61,207)Expenses 0% 0% 0% 0% 0%Less Expenses $18,872 $17,889 $16,977 $17,656 $18,362
Net Parking Revenues ($44,035) ($41,740) ($39,613) ($41,197) ($42,845)
Percentage Decline Parking Income -15.56% -15.43% -15.30% -15.30% -15.42%
2011 2012 2013 2014 2015SponsorshipsTeam Sponsorships $0 $0 $0 $0 $0 Naming Rights (50,000) (51,500) (53,045) (54,636) (56,275)
Total Advertising ($50,000) ($51,500) ($53,045) ($54,636) ($56,275)
Percentage Decline Sponsorship and Naming Rights Income -2.41% -2.41% -2.41% -2.41% -2.41%
Other Income 2011 2012 2013 2014 2015ConcertsRentConcessionsRevenue per EventEventsTotal RevenueLess ExpensesConcerts Net Income ($68,125) ($70,250) ($72,423) ($75,225) ($78,011)Inflation RentInflation ConcessionsExpenses
Party and other IncomeTotal Other Income ($74,998) ($77,330) ($79,715) ($82,738) ($85,749)Percentage Decline in Other Income -27.25% -27.24% -27.23% -27.21% -27.21%
HVS CSE\\Chnet1\HVSCH\Projects\Portland, OR Sports (PFM)\new work Lents Site\Work Product\Draft Review Lents Park Ballpark Proforma - June 3. 2009.xls 6/3/2009

Pro Forma Comparison Page 15 of 15
Revised Lents Park Proforma less Original Proforma
2011 2012 2013 2014 2015Revenues
General & Club Tickets ($568,200) ($527,607) ($490,001) ($504,701) ($519,358)Suites (207,818) (214,053) (220,475) (227,088) (233,901)Concessions (218,132) (207,903) (198,532) (206,418) (214,607)Merchandise (13,321) (12,626) (11,983) (12,462) (12,961)Pre/Post/Exhibitions (18,720) (17,559) (16,494) (17,017) (17,556)Parking (44,035) (41,740) (39,613) (41,197) (42,845)Advertising and Sponsorships 0 0 0 0 0 Naming Rights (50,000) (51,500) (53,045) (54,636) (56,275)Other Event Revenues (74,998) (77,330) (79,715) (82,738) (85,749)Other Non-Ballpark Revenues 0 0 0 0 0
Total Revenues ($1,195,224) ($1,150,319) ($1,109,858) ($1,146,258) ($1,183,253)Percentage Decline in Total Revenues -14.25% -14.04% -13.82% -13.83% -13.93%
2011 2012 2013 2014 2015Team Expenses
Team Operations 0 0 0 0 0 Sales and Advertising 0 0 0 0 0 G&A 0 0 0 0 0 Total Team Expenses $0 $0 $0 $0 $0
Ballpark ExpensesBallpark Operations 0 0 0 0 0 Stadium Rent (125,000) (125,000) (125,000) (125,000) (125,000)
Total Stadium Operations ($125,000) ($125,000) ($125,000) ($125,000) ($125,000)Total Expenses ($125,000) ($125,000) ($125,000) ($125,000) ($125,000)
Percentage Decline in Total Expenses -1.75% -1.89% -1.83% -1.78% -1.73%
EBITDA ($1,070,224) ($1,025,319) ($984,858) ($1,021,258) ($1,058,253)Percentage Decline in EDITDA -84.67% -64.67% -81.01% -80.61% -84.38%
HVS CSE\\Chnet1\HVSCH\Projects\Portland, OR Sports (PFM)\new work Lents Site\Work Product\Draft Review Lents Park Ballpark Proforma - June 3. 2009.xls 6/3/2009