PORTFOLIO MANAGEMENT - Study...
59
www.studymafia.org A Seminar report On PORTFOLIO MANAGEMENT Submitted in partial fulfillment of the requirement for the award of degree Of MBA SUBMITTED TO: SUBMITTED BY: www.studymafia.org www.studymafia.org
Transcript of PORTFOLIO MANAGEMENT - Study...
www.studymafia.org
A
Seminar report
On
PORTFOLIO MANAGEMENT Submitted in partial fulfillment of the requirement for the award of degree
Of MBA
SUBMITTED TO: SUBMITTED BY:
www.studymafia.org www.studymafia.org

www.studymafia.org
5
Acknowledgement
I would like to thank respected Mr…….. and Mr. ……..for giving me such a wonderful
opportunity to expand my knowledge for my own branch and giving me guidelines to
present a seminar report. It helped me a lot to realize of what we study for.
Secondly, I would like to thank my parents who patiently helped me as i went through
my work and helped to modify and eliminate some of the irrelevant or un-necessary
stuffs.
Thirdly, I would like to thank my friends who helped me to make my work more
organized and well-stacked till the end.
Next, I would thank Microsoft for developing such a wonderful tool like MS Word. It
helped my work a lot to remain error-free.
Last but clearly not the least, I would thank The Almighty for giving me strength to
complete my report on time.
www.studymafia.org
6
Preface I have made this report file on the topic; Portfolio Management; I have tried my best to
elucidate all the relevant detail to the topic to be included in the report. While in the
beginning I have tried to give a general view about this topic.
My efforts and wholehearted co-corporation of each and everyone has ended on a
successful note. I express my sincere gratitude to …………..who assisting me
throughout the preparation of this topic. I thank him for providing me the
reinforcement, confidence and most importantly the track for the topic whenever I
needed it.
www.studymafia.org
7
CONTENTS
1. INTRODUCTION
2. PORTFOLIO ANALYSIS
3. ANALYSIS & INTERPRETION
4. CALCULATION OF AVERAGE RETURN OF COMPANIES
5. CALCULATION OF PORTFOLIO RISK
6. CALCULATION OF PORTFOLIO WEIGHTS
7. CONCLUSION
8. BIBILOGRAPHY

www.studymafia.org
8
PORT FOLIO MANAGEMENT
MEANING:
A portfolio is a collection of assets. The assets may be physical or financial
like Shares, Bonds, Debentures, Preference Shares, etc. The individual investor or
a fund manager would not like to put all his money in the sares of one company,
that would amount to great risk. He would therefore, follow the age old maxim
that one should not put all the egges into one basket. By doing so, he can achieve
objective to maximize portfolio return and at the same time minimizing the
portfolio risk by diversification.
Portfolio management is the management of various financial assets which
comprise the portfolio.
Portfolio management is a decision – support system that is designed with a
view to meet the multi-faced needs of investors.
According to Securities and Exchange Board of India Portfolio Manager is
defined as: “portfolio means the total holdings of securities belonging to any
person”.
PORTFOLIO MANAGER means any person who pursuant to a contract
or arrangement with a client, advises or directs or undertakes on behalf of
the client (whether as a discretionary portfolio manager or otherwise) the
management or administration of a portfolio of securities or the funds of the
client.
DISCRETIONARY PORTFOLIO MANAGER means a portfolio
manager who exercises or may, under a contract relating to portfolio
management exercises any degree of discretion as to the investments or
management of the portfolio of securities or the funds of the client.
www.studymafia.org
9
RESEARCH
(e.g. Security
Analysis)
PORTFOLIO
MANAGERS
OPERATIONS
(e.g. buying and
selling of Securities)
CLIENTS
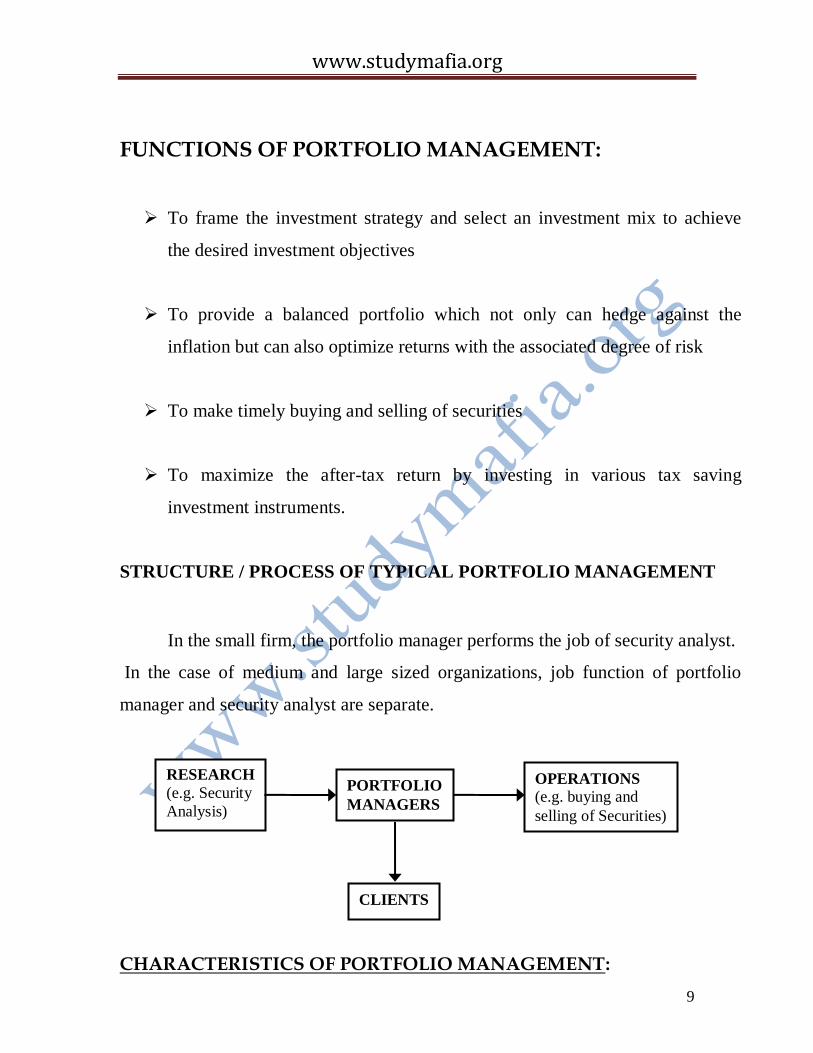
FUNCTIONS OF PORTFOLIO MANAGEMENT:
To frame the investment strategy and select an investment mix to achieve
the desired investment objectives
To provide a balanced portfolio which not only can hedge against the
inflation but can also optimize returns with the associated degree of risk
To make timely buying and selling of securities
To maximize the after-tax return by investing in various tax saving
investment instruments.
STRUCTURE / PROCESS OF TYPICAL PORTFOLIO MANAGEMENT
In the small firm, the portfolio manager performs the job of security analyst.
In the case of medium and large sized organizations, job function of portfolio
manager and security analyst are separate.
CHARACTERISTICS OF PORTFOLIO MANAGEMENT:
www.studymafia.org
10
Individuals will benefit immensely by taking portfolio management services
for the following reasons:
Whatever may be the status of the capital market, over the long period
capital markets have given an excellent return when compared to other
forms of investment. The return from bank deposits, units, etc., is much less
than from the stock market.
The Indian Stock Markets are very complicated. Though there are thousands
of companies that are listed only a few hundred which have the necessary
liquidity. Even among these, only some have the growth prospects which are
conducive for investment. It is impossible for any individual wishing to
invest and sit down and analyze all these intricacies of the market unless he
does nothing else.
Even if an investor is able to understand the intricacies of the market and
separate chaff from the grain the trading practices in India are so
complicated that it is really a difficult task for an investor to trade in all the
major exchanges of India, look after his deliveries and payments. This is
further complicated by the volatile nature of our markets which demands
constant reshuffing of portfolios.
TYPES OF PORTFOLIO MANAGEMENT:
1. DISCRETIONARY PORTFOLIO MANAGEMENT SERVICE (DPMS):
www.studymafia.org
11
In this type of service, the client parts with his money in favour of the
manager, who in return, handles all the paper work, makes all the decisions and
gives a good return on the investment and charges fees. In the Discretionary
Portfolio Management Service, to maximise the yield, almost all portfolio
managers park the funds in the money market securities such as overnight market,
18 days treasury bills and 90 days commercial bills. Normally, the return of such
investment varies from 14 to 18 percent, depending on the call money rates
prevailing at the time of investment.
2. NON-DISCRETIONARY PORTFOLIO MANAGEMENT SERVICE
(NDPMS):
The manager functions as a counsellor, but the investor is free to accept or
reject the manager‘s advice; the paper work is also undertaken by manager for a
service charge. The manager concentrates on stock market instruments with a
portfolio tailor-made to the risk taking ability of the investor.
IMPORTANCE OF PORTFOLIO MANAGEMENT:
Emergence of institutional investing on behalf of individuals. A number of
financial institutions, mutual funds and other agencies are undertaking the
task of investing money of small investors, on their behalf.
Growth in the number and size of investigable funds – a large part of
household savings is being directed towards financial assets.
www.studymafia.org
12
Increased market volatility – risk and return parameters of financial assets
are continuously changing because of frequent changes in government‘s
industrial and fiscal policies, economic uncertainty and instability.
Greater use of computers for processing mass of data.
Professionalization of the field and increasing use of analytical methods (e.g.
quantitative techniques) in the investment decision – making
Larger direct and indirect costs of errors or shortfalls in meeting portfolio
objectives – increased competition and greater scrutiny by investors.
STEPS IN PORTFOLIO MANAGEMENT:
Specification and qualification of investor objectives, constraints, and
preferences in the form of an investment policy statement.
Determination and qualification of capital market expectations for the
economy, market sectors, industries and individual securities.
Allocation of assets and determination of appropriate portfolio strategies for
each asset class and selection of individual securities.
Performance measurement and evaluation to ensure attainment of investor
objectives.
Monitoring portfolio factors and responding to changes in investor
objectives, constrains and / or capital market expectations.
www.studymafia.org
13
Rebalancing the portfolio when necessary by repeating the asset allocation,
portfolio strategy and security selection.
CRITERIA FOR PORTFOLIO DECISIONS:
In portfolio management emphasis is put on identifying the collective
importance of all investors holdings. The emphasis shifts from individual
assets selection to a more balanced emphasis on diversification and risk-
return interrelationships of individual assets within the portfolio. Individual
securities are important only to the extent they affect the aggregate portfolio.
In short, all decisions should focus on the impact which the decision will
have on the aggregate portfolio of all the assets held.
Portfolio strategy should be moulded to the unique needs and characteristics
of the portfolio‘s owner.
Diversification across securities will reduce a portfolio‘s risk. If the risk and
return are lower than the desired level, leverages (borrowing) can be used to
achieve the desired level.
Larger portfolio returns come only with larger portfolio risk. The most
important decision to make is the amount of risk which is acceptable.
The risk associated with a security type depends on when the investment
will be liquidated. Risk is reduced by selecting securities with a payoff close
to when the portfolio is to be liquidated.
www.studymafia.org
14
Competition for abnormal returns is extensive, so one has to be careful in
evaluating the risk and return from securities. Imbalances do not last long and one
has to act fast to profit from exceptional opportunities.
QUALITIES OF PORTFOLIO MANAGER:
1. SOUND GENERAL KNOWLEDGE: Portfolio management is an
exciting and challenging job. He has to work in an extremely uncertain and
confliction environment. In the stock market every new piece of information
affects the value of the securities of different industries in a different way. He
must be able to judge and predict the effects of the information he gets. He must
have sharp memory, alertness, fast intuition and self-confidence to arrive at quick
decisions.
2. ANALYTICAL ABILITY: He must have his own theory to arrive at the
instrinsic value of the security. An analysis of the security‘s values, company, etc.
is s continuous job of the portfolio manager. A good analyst makes a good
financial consultant. The analyst can know the strengths, weaknesses,
opportunities of the economy, industry and the company.
3. MARKETING SKILLS: He must be good salesman. He has to
convince the clients about the particular security. He has to compete with the stock
brokers in the stock market. In this context, the marketing skills help him a lot.
4. EXPERIENCE: In the cyclical behaviour of the stock market history is
often repeated, therefore the experience of the different phases helps to make
www.studymafia.org
15
rational decisions. The experience of the different types of securities, clients,
market trends, etc., makes a perfect professional manager.
PORTFOLIO BUILDING:
Portfolio decisions for an individual investor are influenced by a wide
variety of factors. Individuals differ greatly in their circumstances and therefore, a
financial programme well suited to one individual may be inappropriate for
another. Ideally, an individual‘s portfolio should be tailor-made to fit one‘s
individual needs.
Investor‘s Characteristics:
An analysis of an individual‘s investment situation requires a study of
personal characteristics such as age, health conditions, personal habits, family
responsibilities, business or professional situation, and tax status, all of which
affect the investor‘s willingness to assume risk.
Stage in the Life Cycle:
One of the most important factors affecting the individual‘s investment
objective is his stage in the life cycle. A young person may put greater emphasis
on growth and lesser emphasis on liquidity. He can afford to wait for realization of
capital gains as his time horizon is large.
Family responsibilities:
www.studymafia.org
16
The investor‘s marital status and his responsibilities towards other members of the
family can have a large impact on his investment needs and goals.
Investor‘s experience:
The success of portfolio depends upon the investor‘s knowledge and
experience in financial matters. If an investor has an aptitude for financial affairs,
he may wish to be more aggressive in his investments.
Attitude towards Risk:
A person‘s psychological make-up and financial position dictate his ability to
assume the risk. Different kinds of securities have diffferent kinds of risks. The
higher the risk, the greater the opportunity for higher gain or loss.
Liquidity Needs:
Liquidity needs vary considerably among individual investors. Investors
with regular income from other sources may not worry much about instantaneous
liquidity, but individuals who depend heavily upon investment for meeting their
general or specific needs, must plan portfolio to match their liquidity needs.
Liquidity can be obtained in two ways:
1. by allocating an appropriate percentage of the portfolio to bank deposits, and
2. by requiring that bonds and equities purchased be highly marketable.
Tax considerations:
Since different individuals, depending upon their incomes, are subjected to
different marginal rates of taxes, tax considerations become most important factor

www.studymafia.org
17
in individual‘s portfolio strategy. There are differing tax treatments for investment
in various kinds of assets.
Time Horizon:
In investment planning, time horizon become an important consideration. It is
highly variable from individual to individual. Individuals in their young age have
long time horizon for planning, they can smooth out and absorb the ups and downs
of risky combination. Individuals who are old have smaller time horizon, they
generally tend to avoid volatile portfolios.
Individual‘s Financial Objectives:
In the initial stages, the primary objective of an individual could be to
accumulate wealth via regular monthly savings and have an investment programme
to achieve long term capital gains.
Safety of Principal:
The protection of the rupee value of the investment is of prime importance to
most investors. The original investment can be recovered only if the security can
be readily sold in the market without much loss of value.
Assurance of Income:
`Different investors have different current income needs. If an individual is
dependent of its investment income for current consumption then income received
now in the form of dividend and interest payments become primary objective.

www.studymafia.org
18
Investment Risk:
All investment decisions revolve around the trade-off between risk and
return. All rational investors want a substantial return from their investment. An
ability to understand, measure and properly manage investment risk is fundamental
to any intelligent investor or a speculator. Frequently, the risk associated with
security investment is ignored and only the rewards are emphasized. An investor
who does not fully appreciate the risks in security investments will find it difficult
to obtain continuing positive results.
RISK AND EXPECTED RETURN:
There is a positive relationship between the amount of risk and the amount of
expected return i.e., the greater the risk, the larger the expected return and larger
the chances of substantial loss. One of the most difficult problems for an investor is
to estimate the highest level of risk he is able to assume.
Risk is measured along the horizontal axis and increases from the left to
right.
www.studymafia.org
19
Expected rate of return is measured on the vertical axis and rises from
bottom to top.
The line from 0 to R (f) is called the rate of return or risk less investments
commonly associated with the yield on government securities.
The diagonal line form R (f) to E(r) illustrates the concept of expected rate
of return increasing as level of risk increases.
TYPES OF RISKS:
Risk consists of two components. They are
1. Systematic Risk
2. Un-systematic Risk
1. Systematic Risk:
Systematic risk is caused by factors external to the particular company and
uncontrollable by the company. The systematic risk affects the market as a whole.
Factors affect the systematic risk are
economic conditions
political conditions
sociological changes
www.studymafia.org
20
The systematic risk is unavoidable. Systematic risk is further sub-divided into three
types. They are
a) Market Risk
b) Interest Rate Risk
c) Purchasing Power Risk
a). Market Risk:
One would notice that when the stock market surges up, most stocks post higher
price. On the other hand, when the market falls sharply, most common stocks will
drop. It is not uncommon to find stock prices falling from time to time while a
company‘s earnings are rising and vice-versa. The price of stock may fluctuate
widely within a short time even though earnings remain unchanged or relatively
stable.
b). Interest Rate Risk:
Interest rate risk is the risk of loss of principal brought about the changes in the
interest rate paid on new securities currently being issued.
c). Purchasing Power Risk:
The typical investor seeks an investment, which will give him current income and /
or capital appreciation in addition to his original investment.
2. Un-systematic Risk:
www.studymafia.org
21
Un-systematic risk is unique and peculiar to a firm or an industry. The nature and
mode of raising finance and paying back the loans, involve the risk element.
Financial leverage of the companies that is debt-equity portion of the companies
differs from each other. All these factors Factors affect the un-systematic risk and
contribute a portion in the total variability of the return.
Managerial inefficiently
Technological change in the production process
Availability of raw materials
Changes in the consumer preference
Labour problems
The nature and magnitude of the above mentioned factors differ from industry to
industry and company to company. They have to be analyzed separately for each
industry and firm. Un-systematic risk can be broadly classified into:
a) Business Risk
b) Financial Risk
a. Business Risk:
Business risk is that portion of the unsystematic risk caused by the operating
environment of the business. Business risk arises from the inability of a firm to
maintain its competitive edge and growth or stability of the earnings. The
volatibility in stock prices due to factors intrinsic to the company itself is known as
Business risk. Business risk is concerned with the difference between revenue and
earnings before interest and tax. Business risk can be divided into.
i). Internal Business Risk
Internal business risk is associated with the operational efficiency of the
firm. The operational efficiency differs from company to company. The efficiency

www.studymafia.org
22
of operation is reflected on the company‘s achievement of its pre-set goals and the
fulfillment of the promises to its investors.
ii). External Business Risk
External business risk is the result of operating conditions imposed on the
firm by circumstances beyond its control. The external environments in which it
operates exert some pressure on the firm. The external factors are social and
regulatory factors, monetary and fiscal policies of the government, business cycle
and the general economic environment within which a firm or an industry operates.
b. Financial Risk:
It refers to the variability of the income to the equity capital due to the debt capital.
Financial risk in a company is associated with the capital structure of the company.
Capital structure of the company consists of equity funds and borrowed funds.
PORTFOLIO ANALYSIS:
Various groups of securities when held together behave in a different
manner and give interest payments and dividends also, which are different to the
analysis of individual securities. A combination of securities held together will

www.studymafia.org
23
give a beneficial result if they are grouped in a manner to secure higher return after
taking into consideration the risk element.
There are two approaches in construction of the portfolio of securities. They
are
Traditional approach
Modern approach
TRADITIONAL APPROACH:
Traditional approach was based on the fact that risk could be measured on
each individual security through the process of finding out the standard deviation
and that security should be chosen where the deviation was the lowest. Traditional
approach believes that the market is inefficient and the fundamental analyst can
take advantage fo the situation. Traditional approach is a comprehensive financial
plan for the individual. It takes into account the individual needs such as housing,
life insurance and pension plans. Traditional approach basically deals with two
major decisions. They are
a) Determining the objectives of the portfolio
Selection of securities to be included in the portfolio
MODERN APPROACH:
Modern approach theory was brought out by Markowitz and Sharpe. It is the
combination of securities to get the most efficient portfolio. Combination of
securities can be made in many ways. Markowitz developed the theory of
diversification through scientific reasoning and method. Modern portfolio theory
www.studymafia.org
24
believes in the maximization of return through a combination of securities. The
modern approach discusses the relationship between different securities and then
draws inter-relationships of risks between them. Markowitz gives more attention to
the process of selecting the portfolio. It does not deal with the individual needs.
MARKOWITZ MODEL:
Markowitz model is a theoretical framework for analysis of risk and return
and their relationships. He used statistical analysis for the measurement of risk and
mathematical programming for selection of assets in a portfolio in an efficient
manner. Markowitz apporach determines for the investor the efficient set of
portfolio through three important variables i.e.
Return
Standard deviation
Co-efficient of correlation
Markowitz model is also called as an “Full Covariance Model“. Through this
model the investor can find out the efficient set of portfolio by finding out the trade
off between risk and return, between the limits of zero and infinity. According to
this theory, the effects of one security purchase over the effects of the other
security purchase are taken into consideration and then the results are evaluated.
Most people agree that holding two stocks is less risky than holding one stock. For
example, holding stocks from textile, banking and electronic companies is better
than investing all the money on the textile company‘s stock.
Markowitz had given up the single stock portfolio and introduced diversification.
The single stock portfolio would be preferable if the investor is perfectly certain
that his expectation of highest return would turn out to be real. In the world of
www.studymafia.org
25
uncertainity, most of the risk adverse investors would like to join Markowitz rather
than keeping a single stock, because diversification reduces the risk.
ASSUMPTIONS:
All investors would like to earn the maximum rate of return that they can
achieve from their investments.
All investors have the same expected single period investment horizon.
All investors before making any investments have a common goal. This is
the avoidance of risk because Investors are risk-averse.
Investors base their investment decisions on the expected return and
standard deviation of returns from a possible investment.
Perfect markets are assumed (e.g. no taxes and no transation costs)
The investor assumes that greater or larger the return that he achieves on his
investments, the higher the risk factor surrounds him. On the contrary when
risks are low the rerturn can also be expected to be low.
The investor can reduce his risk if he adds investments to his portfolio.
An investor should be able to get higher return for each level of risk “by
determining the efficient set of securities“.
An individual seller or buyer cannot affect the price of a stock. This
assumption is the basic assumption of the perfectly competitive market.
Investors make their decisions only on the basis of the expected returns,
standard deviation and covariances of all pairs of securities.
Investors are assumed to have homogenous expectations during the decision-
making period

www.studymafia.org
26
The investor can lend or borrow any amount of funds at the riskless rate of
interest. The riskless rate of interest is the rate of interest offered for the
treasury bills or Government securities.
Investors are risk-averse, so when given a choice between two otherwise
identical portfolios, they will choose the one with the lower standard
deviation.
Individual assets are infinitely divisible, meaning that an investor can buy a
fraction of a share if he or she so desires.
There is a risk free rate at which an investor may either lend (i.e. invest)
money or borrow money.
There is no transaction cost i.e. no cost involved in buying and selling of
stocks.
There is no personal income tax. Hence, the investor is indifferent to the form of
return either capital gain or dividend.
THE EFFECT OF COMBINING TWO SECURITIES:
It is believed that holding two securities is less risky than by having only one
investment in a person‘s portfolio. When two stocks are taken on a portfolio and if
they have negative correlation then risk can be completely reduced because the
gain on one can offset the loss on the other. This can be shown with the help of
following example:
INTER- ACTIVE RISK THROUGH COVARIANCE:
Covariance of the securities will help in finding out the inter-active risk.
When the covariance will be positive then the rates of return of securities move
www.studymafia.org
27
together either upwards or downwards. Alternatively it can also be said that the
inter-active risk is positive. Secondly, covariance will be zero on two investments
if the rates of return are independent.
Holding two securities may reduce the portfolio risk too. The portfolio risk
can be calculated with the help of the following formula:
CAPITAL ASSET PRICING MODEL (CAPM):
Markowitz, William Sharpe, John Lintner and Jan Mossin provided the basic
structure of Capital Asset Pricing Model. It is a model of linear general equilibrium
return. In the CAPM theory, the required rate return of an asset is having a linear
relationship with asset‘s beta value i.e. undiversifiable or systematic risk (i.e.
market related risk) because non market risk can be eliminated by diversification
and systematci risk measured by beta. Therefore, the relationship between an assets
return and its systematic risk can be expressd by the CAPM, which is also called
the Security Market Line.
Rp= Rf Xf+ Rm(1- Xf)
Rp = Portfolio return
Xf = The proportion of funds invested in risk free assets
1- Xf = The proportion of funds invested in risky assets
Rf = Risk free rate of return
Rm = Return on risky assets
www.studymafia.org
28
Formula can be used to calculate the expected returns for different situtions, like
mixing riskless assets with risky assets, investing only in the risky asset and
mixing the borrowing with risky assets.
THE CONCEPT:
According to CAPM, all investors hold only the market portfolio and risk
less securities. The market portfolio is a portfolio comprised of all stocks in the
market. Each asset is held in proportion to its market value to the total value of all
risky assets.
For example, if Satyam Industry share represents 15% of all risky assets, then the
market portfolio of the individual investor contains 15% of Satyam Industry
shares. At this stage, the investor has the ability to borrow or lend any amount of
money at the risk less rate of interest.
Eg.: assume that borrowing and lending rate to be 12.5% and the return from
the risky assets to be 20%. There is a trade off between the expected return and
risk. If an investor invests in risk free assets and risky assets, his risk may be less
than what he invests in the risky asset alone. But if he borrows to invest in risky
assets, his risk would increase more than he invests his own money in the risky
assets. When he borrows to invest, we call it financial leverage. If he invests 50%
in risk free assets and 50% in risky assets, his expected return of the portfolio
would be
Rp= Rf Xf+ Rm(1- Xf)
= (12.5 x 0.5) + 20 (1-0.5)
= 6.25 + 10 = 16.25%
www.studymafia.org
29
if there is a zero investment in risk free asset and 100% in risky asset, the return is
Rp= Rf Xf+ Rm(1- Xf)
= 0 + 20%
= 20%
if -0.5 in risk free asset and 1.5 in risky asset, the return is
Rp= Rf Xf+ Rm(1- Xf)
= (12.5 x -0.5) + 20 (1.5)
= -6.25+ 30
= 23.75%
EVALUATION OF PORTFOLIO:
Portfolio manager evaluates his portfolio performance and identifies the
sources of strengths and weakness. The evaluation of the portfolio provides a feed
back about the performance to evolve better management strategy. Even though
evaluation of portfolio performance is considered to be the last stage of investment
process, it is a continuous process. There are number of situations in which an
evaluation becomes necessary and important.
i. Self Valuation: An individual may want to evaluate how well he has done.
This is a part of the process of refining his skills and improving his
performance over a period of time.

www.studymafia.org
30
ii. Evaluation of Managers: A mutual fund or similar organization might
want to evaluate its managers. A mutual fund may have several managers
each running a separate fund or sub-fund. It is often necessary to compare
the performance of these managers.
iii. Evaluation of Mutual Funds: An investor may want to evaluate the
various mutual funds operating in the country to decide which, if any, of
these should be chosen for investment. A similar need arises in the case of
individuals or organisations who engage external agencies for portfolio
advisory services.
Evaluation of Groups: Academics or researchers may want to evaluate the
performance of a whole group of investors and compare it with another group of
investors who use different techniques or who have different skills or access to
different information.
NEED FOR EVALUATION OF PORTFOLIO:
We can try to evaluate every transaction. Whenever a security is brought or
sold, we can attempt to assess whether the decision was correct and
profitable.
We can try to evaluate the performance of a specific security in the portfolio
to determine whether it has been worthwhile to include it in our portfolio.
We can try to evaluate the performance of portfolio as a whole during the
period without examining the performance of individual securities within the
portfolio.

www.studymafia.org
31
NEED & IMPORTANCE:
Portfolio management has emerged as a separate academic discipline in
India. Portfolio theory that deals with the rational investment decision-making
process has now become an integral part of financial literature.
Investing in securities such as shares, debentures & bonds is profitable well
as exciting. It is indeed rewarding but involves a great deal of risk & need artistic
skill. Investing in financial securities is now considered to be one of the most risky
avenues of investment. It is rare to find investors investing their entire savings in a
single security. Instead, they tend to invest in a group of securities. Such group of
securities is called as PORTFOLIO. Creation of portfolio helps to reduce risk
without sacrificing returns. Portfolio management deals with the analysis of
individual securities as well as with the theory & practice of optimally combining
securities into portfolios.
The modern theory is of the view that by diversification, risk can be reduced.
The investor can make diversification either by having a large number of shares of
companies in different regions, in different industries or those producing different
types of product lines. Modern theory believes in the perspective of combinations
of securities under constraints of risk and return.
PORTFOLIO REVISION:
The portfolio which is once selected has to be continuously reviewed over a
period of time and then revised depending on the objectives of the investor. The
care taken in construction of portfolio should be extended to the review and
www.studymafia.org
32
revision of the portfolio. Fluctuations that occur in the equity prices cause
substantial gain or loss to the investors.
The investor should have competence and skill in the revision of the
portfolio. The portfolio management process needs frequent changes in the
composition of stocks and bonds. In securities, the type of securities to be held
should be revised according to the portfolio policy.
An investor purchases stock according to his objectives and return risk
framework. The prices of stock that he purchases fluctuate, each stock having its
own cycle of fluctuations. These price fluctuations may be related to economic
activity in a country or due to other changed circumstances in the market.
If an investor is able to forecast these changes by developing a framework for the
future through careful analysis of the behavior and movement of stock prices is in
a position to make higher profit than if he was to simply buy securities and hold
them through the process of diversification. Mechanical methods are adopted to
earn better profit through proper timing. The investor uses formula plans to help
him in making decisions for the future by exploiting the fluctuations in prices.
FORMULA PLANS:
The formula plans provide the basic rules and regulations for the purchase
and sale of securities. The amount to be spent on the different types of securities is
fixed. The amount may be fixed either in constant or variable ratio. This depends
on the investor‘s attitude towards risk and return. The commonly used formula
plans are
www.studymafia.org
33
i. Average Rupee Plan
ii. Constant Rupee Plan
iii. Constant Ratio Plan
iv. Variable Ratio Plan
ADVANTAGES:
Basic rules and regulations for the purchase and sale of securities are
provided.
The rules and regulations are rigid and help to overcome human emotion.
The investor can earn higher profits by adopting the plans.
A course of action is formulated according to the investor‘s objectives.
It controls the buying and selling of securities by the investor.
It is useful for taking decisions on the timing of investments.
DISADVANTAGES:
The formula plan does not help the selection of the security. The selection of
the security has to be done either on the basis of the fundamental or
technical analysis.
It is strict and not flexible with the inherent problem of adjustment.
www.studymafia.org
34
The formula plans should be applied for long periods, otherwise the
transaction cost may be high.
Even if the investor adopts the formula plan, he needs forecasting. Market
forecasting helps him to identify the best stocks.
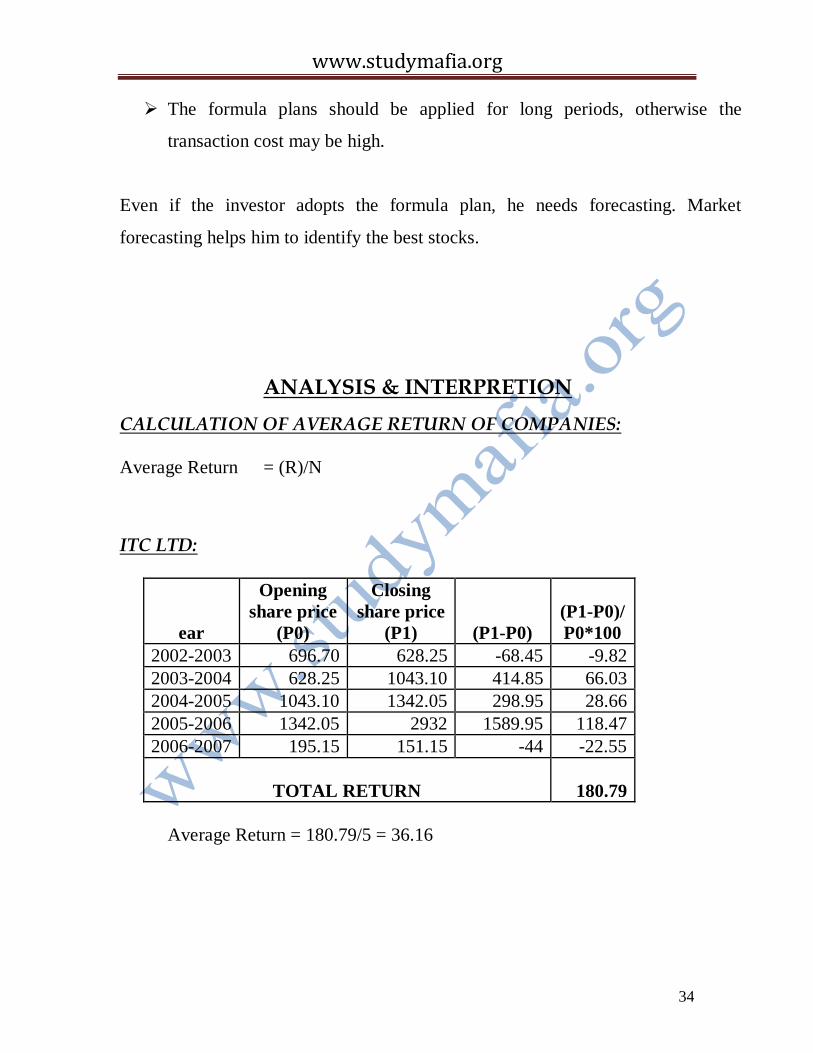
ANALYSIS & INTERPRETION
CALCULATION OF AVERAGE RETURN OF COMPANIES:
Average Return = (R)/N
ITC LTD:
ear
Opening
share price
(P0)
Closing
share price
(P1) (P1-P0)
(P1-P0)/
P0*100
2002-2003 696.70 628.25 -68.45 -9.82
2003-2004 628.25 1043.10 414.85 66.03
2004-2005 1043.10 1342.05 298.95 28.66
2005-2006 1342.05 2932 1589.95 118.47
2006-2007 195.15 151.15 -44 -22.55
TOTAL RETURN 180.79
Average Return = 180.79/5 = 36.16
www.studymafia.org
35
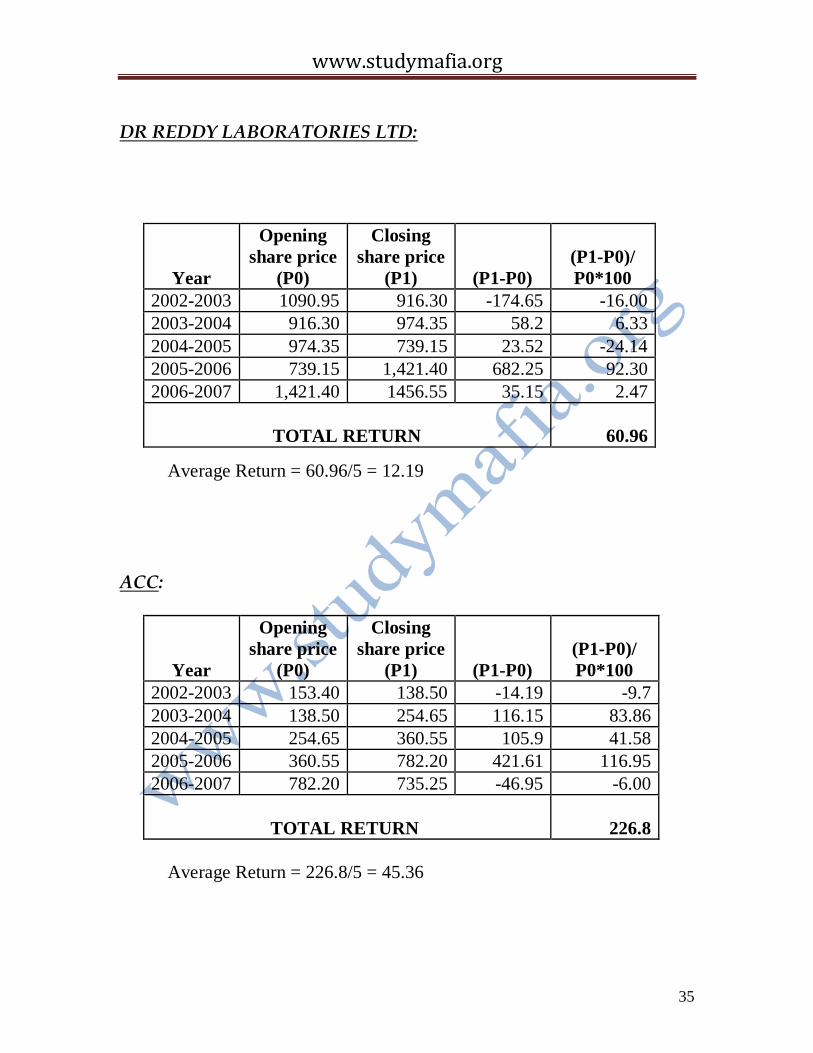
DR REDDY LABORATORIES LTD:
Year
Opening
share price
(P0)
Closing
share price
(P1) (P1-P0)
(P1-P0)/
P0*100
2002-2003 1090.95 916.30 -174.65 -16.00
2003-2004 916.30 974.35 58.2 6.33
2004-2005 974.35 739.15 23.52 -24.14
2005-2006 739.15 1,421.40 682.25 92.30
2006-2007 1,421.40 1456.55 35.15 2.47
TOTAL RETURN 60.96
Average Return = 60.96/5 = 12.19
ACC:
Year
Opening
share price
(P0)
Closing
share price
(P1) (P1-P0)
(P1-P0)/
P0*100
2002-2003 153.40 138.50 -14.19 -9.7
2003-2004 138.50 254.65 116.15 83.86
2004-2005 254.65 360.55 105.9 41.58
2005-2006 360.55 782.20 421.61 116.95
2006-2007 782.20 735.25 -46.95 -6.00
TOTAL RETURN 226.8
Average Return = 226.8/5 = 45.36

www.studymafia.org
36
BHARAT HEAVY ELECTRICALS LTD:
Year
Opening
share price
(P0)
Closing
share price
(P1) (P1-P0)
(P1-P0)/
P0*100
2002-2003 169.00 223.15 54.15 32.04
2003-2004 223.15 604.35 38.12 170.83
2004-2005 604.35 766.40 162.05 26.81
2005-2006 766.40 2241.95 1475.55 192.53
2006-2007 2241.95 2261.35 19.4 0.87
TOTAL RETURN 423.08
Average Return = 423.08/5 = 84.62
HEROHONDA AUTOMOBILES LIMITED:
Year
Opening
share price
(P0)
Closing
share price
(P1) (P1-P0)
(P1-P0)/
P0*100
2002-2003 338.55 188.20 -150.35 -44.40
2003-2004 188.20 490.60 302.40 160.68
2004-2005 490.60 548.00 57.40 11.70
2005-2006 548.00 890.45 342.45 62.50
2006-2007 890.45 688.75 -20.17 -22.65
TOTAL RETURN 167.82
Average Return = 167.82/5 = 33.56
www.studymafia.org
37
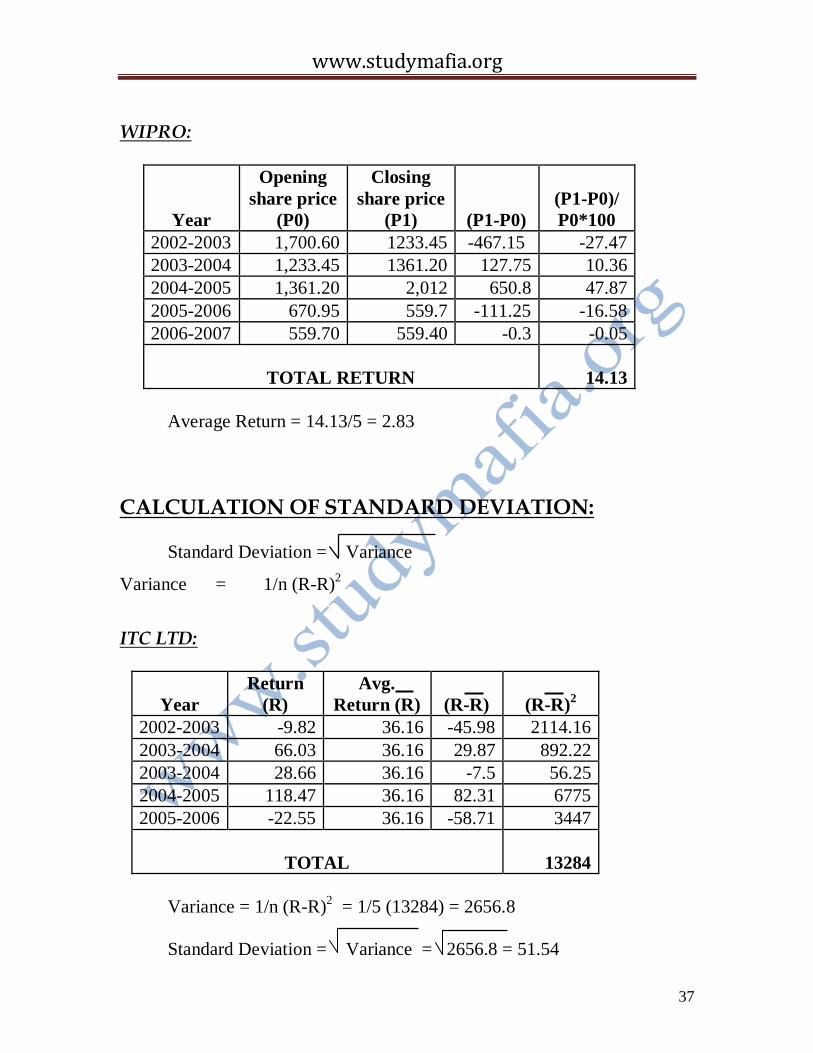
WIPRO:
Year
Opening
share price
(P0)
Closing
share price
(P1) (P1-P0)
(P1-P0)/
P0*100
2002-2003 1,700.60 1233.45 -467.15 -27.47
2003-2004 1,233.45 1361.20 127.75 10.36
2004-2005 1,361.20 2,012 650.8 47.87
2005-2006 670.95 559.7 -111.25 -16.58
2006-2007 559.70 559.40 -0.3 -0.05
TOTAL RETURN 14.13
Average Return = 14.13/5 = 2.83
CALCULATION OF STANDARD DEVIATION:
Standard Deviation = Variance
Variance = 1/n (R-R)2
ITC LTD:
Year
Return
(R)
Avg.
Return (R)
(R-R)
(R-R)2
2002-2003 -9.82 36.16 -45.98 2114.16
2003-2004 66.03 36.16 29.87 892.22
2003-2004 28.66 36.16 -7.5 56.25
2004-2005 118.47 36.16 82.31 6775
2005-2006 -22.55 36.16 -58.71 3447
TOTAL 13284
Variance = 1/n (R-R)2 = 1/5 (13284) = 2656.8
Standard Deviation = Variance = 2656.8 = 51.54
www.studymafia.org
38
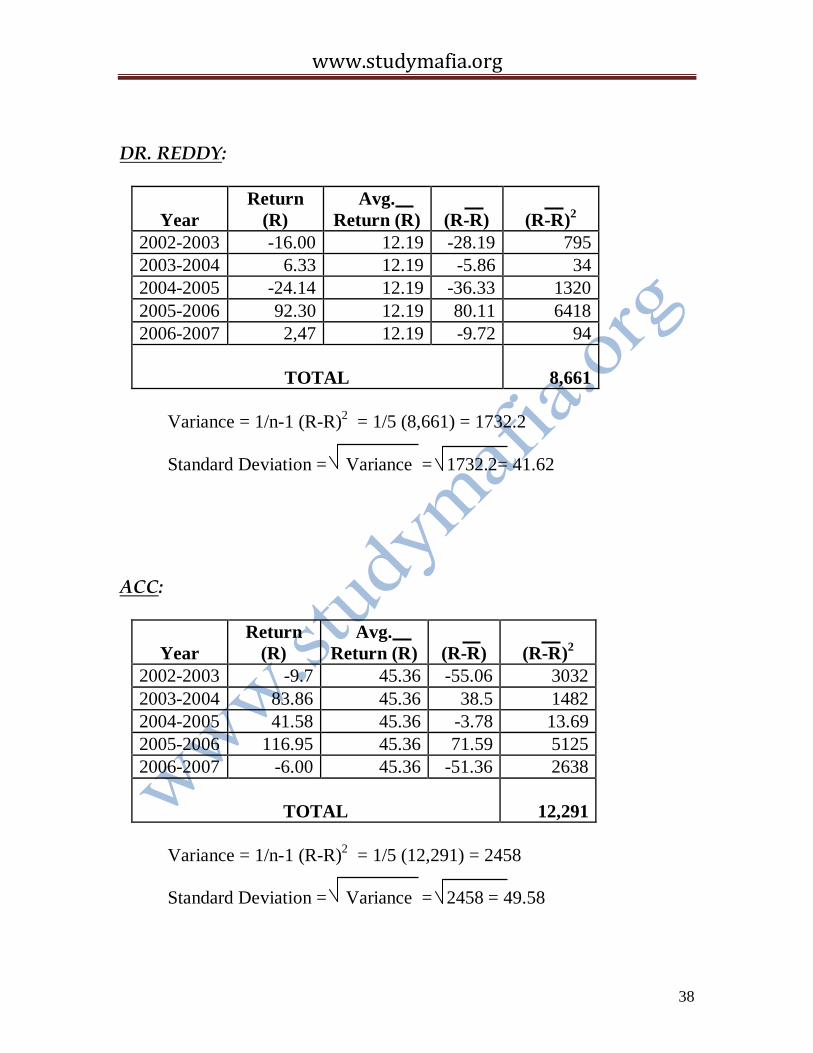
DR. REDDY:
Year
Return
(R)
Avg.
Return (R)
(R-R)
(R-R)2
2002-2003 -16.00 12.19 -28.19 795
2003-2004 6.33 12.19 -5.86 34
2004-2005 -24.14 12.19 -36.33 1320
2005-2006 92.30 12.19 80.11 6418
2006-2007 2,47 12.19 -9.72 94
TOTAL 8,661
Variance = 1/n-1 (R-R)2 = 1/5 (8,661) = 1732.2
Standard Deviation = Variance = 1732.2= 41.62
ACC:
Year
Return
(R)
Avg.
Return (R)
(R-R)
(R-R)2
2002-2003 -9.7 45.36 -55.06 3032
2003-2004 83.86 45.36 38.5 1482
2004-2005 41.58 45.36 -3.78 13.69
2005-2006 116.95 45.36 71.59 5125
2006-2007 -6.00 45.36 -51.36 2638
TOTAL 12,291
Variance = 1/n-1 (R-R)2 = 1/5 (12,291) = 2458
Standard Deviation = Variance = 2458 = 49.58

www.studymafia.org
39
WIPRO:
Year
Return
(R)
Avg.
Return (R)
(R-R)
(R-R)2
2002-2003 -27.47 2.83 -30.29 917
2003-2004 10.36 2.83 7.53 57
2004-2005 47.87 2.83 45.04 2029
2005-2006 -16.58 2.83 -19.41 377
2006-2007 -0.05 2.83 -2.88 8
TOTAL 3388
Variance = 1/n-1 (R-R)2 = 1/5 (3388) = 847
Standard Deviation = Variance = 847
=33.09 BHEL:
Year
Return
(R)
Avg.
Return (R)
(R-R)
(R-R)2
2002-2003 32.04 84.62 -52.58 2765
2003-2004 170.83 84.62 86.21 7432
2004-2005 26.81 84.62 -57.81 3342
2005-2006 192.53 84.62 107.91 11645
2006-2007 0.87 84.62 -83.75 7014
TOTAL 32,198
Variance = 1/n-1 (R-R)2 = 1/5 (32198) = 6440
Standard Deviation = Variance = 6440 = 80.25
www.studymafia.org
40
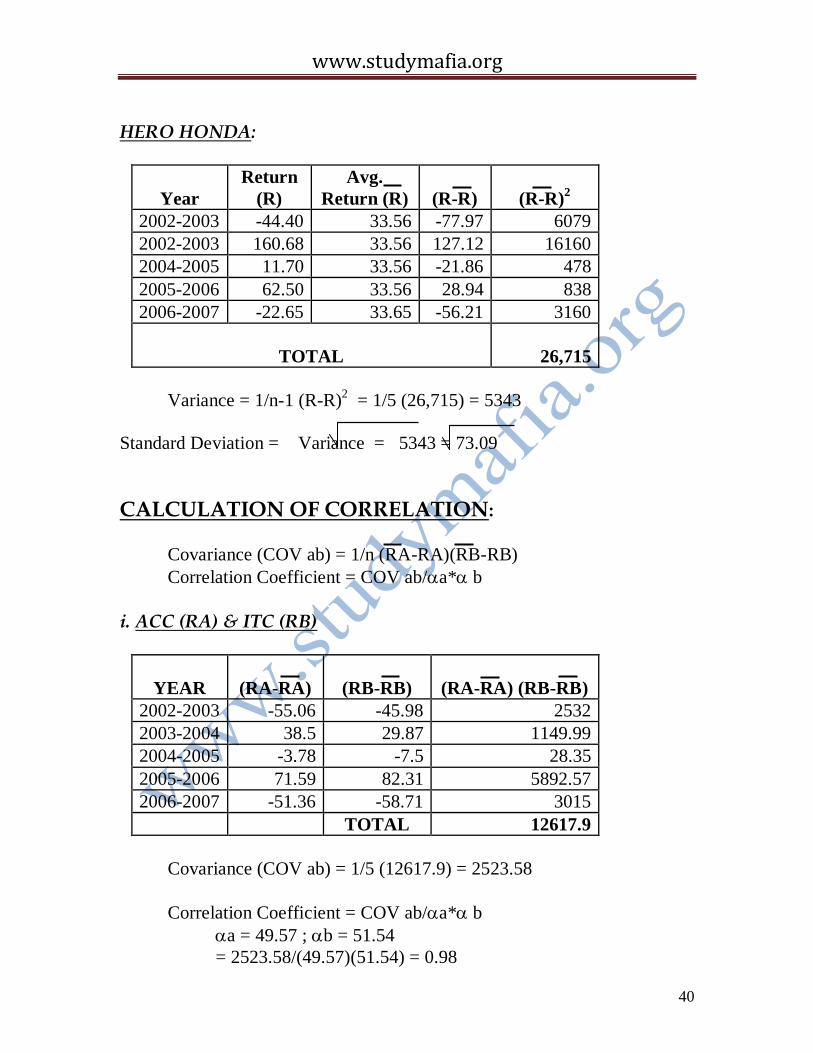
HERO HONDA:
Year
Return
(R)
Avg.
Return (R)
(R-R)
(R-R)2
2002-2003 -44.40 33.56 -77.97 6079
2002-2003 160.68 33.56 127.12 16160
2004-2005 11.70 33.56 -21.86 478
2005-2006 62.50 33.56 28.94 838
2006-2007 -22.65 33.65 -56.21 3160
TOTAL 26,715
Variance = 1/n-1 (R-R)2 = 1/5 (26,715) = 5343
Standard Deviation = Variance = 5343 = 73.09
CALCULATION OF CORRELATION:
Covariance (COV ab) = 1/n (RA-RA)(RB-RB)
Correlation Coefficient = COV ab/a*b
i. ACC (RA) & ITC (RB)
YEAR
(RA-RA)
(RB-RB)
(RA-RA) (RB-RB)
2002-2003 -55.06 -45.98 2532
2003-2004 38.5 29.87 1149.99
2004-2005 -3.78 -7.5 28.35
2005-2006 71.59 82.31 5892.57
2006-2007 -51.36 -58.71 3015
TOTAL 12617.9
Covariance (COV ab) = 1/5 (12617.9) = 2523.58
Correlation Coefficient = COV ab/a*b
a = 49.57 ; b = 51.54
= 2523.58/(49.57)(51.54) = 0.98

www.studymafia.org
41
ii) ACC (RA) & WIPRO (RB)
YEAR
(RA-RA)
(RB-RB)
(RA-RA) (RB-RB)
2002-2003 -52.58 -77.97 4099.66
2003-2004 86.21 127.12 10959.01
2004-2005 -57.81 -21.86 1263.72
2005-2006 107.91 28.94 3122.91
2006-2007 -83.75 -56.21 4707.58
TOTAL 24152.88
Covariance (COV ab) = 1/5 (24152.88) = 4830.57
Correlation Coefficient = COV ab/a*b
a = 26 ; b = 41.62
= 4830.57/(80.25)(73.09) = 0.82
iii. WIPRO (RA) & DR REDDY (RB)
YEAR
(RA-RA)
(RB-RB)
(RA-RA) (RB-RB)
2002-2003 -30.29 -28.19 853.87
2003-2004 7.53 -5.86 -44.12
2004-2005 44.98 -36.33 -1634.12
2005-2006 -19.41 80.11 -1554.93
2006-2007 -2.88 -9.72 27.99
TOTAL -2351.31
Covariance (COV ab) = 1/5 (-2351.31) = 470.26
Correlation Coefficient = COV ab/a*b
a = 26.00 ; b = 41.62
= -470.26/(26.00)(41.62) = -0.43
www.studymafia.org
42
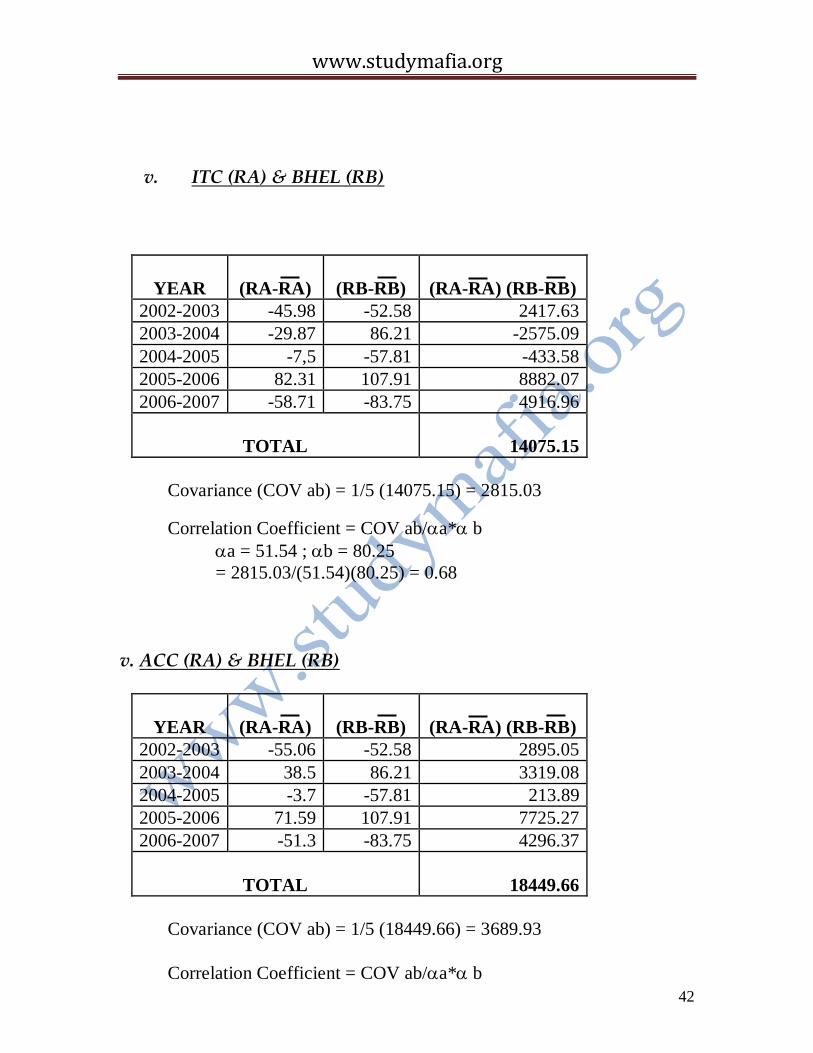
v. ITC (RA) & BHEL (RB)
YEAR
(RA-RA)
(RB-RB)
(RA-RA) (RB-RB)
2002-2003 -45.98 -52.58 2417.63
2003-2004 -29.87 86.21 -2575.09
2004-2005 -7,5 -57.81 -433.58
2005-2006 82.31 107.91 8882.07
2006-2007 -58.71 -83.75 4916.96
TOTAL 14075.15
Covariance (COV ab) = 1/5 (14075.15) = 2815.03
Correlation Coefficient = COV ab/a*b
a = 51.54 ; b = 80.25
= 2815.03/(51.54)(80.25) = 0.68
v. ACC (RA) & BHEL (RB)
YEAR
(RA-RA)
(RB-RB)
(RA-RA) (RB-RB)
2002-2003 -55.06 -52.58 2895.05
2003-2004 38.5 86.21 3319.08
2004-2005 -3.7 -57.81 213.89
2005-2006 71.59 107.91 7725.27
2006-2007 -51.3 -83.75 4296.37
TOTAL 18449.66
Covariance (COV ab) = 1/5 (18449.66) = 3689.93
Correlation Coefficient = COV ab/a*b
www.studymafia.org
43
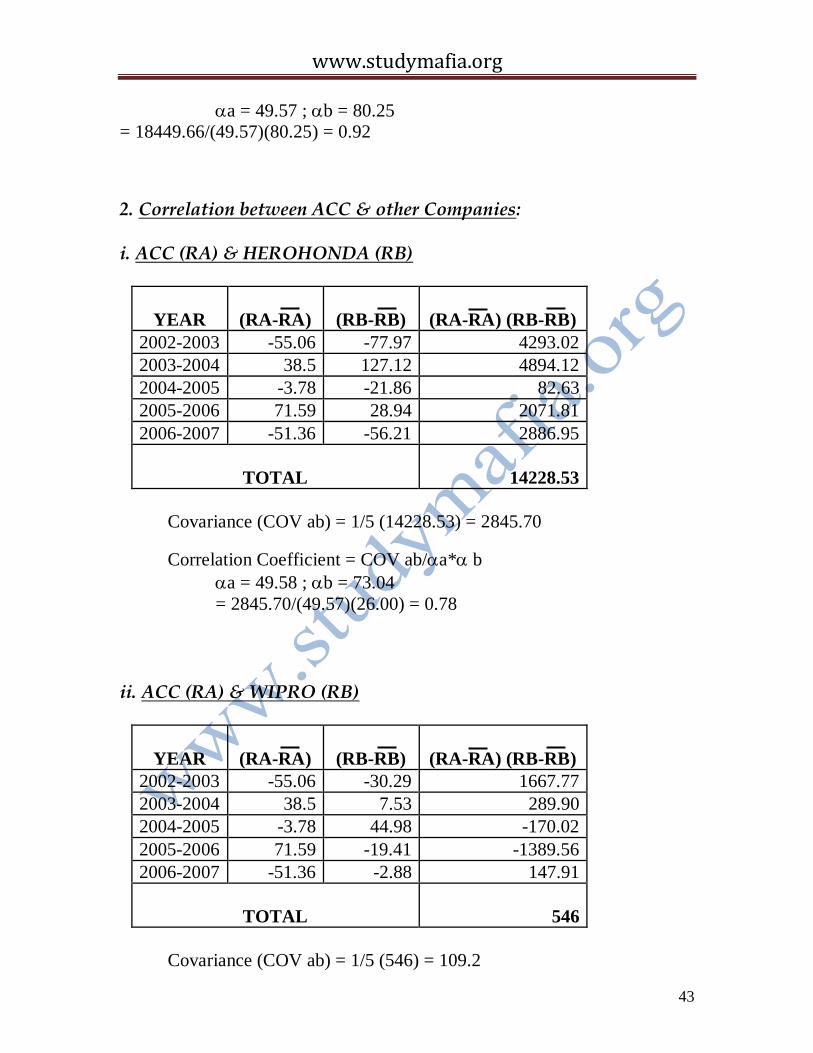
a = 49.57 ; b = 80.25
= 18449.66/(49.57)(80.25) = 0.92
2. Correlation between ACC & other Companies:
i. ACC (RA) & HEROHONDA (RB)
YEAR
(RA-RA)
(RB-RB)
(RA-RA) (RB-RB)
2002-2003 -55.06 -77.97 4293.02
2003-2004 38.5 127.12 4894.12
2004-2005 -3.78 -21.86 82.63
2005-2006 71.59 28.94 2071.81
2006-2007 -51.36 -56.21 2886.95
TOTAL 14228.53
Covariance (COV ab) = 1/5 (14228.53) = 2845.70
Correlation Coefficient = COV ab/a*b
a = 49.58 ; b = 73.04
= 2845.70/(49.57)(26.00) = 0.78
ii. ACC (RA) & WIPRO (RB)
YEAR
(RA-RA)
(RB-RB)
(RA-RA) (RB-RB)
2002-2003 -55.06 -30.29 1667.77
2003-2004 38.5 7.53 289.90
2004-2005 -3.78 44.98 -170.02
2005-2006 71.59 -19.41 -1389.56
2006-2007 -51.36 -2.88 147.91
TOTAL 546
Covariance (COV ab) = 1/5 (546) = 109.2

www.studymafia.org
44
Correlation Coefficient = COV ab/a*b
a = 49.57; b = 26.00 = 109.2/(49.57)(26.00) = 0.08
iii. ACC (RA) & DR REDDY (RB)
YEAR
(RA-RA)
(RB-RB)
(RA-RA) (RB-RB)
2002-2003 -55.06 -28.19 552.14
2003-2004 38.5 -5.86 -225.61
2004-2005 -3.78 -36.33 137.33
2005-2006 71.59 80.11 5735.07
2006-2007 -51.36 -9.72 499.21
TOTAL 7698.14
Covariance (COV ab) = 1/5 (7698.14) = 1539.63
Correlation Coefficient = COV ab/a*b
a = 49.57 ; b = 41.62
= 1539.63/(49.57)(41.62) = 0.74
iv. ITC (RA) & HERO HONDA (RB)
YEAR
(RA-RA)
(RB-RB)
(RA-RA) (RB-RB)
2002-2003 -45.98 -77.97 3585.06
2003-2004 29.87 127.12 3797.07
2004-2005 -7.5 -21.86 163.95
2005-2006 82.31 28.94 2382.05
2006-2007 -58.71 -56.21 3300.08
TOTAL 13228.21
Covariance (COV ab) = 1/5 (13228.21) = 2645.64
Correlation Coefficient = COV ab/a*b
a = 51.54 ; b = 73.09
www.studymafia.org
45
= 2645.64/(51.54)(73.09) = 0.70
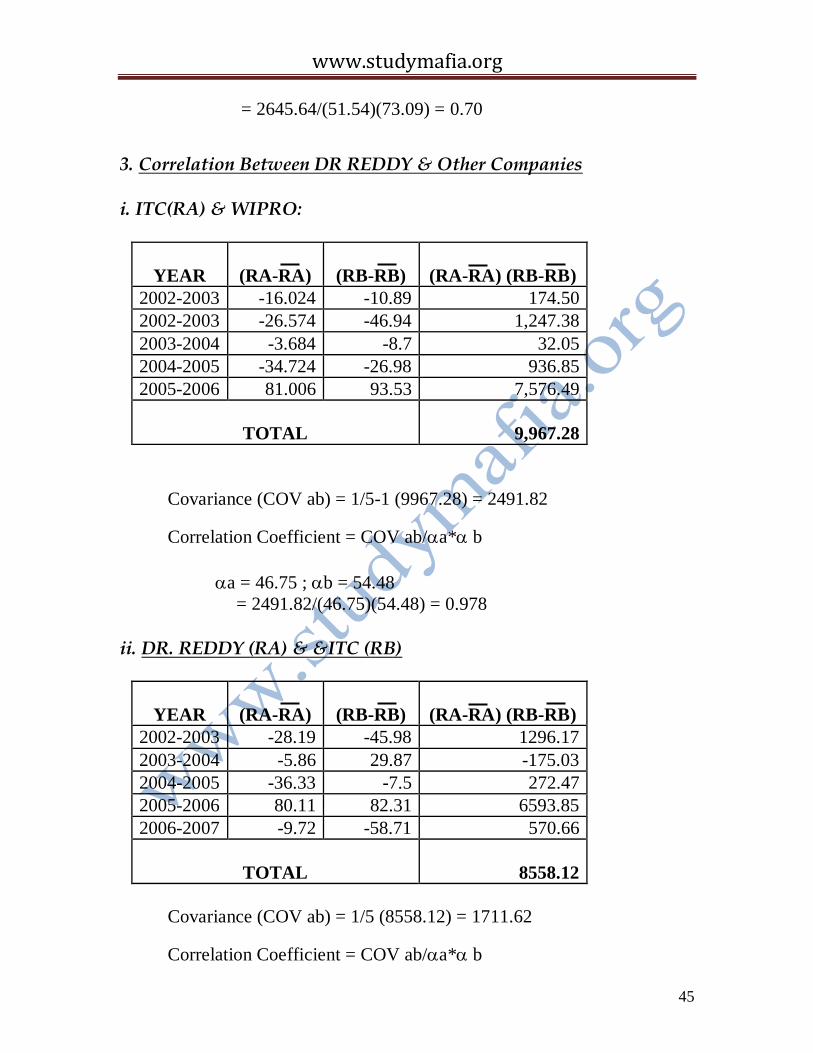
3. Correlation Between DR REDDY & Other Companies i. ITC(RA) & WIPRO:
YEAR
(RA-RA)
(RB-RB)
(RA-RA) (RB-RB)
2002-2003 -16.024 -10.89 174.50
2002-2003 -26.574 -46.94 1,247.38
2003-2004 -3.684 -8.7 32.05
2004-2005 -34.724 -26.98 936.85
2005-2006 81.006 93.53 7,576.49
TOTAL 9,967.28
Covariance (COV ab) = 1/5-1 (9967.28) = 2491.82
Correlation Coefficient = COV ab/a*b
a = 46.75 ; b = 54.48
= 2491.82/(46.75)(54.48) = 0.978
ii. DR. REDDY (RA) & &ITC (RB)
YEAR
(RA-RA)
(RB-RB)
(RA-RA) (RB-RB)
2002-2003 -28.19 -45.98 1296.17
2003-2004 -5.86 29.87 -175.03
2004-2005 -36.33 -7.5 272.47
2005-2006 80.11 82.31 6593.85
2006-2007 -9.72 -58.71 570.66
TOTAL 8558.12
Covariance (COV ab) = 1/5 (8558.12) = 1711.62
Correlation Coefficient = COV ab/a*b

www.studymafia.org
46
a = 41.62 ; b = 51.54
= 1711.62/(41.62)(51.54) = 0.79
iv. DR REDDY (RA) &HEROHONDA(RB)
Covariance (COV ab) = 1/5 (6601.8) = 1320.36
Correlation Coefficient = COV ab/a*b
a = 41.62 ; b = 73.09
= 1320.36/(41.62)(73.09)
= 0.43
4. Correlation
Between HLL & Other Companies
i. HEROHONDA (RA) & WIPRO(RB)
YEAR
(RA-RA)
(RB-RB)
(RA-RA) (RB-RB)
2002-2003 -28.19 -77.97 2197.97
2003-2004 -5.86 127.12 744.92
2004-2005 -36.33 -21.86 794.17
2005-2006 80.11 28.94 2318.38
2006-2007 -9.72 -56.21 546.36
TOTAL 6601.8
YEAR
(RA-RA)
(RB-RB)
(RA-RA) (RB-RB)
2002-2003 -77.97 -30.29 2361.71
2003-2004 127.12 7.53 957.21
2004-2005 -21.86 45.04 -984.57
2005-2006 28.94 -19.41 -561.72
2006-2007 -56.21 -2.88 161.88
TOTAL 1934.51
www.studymafia.org
47
Covariance
(COV ab) =
1/5 (1934.51)
= 386.90
Correlation
Coefficient = COV ab/a*b
a = 73.09; b = 26.00
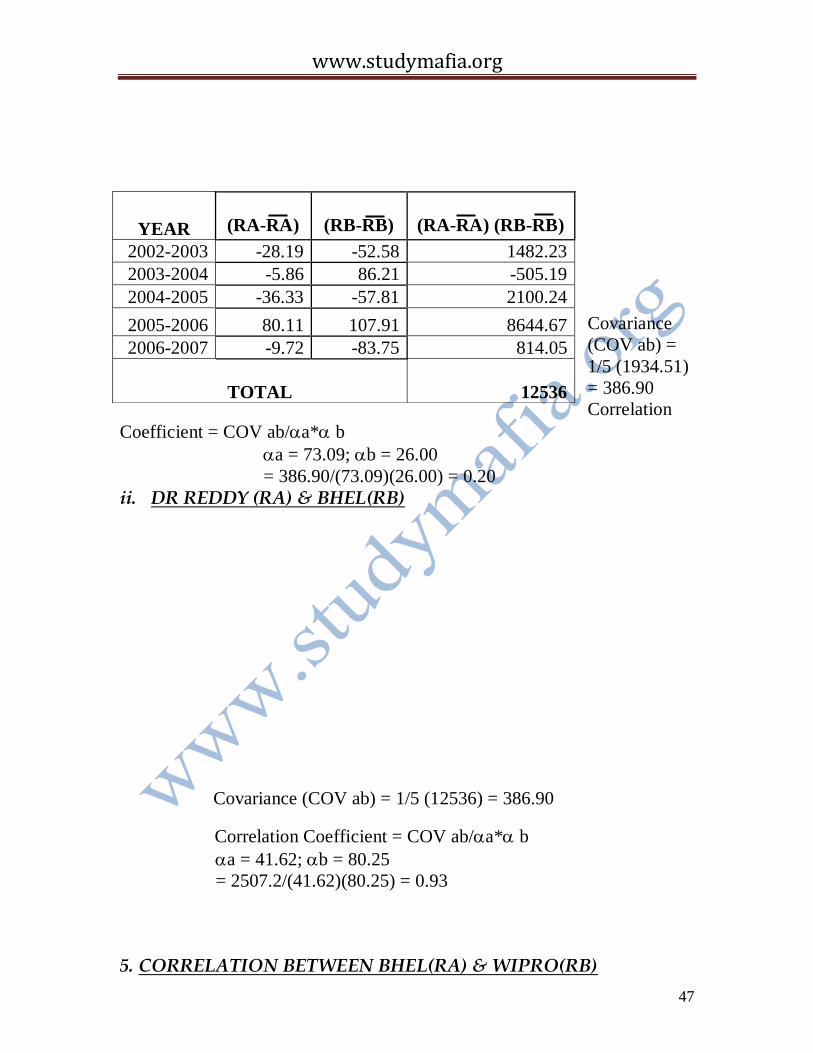
= 386.90/(73.09)(26.00) = 0.20 ii. DR REDDY (RA) & BHEL(RB)
Covariance (COV ab) = 1/5 (12536) = 386.90
Correlation Coefficient = COV ab/a*b
a = 41.62; b = 80.25
= 2507.2/(41.62)(80.25) = 0.93
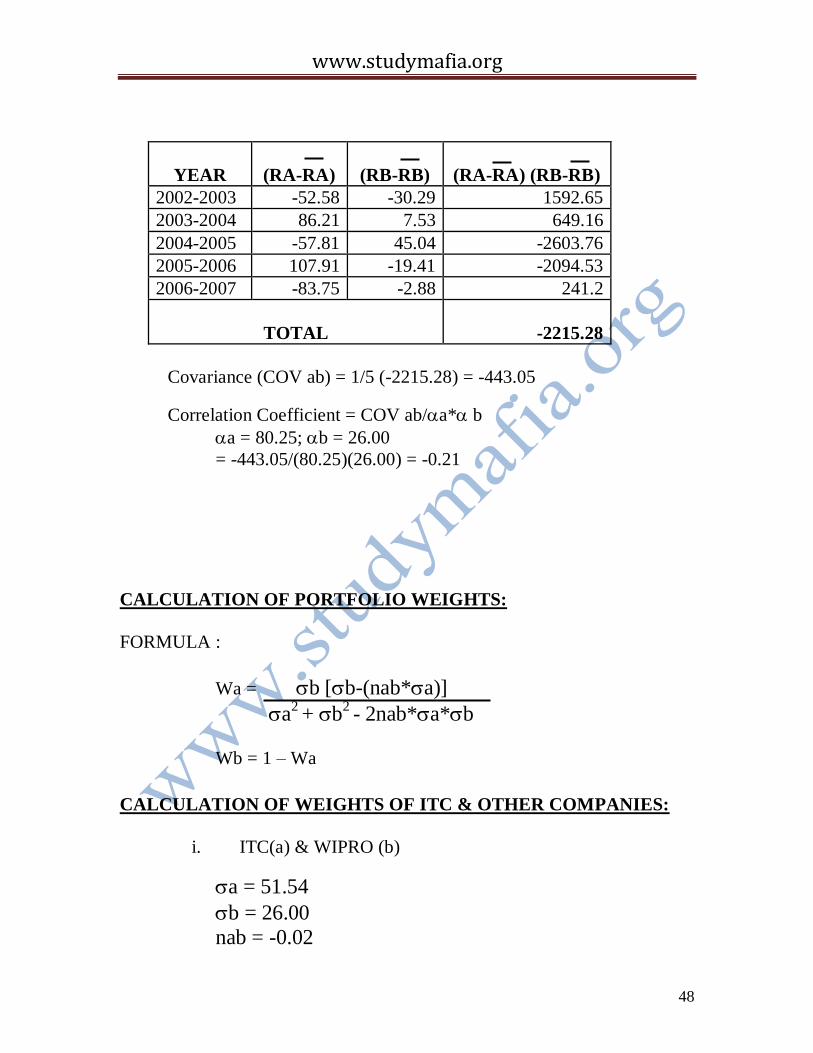
5. CORRELATION BETWEEN BHEL(RA) & WIPRO(RB)
YEAR
(RA-RA)
(RB-RB)
(RA-RA) (RB-RB)
2002-2003 -28.19 -52.58 1482.23
2003-2004 -5.86 86.21 -505.19
2004-2005 -36.33 -57.81 2100.24
2005-2006 80.11 107.91 8644.67
2006-2007 -9.72 -83.75 814.05
TOTAL 12536
www.studymafia.org
48
YEAR
(RA-RA)
(RB-RB)
(RA-RA) (RB-RB)
2002-2003 -52.58 -30.29 1592.65
2003-2004 86.21 7.53 649.16
2004-2005 -57.81 45.04 -2603.76
2005-2006 107.91 -19.41 -2094.53
2006-2007 -83.75 -2.88 241.2
TOTAL -2215.28
Covariance (COV ab) = 1/5 (-2215.28) = -443.05
Correlation Coefficient = COV ab/a*b
a = 80.25; b = 26.00
= -443.05/(80.25)(26.00) = -0.21
CALCULATION OF PORTFOLIO WEIGHTS:
FORMULA :
Wa = b [b-(nab*a)]
a2 + b
2 - 2nab*a*b
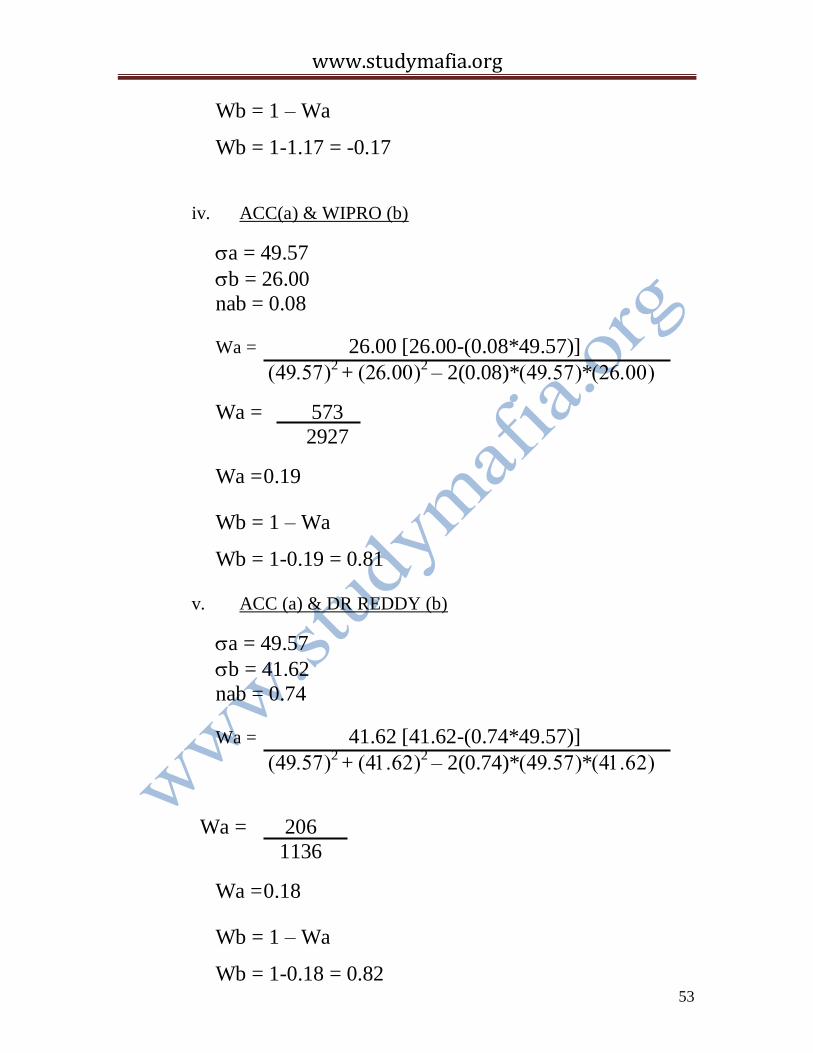
Wb = 1 – Wa
CALCULATION OF WEIGHTS OF ITC & OTHER COMPANIES:
i. ITC(a) & WIPRO (b)
a = 51.54
b = 26.00
nab = -0.02

www.studymafia.org
49
Wa = 26.00 [26.00-(-0.02*51.54)]
2 +
2 – 2(-0.02)**
Wa = 690 3386
Wa = 0.20
Wb = 1 – Wa
Wb = 1-0.20 = 0.8
ii. HEROHONDA(a) & WIPRO(b)
a = 73.09
b = 26.00 nab = 0.20
Wa = 26.00 [26.00-(0.20*73.09)]
2 +
2 – 2(0.20)**
Wa = 296 5258
Wa = 0.05
Wb = 1 – Wa
Wb = 1-0.05 = 0.95
CALCULATION OF WEIGHTS OF BHEL & WIPRO:
a = 80.25
b = 26.00
nab = -0.21
Wa = 26.00 [26.00-(-0.21*80.25)]
2 +
2 – 2(-0.21)**

www.studymafia.org
50
Wa = 1114 7992
Wa = 0.14
Wb = 1 – Wa
Wb = 1-0.14 = 0.86
CALCULATION OF WEIGHTS OF WIPRO & OTHE COMPANIES:
i. ACC (a) & ITC (b):
a = 49.57
b = 51.54
nab = 0.98
Wa = 51.54 [-(0.98*)]
2 +
2 – 2(0.98)**
Wa = 152
106
Wa = 1.43
Wb = 1 – Wa
Wb = 1-1.43 = - 0.43
ii. BHEL (a) & HEROHONDA (b)
a = 80.25
b = 73.09 nab = 0.82
Wa = 73.09 [73.09-(0.82*)]
2 +
2 – 2(0.82)**
Wa = 533

www.studymafia.org
51
2163
Wa = 0.24
Wb = 1 – Wa
Wb = 1-0.24 = 0.76
iii. WIPRO (a) & DR REDYY (b)
a = 26.00
b = 41.62
nab = -0.43
Wa = 41.62 [-(-0.43*)]
2 +
2 – 2(-0.43)**
Wa = 2198
1477
Wa = 1.49
Wb = 1 – Wa
Wb = 1-1.49 = -0.49
iv. ITC (a) & BHEL (b)
a = 51.54
b = 80.25
nab = 0.68
Wa = 80.25 [80.25-(0.68*)]
2 +
2 – 2(0.68)**
Wa = 3628
3471
www.studymafia.org
52
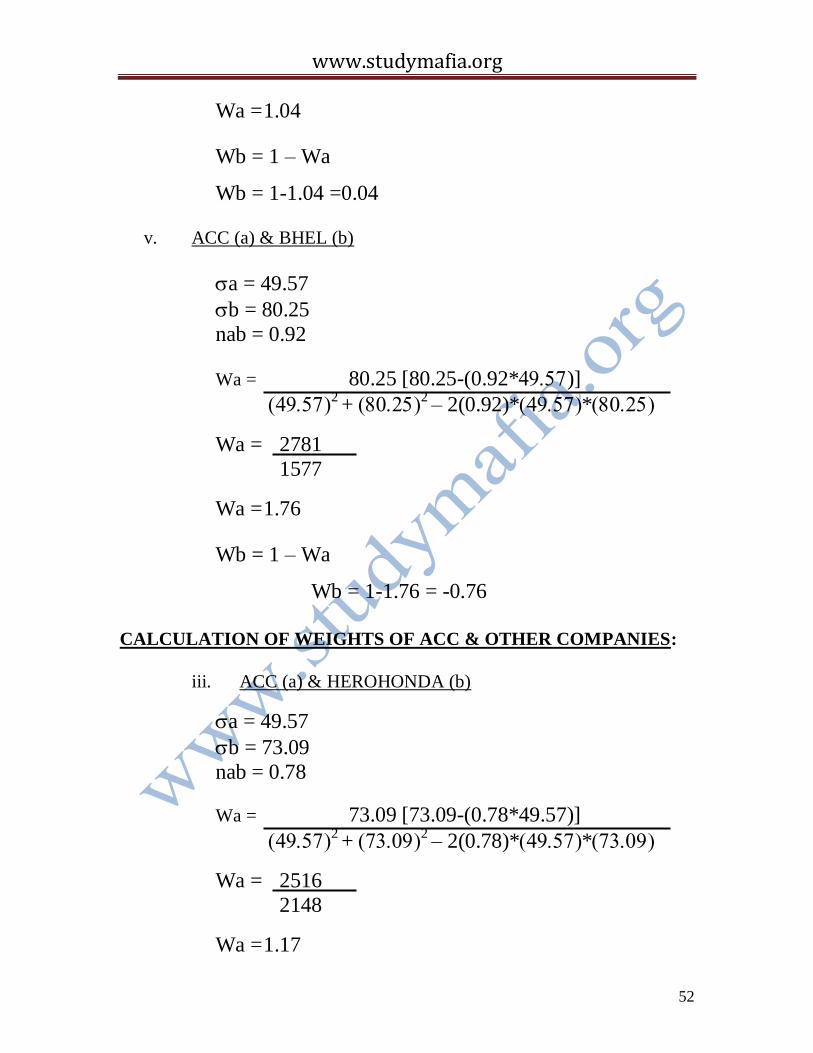
Wa = 1.04
Wb = 1 – Wa
Wb = 1-1.04 =0.04
v. ACC (a) & BHEL (b)
a = 49.57
b = 80.25
nab = 0.92
Wa = 80.25 [80.25-(0.92*)]
2 +
2 – 2(0.92)**
Wa = 2781
1577
Wa = 1.76
Wb = 1 – Wa
Wb = 1-1.76 = -0.76
CALCULATION OF WEIGHTS OF ACC & OTHER COMPANIES:
iii. ACC (a) & HEROHONDA (b)
a = 49.57
b = 73.09
nab = 0.78
Wa = 73.09 [73.09-(0.78*49.57)]
2 +
2 – 2(0.78)**
Wa = 2516
2148
Wa = 1.17
www.studymafia.org
53
Wb = 1 – Wa
Wb = 1-1.17 = -0.17
iv. ACC(a) & WIPRO (b)
a = 49.57
b = 26.00
nab = 0.08
Wa = 26.00 [26.00-(0.08*49.57)]
2 +
2 – 2(0.08)**
Wa = 573
2927
Wa = 0.19
Wb = 1 – Wa
Wb = 1-0.19 = 0.81
v. ACC (a) & DR REDDY (b)
a = 49.57
b = 41.62
nab = 0.74
Wa = 41.62 [41.62-(0.74*49.57)]
2 +
2 – 2(0.74)**
Wa = 206
1136
Wa = 0.18
Wb = 1 – Wa
Wb = 1-0.18 = 0.82
www.studymafia.org
54
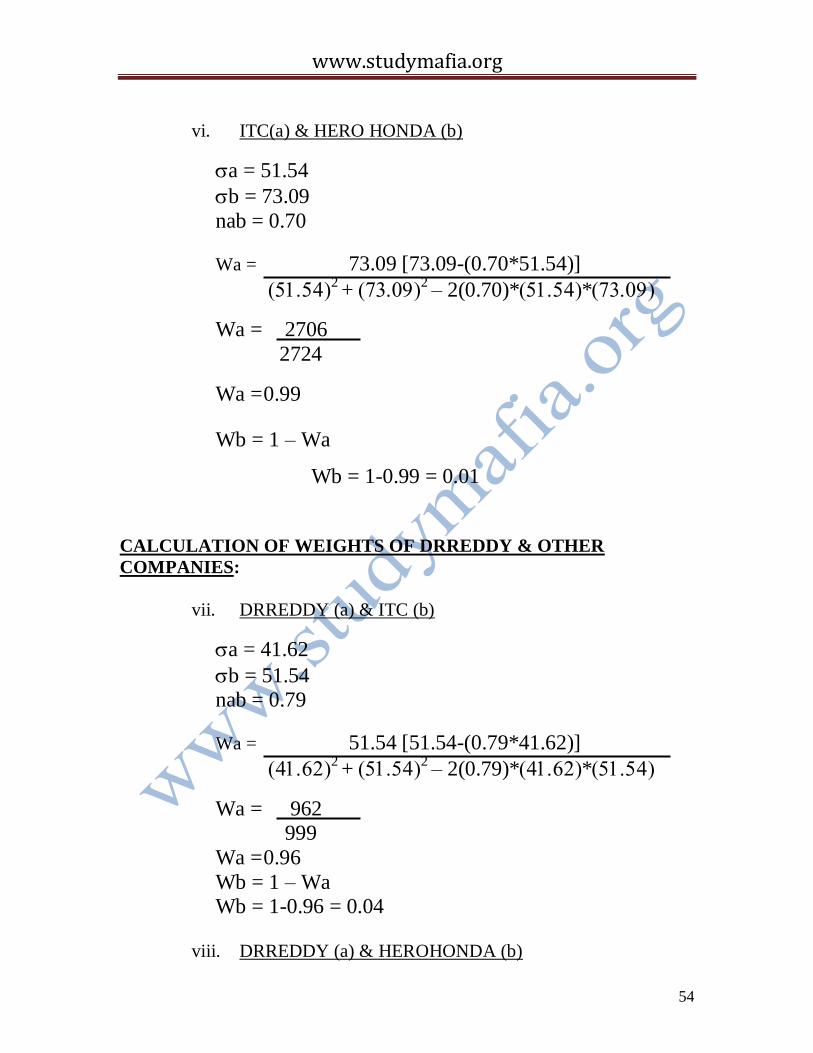
vi. ITC(a) & HERO HONDA (b)
a = 51.54
b = 73.09
nab = 0.70
Wa = 73.09 [73.09-(0.70*51.54)]
2 +
2 – 2(0.70)**
Wa = 2706
2724
Wa = 0.99
Wb = 1 – Wa
Wb = 1-0.99 = 0.01
CALCULATION OF WEIGHTS OF DRREDDY & OTHER
COMPANIES:
vii. DRREDDY (a) & ITC (b)
a = 41.62
b = 51.54 nab = 0.79
Wa = 51.54 [51.54-(0.79*41.62)]
2 +
2 – 2(0.79)**
Wa = 962 999
Wa = 0.96
Wb = 1 – Wa Wb = 1-0.96 = 0.04
viii. DRREDDY (a) & HEROHONDA (b)

www.studymafia.org
55
a = 41.62
b = 73.09
nab = 0.43
Wa = 73.09 [73.09-(0.43*41.62)]
2 +
2 – 2(0.43)**
Wa = 4034
4458
Wa = 0.90
Wb = 1 – Wa
Wb = 1-0.90 = 0.10
ix. DRREDDY (a) & BHEL (b)
a = 41.62
b = 80.25 nab = 0.75
Wa = 80.25 [80.25-(0.75*41.62)]
2 +
2 – 2(0.75)**
Wa = 3935 3162
Wa = 1.24
Wb = 1 – Wa
Wb = 1-1.24 = -0.24
CALCULATION OF PORTFOLIO RISK:
www.studymafia.org
56
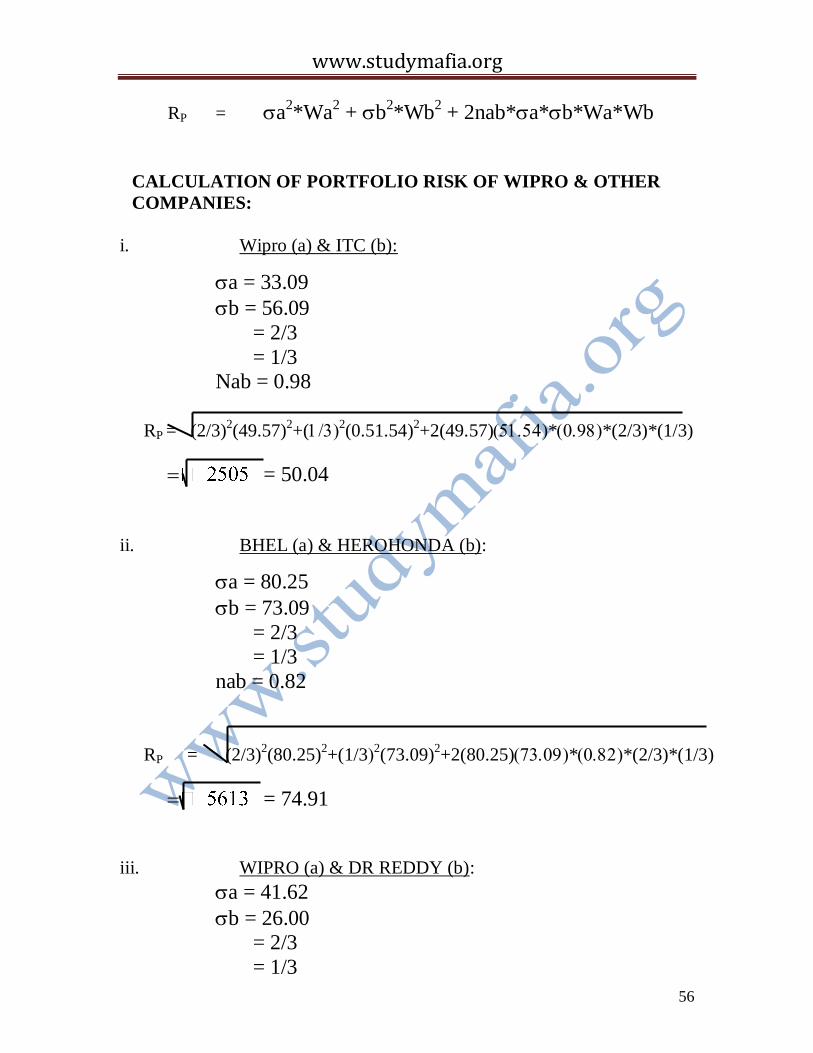
RP = a2*Wa
2 + b
2*Wb
2 + 2nab*a*b*Wa*Wb
CALCULATION OF PORTFOLIO RISK OF WIPRO & OTHER
COMPANIES:
i. Wipro (a) & ITC (b):
a = 33.09
b = 56.09
= 2/3
= 1/3 Nab = 0.98
RP = (2/3)
2(49.57)
2+(
2(0.51.54)
2+2(49.57)**(2/3)*(1/3)
= 50.04
ii. BHEL (a) & HEROHONDA (b):
a = 80.25
b = 73.09
= 2/3 = 1/3
nab = 0.82
RP = (2/3)
2(80.25)
2+(1/3
2(73.09)
2+2(80.25)**(2/3)*(1/3)
= 74.91
iii. WIPRO (a) & DR REDDY (b):
a = 41.62
b = 26.00 = 2/3
= 1/3

www.studymafia.org
57
nab = 0.43
RP = (2/3)2(41.62)
2+(1/3
2(26.00)
2+2(41.62)**(2/3)*(1/3)
= 25.43
iv. ITC (a) & BHEL (b):
a = 51.54
b = 80.25 = 1/3
= 2/3
nab = 0.68
RP = (1/3)
2(51.54)
2+(2/3
2(80.25)
2+2(51.54)**(2/3)*(1/3)
v. ACC (a) & BHEL (b):
a = 49.57
b = 80.25 = 2/3
=1/3
nab = 0.92
RP = (2/3)
2(49.57)
2+(1/3
2(80.25)
2+2(49.57)**(2/3)*(1/3)
= 69.18
www.studymafia.org
58
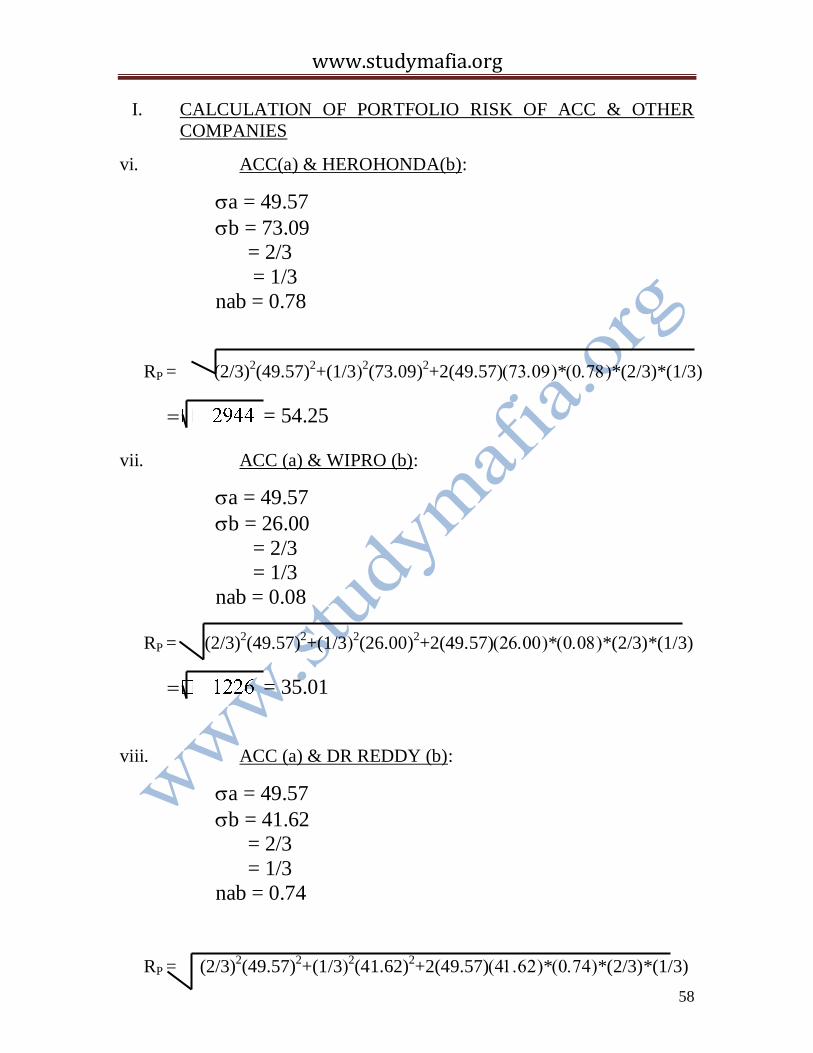
I. CALCULATION OF PORTFOLIO RISK OF ACC & OTHER
COMPANIES
vi. ACC(a) & HEROHONDA(b):
a = 49.57
b = 73.09 = 2/3
= 1/3
nab = 0.78
RP = (2/3)2(49.57)
2+(1/3
2(73.09)
2+2(49.57)**(2/3)*(1/3)
= 54.25
vii. ACC (a) & WIPRO (b):
a = 49.57
b = 26.00
= 2/3 = 1/3
nab = 0.08
RP = (2/3)2(49.57)
2+(1/3
2(26.00)
2+2(49.57)**(2/3)*(1/3)
= 35.01
viii. ACC (a) & DR REDDY (b):
a = 49.57
b = 41.62 = 2/3
= 1/3
nab = 0.74
RP = (2/3)
2(49.57)
2+(1/3
2(41.62)
2+2(49.57)**(2/3)*(1/3)
www.studymafia.org
59
= 44.40
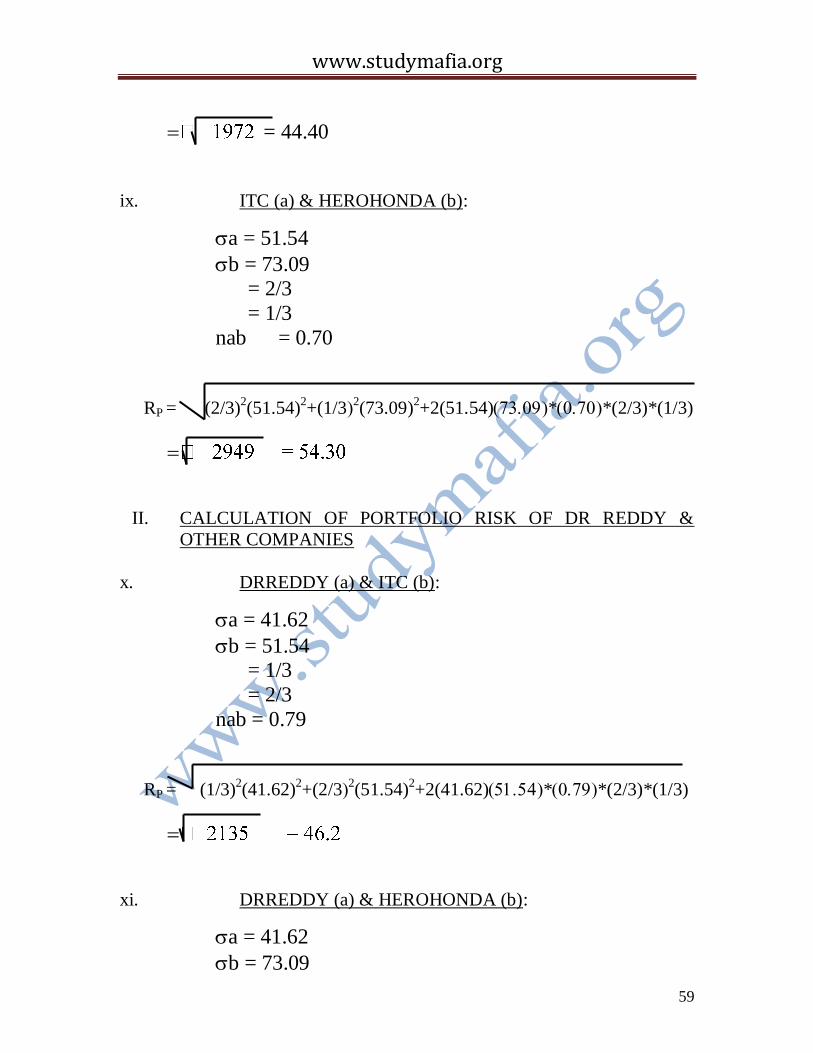
ix. ITC (a) & HEROHONDA (b):
a = 51.54
b = 73.09 = 2/3
= 1/3
nab = 0.70
RP = (2/3)2(51.54)
2+(1/3
2(73.09)
2+2(51.54)**(2/3)*(1/3)
II. CALCULATION OF PORTFOLIO RISK OF DR REDDY &
OTHER COMPANIES
x. DRREDDY (a) & ITC (b):
a = 41.62
b = 51.54 = 1/3
= 2/3
nab = 0.79
RP = (1/3)2(41.62)
2+(2/3
2(51.54)
2+2(41.62)**(2/3)*(1/3)
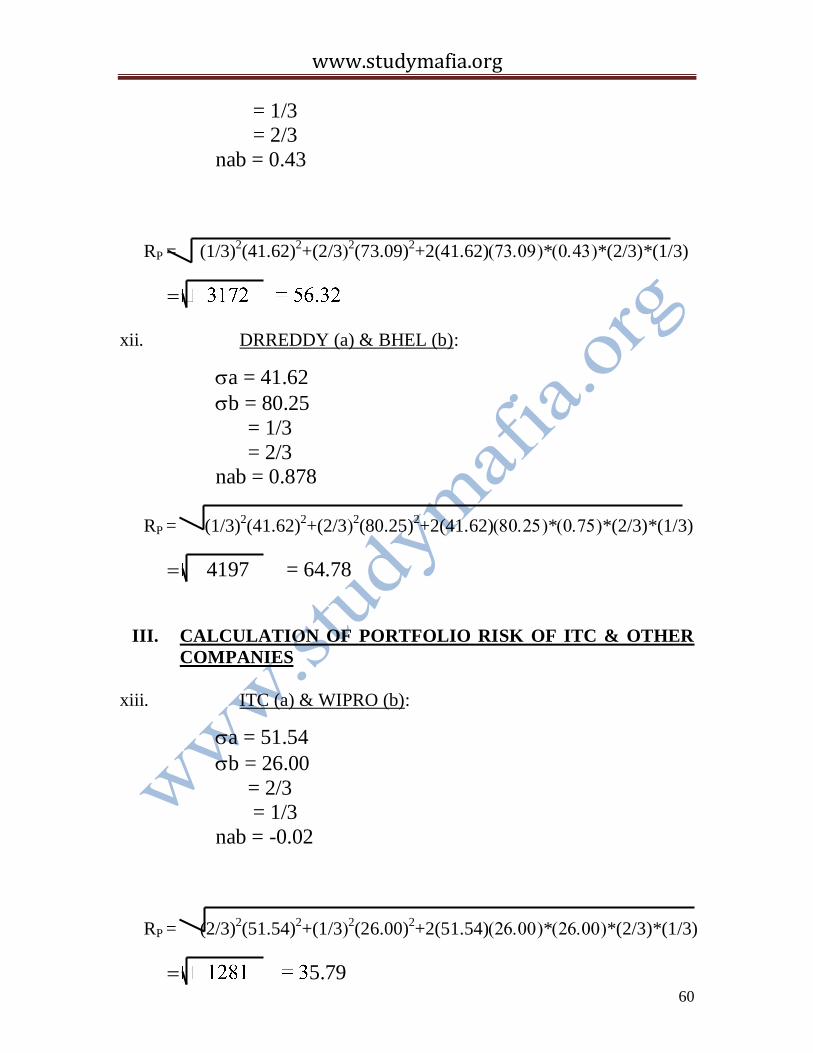
xi. DRREDDY (a) & HEROHONDA (b):
a = 41.62
b = 73.09
www.studymafia.org
60
= 1/3 = 2/3
nab = 0.43
RP = (1/3)2(41.62)
2+(2/3
2(73.09)
2+2(41.62)**(2/3)*(1/3)
xii. DRREDDY (a) & BHEL (b):
a = 41.62
b = 80.25
= 1/3
= 2/3 nab = 0.878
RP = (1/3)
2(41.62)
2+(2/3
2(80.25)
2+2(41.62)**(2/3)*(1/3)
4197 = 64.78
III. CALCULATION OF PORTFOLIO RISK OF ITC & OTHER
COMPANIES
xiii. ITC (a) & WIPRO (b):
a = 51.54
b = 26.00
= 2/3 = 1/3
nab = -0.02
RP = (2/3)2(51.54)
2+(1/3
2(26.00)
2+2(51.54)**(2/3)*(1/3)
5.79

www.studymafia.org
61
xiv. HEROHONDA (a) & WIPRO (b):
a = 73.09
b = 26.00
= 2/3
= 1/3 nab = 0.20
RP = (2/3)2(73.09)
2+(1/3
2(26.00)
2+2(73.09)**(0.67)*(0.33)
IV. CALCULATION OF PORTFOLIO RISK OF BHEL (a) &WIPRO
(b)
a = 80.25
b = 26.00
=2/3
=1/3 nab = -0.21
RP = (2/3)2(80.25)
2+(1/3
2(26.00)
2+2(80.25)**(2/3)*(1/3)
www.studymafia.org
62
CONCLUSION
For any investment the factors to be considered are the return
on the investment and the risk associated with that investment.
Diversification in the investment into different assets can
reduce the risk. There fore by following modern portfolio theorem,
risk can be reduced for a required return
Reference
.
www.google.com
www.wikipedia.com
www.studymafia.org
www.pptplanet.com