Portfolio Construction Approaches: Active, Passive, … · Portfolio Construction Approaches:...
28
<#> © 2006 Morningstar, Inc. All rights reserved. Portfolio Construction Approaches: Active, Passive, and Alternative ×Presenter; ×Christopher Traulsen, Director of Fund Research, Morningstar
Transcript of Portfolio Construction Approaches: Active, Passive, … · Portfolio Construction Approaches:...
<#>
© 2006 Morningstar, Inc. All rights reserved.
Portfolio Construction Approaches: Active, Passive, and Alternative
×Presenter;×Christopher Traulsen, Director of Fund Research, Morningstar
2
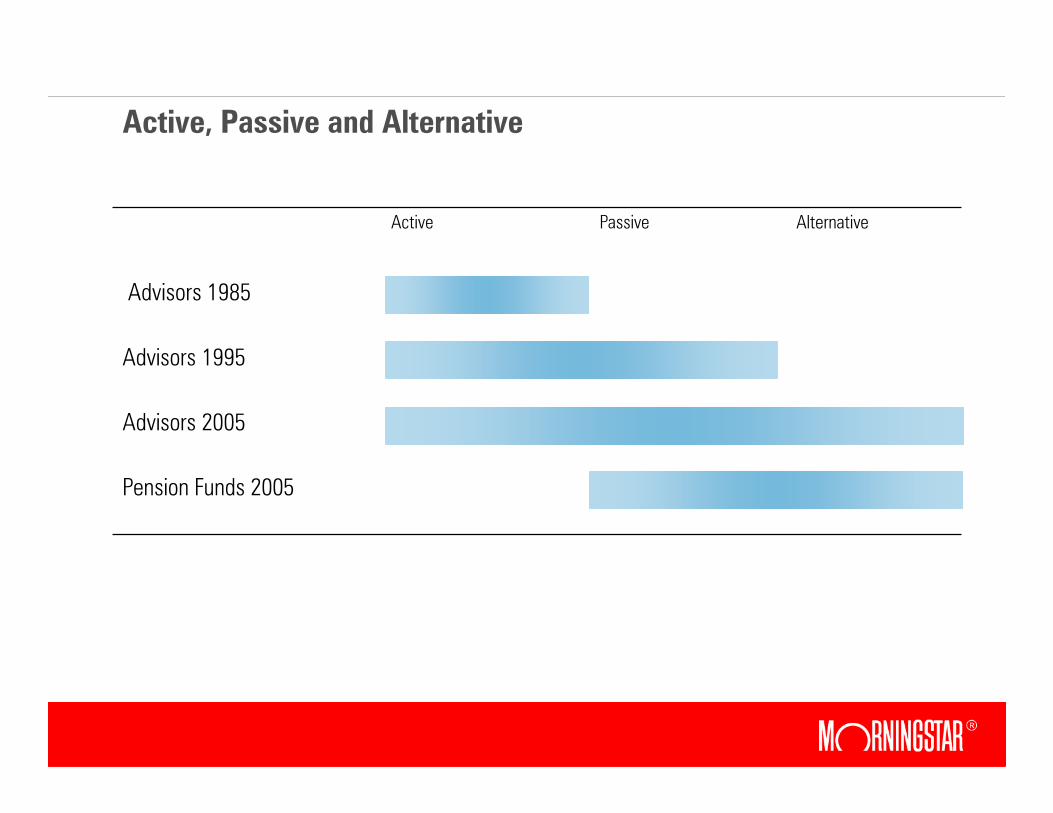
Active, Passive and Alternative
Pension Funds 2005
Advisors 2005
Advisors 1995
Advisors 1985
AlternativePassiveActive
3
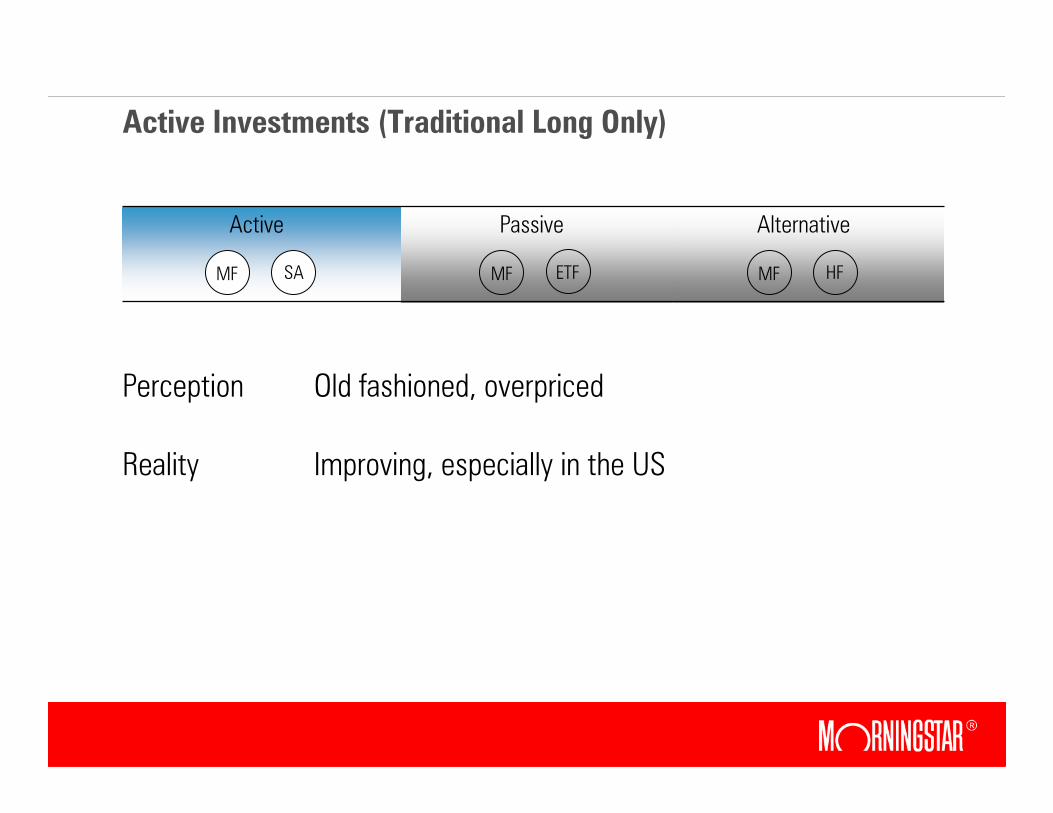
Active Investments (Traditional Long Only)
AlternativePassiveActive
MF SA MF ETF MF HF
Perception Old fashioned, overpriced
Reality Improving, especially in the US
4
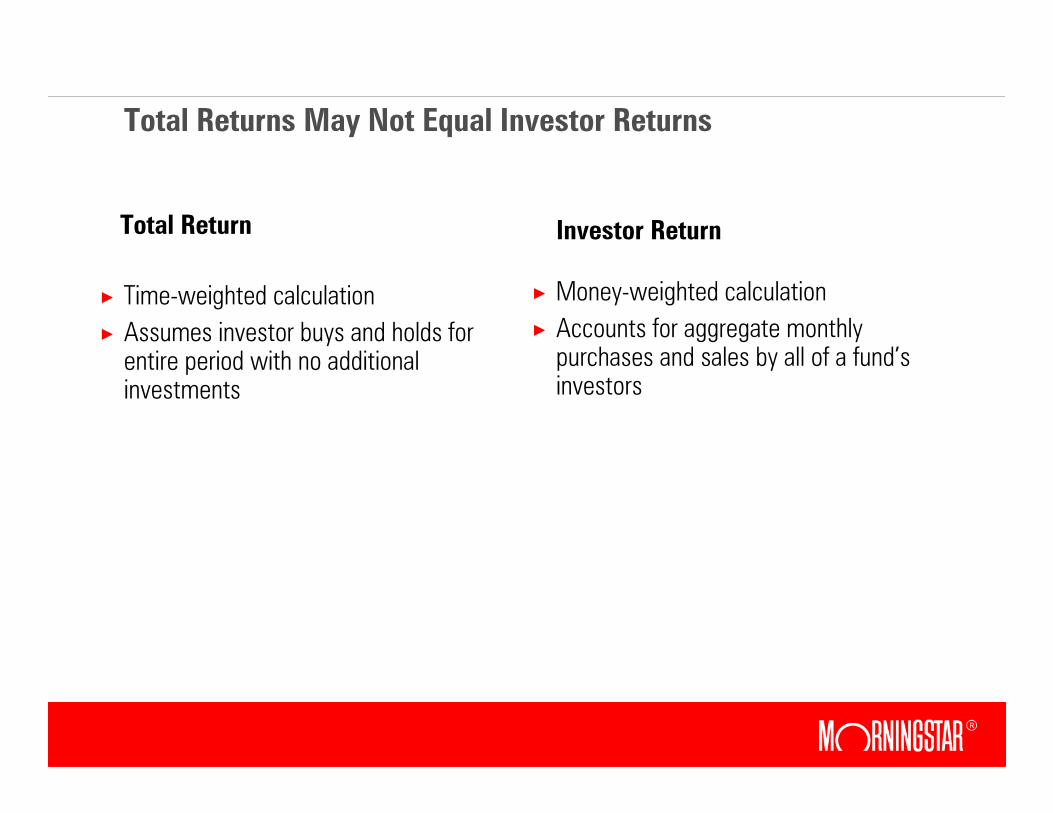
Total Returns May Not Equal Investor Returns
× Time-weighted calculation
× Assumes investor buys and holds for entire period with no additional investments
× Money-weighted calculation
× Accounts for aggregate monthly purchases and sales by all of a fund’s investors
Total Return Investor Return
5
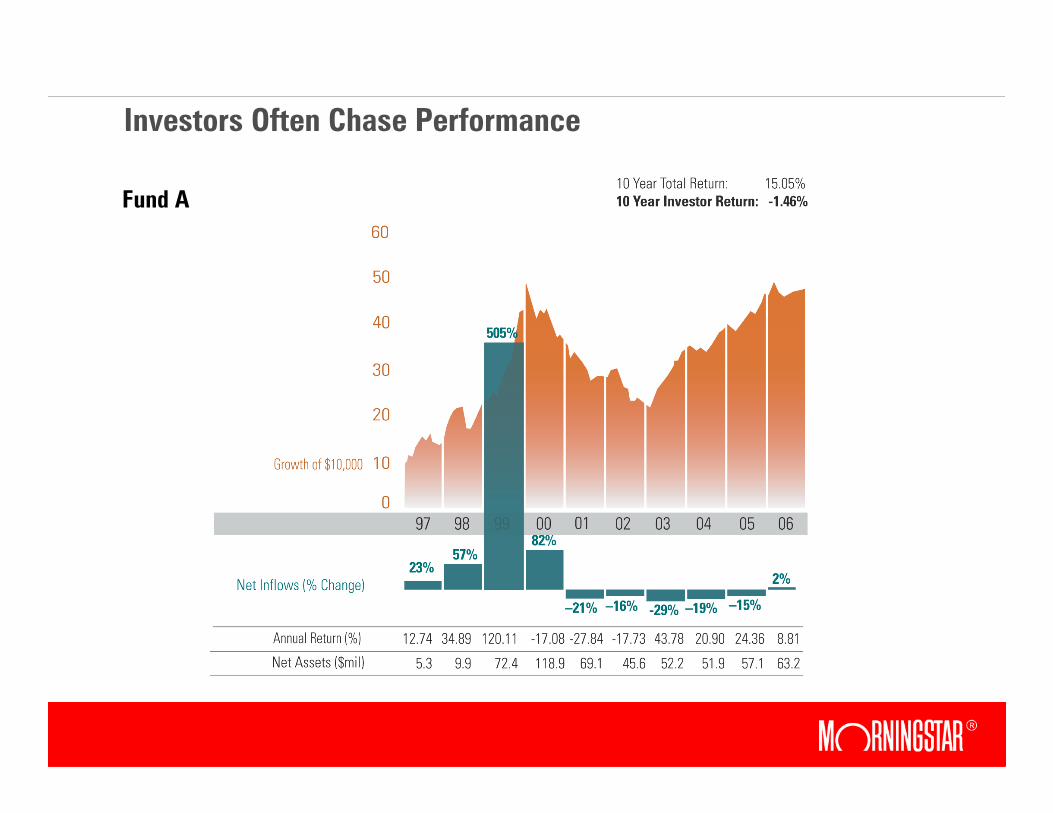
Investors Often Chase Performance
Fund A
6
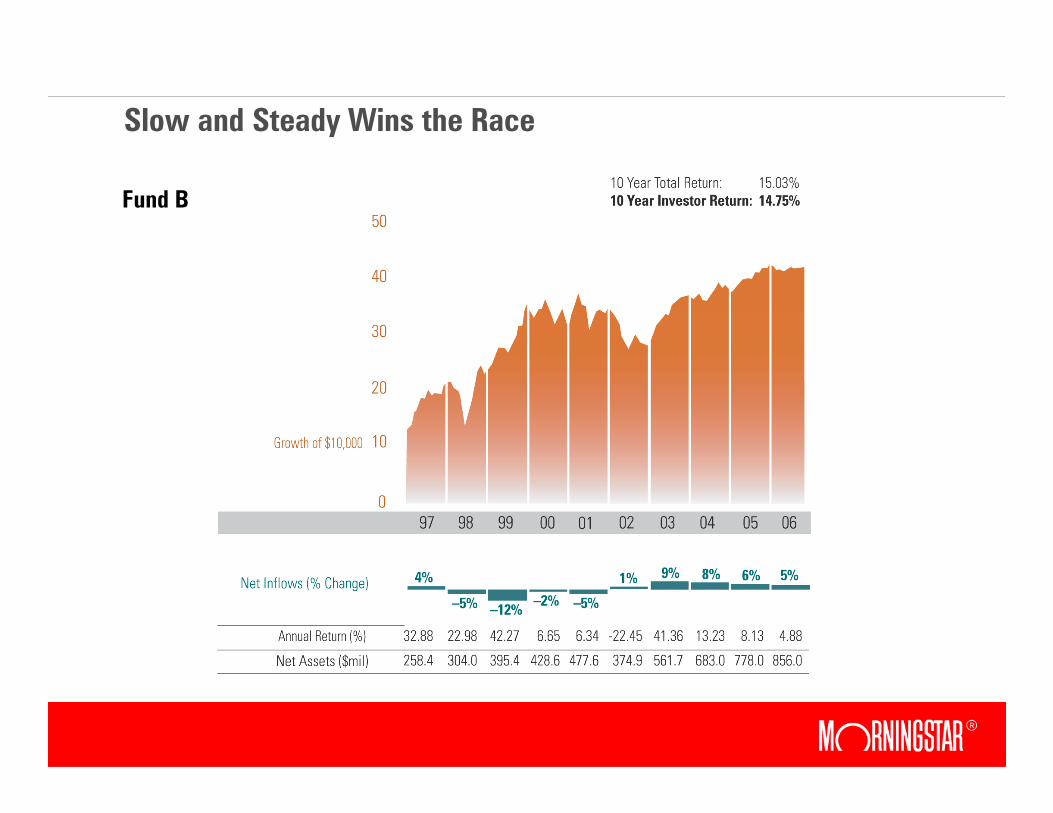
Slow and Steady Wins the Race
Fund B
7
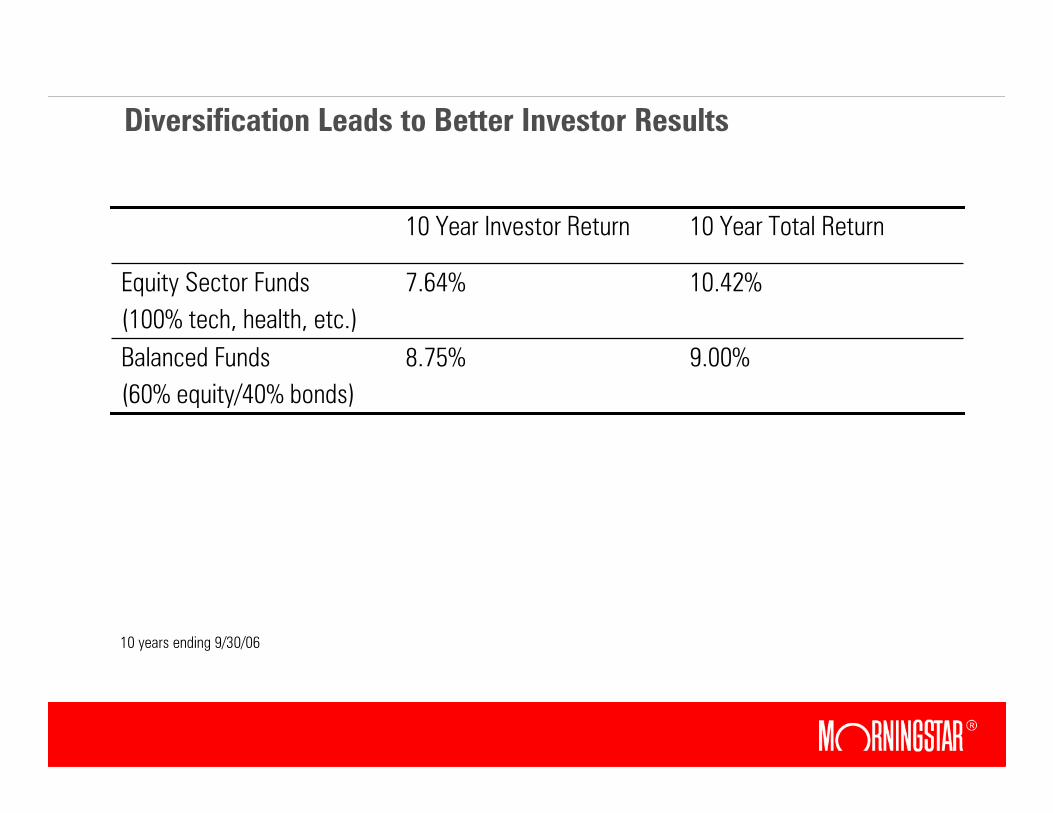
Diversification Leads to Better Investor Results
10 years ending 9/30/06
9.00%8.75%Balanced Funds
(60% equity/40% bonds)
10.42%7.64%Equity Sector Funds
(100% tech, health, etc.)
10 Year Total Return10 Year Investor Return
8
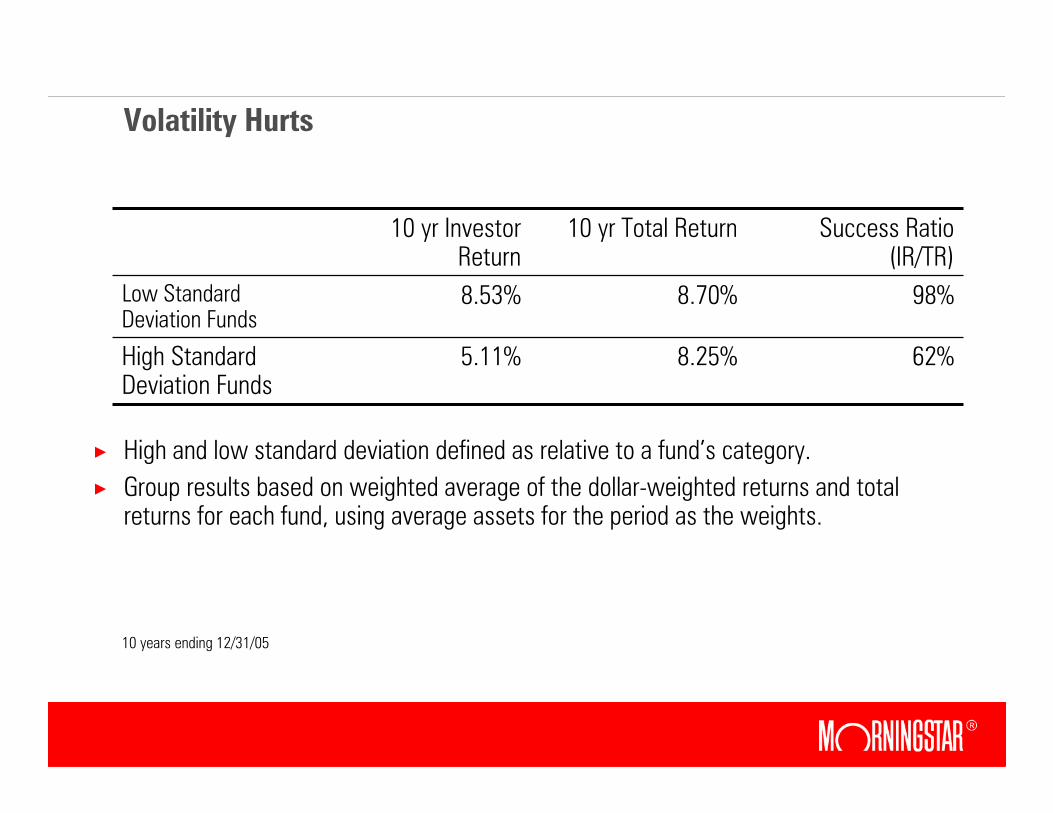
Volatility Hurts
× High and low standard deviation defined as relative to a fund’s category.
× Group results based on weighted average of the dollar-weighted returns and total returns for each fund, using average assets for the period as the weights.
Success Ratio (IR/TR)
10 yr Total Return10 yr Investor Return
62%8.25%5.11%High Standard Deviation Funds
98%8.70%8.53%Low Standard Deviation Funds
10 years ending 12/31/05
9
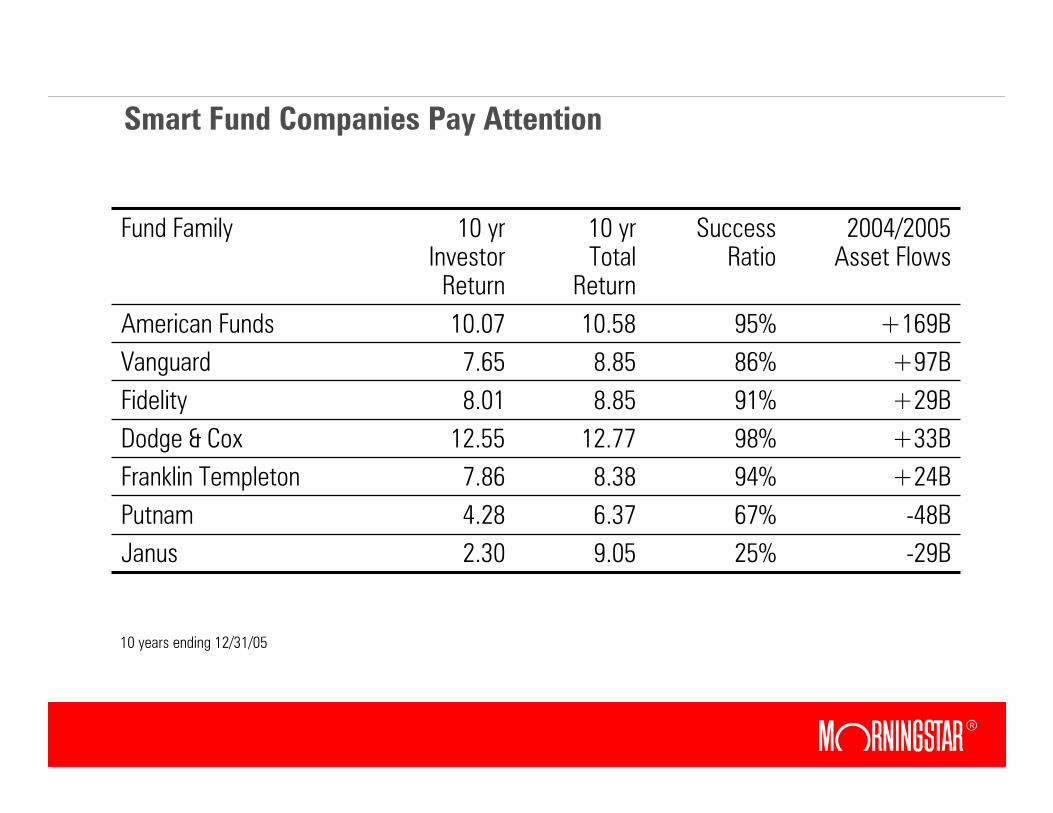
Smart Fund Companies Pay Attention
2004/2005 Asset Flows
Success Ratio
10 yr Total
Return
10 yr Investor Return
Fund Family
-29B25%9.052.30Janus
-48B67%6.374.28Putnam
+24B94%8.387.86Franklin Templeton
+33B98%12.7712.55Dodge & Cox
+29B91%8.858.01Fidelity
+97B86%8.857.65Vanguard
+169B95%10.5810.07American Funds
10 years ending 12/31/05
10
A Culture of Stewardship
× Create a place where analysts and managers want to have long careers.
× Launch funds that make investment sense, not just marketing sense. Lifecycle funds, rather than New China Energy/Infrastructure Fund.
× Communicate in an honest, straightforward manner that helps insure that investors have reasonable expectations. Keeping assets is more important than simply attracting them.
× Creating funds that you would buy on the same terms that they are sold to the public. Recognition that asset management firms only win if their clients do.
11
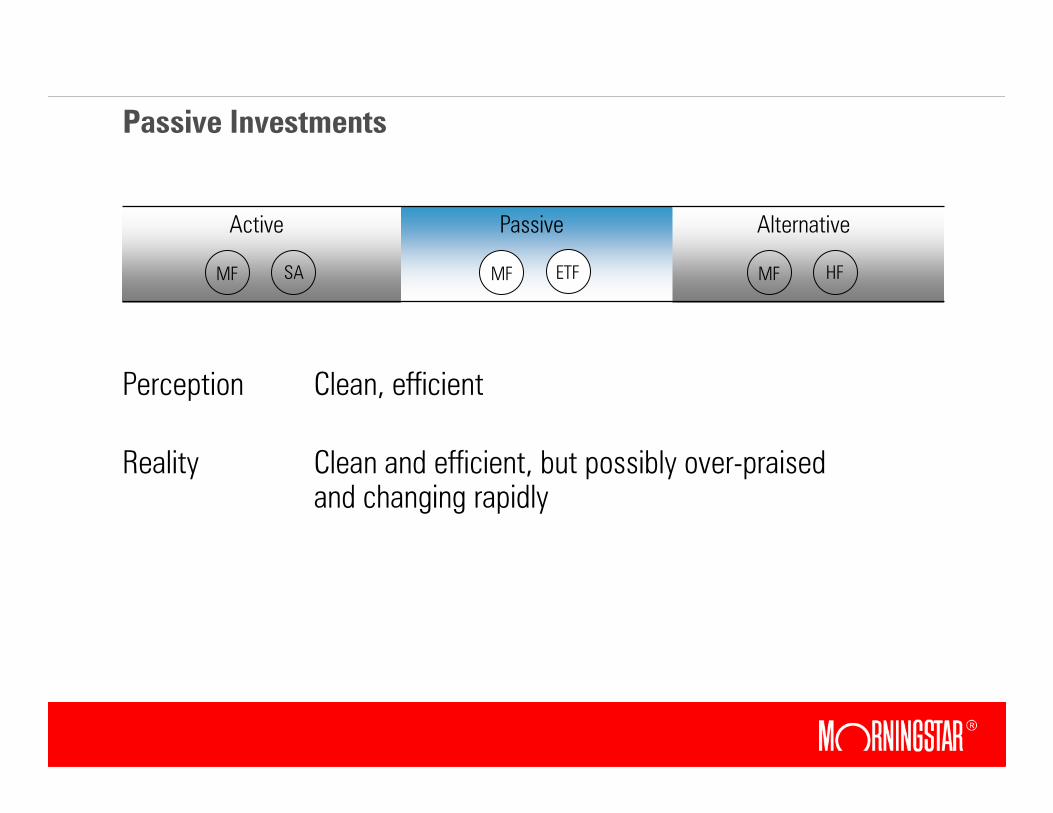
Passive Investments
AlternativePassiveActive
MF SA MF ETF MF HF
Perception Clean, efficient
Reality Clean and efficient, but possibly over-praised and changing rapidly
12
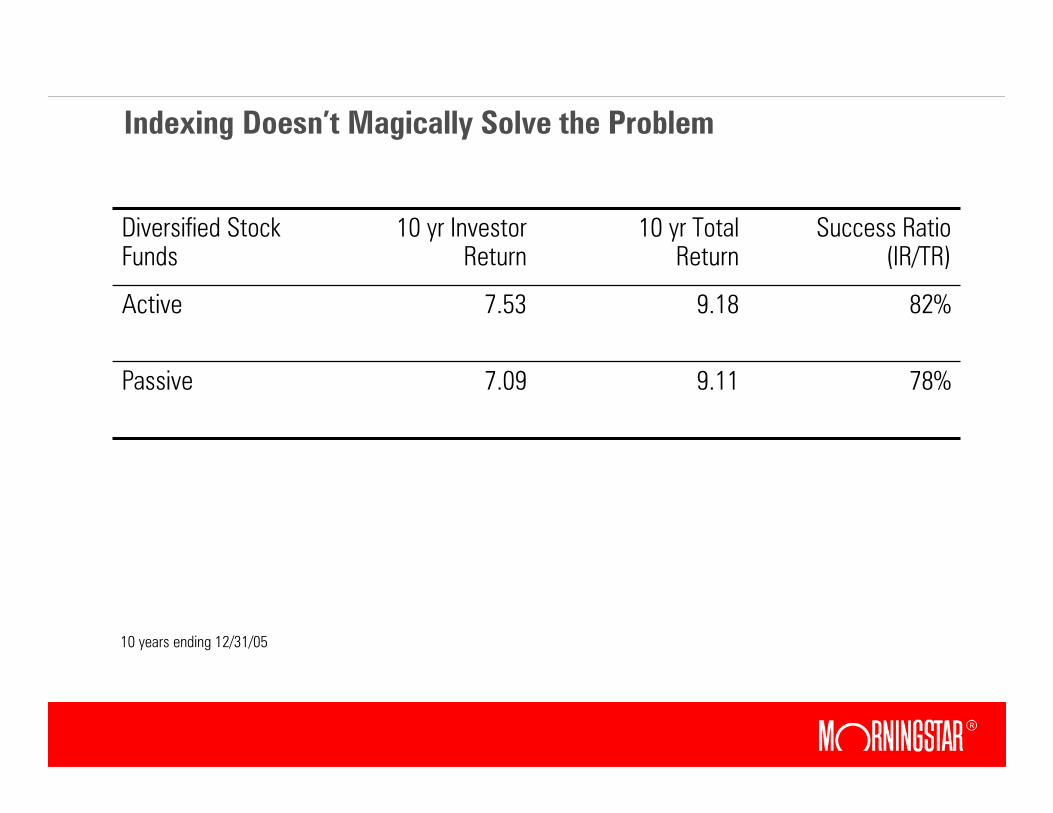
Indexing Doesn’t Magically Solve the Problem
78%9.117.09Passive
82%9.187.53Active
Success Ratio (IR/TR)
10 yr Total Return
10 yr Investor Return
Diversified Stock Funds
10 years ending 12/31/05
13
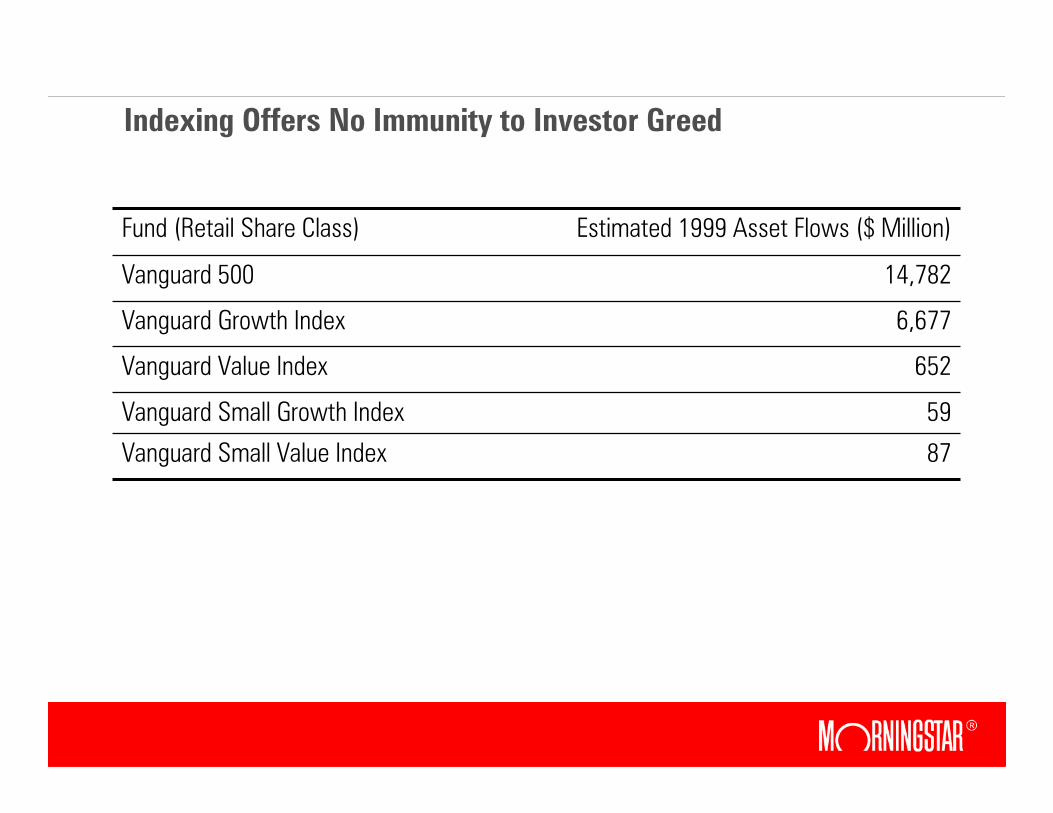
Indexing Offers No Immunity to Investor Greed
87Vanguard Small Value Index
59Vanguard Small Growth Index
652Vanguard Value Index
6,677Vanguard Growth Index
14,782Vanguard 500
Estimated 1999 Asset Flows ($ Million)Fund (Retail Share Class)
14
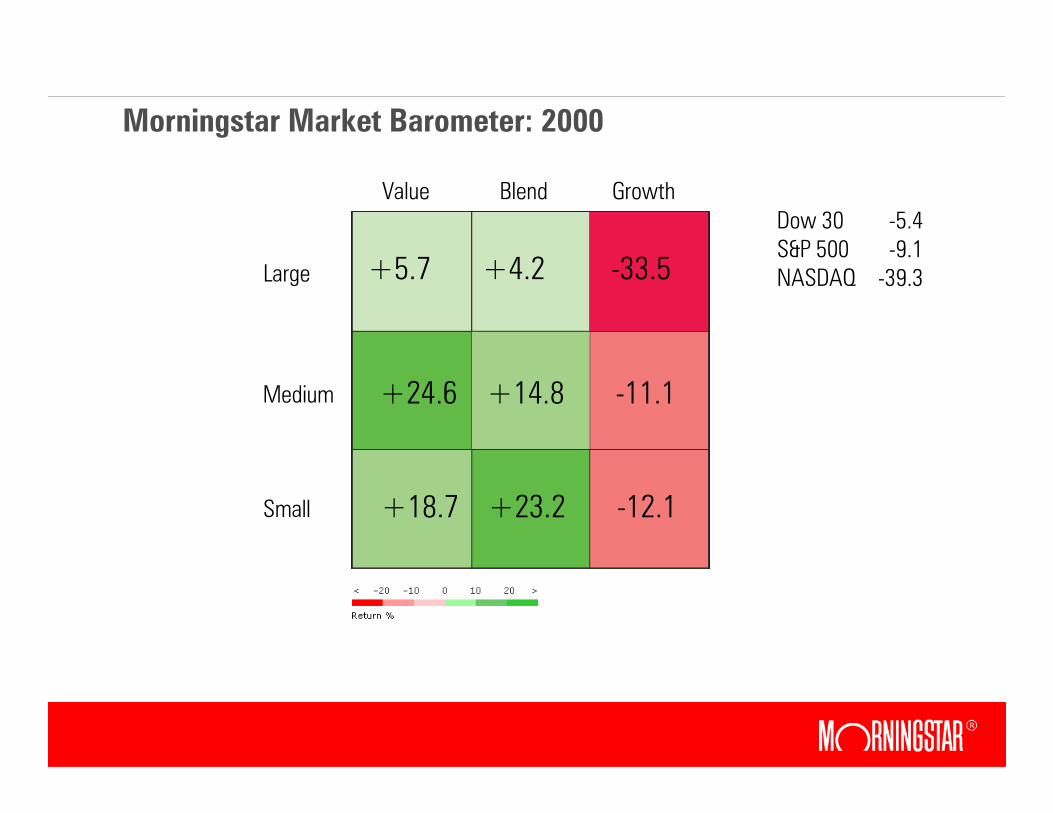
Morningstar Market Barometer: 2000
+5.7 +4.2 -33.5
+24.6 +14.8 -11.1
+18.7 +23.2 -12.1
Value Blend Growth
Large
Medium
Small
Dow 30 -5.4S&P 500 -9.1NASDAQ -39.3
15
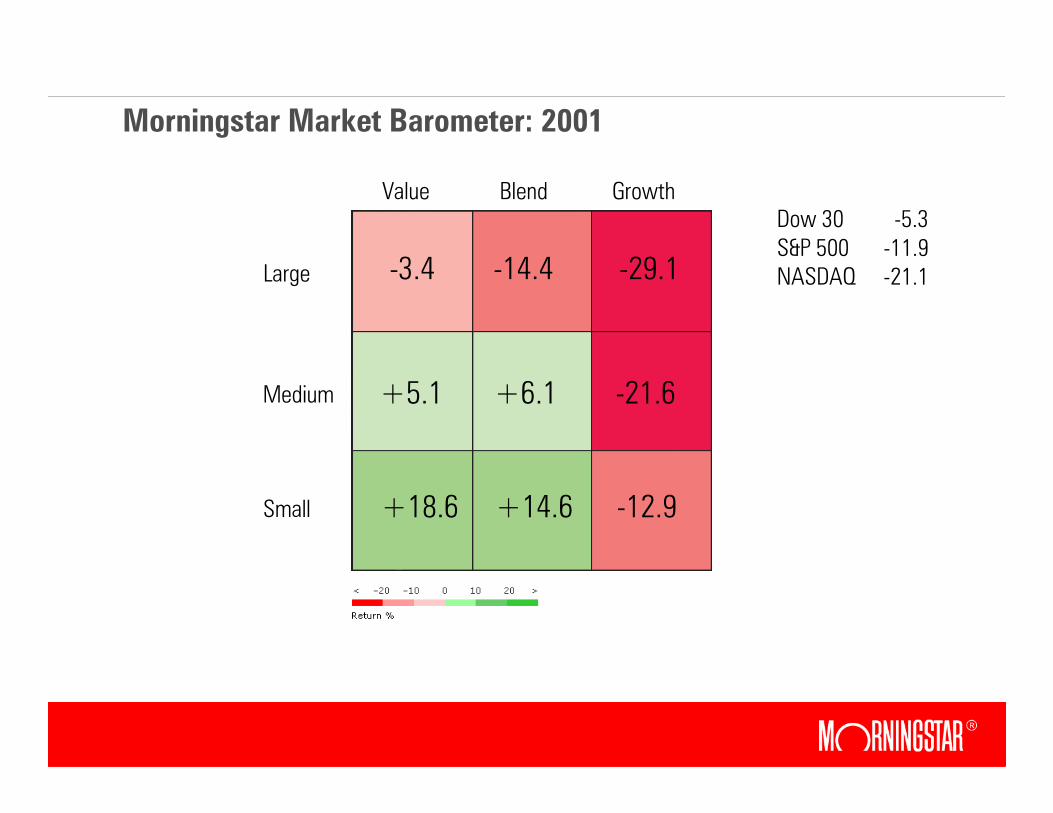
Morningstar Market Barometer: 2001
-3.4 -14.4 -29.1
+5.1 +6.1 -21.6
+18.6 +14.6 -12.9
Value Blend Growth
Large
Medium
Small
Dow 30 -5.3
S&P 500 -11.9NASDAQ -21.1
16
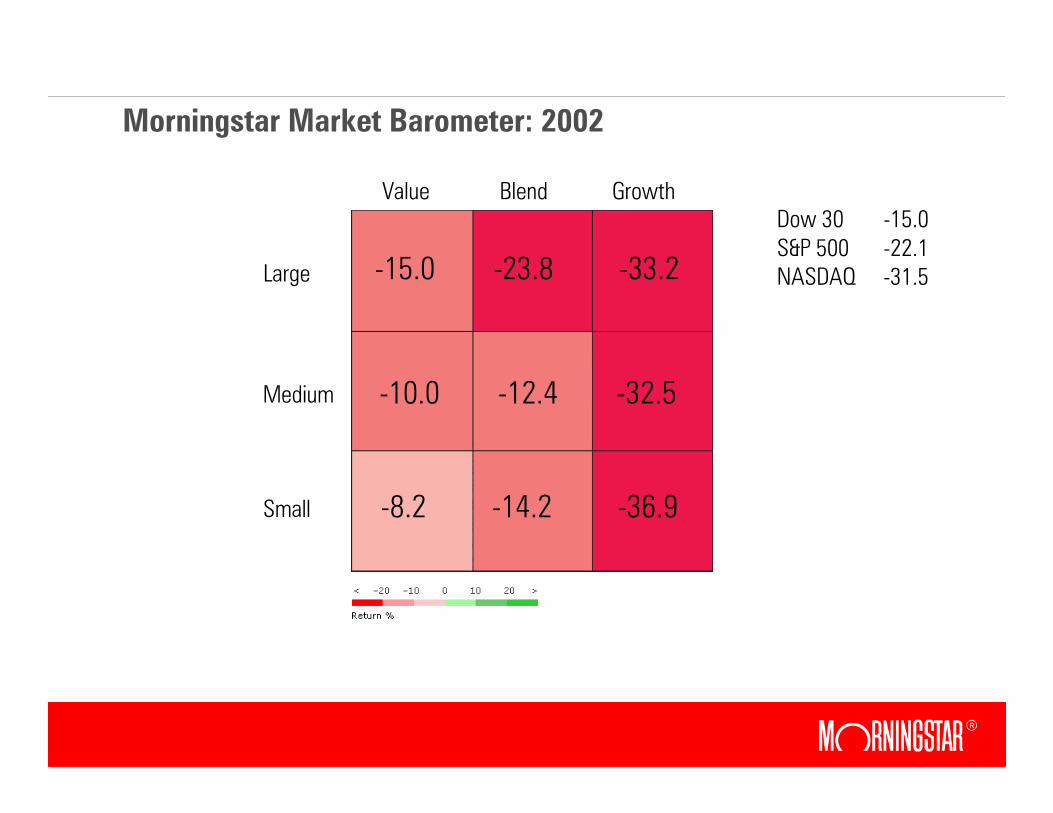
Morningstar Market Barometer: 2002
-15.0 -23.8 -33.2
-10.0 -12.4 -32.5
-8.2 -14.2 -36.9
Value Blend Growth
Large
Medium
Small
Dow 30 -15.0
S&P 500 -22.1NASDAQ -31.5
17
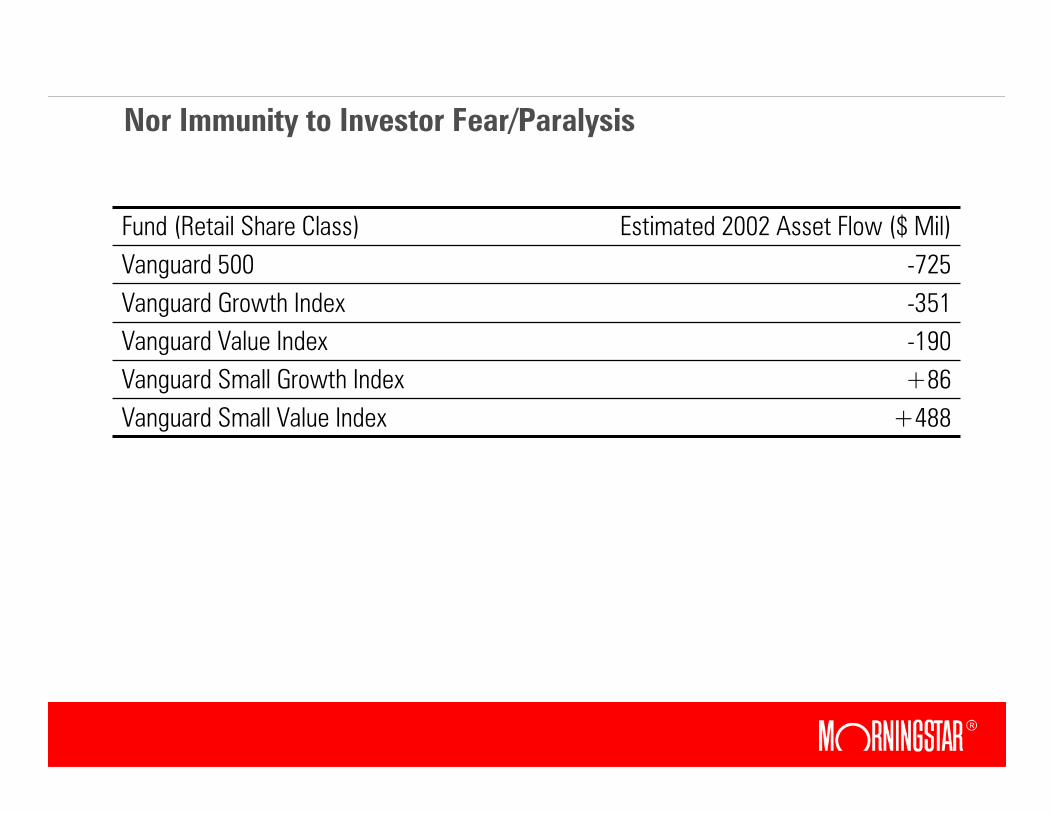
Nor Immunity to Investor Fear/Paralysis
+488Vanguard Small Value Index
+86Vanguard Small Growth Index
-190Vanguard Value Index
-351Vanguard Growth Index
-725Vanguard 500
Estimated 2002 Asset Flow ($ Mil)Fund (Retail Share Class)
18
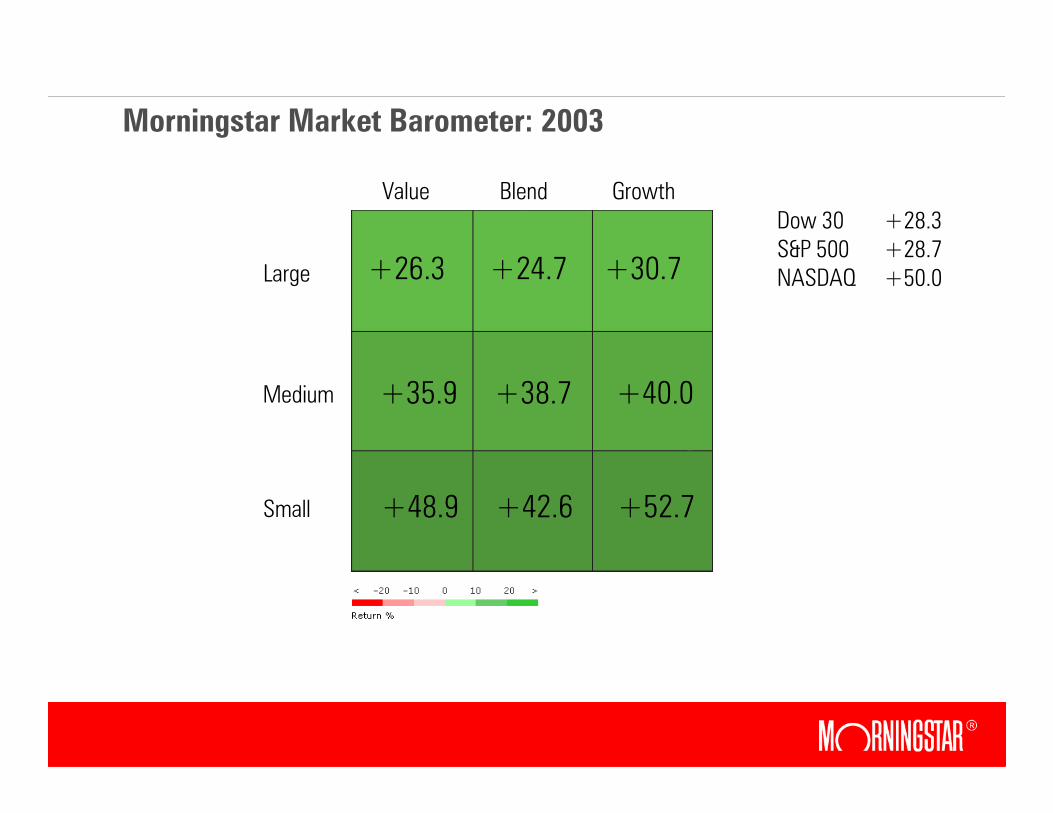
Morningstar Market Barometer: 2003
+26.3 +24.7 +30.7
+35.9 +38.7 +40.0
+48.9 +42.6 +52.7
Value Blend Growth
Large
Medium
Small
Dow 30 +28.3S&P 500 +28.7NASDAQ +50.0
19
Fundamental Weighting Opportunity
× Opportunity to tame extremes of cap weighting strategies, thus making funds easier for investors to use successfully.
× To date, promoted largely as a return enhancement strategy—likely overstated due to recent small value run.
× Could be promoted as a volatility reducing strategy.
× Moving from high standard deviation to low standard deviation performance can greatly enhance the likelihood of a good investor experience.
20
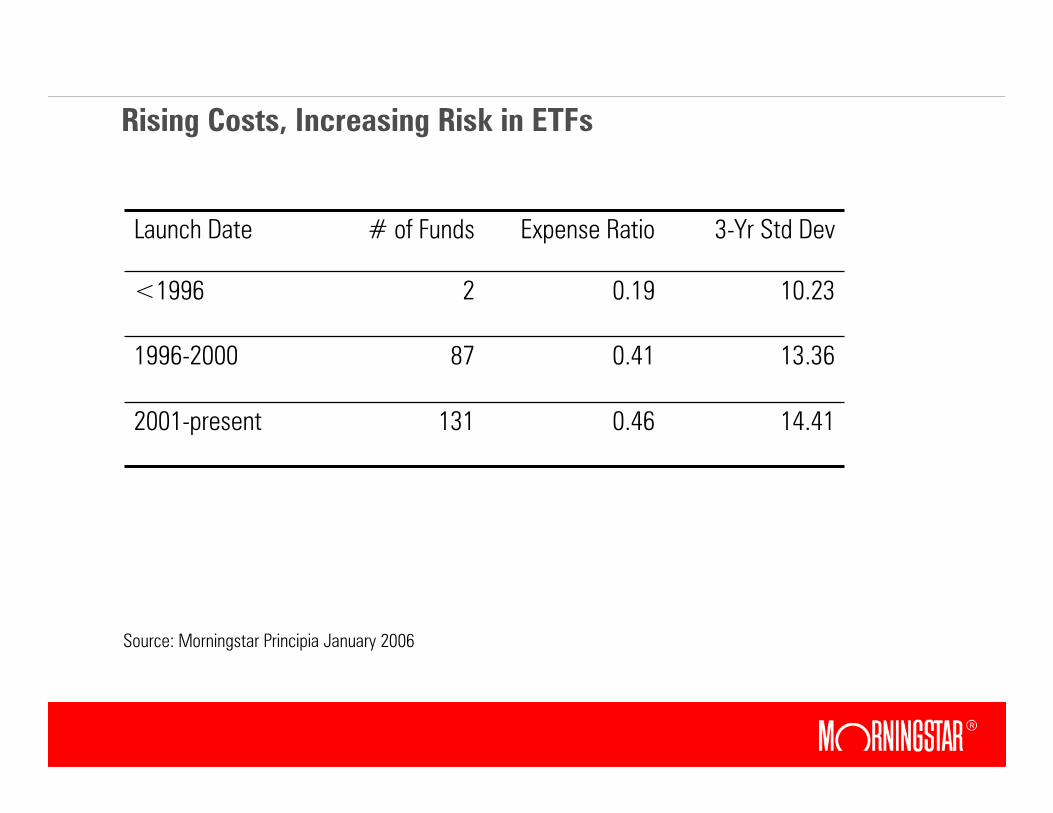
Rising Costs, Increasing Risk in ETFs
14.410.461312001-present
13.360.41871996-2000
10.230.192<1996
3-Yr Std DevExpense Ratio# of FundsLaunch Date
Source: Morningstar Principia January 2006
21
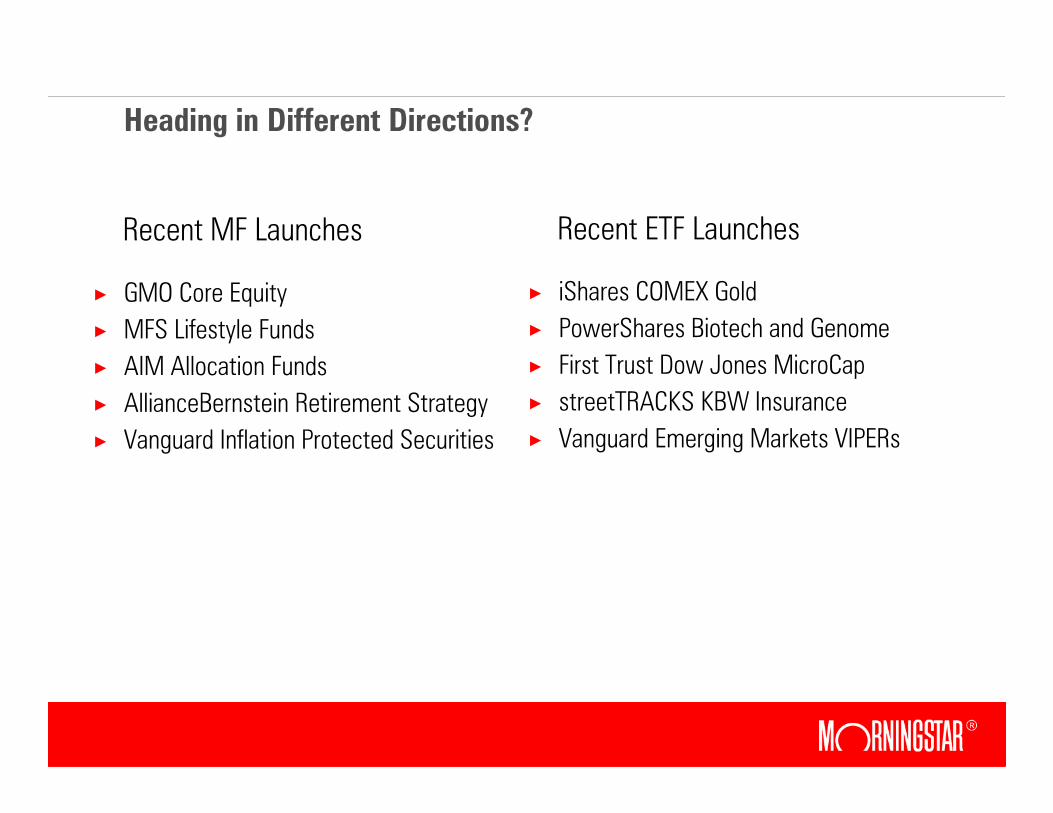
Heading in Different Directions?
× GMO Core Equity
× MFS Lifestyle Funds
× AIM Allocation Funds
× AllianceBernstein Retirement Strategy
× Vanguard Inflation Protected Securities
× iShares COMEX Gold
× PowerShares Biotech and Genome
× First Trust Dow Jones MicroCap
× streetTRACKS KBW Insurance
× Vanguard Emerging Markets VIPERs
Recent MF Launches Recent ETF Launches
22
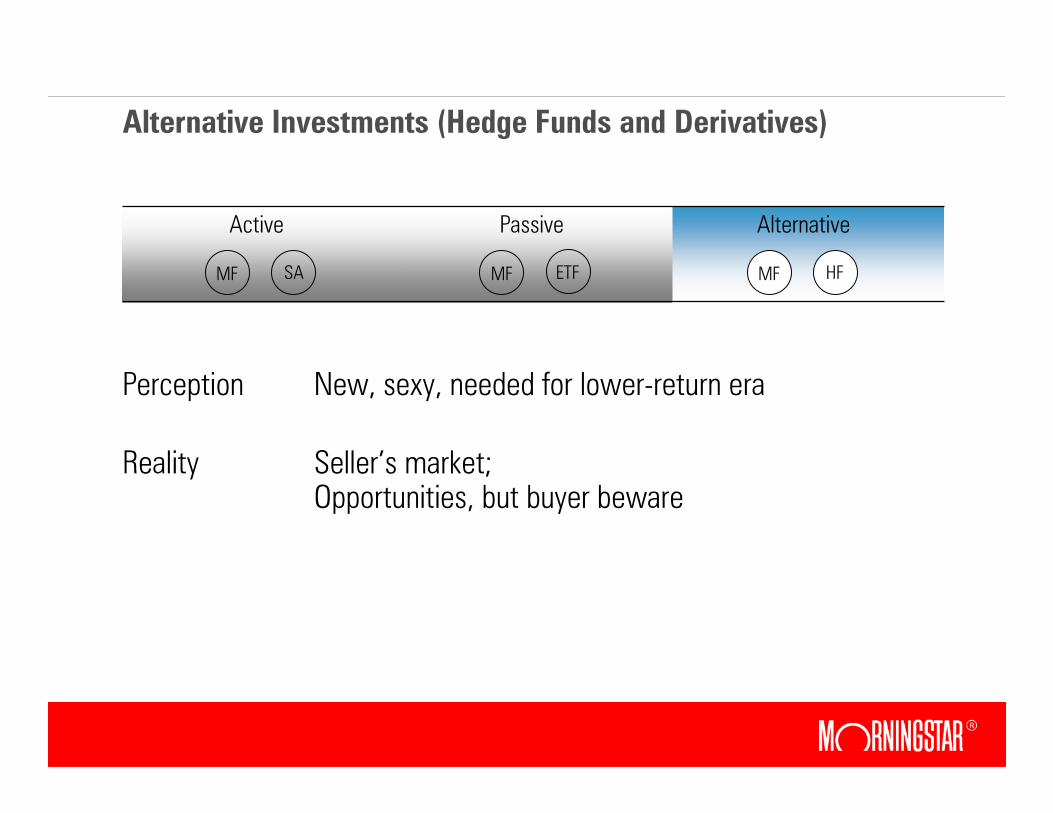
Alternative Investments (Hedge Funds and Derivatives)
AlternativePassiveActive
MF SA MF ETF MF HF
Perception New, sexy, needed for lower-return era
Reality Seller’s market;Opportunities, but buyer beware
23
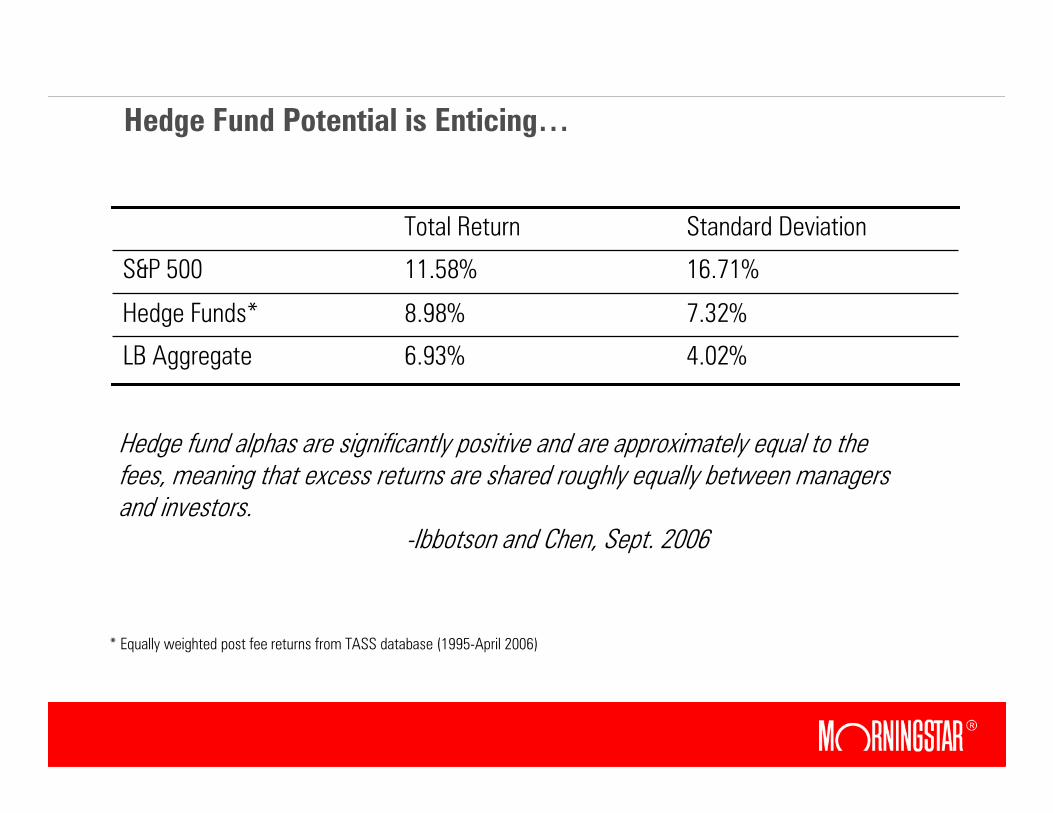
Hedge Fund Potential is Enticing…
4.02%6.93%LB Aggregate
7.32%8.98%Hedge Funds*
16.71%11.58%S&P 500
Standard DeviationTotal Return
Hedge fund alphas are significantly positive and are approximately equal to the fees, meaning that excess returns are shared roughly equally between managers and investors.
-Ibbotson and Chen, Sept. 2006
* Equally weighted post fee returns from TASS database (1995-April 2006)
24
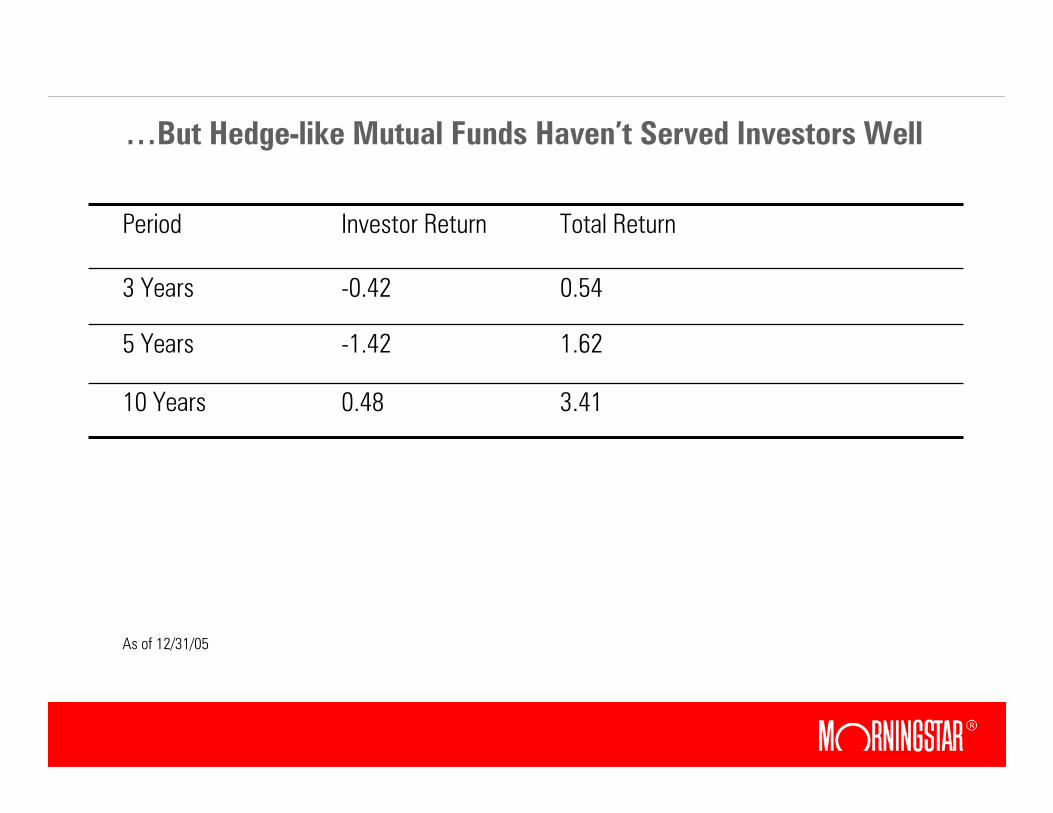
…But Hedge-like Mutual Funds Haven’t Served Investors Well
1.62-1.425 Years
0.54-0.423 Years
3.410.4810 Years
Total ReturnInvestor ReturnPeriod
As of 12/31/05
25
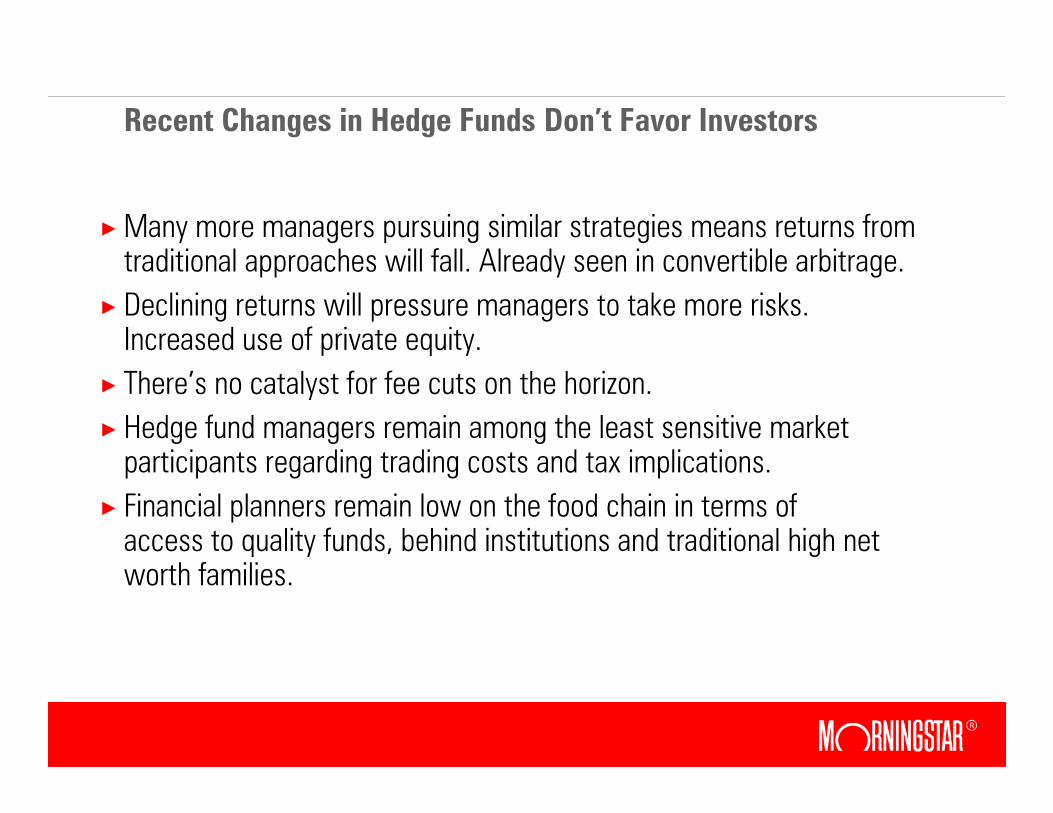
Recent Changes in Hedge Funds Don’t Favor Investors
× Many more managers pursuing similar strategies means returns from traditional approaches will fall. Already seen in convertible arbitrage.
× Declining returns will pressure managers to take more risks. Increased use of private equity.
× There’s no catalyst for fee cuts on the horizon.
× Hedge fund managers remain among the least sensitive market participants regarding trading costs and tax implications.
× Financial planners remain low on the food chain in terms of access to quality funds, behind institutions and traditional high net worth families.
26
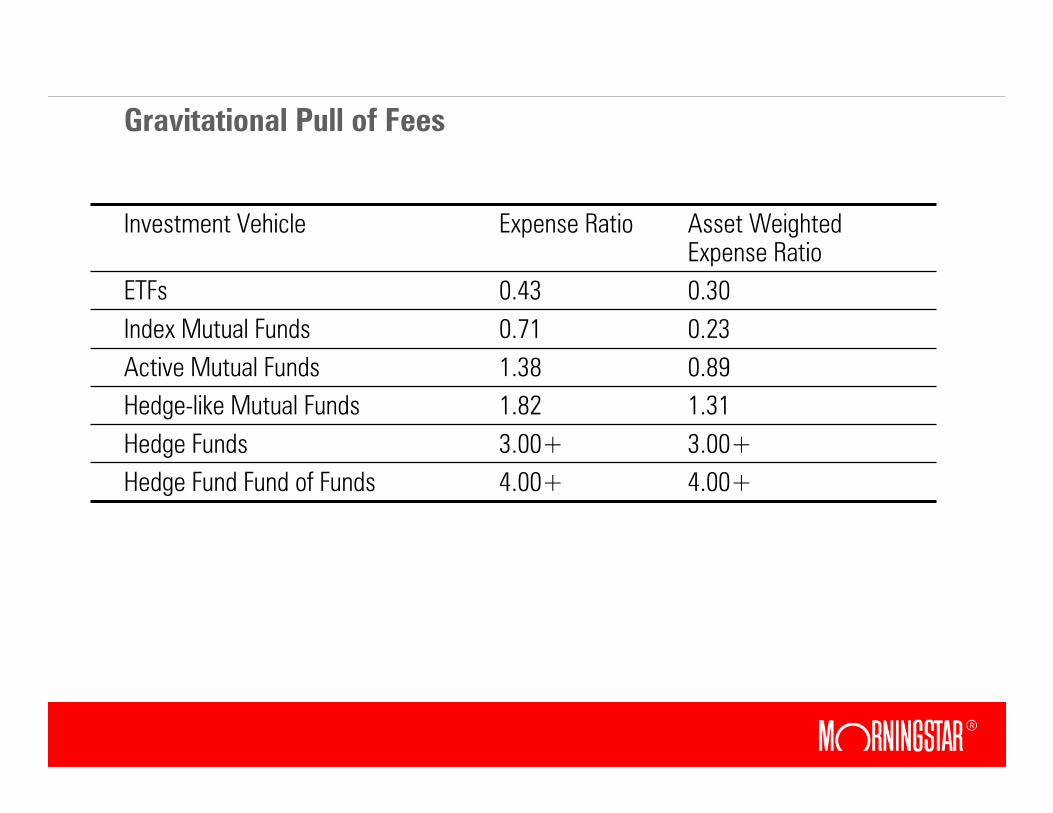
Gravitational Pull of Fees
3.00+3.00+Hedge Funds
4.00+4.00+Hedge Fund Fund of Funds
1.311.82Hedge-like Mutual Funds
0.891.38Active Mutual Funds
0.230.71Index Mutual Funds
0.300.43ETFs
Asset Weighted Expense Ratio
Expense RatioInvestment Vehicle
27
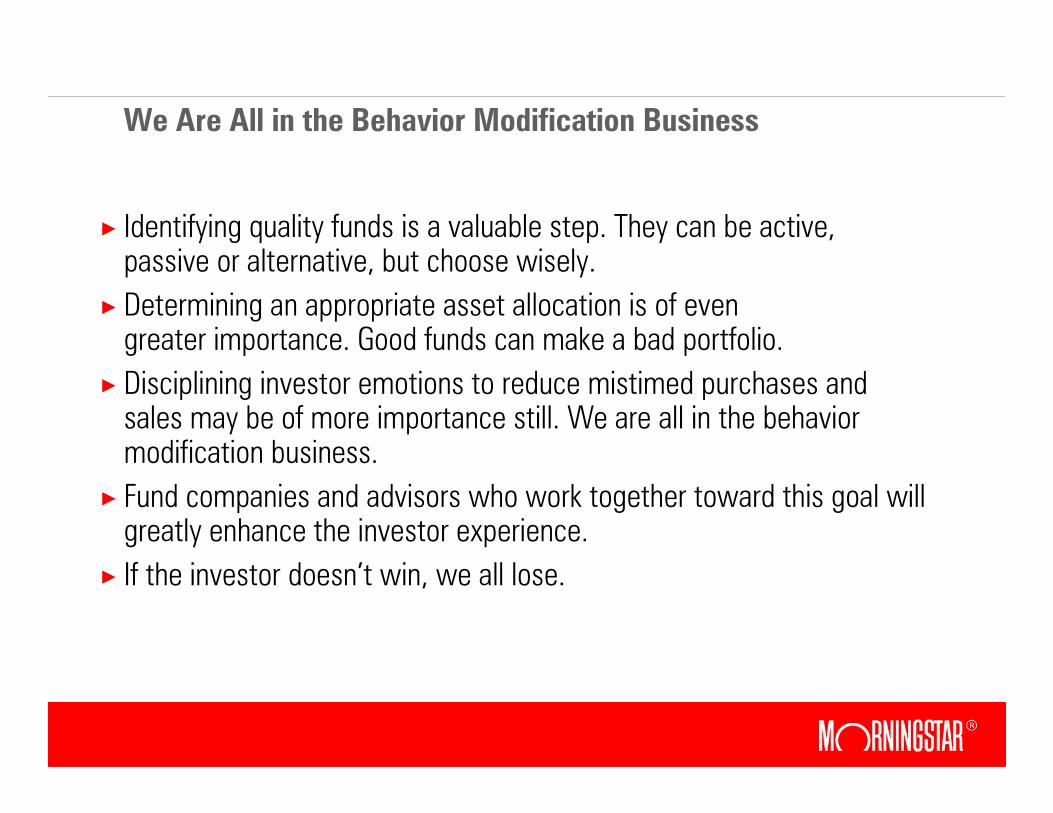
We Are All in the Behavior Modification Business
× Identifying quality funds is a valuable step. They can be active, passive or alternative, but choose wisely.
× Determining an appropriate asset allocation is of even greater importance. Good funds can make a bad portfolio.
× Disciplining investor emotions to reduce mistimed purchases and sales may be of more importance still. We are all in the behavior modification business.
× Fund companies and advisors who work together toward this goal will greatly enhance the investor experience.
× If the investor doesn’t win, we all lose.

28