Portfolio Carbon Footprint - Aashe · Portfolio Carbon Footprint for San Francisco State University...
14
Portfolio Carbon Footprint San Francisco State University Foundation Tanvi Pradhan Supervised by Dr. Philip King
Transcript of Portfolio Carbon Footprint - Aashe · Portfolio Carbon Footprint for San Francisco State University...

0
Portfolio Carbon Footprint San Francisco State University
Foundation
Tanvi Pradhan Supervised by Dr. Philip King

Portfolio Carbon Footprint for San Francisco State University Foundation
1
Table of Contents 1. Acknowledgement ................................................................................................................................ 2
2. Introduction .......................................................................................................................................... 3
2.1 Greenhouse Gas Protocol ............................................................................................................. 3
2.2 Carbon Disclosure Project............................................................................................................. 4
3. Methodology ......................................................................................................................................... 5
3.1 Data Gathering .............................................................................................................................. 5
3.2 Calculation of Portfolio Footprint for Stocks that report emissions ............................................. 7
3.3 Estimation of Portfolio Footprint for Stocks that do not report emissions .................................. 8
3.4 Carbon Footprint of Portfolio ..................................................................................................... 10
3.5 Comparison with a Benchmark ................................................................................................... 10
4. Limitations of the Model ..................................................................................................................... 11
5. Bibliography ........................................................................................................................................ 12
6. List of Tables and Equations................................................................................................................ 13
Portfolio Carbon Footprint for San Francisco State University Foundation
2
1. Acknowledgement
This paper was written under the guidance and supervision of Dr. Philip King. The process of calculating
the carbon footprint of the equity portfolio also benefited from the support provided by Daniel Tichenor
and Brian Sharpes of UBS Financial Services Inc. Finally, the encouragement and support of the Finance
and Investment Committee of the SF State Foundation was critical to the completion of this project.
Portfolio Carbon Footprint for San Francisco State University Foundation
3
2. Introduction
In the spring of 2013, the San Francisco State University Foundation committed “to limit direct
investments in companies with significant production or use of coal and tar sands.” (SF State
Foundation, 2013) As part of the divestment commitment, the Foundation agreed to estimate the
carbon footprint of the foundation’s equity portfolio. This document describes the process used to
estimate the carbon footprint. For the purpose of this exercise, only equity holdings in the custody of
UBS in August 2014 were considered.
A carbon footprint is defined as “the total amount of greenhouse gases that are emitted into the
atmosphere each year by a person, family, building, organization, or company.” (United States
Environmental Protection Agency, 2013) This includes, but is not limited to, gases such as carbon
dioxide, methane, and nitrous oxide. There are various global standards for measuring the carbon
footprint of a company. Among these, the Greenhouse Gas (GHG) Protocol is the most widely used. This
project considered emissions reported to the Carbon Disclosure Project (CDP) as well as the GHG
Protocol.
2.1 Greenhouse Gas Protocol
The first version of the GHG Protocol was published in 2001 and emerged from a partnership between
the World Resources Institute (WRI) and World Business Council for Sustainable Development. It is “the
most widely used international accounting tool for government and business leaders to understand,
quantify, and manage greenhouse gas emissions.” (The Greenhouse Gas Protocol, 2012)
The GHG Protocol classifies emissions into three categories:
“Scope 1: All direct GHG emissions.
Scope 2: Indirect GHG emissions from consumption of purchased electricity, heat or steam.
Scope 3: Other indirect emissions, such as the extraction and production of purchased materials and
fuels, transport-related activities in vehicles not owned or controlled by the reporting entity, electricity-
related activities (e.g. T&D losses) not covered in Scope 2, outsourced activities, waste disposal, etc.”
(The Greenhouse Gas Protocol, 2012)
Portfolio Carbon Footprint for San Francisco State University Foundation
4
2.2 Carbon Disclosure Project
The Carbon Disclosure Project (CDP) works with companies, investors and governments in order to
promote environmental sustainability. It “has incentivized thousands of companies and cities across the
world’s largest economies to measure and disclose their environmental information” (CDP Worldwide,
2015) in accordance with a set of approved standards, one of which is the GHG Protocol. As a result,
certain companies report emissions using two standards: GHG Protocol and another standard approved
for the CDP. Wherever both these figures are available and distinct, the higher figure has been used to
estimate the portfolio carbon footprint. This allows the estimate to account for the worst possible
scenario.

Portfolio Carbon Footprint for San Francisco State University Foundation
5
3. Methodology
The carbon footprint was calculated for equities in the portfolio since equities represent ownership of
the underlying company. Fixed income investments and other alternative investments were not
considered. Scope 1, 2 and 3 emissions were included in the calculation wherever available. For
companies that did not report Scope 3 figures, the sum of Scope 1 and 2 emissions was used as total
company emissions. For companies which did not have emissions data on Bloomberg, emissions were
estimated using industry averages. These averages were computed using a sample set consisting of
stocks from selected indices and from within the portfolio.
The methodology involved three key phases: (1) gathering the required data from various data sources,
(2) calculating the portfolio footprint for companies that publicly report emissions and (3) estimating the
portfolio footprint for companies which do not publicly report emissions. The below sections describe
these three steps in detail.
3.1 Data Gathering
3.1.1 Portfolio Data
The holdings in the portfolio were obtained from the custodian. The equity portion was split from the
rest of the holdings for the calculation of the carbon footprint. As listed in Table 1, asset classes Equities
and Equities ETF/fund made up the equity portion of the portfolio.
Asset Class Total USD Value
Equities $19,559,050
Equities ETF/fund $3,993,157
Fixed Income $9,029,472
Non Traditional $3,139,780
Grand Total $35,721,457
Table 1 Equity Portion of Portfolio includes Equities and Equities ETF/fund
The ETFs were further split into their member equities using the equation below:
𝑁𝑢𝑚𝑏𝑒𝑟 𝑜𝑓 𝑠ℎ𝑎𝑟𝑒𝑠 𝑜𝑓 𝐸𝑇𝐹 𝑀𝑒𝑚𝑏𝑒𝑟 𝑖𝑛 𝑃𝑜𝑟𝑡𝑓𝑜𝑙𝑖𝑜
=(𝑉𝑎𝑙𝑢𝑒 𝑜𝑓 𝐸𝑇𝐹 𝑖𝑛 𝑃𝑜𝑟𝑡𝑓𝑜𝑙𝑖𝑜 ∗ 𝑃𝑒𝑟𝑐𝑒𝑛𝑡𝑎𝑔𝑒 𝑊𝑒𝑖𝑔ℎ𝑡 𝑜𝑓 𝑆𝑡𝑜𝑐𝑘 𝑖𝑛 𝐸𝑇𝐹)
𝑃𝑟𝑖𝑐𝑒 𝑜𝑓 𝑆𝑡𝑜𝑐𝑘
Equation 1 Conversion of ETF holdings to individual equity holdings

Portfolio Carbon Footprint for San Francisco State University Foundation
6
The Percentage Weight of Stock in ETF as well as the Price of Stock were obtained from Bloomberg. The
price of non-US stocks was converted to USD using current foreign exchange rates.
For example, the portfolio contained 2,465 shares of Ishares Trust Core S&P 500 ETF (Ticker IVV) with a
total value of $477,569. The number of shares of Microsoft contributed by this position was calculated
as follows:
𝑁𝑢𝑚𝑏𝑒𝑟 𝑜𝑓 𝑀𝑆𝐹𝑇 𝑈𝑆 𝑠ℎ𝑎𝑟𝑒𝑠 𝑓𝑟𝑜𝑚 𝐸𝑇𝐹 = 𝑉𝑎𝑙𝑢𝑒 𝑜𝑓 𝐸𝑇𝐹 ℎ𝑒𝑙𝑑 ∗ 𝑊𝑒𝑖𝑔ℎ 𝑜𝑓 𝑀𝑆𝐹𝑇 𝑈𝑆 𝑖𝑛 𝐸𝑇𝐹
𝑃𝑟𝑖𝑐𝑒 𝑜𝑓 𝑀𝑆𝐹𝑇 𝑈𝑆
=$477,569 ∗ 1.89%
$43.2= 209 𝑠ℎ𝑎𝑟𝑒𝑠 𝑜𝑓 𝑀𝑆𝐹𝑇 𝑈𝑆
The final result of this process gave a complete list of equities held in the portfolio, either through direct
investments or indirectly through ETFs, along with the value of each equity holding.
3.1.2 Bloomberg Data
We obtained the data points listed in Table 2 for each stock in the portfolio from Bloomberg so that
emissions could be calculated for stocks that report emissions publicly and estimated for the rest.
Description
Identifier (Sedol)
Identifier (Ticker)
Exchange where Security is listed
Last Price
Currency of Last Price, Market Capitalization
Sales Turnover
Currency of Sales Turnover
Market Capitalization
CDP Scope 1 emissions
CDP Scope 2 emissions
Total GHG Emissions
GHG Scope 1 Emissions
GHG Scope 2 Emissions
GHG Scope 3 Emissions
Security Type
Industry Sector
Industry Group
Table 2 Bloomberg data set for Equities in Portfolio

Portfolio Carbon Footprint for San Francisco State University Foundation
7
Next, we collected data points listed in Table 3 for securities in S&P500 index and Russell2000 index
from Bloomberg. This data was used to calculate the industry averages, which allowed us to estimate
emissions when none were reported.
Description
Identifier (Sedol)
Sales Turnover
Currency of Sales Turnover
CDP Scope 1 emissions
CDP Scope 2 emissions
GHG Emissions
GHG Scope 1 Emissions
GHG Scope 2 Emissions
GHG Scope 2 Emissions
Industry Sector
Industry Group
Table 3 Bloomberg data set for Market Indices used in Industry Average calculation
In order to convert figures such as revenues and stock prices into USD, foreign exchange rates were
retrieved from Bloomberg.
3.2 Calculation of Portfolio Footprint for Stocks that report emissions
Using the data set obtained in Table 2, the portfolio footprint for stocks that report emissions was
calculated as follows:
a) Stocks that either reported emissions were considered valid for this calculation. The carbon
footprint for each company was calculated as follows.
𝐶𝑜𝑚𝑝𝑎𝑛𝑦 𝐹𝑜𝑜𝑡𝑝𝑟𝑖𝑛𝑡 = 𝑀𝑎𝑥𝑖𝑚𝑢𝑚 (𝐶𝐷𝑃 𝑆𝑐𝑜𝑝𝑒 1 + 𝐶𝐷𝑃 𝑆𝑐𝑜𝑝𝑒 2, 𝑇𝑜𝑡𝑎𝑙 𝐺𝐻𝐺 𝐸𝑚𝑖𝑠𝑠𝑖𝑜𝑛𝑠)
Equation 2 Calculation of Company Footprint for Investee Companies Publicly Reporting Emissions
The maximum reported figure was taken since this gives the worst possible scenario. While the
reported figures for CDP and GHG were observed to be very close or identical in most cases,
there were occasional discrepancies. For example, Exxon Mobil (XOM US) reports both CDP and
GHG figures. The company’s total footprint in metric tons of CO2 equivalents was calculated as
follows:
𝐶𝑜𝑚𝑝𝑎𝑛𝑦 𝑓𝑜𝑜𝑡𝑝𝑟𝑖𝑛𝑡 𝑓𝑜𝑟 𝑋𝑂𝑀 𝑈𝑆 = 𝑀𝑎𝑥 (146,000,000; 126,000,000) 𝑚𝑡𝐶𝑂2𝑒
= 146,000,000 𝑚𝑡𝐶𝑂2𝑒
Portfolio Carbon Footprint for San Francisco State University Foundation
8
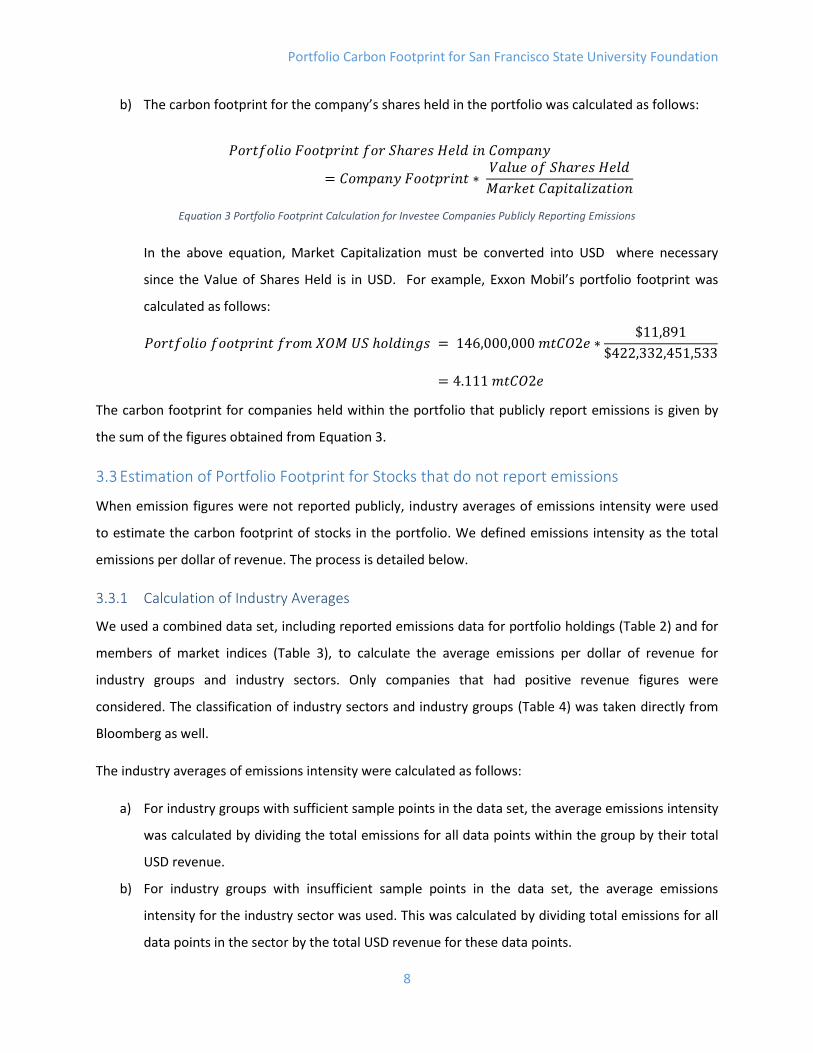
b) The carbon footprint for the company’s shares held in the portfolio was calculated as follows:
𝑃𝑜𝑟𝑡𝑓𝑜𝑙𝑖𝑜 𝐹𝑜𝑜𝑡𝑝𝑟𝑖𝑛𝑡 𝑓𝑜𝑟 𝑆ℎ𝑎𝑟𝑒𝑠 𝐻𝑒𝑙𝑑 𝑖𝑛 𝐶𝑜𝑚𝑝𝑎𝑛𝑦
= 𝐶𝑜𝑚𝑝𝑎𝑛𝑦 𝐹𝑜𝑜𝑡𝑝𝑟𝑖𝑛𝑡 ∗ 𝑉𝑎𝑙𝑢𝑒 𝑜𝑓 𝑆ℎ𝑎𝑟𝑒𝑠 𝐻𝑒𝑙𝑑
𝑀𝑎𝑟𝑘𝑒𝑡 𝐶𝑎𝑝𝑖𝑡𝑎𝑙𝑖𝑧𝑎𝑡𝑖𝑜𝑛
Equation 3 Portfolio Footprint Calculation for Investee Companies Publicly Reporting Emissions
In the above equation, Market Capitalization must be converted into USD where necessary
since the Value of Shares Held is in USD. For example, Exxon Mobil’s portfolio footprint was
calculated as follows:
𝑃𝑜𝑟𝑡𝑓𝑜𝑙𝑖𝑜 𝑓𝑜𝑜𝑡𝑝𝑟𝑖𝑛𝑡 𝑓𝑟𝑜𝑚 𝑋𝑂𝑀 𝑈𝑆 ℎ𝑜𝑙𝑑𝑖𝑛𝑔𝑠 = 146,000,000 𝑚𝑡𝐶𝑂2𝑒 ∗$11,891
$422,332,451,533
= 4.111 𝑚𝑡𝐶𝑂2𝑒
The carbon footprint for companies held within the portfolio that publicly report emissions is given by
the sum of the figures obtained from Equation 3.
3.3 Estimation of Portfolio Footprint for Stocks that do not report emissions
When emission figures were not reported publicly, industry averages of emissions intensity were used
to estimate the carbon footprint of stocks in the portfolio. We defined emissions intensity as the total
emissions per dollar of revenue. The process is detailed below.
3.3.1 Calculation of Industry Averages
We used a combined data set, including reported emissions data for portfolio holdings (Table 2) and for
members of market indices (Table 3), to calculate the average emissions per dollar of revenue for
industry groups and industry sectors. Only companies that had positive revenue figures were
considered. The classification of industry sectors and industry groups (Table 4) was taken directly from
Bloomberg as well.
The industry averages of emissions intensity were calculated as follows:
a) For industry groups with sufficient sample points in the data set, the average emissions intensity
was calculated by dividing the total emissions for all data points within the group by their total
USD revenue.
b) For industry groups with insufficient sample points in the data set, the average emissions
intensity for the industry sector was used. This was calculated by dividing total emissions for all
data points in the sector by the total USD revenue for these data points.
Portfolio Carbon Footprint for San Francisco State University Foundation
9
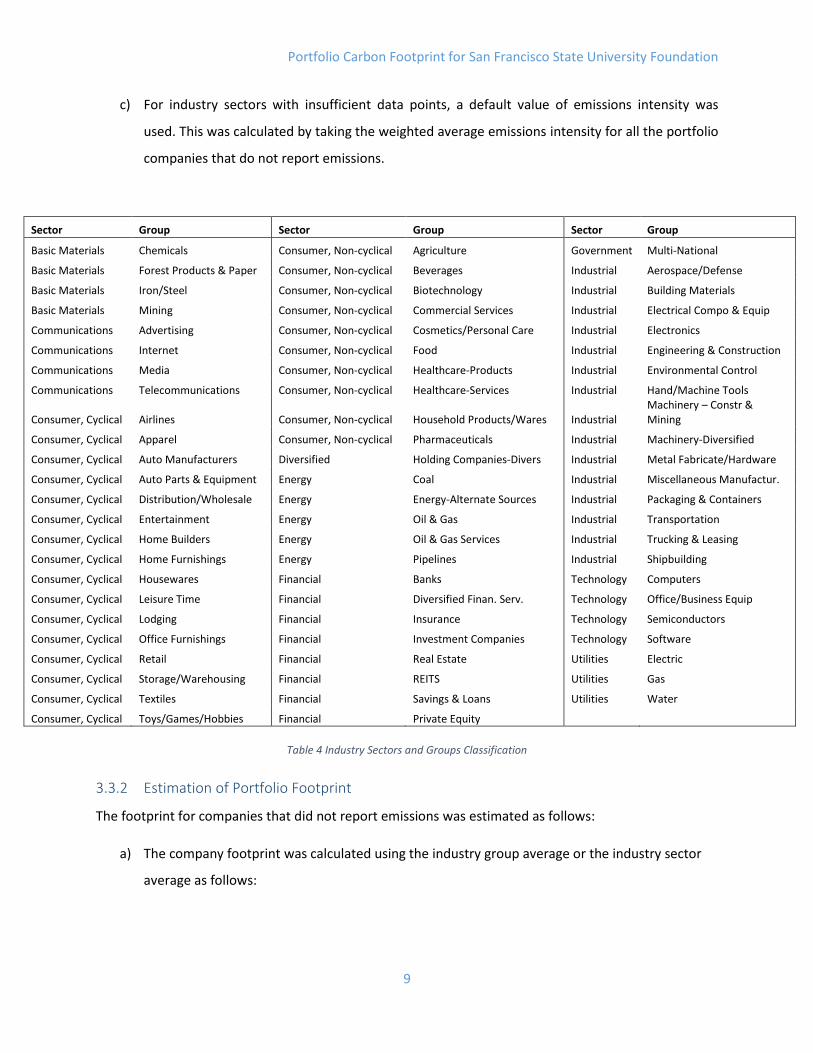
c) For industry sectors with insufficient data points, a default value of emissions intensity was
used. This was calculated by taking the weighted average emissions intensity for all the portfolio
companies that do not report emissions.
Sector Group Sector Group Sector Group
Basic Materials Chemicals Consumer, Non-cyclical Agriculture Government Multi-National
Basic Materials Forest Products & Paper Consumer, Non-cyclical Beverages Industrial Aerospace/Defense
Basic Materials Iron/Steel Consumer, Non-cyclical Biotechnology Industrial Building Materials
Basic Materials Mining Consumer, Non-cyclical Commercial Services Industrial Electrical Compo & Equip
Communications Advertising Consumer, Non-cyclical Cosmetics/Personal Care Industrial Electronics
Communications Internet Consumer, Non-cyclical Food Industrial Engineering & Construction
Communications Media Consumer, Non-cyclical Healthcare-Products Industrial Environmental Control
Communications Telecommunications Consumer, Non-cyclical Healthcare-Services Industrial Hand/Machine Tools
Consumer, Cyclical Airlines Consumer, Non-cyclical Household Products/Wares Industrial Machinery – Constr & Mining
Consumer, Cyclical Apparel Consumer, Non-cyclical Pharmaceuticals Industrial Machinery-Diversified
Consumer, Cyclical Auto Manufacturers Diversified Holding Companies-Divers Industrial Metal Fabricate/Hardware
Consumer, Cyclical Auto Parts & Equipment Energy Coal Industrial Miscellaneous Manufactur.
Consumer, Cyclical Distribution/Wholesale Energy Energy-Alternate Sources Industrial Packaging & Containers
Consumer, Cyclical Entertainment Energy Oil & Gas Industrial Transportation
Consumer, Cyclical Home Builders Energy Oil & Gas Services Industrial Trucking & Leasing
Consumer, Cyclical Home Furnishings Energy Pipelines Industrial Shipbuilding
Consumer, Cyclical Housewares Financial Banks Technology Computers
Consumer, Cyclical Leisure Time Financial Diversified Finan. Serv. Technology Office/Business Equip
Consumer, Cyclical Lodging Financial Insurance Technology Semiconductors
Consumer, Cyclical Office Furnishings Financial Investment Companies Technology Software
Consumer, Cyclical Retail Financial Real Estate Utilities Electric
Consumer, Cyclical Storage/Warehousing Financial REITS Utilities Gas
Consumer, Cyclical Textiles Financial Savings & Loans Utilities Water
Consumer, Cyclical Toys/Games/Hobbies Financial Private Equity
Table 4 Industry Sectors and Groups Classification
3.3.2 Estimation of Portfolio Footprint
The footprint for companies that did not report emissions was estimated as follows:
a) The company footprint was calculated using the industry group average or the industry sector
average as follows:

Portfolio Carbon Footprint for San Francisco State University Foundation
10
𝐸𝑠𝑡𝑖𝑚𝑎𝑡𝑒𝑑 𝐶𝑜𝑚𝑝𝑎𝑛𝑦 𝐹𝑜𝑜𝑡𝑝𝑟𝑖𝑛𝑡
= 𝐺𝑟𝑜𝑢𝑝 (𝑜𝑟 𝑆𝑒𝑐𝑡𝑜𝑟) 𝐴𝑣𝑒𝑟𝑎𝑔𝑒 𝑜𝑓 𝐸𝑚𝑖𝑠𝑠𝑖𝑜𝑛𝑠 𝑝𝑒𝑟 𝐷𝑜𝑙𝑙𝑎𝑟 𝑅𝑒𝑣𝑒𝑛𝑢𝑒
∗ 𝑅𝑒𝑣𝑒𝑛𝑢𝑒 𝑜𝑓𝐶𝑜𝑚𝑝𝑎𝑛𝑦
Equation 4 Estimation of Company Footprint using Industry Averages
For example, the company footprint for China Mobile Limited (CHL US) was estimated as
follows:
𝐸𝑠𝑡𝑖𝑚𝑎𝑡𝑒𝑑 𝑐𝑜𝑚𝑝𝑎𝑛𝑦 𝑓𝑜𝑜𝑡𝑝𝑟𝑖𝑛𝑡 𝑓𝑜𝑟 𝐶𝐻𝐿 𝑈𝑆
= 𝐸𝑚𝑖𝑠𝑠𝑖𝑜𝑛𝑠 𝑝𝑒𝑟 $ 𝑅𝑒𝑣𝑒𝑛𝑢𝑒 𝑓𝑜𝑟 𝑇𝑒𝑙𝑒𝑐𝑜𝑚𝑚𝑢𝑛𝑖𝑐𝑎𝑡𝑖𝑜𝑛𝑠 𝐼𝑛𝑑𝑢𝑠𝑡𝑟𝑦 𝐺𝑟𝑜𝑢𝑝
∗ 𝑅𝑒𝑣𝑒𝑛𝑢𝑒 𝑜𝑓 𝐶𝐻𝐿 𝑈𝑆
= 0.000052 𝑚𝑡𝐶𝑂2𝑒/$ ∗ $100,828,320,000
= 5,289,624 𝑚𝑡𝐶𝑂2𝑒
b) The footprint of individual portfolio holdings is calculated using Equation 3 in Section 3.2.
𝑃𝑜𝑟𝑡𝑓𝑜𝑙𝑖𝑜 𝑓𝑜𝑜𝑡𝑝𝑟𝑖𝑛𝑡 𝑓𝑟𝑜𝑚 𝐶𝐻𝐿 𝑈𝑆 ℎ𝑜𝑙𝑑𝑖𝑛𝑔𝑠 = 5,289,624 𝑚𝑡𝐶𝑂2𝑒 ∗$88,355
$243,659,138,503
= 1.918 𝑚𝑡𝐶𝑂2𝑒
c) For investee companies that did not have revenue data or market capitalization data, manual
estimations were used where possible. The remaining companies were ignored in the
calculation as they represented a negligible portion of the portfolio.
d) The sum of all estimations from part (b) and (c) above gives the total carbon footprint from
portfolio companies that do not report emissions.
3.4 Carbon Footprint of Portfolio
We calculated the total carbon footprint of the equity portfolio by taking the sum of calculated
emissions from Part 3.2 and the estimated emissions from Part 3.3.
3.5 Comparison with a Benchmark
The steps above can be repeated for the constituents of a benchmark index, such as the S&P500 index,
for comparison.

Portfolio Carbon Footprint for San Francisco State University Foundation
11
4. Limitations of the Method
There are several limitations to this methodology. The most prominent of these are listed below:
a) The portfolio used for this calculation only contains equities in the custody of UBS and does not
give a complete carbon footprint of the Foundation’s equity holdings.
b) Variables like stock prices, foreign exchange rates and ETF member weights were captured on a
specific day. Variations in these figures can cause variations in the final carbon footprint figure.
c) The standards used by companies that report emissions are not uniform. Even though the
figures used conform to standards approved by the Carbon Disclosure Project, verifying the
comparability of these standards was outside the scope of this exercise.
d) Many companies did not Scope 3 figures. Therefore, the emissions figures for these companies
may be understated. This can have a significant impact for companies where substantial
emissions occur in upstream and downstream activities.
e) The method of taking industry averages provides a rough approximate. The accuracy of this
approximation can be improved by considering additional factors such as country of domicile,
countries of operation, product lines, etc.
5. Conclusion
The carbon footprint exercise was undertaken with the view to better understand the carbon risk in the
portfolio. However, portfolio carbon footprints cannot be used in isolation to guide investment or
divestment decisions, due to limited data availability. Furthermore, a carbon footprint does not
differentiate between emissions created to manufacture a solar panel versus emissions created to
manufacture oil pipelines. Therefore, such an analysis must be juxtaposed against other factors in order
to guide decision making.

Portfolio Carbon Footprint for San Francisco State University Foundation
12
6. Bibliography
Bloomberg L. P. (2014)
CDP Worldwide. (2015). Catalyzing business and government action. Retrieved from Carbon Disclosure
Project Web site: https://www.cdp.net/en-US/Pages/About-Us.aspx
SF State Foundation. (2013). Resolution Regarding Fossil Fuel Divestment. San Francisco.
The Greenhouse Gas Protocol. (2012). About. Retrieved from The Greenhouse Gas Protocol Web site:
http://www.ghgprotocol.org/about-ghgp
The Greenhouse Gas Protocol. (2012). FAQ. Retrieved from The Greenhouse Gas Protocol Web site:
http://www.ghgprotocol.org/calculation-tools/faq
UNEP FI Climate Change Advisory Group and Investment Commission. (2013, July). Portfolio Carbon.
Retrieved from United Nations Environment Programme Finance Initiative:
http://www.unepfi.org/fileadmin/documents/UNEP_FI_Investor_Briefing_Portfolio_Carbon.pdf
United States Environmental Protection Agency. (2013, September 9). Glossary of Climate Change
Terms. Retrieved from United States Environmental Protection Agency Web site:
http://www.epa.gov/climatechange/glossary.html

Portfolio Carbon Footprint for San Francisco State University Foundation
13
7. List of Tables and Equations
Table 1 Equity Portion of Portfolio includes Equities and Equities ETF/fund ............................................... 5
Table 2 Bloomberg data set for Equities in Portfolio .................................................................................... 6
Table 3 Bloomberg data set for Market Indices used in Industry Average calculation ................................ 7
Table 4 Industry Sectors and Groups Classification ...................................................................................... 9
Equation 1 Conversion of ETF holdings to individual equity holdings .......................................................... 5
Equation 2 Calculation of Company Footprint for Investee Companies Publicly Reporting Emissions........ 7
Equation 3 Portfolio Footprint Calculation for Investee Companies Publicly Reporting Emissions ............. 8
Equation 4 Estimation of Company Footprint using Industry Averages ..................................................... 10