Porosity of Permeable Friction Courses (PFC)
16
Porosity of Permeable Friction Courses (PFC) Brandon Klenzendorf April 28, 2009 CE 397 – Statistics in Water Resources
-
Upload
felicia-goodman -
Category
Documents
-
view
27 -
download
2
description
Porosity of Permeable Friction Courses (PFC). Brandon Klenzendorf April 28, 2009 CE 397 – Statistics in Water Resources. PFC Introduction. Layer of porous asphalt 1 to 2 inches thick over impervious roadway surface Water enters pore space and provides benefits : Reduced splash/spray - PowerPoint PPT Presentation
Transcript of Porosity of Permeable Friction Courses (PFC)

Porosity of Permeable Friction
Courses (PFC)Brandon Klenzendorf
April 28, 2009CE 397 – Statistics in Water Resources

Layer of porous asphalt 1 to 2 inches thick over impervious roadway surface
Water enters pore space and provides benefits:◦ Reduced splash/spray◦ Improved traction◦ Reduced hydroplaning◦ Improved water quality
Pores become clogged with sediment over time resulting in a loss of porosity
Can we predict the extent of clogging over time?
PFC Introduction
Conventional Asphalt
PFC Overlay

PFC cores are extracted from three roadways for the past three years:◦ Loop 360◦ FM 1431◦ FM 620◦ March 2007◦ February 2008◦ February 2009
PFC Cores
PFC layer

33 total porosity measurements
Porosity Data
10
12
14
16
18
20
22
24
2006 2007 2008 2009 2010
Poro
sity
(%)
Year
Loop 360
FM 1431
FM 620
10
12
14
16
18
20
22
24
2006 2007 2008 2009 2010
Poro
sity
(%)
Year
Loop 360
FM 1431
FM 620

Kruskall-Wallis Test◦ H0: all groups have identical distributions
◦ Reject H0 if K ≥ Kα (from tables)
Mann-Whitney Test (Rank Sum Test)◦ H0: the means of two groups are identical
◦ Reject H0 if T ≤ Tα/2 (from tables)
Statistical Tests
3
1
2
2
1
1
12
jjj
NRn
NNK
jn
iij
jj Rn
R1
1
n
iiRT
1
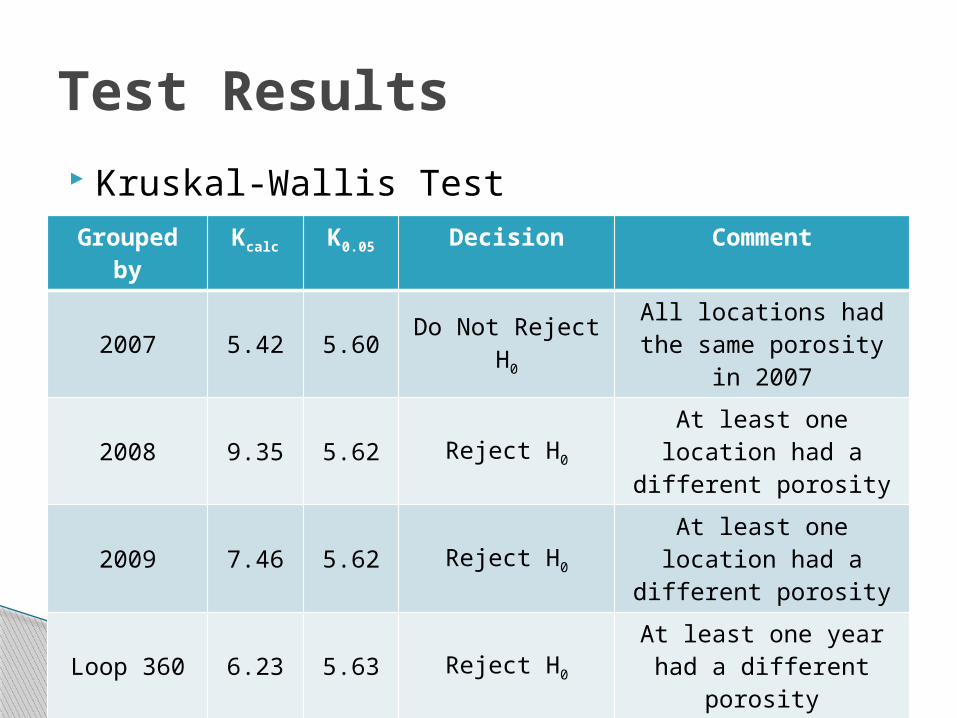
Kruskal-Wallis Test
Test Results
Grouped by
Kcalc K0.05 Decision Comment
2007 5.42 5.60Do Not Reject
H0
All locations had the same porosity in 2007
2008 9.35 5.62 Reject H0
At least one location had a different
porosity
2009 7.46 5.62 Reject H0
At least one location had a different
porosity
Loop 360 6.23 5.63 Reject H0At least one year had a different porosity
FM 1431 5.60 5.60 Reject H0At least one year had a different porosity
FM 620 5.96 5.60 Reject H0At least one year had a different porosity

Compare two years of Loop 360 porosity◦ Mann-Whitney Test
Extend this analysis to the other roadways Extend this analysis to individual years
Test Results
Grouped by
Statistic
Critical
Decision Comment
‘07 & ‘08 T=16 7.0Do Not
Reject H0
2007 and 2008 had the same porosity
‘08 & ’09 T=26 27.0 Reject H02008 and 2009 had different porosities
‘07 & ‘09 T=23 23.0 Reject H02007 and 2009 had different porosities

Multiple variables can influence PFC porosity◦ Life of pavement◦ Traffic volume◦ Precipitation◦ Roadway geometry (slope, width, etc.)◦ Nearby construction sites, etc.
Only consider first four variables
Trends in Porosity

Estimate annual average daily traffic (AADT)
Linear regression from 16 years of data
Traffic Volume

LCRA Hydromet data for Loop 360 and FM 1431 Need to find precipitation data for FM 620
Precipitation
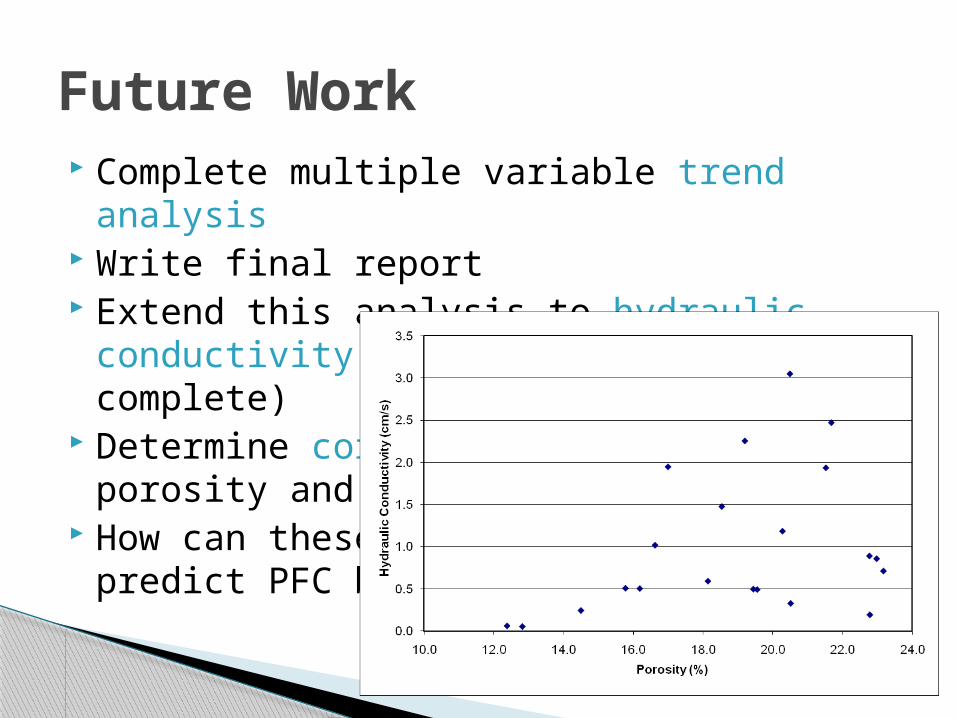
Complete multiple variable trend analysis Write final report Extend this analysis to hydraulic
conductivity data (data set not complete) Determine correlation between porosity and
hydraulic conductivity How can these measurements be used to
predict PFC benefits (water quality)?
Future Work

Questions or Comments?

This slide intentionally left blank

PFC Introduction Porosity Data Statistical Tests
◦ Kruskall-Wallis Test◦ Mann-Whitney Test
Test Results Trend Analysis Future Work
Outline

Compare porosity in travel lane to shoulder on Loop 360◦ Both Kruskal-Wallis test and Mann-Whitney test
Test Results
Grouped by
Statistic
Critical
Decision Comment
Travel Lane K=4.27 5.60Do Not
Reject H0
All years had the same porosity in the travel
lane
Shoulder T=7 6.0Do Not
Reject H0
All years had the same porosity in the shoulder
Comparison T=49 32.0
Do Not Reject H0
No difference between travel lane and shoulder
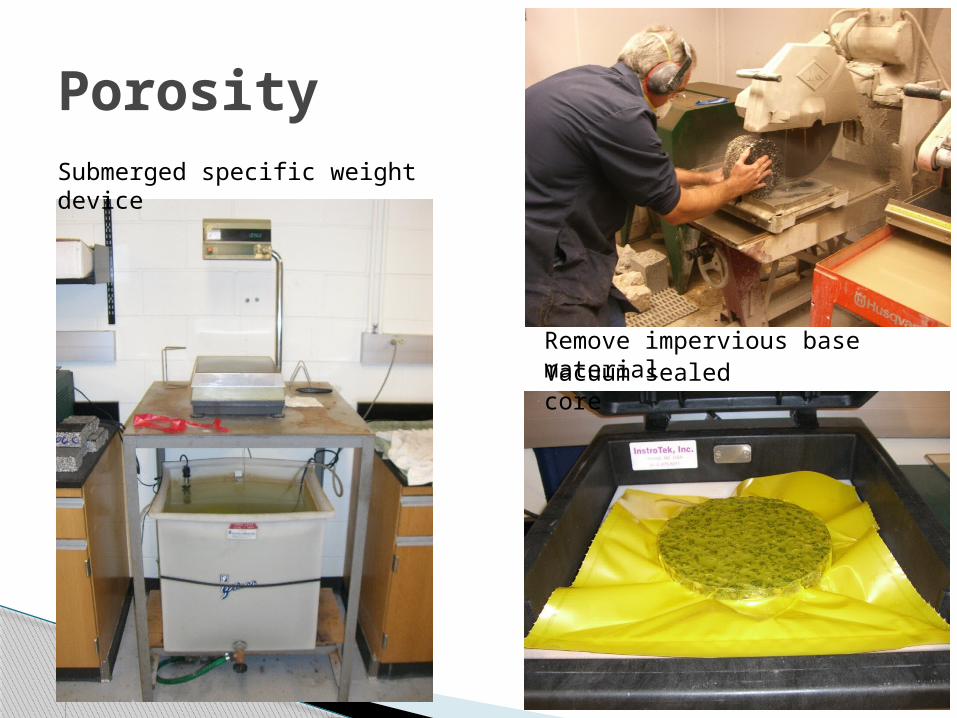
Porosity
Remove impervious base materialVacuum sealed core
Submerged specific weight device