
Population typing of the causal agent of cassava bacterial...
14
RESEARCH ARTICLE Open Access Population typing of the causal agent of cassava bacterial blight in the Eastern Plains of Colombia using two types of molecular markers César A Trujillo 1 , Nathalia Arias-Rojas 2 , Lucie Poulin 2 , César A Medina 1 , Anibal Tapiero 3 , Silvia Restrepo 1 , Ralf Koebnik 2 and Adriana J Bernal 1* Abstract Background: Molecular typing of pathogen populations is an important tool for the development of effective strategies for disease control. Diverse molecular markers have been used to characterize populations of Xanthomonas axonopodis pv. manihotis (Xam), the main bacterial pathogen of cassava. Recently, diversity and population dynamics of Xam in the Colombian Caribbean coast were estimated using AFLPs, where populations were found to be dynamic, diverse and with haplotypes unstable across time. Aiming to examine the current state of pathogen populations located in the Colombian Eastern Plains, we also used AFLP markers and we evaluated the usefulness of Variable Number Tandem Repeats (VNTRs) as new molecular markers for the study of Xam populations. Results: The population analyses showed that AFLP and VNTR provide a detailed and congruent description of Xam populations from the Colombian Eastern Plains. These two typing strategies clearly separated strains from the Colombian Eastern Plains into distinct populations probably because of geographical distance. Although the majority of analyses were congruent between typing markers, fewer VNTRs were needed to detect a higher number of genetic populations of the pathogen as well as a higher genetic flow among sampled locations than those detected by AFLPs. Conclusions: This study shows the advantages of VNTRs over AFLPs in the surveillance of pathogen populations and suggests the implementation of VNTRs in studies that involve large numbers of Xam isolates in order to obtain a more detailed overview of the pathogen to improve the strategies for disease control. Keywords: Xanthomonas axonopodis pv. manihotis, Population dynamics, Molecular markers, Plant pathology Background In order to generate effective mechanisms for the control of plant diseases, it is crucial to gain insights into the diversity and population dynamics of plant pathogens [1,2]. Pathogens showing a high genotypic diversity are regarded as being harder to control, be- cause plant resistance can be overcome by more suit- able pathotypes [3]. Hence, the development of durable resistance becomes more challenging with this kind of pathogens. Factors such as the genetic flow between pathogen populations and processes that increase the genetic changes of these populations may contribute to break the resistance in monocultures [3-5]. Xanthomonas axonopodis pv. manihotis (Xam) is the causal agent of cassava bacterial blight disease (CBB), the most important bacterial disease of cassava. The most common symptoms of CBB are angular leaf spots, stem exudates, cankers, blight, wilt and dieback [6,7]. Xam is an example of a pathogen that presents diverse degrees of variability in different geographical zones and interesting population processes, including genetic flow and instability of populations in different geographical regions [7-10]. Xam populations have been characterized in different countries in South America and Africa, start- ing in the 1980s. These studies showed that the South American populations were more diverse than those * Correspondence: [email protected] 1 Laboratorio de Micología y Fitopatología Uniandes (LAMFU), Universidad de Los Andes, Bogotá, Colombia Full list of author information is available at the end of the article © 2014 Trujillo et al.; licensee BioMed Central Ltd. This is an Open Access article distributed under the terms of the Creative Commons Attribution License (http://creativecommons.org/licenses/by/2.0), which permits unrestricted use, distribution, and reproduction in any medium, provided the original work is properly credited. The Creative Commons Public Domain Dedication waiver (http://creativecommons.org/publicdomain/zero/1.0/) applies to the data made available in this article, unless otherwise stated. Trujillo et al. BMC Microbiology 2014, 14:161 http://www.biomedcentral.com/1471-2180/14/161
Transcript of Population typing of the causal agent of cassava bacterial...
Trujillo et al. BMC Microbiology 2014, 14:161http://www.biomedcentral.com/1471-2180/14/161
RESEARCH ARTICLE Open Access
Population typing of the causal agent of cassavabacterial blight in the Eastern Plains of Colombiausing two types of molecular markersCésar A Trujillo1, Nathalia Arias-Rojas2, Lucie Poulin2, César A Medina1, Anibal Tapiero3, Silvia Restrepo1,Ralf Koebnik2 and Adriana J Bernal1*
Abstract
Background: Molecular typing of pathogen populations is an important tool for the development of effectivestrategies for disease control. Diverse molecular markers have been used to characterize populations of Xanthomonasaxonopodis pv. manihotis (Xam), the main bacterial pathogen of cassava. Recently, diversity and population dynamicsof Xam in the Colombian Caribbean coast were estimated using AFLPs, where populations were found to be dynamic,diverse and with haplotypes unstable across time. Aiming to examine the current state of pathogen populationslocated in the Colombian Eastern Plains, we also used AFLP markers and we evaluated the usefulness of VariableNumber Tandem Repeats (VNTRs) as new molecular markers for the study of Xam populations.
Results: The population analyses showed that AFLP and VNTR provide a detailed and congruent description ofXam populations from the Colombian Eastern Plains. These two typing strategies clearly separated strains fromthe Colombian Eastern Plains into distinct populations probably because of geographical distance. Although themajority of analyses were congruent between typing markers, fewer VNTRs were needed to detect a highernumber of genetic populations of the pathogen as well as a higher genetic flow among sampled locations thanthose detected by AFLPs.
Conclusions: This study shows the advantages of VNTRs over AFLPs in the surveillance of pathogen populationsand suggests the implementation of VNTRs in studies that involve large numbers of Xam isolates in order to obtain amore detailed overview of the pathogen to improve the strategies for disease control.
Keywords: Xanthomonas axonopodis pv. manihotis, Population dynamics, Molecular markers, Plant pathology
BackgroundIn order to generate effective mechanisms for thecontrol of plant diseases, it is crucial to gain insightsinto the diversity and population dynamics of plantpathogens [1,2]. Pathogens showing a high genotypicdiversity are regarded as being harder to control, be-cause plant resistance can be overcome by more suit-able pathotypes [3]. Hence, the development of durableresistance becomes more challenging with this kind ofpathogens. Factors such as the genetic flow betweenpathogen populations and processes that increase the
* Correspondence: [email protected] de Micología y Fitopatología Uniandes (LAMFU), Universidad deLos Andes, Bogotá, ColombiaFull list of author information is available at the end of the article
© 2014 Trujillo et al.; licensee BioMed CentralCommons Attribution License (http://creativecreproduction in any medium, provided the orDedication waiver (http://creativecommons.orunless otherwise stated.
genetic changes of these populations may contribute tobreak the resistance in monocultures [3-5].Xanthomonas axonopodis pv. manihotis (Xam) is the
causal agent of cassava bacterial blight disease (CBB),the most important bacterial disease of cassava. Themost common symptoms of CBB are angular leaf spots,stem exudates, cankers, blight, wilt and dieback [6,7].Xam is an example of a pathogen that presents diversedegrees of variability in different geographical zones andinteresting population processes, including genetic flowand instability of populations in different geographicalregions [7-10]. Xam populations have been characterizedin different countries in South America and Africa, start-ing in the 1980s. These studies showed that the SouthAmerican populations were more diverse than those
Ltd. This is an Open Access article distributed under the terms of the Creativeommons.org/licenses/by/2.0), which permits unrestricted use, distribution, andiginal work is properly credited. The Creative Commons Public Domaing/publicdomain/zero/1.0/) applies to the data made available in this article,

Trujillo et al. BMC Microbiology 2014, 14:161 Page 2 of 14http://www.biomedcentral.com/1471-2180/14/161
from Africa [9,11-14]. Particularly, Xam populationsfrom Colombia were classified as highly diverse andshowed significant levels of genetic flow between them,in spite of their distant geographical origins in the coun-try [8,9,14]. In the 1990s, Xam populations were mainlystudied in three regions of Colombia: the Caribbeanregion, the Eastern Plains and the province of Cauca[8,9,14]. These studies showed that Xam populationsfrom the Caribbean and Eastern Plains were dynamicand presented a higher genetic diversity when comparedwith populations from Cauca [8,9,14]. Recently, wemonitored populations of the pathogen in the Caribbeanregion, where three cassava varieties are intensively andextensively cultivated. These studies were performedusing AFLPs and sequences of genes coding for TypeThree Effectors proteins (T3Es). In the Caribbean, wecommonly found a lack of genetic differentiation amongthe sampled locations, as a result of potential genotypeflow promoted by the exchange of propagative materialinfected with Xam. Additionally, we identified thatCaribbean populations change rapidly over time, sinceit was already possible to establish a temporal differenti-ation compared to the populations characterized byRestrepo and collaborators in the 1990s [8,15]. Despite therelevance of a constant monitoring of pathogen popula-tions, only those from the Caribbean have being recentlystudied [15]. However, it is pertinent to characterizepopulations outside of the studied regions and to estab-lish their dynamics and to which extent those dynamicsmay have an impact on the crop.A number of different molecular markers have been
implemented for Xam population studies. These includeRestriction Fragment Length polymorphisms (RFLPs),Enterobacterial Repetitive Intergenic Consensus-PCR(ERIC-PCR) and Amplified Fragment Length Polymor-phisms (AFLPs) [12,14,16]. Nevertheless, the most usefulmarkers for population typing of this pathogen areAFLPs [8,10,16]. This is due to their high discriminatorypower, when compared to other types of markers previ-ously used, such as RFLPs [16]. However, traditionalAFLPs are a time-consuming technique. In addition, it isdifficult to standardize the protocols between laborator-ies because band patterns are not easily coded and theprocess can become subjective [17,18]. Recently, othertyping techniques have been developed to reduce thestandardization time, as well as to reduce the time andcost required to obtain the results [17,19]. One of thesetechniques is based on the sequencing of Variable NumberTandem Repeat (VNTR) loci, which detect polymor-phisms in tandem repeats in a given genome and havebeen important to obtain informative markers [20,21].VNTRs were implemented more than a decade ago tocharacterize highly monomorphic human and animalpathogens such as Mycobacterium tuberculosis [22,23],
Bacillus anthracis [24] and Staphylococcus aureus [25].More recently, VNTRs have been implemented to analyzethe population genetics and diversity of plant pathogenssuch as Xylella fastidiosa [26], Xanthomonas citri pv. citri[27], Ralstonia solanacearum [28], and the bacterial ricepathogen Xanthomonas oryzae pv. oryzicola [29]. VNTRshave allowed to uncover variability that was not detectedusing other molecular markers [30,31]. An additionaladvantage of VNTRs compared to other typing tech-niques is the reduction in costs, which is given by thefollowing factors: first of all, a DNA extraction proced-ure is often not required because VNTRs can be easilyamplified from bacterial colonies. Secondly, the ampli-fication and detection does not require specializedequipment and reagents [21]. Finally, the reduction inthe sequencing cost allows the analyses of a highernumber of loci and samples, with at a reasonably lowcost [17,19]. All these advantages make VNTRs promis-ing molecular markers to study populations of Xamwhen cost is a limiting factor and when the access toespecialized laboratory equipment is restricted.The aim of this study was to evaluate the diversity
of current Xam populations in the Eastern Plains ofColombia using two types of neutral molecular markers.The Eastern Plains is the second most important regionfor cassava cultivation in Colombia. In contrast to theCaribbean cassava fields, Eastern Plains fields are consid-erably small and their growers are not commerciallyallied for trading of their produce. In this study, weisolated strains from cassava fields located at the prov-inces of Meta and Casanare, located at the EasternPlains of Colombia, from 2011 to 2012. The collectedisolates were typed using both AFLPs and VNTRsmarkers. This study highlights the usefulness of VNTRmarkers for characterizing populations of Xam. Thisstudy provides an updated distribution of distinct popu-lations of Xam in the Eastern Plains of Colombia.
MethodsSampling and bacterial isolationCassava crops in the Meta and Casanare provinces ofColombia were sampled from 2011 to 2012 (Figure 1).In Meta, local fields at La Libertad, Granada and Fuentede Oro were visited during 2011. In Casanare, fields nearOrocué were sampled in 2012. Sampling was conductedin diagonal transects in three to four fields in eachlocation. Leaves with characteristic CBB symptomswere collected for bacterial isolation. The number ofcollected samples was dependent on the disease inci-dence in each field.For isolation of the bacterium, a 1 cm-diameter leaf
disk with infected and healthy tissue was obtained fromeach sample. The disk was disinfected with 1% hypo-chlorite and washed in sterile water three times. The

Figure 1 Sampling zones in the Eastern Plains of Colombia. Sampling zones were selected between provinces of Meta and Casanare. Shadedareas in the map represent sampled locations.
Trujillo et al. BMC Microbiology 2014, 14:161 Page 3 of 14http://www.biomedcentral.com/1471-2180/14/161
tissue was ground in 200 μl of 10 mM MgCl2 and two1:10 serial dilutions were performed. A total of 100 μl ofeach dilution were plated onto LPGA medium (5 g yeastextract, 5 g dextrose, 5 g Peptone and 15 g agar wereused per liter of distilled water) and then incubated at28°C for 48 h. White, viscous bacterial colonies, typical ofXam were found in high populations in all plates comingfrom symptomatic tissue. These were confirmed as Xamusing primers directed to the C-terminus of the genecoding for PthB, now called TALE1Xam [32] (Additionalfile 1), which is located in the plasmid p44. This regionis widely distributed in Xam strains and it has beenimplemented for Xam identification [33]. A singlecolony from each sample was selected to be preservedin 30% glycerol at −80°C. In addition, ten Xam strains,which represented the genetic diversity of the pathogenin the 1990s in the Colombian Eastern Plains, wereused as reference strains. Reference strains were kindlyprovided by Dr. Valérie Verdier from IRD (Institut derecherche pour le développement, Montpellier, France).
DNA extraction and amplificationXam isolates were grown overnight in 5 ml of liquid Phi(Φ) medium (10 g yeast extract, 5 g dextrose and 5 gCasaminoacids per liter of distilled water) at 220 rpmand 28°C. Total DNA was obtained using the PureLink™genomic DNA mini kit according to the manufacturerinstructions (Invitrogen, Carlsbad, CA, USA). The DNAquality was checked in 0.8% agarose gel electrophoresis,and it was quantified using a NanoDrop spectophot-ometer ND1000 (Nanodrop Technologies, Wilmington,DE, USA).
Genotyping with AFLPsTwo hundred nanograms of total DNA from each isolatewere digested with the restriction enzymes EcoRI andMseI to generate the AFLPs [34], using the AFLPs CoreKit for microorganisms from Invitrogen Corporation,as recommended by the manufacturer (Invitrogen, CA,USA). The following modifications were implementedfor the current study: each restricted product was
Trujillo et al. BMC Microbiology 2014, 14:161 Page 4 of 14http://www.biomedcentral.com/1471-2180/14/161
diluted 1:10 and used as template for non-selective PCRamplification with primers MseI + 0/EcoRI + 0. The ther-mal profile used was: 20 cycles at 94°C for 30 sec; 56°C for60 sec; 72°C for 60 sec. A 1:25 dilution of the PCR productwas used as template for the selective amplification withfour primer combinations (EcoRI + T/MseI + T, EcoRI + T/MseI + A EcoRI + G/MseI + A and EcoRI + C/MseI + A)(Additional file 1). The thermal profile for the selectiveamplifications was: one cycle at 94°C for 30 sec; 65°Cfor 30 sec; and 72°C for 60 sec, and 12 cycles with atouch-down in the annealing temperature of 0.7°C percycle. Finally, 23 cycles were conducted at 94°C for30 sec, 56°C for 30 sec and 72°C for 60 sec. Selectivelyamplified products were separated on 6% polyacryl-amide gel (19:1 acrylamide:bisacrylamide; 7.5 M Urea;1× TBE buffer) at 3000 V, 40 mA for 1 hour and 40 minuteson a vertical polyacrylamide electrophoresis apparatus.Every sample was run twice to verify AFLP reproduci-bility. AFLP bands were detected with silver staining.Polymorphic bands were then scored as either present(1) or absent (0) on a presence/absence matrix. Onlystrong bands were included in the matrix.
Selection and evaluation of VNTRsVNTR loci were selected according to the Hunter-Gastondiscriminatory index (HGDI) [35], which was previouslyevaluated among 65 genomes of Xam [36]. Loci withHGDI scores higher than 0.6, such as, XaG1_02, XaG1_29,XaG2_52, XaG1_67 and XaG1_73 were selected to beamplified from Xam isolates. The primers used for PCRamplification were those reported by Arrieta et al., [36].VNTR loci were amplified either from genomic DNA
or from a fresh bacterial colony. Each PCR reaction con-tained 10-50 ng of genomic DNA, 2.5 mM MgCl2,3 mM PCR primers, 1.3 mM dNTPs and 1 unit of TaqDNA polymerase (Fermentas, USA). Thermal profile wasconducted as follows: 3 min at 95°C, 35 cycles consistingof 20 sec at 95°C, 30 sec at 52–58°C, and 60 sec at 72°C,with a final extension step at 72°C for 10 min. When abacterial colony was used as the direct source of thetemplate, an additional step of 95°C for 10 min at thebeginning of the thermal profile was added. Amplifiedproducts were separated on 1% agarose gels and thensequenced using the primers listed in the Additional file 1.Sequences were aligned using MUSCLE [37] and then
numbers of complete repeats were calculated from mul-tiple alignments. The number of repeats at each locusfor every strain was recorded in a matrix.
Data analysisMolecular Variance Analysis (AMOVA) was conductedto determine genetic differentiation among sampledprovinces estimating the genetic differentiation amongpopulation value (ΦPT) with 1000 permutations using
GenAlEx 6.5 [38]. Then, genetic Euclidean distancesamong sampled locations were calculated in GenoDive2.0b20 [39]. To visualize the dissimilarities among theisolates, a Principal Coordinates Analysis (PCoA) wasalso carried out using GenAlEx 6.5 [38]. Once the dis-similarities among isolates were confirmed, isolateswere clustered in an unrooted distance tree with theNeighbor-Joining algorithm in SplitsTree version 4.12.3[40]. Branch supports were determined running 1000bootstrap replicates. Then, current isolates were assignedinto genetic populations using a clustering algorithmbased on Bayesian model in STRUCTURE 2.3.3 [41]without prior population information. Genetic clustersof the isolates were generated with independent allelefrequencies and five thousand replicates during burningperiod and 100.000 Monte Carlo Markov chain (MCMC)iterations. Iterations were performed from 1 to 10 clusters(K) and then the optimal number of clusters was deter-mined according to Evanno et al. [42]. FST values [43] fromthe optimal number of clusters were recorded. A Manteltest was performed with 999 permutations using GenAlEx6.5 [38] to confirm if the clustering pattern was correlatedwith geographical distances of sampled locations.Isolates were then classified into haplotypes, which
were established with an infinite allele model and athreshold of 0 using GenoDive 2.0b20 [39]. The clonaldiversity at each location was estimated implementing thecorrected Nei and Shannon indices in GenoDive 2.0b20.Assigned haplotypes were split in a Minimum SpanningNetwork using BioNumerics software (version 7.1) createdby Applied Maths NV (Available from http://www.applied-maths.com).
ResultsA large number of isolates was obtained from cassavaproducing areas in the Eastern Plains of ColombiaA total of 101 isolates were collected at four locations inthe Eastern Plains of Colombia. From these, 47 isolateswere collected in La Libertad (Meta) from an experi-mental field that contained 96 representative cassavaaccessions from the Eastern Plains. The experimentalfield was visited with permission of the InternationalCenter for Tropical Agriculture (CIAT). In contrast,other sampled locations presented one or a maximum oftwo cassava varieties per field. Commercial field crops atGranada and Fuente de Oro (Meta) presented a compara-tively low number of samples with typical CBB symptoms.Only three isolates were obtained from Granada and oneisolate was obtained from Fuente de Oro. In addition,50 Xam isolates were obtained from four fields locatedin Orocué in the province of Casanare. Samples collectedin Orocué came from small plots where cassava is culti-vated for self-consumption of smallholder farmers, incontrast to the fields visited in the other locations.
Trujillo et al. BMC Microbiology 2014, 14:161 Page 5 of 14http://www.biomedcentral.com/1471-2180/14/161
AFLP and VNTR markers showed reproducible bandpatternsOne-hundred and one isolates and ten reference strainswere characterized by both AFLP and VNTR markers.The characterization with AFLPs was performed withfour combinations of selective primer pairs. AFLP bandpatterns obtained with selective amplifications wereclear to read after detection with silver staining. A totalof 57 polymorphic bands were generated when primercombinations EcoRI + T/MseI + T, EcoRI + T/MseI + Aand EcoRI + C/MseI + A were used. Primer combinationEcoRI + G/MseI + A did not produce polymorphic bandsamong the evaluated isolates. AFLP selective amplifica-tions were run twice for each isolate. Band patternswere consistent between replicates.Xam isolates were also characterized using five VNTR
loci. PCR amplicons of VNTRs were strong and highlyreproducible. Sequencing of VNTR loci showed that thenumber of alleles per locus ranged from 7 to 17 (Table 1).Locus G1_29 was the most polymorphic VNTR with 17different alleles, ranging from 1 to 23 repeats (Table 1). Thedata sets supporting the results of this article are availablein the GenBank database (Accession numbers XaG1_02:KJ736838 - KJ736944; XaG1_29: KJ736945 - KJ737053;XaG2_52: KJ737163 - KJ737268; XaG1_67: KJ737269 -KJ737369; XaG1_73: KJ737054 - KJ737162) and in the DryadDigital Repository: http://doi.org/10.5061/dryad.t173v.
Xam populations presented a genetic differentiationamong locations in the Eastern PlainsIn order to confirm if there was genetic differentiationamong sampled locations, an AMOVA was conducted.ΦPT values showed a statistically significant genetic dif-ferentiation between each pair of locations (Table 2).The differentiation was evidenced using both types ofmolecular markers. Similar proportions of genetic vari-ation were obtained when comparisons between loca-tions and within locations were performed using AFLPs.However, 80% of the genetic variation was distributedwithin the sampled locations when isolates were charac-terized by VNTRs. Furthermore, PCoA analysis showedthat AFLPs allowed the detection of a more contrastingdifferentiation among isolates with different geographicalorigins (Figure 2). VNTRs also permitted an evident
Table 1 Characteristics of VNTR loci evaluated in Xam isolates
VNTR locus Repeat Number of different alleles
G1_02 TCCCCAT 7
G1_29 ATCCCGA 17
G1_52 CCGCCACAACGCA 7
G1_67 CGACAC 14
G1_73 GGTCAT 8
VNTR loci were selected according to discriminant index reported by Arrieta and co
differentiation, but a partial overlapping of isolates fromLa Libertad and Orocué was observed. However, ap-proximately 75% of the variation among isolates was ex-plained with the first three coordinates of the analysisfor both markers (Figure 2).
The genetic population structure of Xam was correlatedwith the geographical origin of isolates in the EasternPlains of ColombiaDistance trees were constructed using AFLP and VNTRdata to determine how genetic distances were distributedamong current isolates and reference strains (Figure 3).Tree topologies showed a generalized clustering accord-ing to geographical origin of the isolates, but the com-position of inner clusters changed between techniques.In most of the cases, the global behavior of isolatesacross the topologies was comparable, with only fewexceptions. One of them was a small group of isolatesfrom Orocué, which clustered together with isolatesfrom La Libertad (Meta) when VNTRs were used. Thisgrouping was not observed when AFLPs were used.Interestingly, both techniques revealed that most of thereference strains tended to cluster with isolates fromOrocué (Casanare) and La Libertad (Meta), which sug-gested that those strains presented a similar proportionof shared characters with strains coming from these twolocations. This is supported by the fact that similarEuclidean distances were obtained when reference strainswere compared to the isolates from La Libertad and tothe isolates from Orocué (data not shown).We then evaluated if there were distinguishable gen-
etic clusters of the pathogen in the Eastern Plains region.When isolates were assigned to estimate genetic clustersusing AFLP markers, they were grouped in two well-differentiated genetic clusters (Figure 4A). Each geneticcluster was mainly conformed by isolates from the samelocation, suggesting that geographical distances influ-enced the designation of clusters. This observation wascorroborated with a Mantel test that showed a positivecorrelation between genetic and geographical distances(R2 = 0.9302). On the other hand, five genetic clusterswere estimated when isolates were characterized usingVNTRs (Figure 4B). In the same way, K clusters groupedaccording to the origin of isolates but this was less
from the Colombian Eastern Plains
Range of allele repetitions Dominant alleles HGDI index
1 - 9 4 8 0.7019
1 - 23 5 0.858
4 - 10 6 0.5873
10 - 26 16 26 0.8428
5 - 12 6 7 9 0.797
llaborators [36].

Table 2 Genetic variance among sampled locations in the Eastern Plains using AFLP and VNTR markers
Location pair Number of isolatesMolecular marker
AFLP VNTR
Loc. 1 Loc. 2 Loc. 1 Loc. 2 ΦPT LinΦPT p-value ΦPT LinΦPT p-value
La Libertad Granada 47 3 0.393 0.649 0.001* 0.245 0.324 0.003*
La Libertad Orocué 47 50 0.520 1.082 0.001* 0.192 0.238 0.001*
Granada Orocué 3 50 0.623 1.649 0.001* 0.196 0.244 0.021*
* Statistically significant (p > 0.05).(ΦPT): genetic differentiation among population.(LinΦPT): Linearized genetic differentiation among population.
Figure 2 Discrimination of sampled locations in the Colombian Eastern Plains by AFLP and VNTR markers. Disimilarities among Xamisolates were calculated by a Principal Coordinates Analysis (PCoA). Isolates are represented in the PCoA according to their geographical origin.Triangle: La Libertad; square: Granada; rhombus: Orocué. In addition, genetic distances among sampled locations were calculated using theEuclidean distance. A) PCoA was estimated using AFLP data. B) PCoA and was estimated using VNTR data. Fuente de Oro was excluded of thePCoA because this location only presented one isolate.
Trujillo et al. BMC Microbiology 2014, 14:161 Page 6 of 14http://www.biomedcentral.com/1471-2180/14/161

11981197
12021195 1169 1170 1247
1194 1175 1189 1178 1182 1188 11741186
1420
14081428
1395
1357
1391
1347 1369 1371 1379 1371 1393 1426
1423
1397
13921399
CIO169
CIO124
1396
14221432
14211414
1416
13941430
1410
1402
133413381344
1390
1341
13771345
133613421348
13431383
1381
1355
1335
13391405
11921191
118011851187
11901193
1384 13751433
1253
1365
1353
12451256
1248
1254
1267
1235
12331243
1239
1238
118011851187
1203123412511257
12011246
1249
1255
1211
1212
1213
1196
1171
1183
1237
12051252
1236
CIO147
CIO129 CIO37CIO164
CIO121
CIO116
CIO176 CIO1671424
1.0
1190
1335
13391377 1371 1391 1379 1267
1334 1365
1341
1347
1390134213451344133813481380136913361343 1353
1357
1384
13751383 1254
1355
1402 1193
1394141414281432
1421
1430
1410
141614221195
12371252
1236
13971255
12011246
1249
1393
1186
1417
11871239
1396
1395
1408
1399
1392
14261405
14231424
1433
11711189
12021253
119811971194
1182
1251
1256
1188
119
6
1192
11351420
12341238
1243
1245
1274 1183
1248 117811851203
1175 1180 11911233
11961247
1170
12051257
CIO116
CIO37CIO176
CIO164
CIO127
CIO129
CIO121CIO169
CIO167
CIO147
1213
12111212
0.01
A) B)
Figure 3 Distance trees generated with AFLP and VNTR data from isolates collected in Casanare and Meta. Unrooted distance trees wereconstructed with the Neighbor-Joining algorithm in SplitsTree version 4.12.3 A) Distance tree was constructed using four selective pairs of primersto amplify AFLP markers. B) Distance tree constructed using five VNTR loci. La Libertad: black; Granada: blue; Fuente de Oro: red; Orocué: green andreference strains: orange.
Trujillo et al. BMC Microbiology 2014, 14:161 Page 7 of 14http://www.biomedcentral.com/1471-2180/14/161
evident than for the clusters generated by AFLPs. Thefact that VNTRs detected new clusters is suggesting thatthose markers were able to distinguish an encryptedpopulation structure that was not detected by AFLPs.Similarly to what was observed with AFLPs, VNTRs de-tected a genetic structure correlated with geographicallocation. The Mantel test suggested a positive correl-ation between genetic and geographical distances (R2 =0.2666), however this correlation was not as evident asthe one estimated using the AFLP markers. FST valuesfrom the populations estimated using both techniqueswere compared. FST values of the five populationsobtained for the VNTR analysis were lower than the FSTvalues from the populations generated with the AFLPanalysis, indicating that VNTRs detected a higher gen-etic flow between populations.
The diversity of Xam haplotypes in the Eastern Plains wascomparable when the two types of molecular markerswere implementedAn analysis of haplotype assignment was conducted todetermine the number and distribution of haplotypes
among sampled locations. A haplotype was defined witha 100% similarity threshold for both AFLP and VNTRloci. Both approaches generated a highly similar numberof haplotypes for each sampled location and for refer-ence strains (Table 3). In addition, both techniquesallowed the distinction of a high number of haplotypes,with AFLPs and VNTRs detecting 86 and 87 haplotypesout of 111 isolates, respectively. Consequently, the clonaldiversity at each location was considerably high andcomparable for both approaches (Table 3). However,high diversity values were most probably the result ofthe stringency in the assignment of haplotypes (100%similarity between isolates).Haplotypes were divided in a minimum spanning net-
work to visualize the connectivity between them (Figure 5).These networks evidenced that most haplotypes aregrouped according to geographic location, which wasexpected from the Mantel test results described above.However, VNTR haplotypes from Orocué (Casanare)presented larger genetic distances among them than tohaplotypes from La Libertad (Meta). This result sug-gests that VNTR amplification was more discriminating
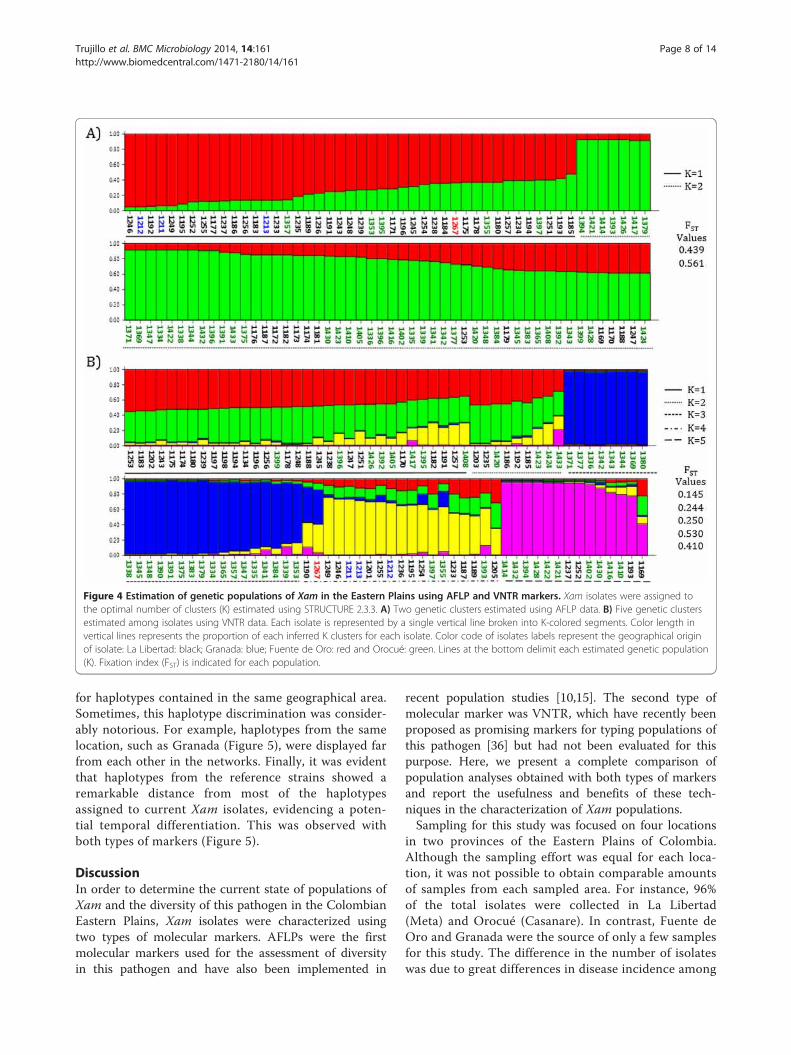
Figure 4 Estimation of genetic populations of Xam in the Eastern Plains using AFLP and VNTR markers. Xam isolates were assigned tothe optimal number of clusters (K) estimated using STRUCTURE 2.3.3. A) Two genetic clusters estimated using AFLP data. B) Five genetic clustersestimated among isolates using VNTR data. Each isolate is represented by a single vertical line broken into K-colored segments. Color length invertical lines represents the proportion of each inferred K clusters for each isolate. Color code of isolates labels represent the geographical originof isolate: La Libertad: black; Granada: blue; Fuente de Oro: red and Orocué: green. Lines at the bottom delimit each estimated genetic population(K). Fixation index (FST) is indicated for each population.
Trujillo et al. BMC Microbiology 2014, 14:161 Page 8 of 14http://www.biomedcentral.com/1471-2180/14/161
for haplotypes contained in the same geographical area.Sometimes, this haplotype discrimination was consider-ably notorious. For example, haplotypes from the samelocation, such as Granada (Figure 5), were displayed farfrom each other in the networks. Finally, it was evidentthat haplotypes from the reference strains showed aremarkable distance from most of the haplotypesassigned to current Xam isolates, evidencing a poten-tial temporal differentiation. This was observed withboth types of markers (Figure 5).
DiscussionIn order to determine the current state of populations ofXam and the diversity of this pathogen in the ColombianEastern Plains, Xam isolates were characterized usingtwo types of molecular markers. AFLPs were the firstmolecular markers used for the assessment of diversityin this pathogen and have also been implemented in
recent population studies [10,15]. The second type ofmolecular marker was VNTR, which have recently beenproposed as promising markers for typing populations ofthis pathogen [36] but had not been evaluated for thispurpose. Here, we present a complete comparison ofpopulation analyses obtained with both types of markersand report the usefulness and benefits of these tech-niques in the characterization of Xam populations.Sampling for this study was focused on four locations
in two provinces of the Eastern Plains of Colombia.Although the sampling effort was equal for each loca-tion, it was not possible to obtain comparable amountsof samples from each sampled area. For instance, 96%of the total isolates were collected in La Libertad(Meta) and Orocué (Casanare). In contrast, Fuente deOro and Granada were the source of only a few samplesfor this study. The difference in the number of isolateswas due to great differences in disease incidence among
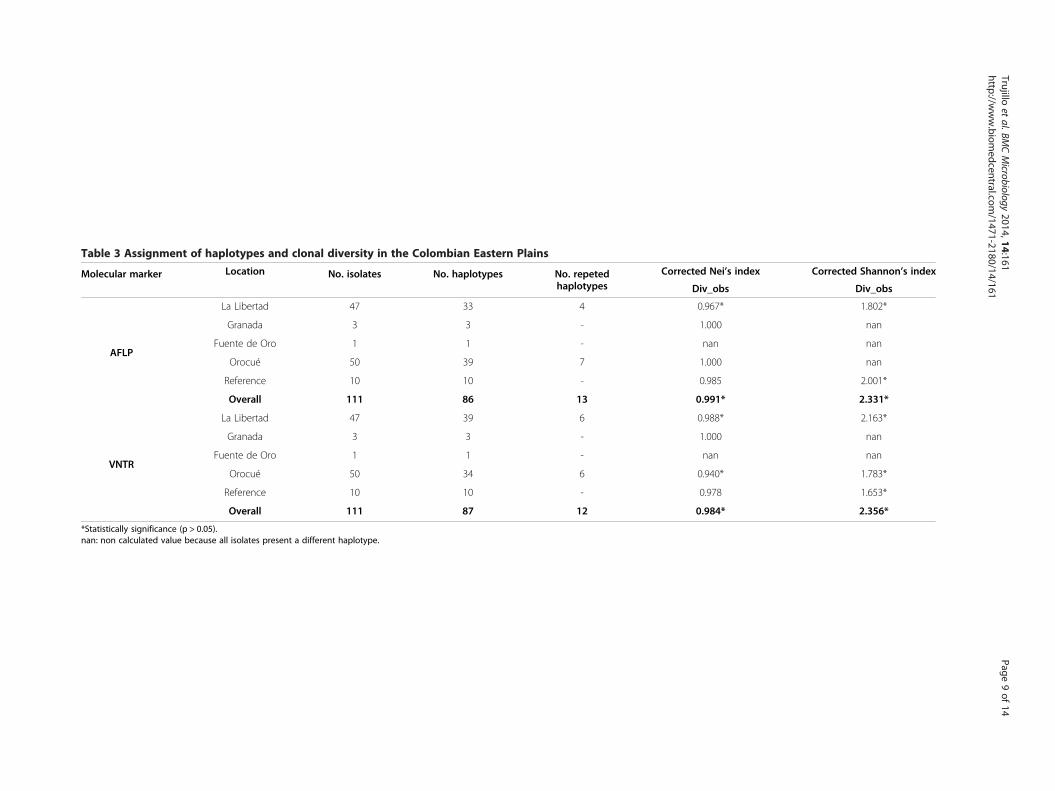
Table 3 Assignment of haplotypes and clonal diversity in the Colombian Eastern Plains
Molecular marker Location No. isolates No. haplotypes No. repetedhaplotypes
Corrected Nei’s index Corrected Shannon’s index
Div_obs Div_obs
AFLP
La Libertad 47 33 4 0.967* 1.802*
Granada 3 3 - 1.000 nan
Fuente de Oro 1 1 - nan nan
Orocué 50 39 7 1.000 nan
Reference 10 10 - 0.985 2.001*
Overall 111 86 13 0.991* 2.331*
VNTR
La Libertad 47 39 6 0.988* 2.163*
Granada 3 3 - 1.000 nan
Fuente de Oro 1 1 - nan nan
Orocué 50 34 6 0.940* 1.783*
Reference 10 10 - 0.978 1.653*
Overall 111 87 12 0.984* 2.356*
*Statistically significance (p > 0.05).nan: non calculated value because all isolates present a different haplotype.
Trujilloet
al.BMCMicrobiology
2014,14:161Page
9of
14http://w
ww.biom
edcentral.com/1471-2180/14/161

Figure 5 Connectivity of haplotypes assigned among Xam isolates from the Eastern Plains. A) Haplotype network generated using AFLPdata. B) Haplotype network generated using VNTR data. Sizes of circles represent the number of isolates belonging to each haplotype.Colors of circles represent the geographical origin of each haplotype. La Libertad: black; Granada: blue; Fuente de Oro: red; Orocué: greenand reference strains: orange. Colors of branches represent the number of changes between haplotypes. 1: black; 2: yellow; 3: red; 4: purple;5: green; 6: gray and 9: brown.
Trujillo et al. BMC Microbiology 2014, 14:161 Page 10 of 14http://www.biomedcentral.com/1471-2180/14/161
locations. In contrast to La Libertad and Orocué, cassavafields in Granada and Fuente de Oro are constantlyrotated by growers or substituted by other types ofcrops and this could have contributed to a reduction inthe incidence of CBB in these locations.In spite of the difference in the number of samples, we
could easily conclude that VNTRs and AFLPs providecongruent results for Xam populations. This is supportedby several observations. First, both techniques wereable to genetically differentiate the populations of Xambetween sampled locations. Second, global clusteringpatterns were constant in both types of markers. Forinstance, clustering in distance trees and haplotypenetworks was clearly defined by the geographical originof isolates, although AFLPs displayed a better geographical
clustering (Figure 3). Third, the distribution of haplotypesfrom Granada (Meta) was congruent between both tech-niques used. Both of them displayed Granada haplotypesvery distant as shown in the Figure 5. This behavior is incontrast to what was expected. Cultural practices such ascrop rotation, which is intensively implemented in this lo-cation, should have generated a genetic drift event thatcould have led to a reduction in pathogen diversity [3].However, the instability of cassava fields due to intensivecrop rotation and the reduced number of plants with CBBsymptoms in Granada did not allow the constant tracingof the pathogen in order to explain the attained behaviorof these isolates. Fourth, a congruent behavior wasalso observed for the reference strains, which werealmost completely grouped in the distance trees and

Trujillo et al. BMC Microbiology 2014, 14:161 Page 11 of 14http://www.biomedcentral.com/1471-2180/14/161
networks from both analyses (Figures 3, 4 and 5). Thissuggests a temporal differentiation of Xam popula-tions, a process that is occurring even in short periodsof time, as was evidenced in the recently characterizedCaribbean populations and also with populations fromthe 1990s [9,16].There were also contrasting results when analyses
from AFLPs and VNTRs were compared. For example,although isolates were clustered according to theirgeographical origin, the composition of inner clusterschanged between techniques. This discrepancy couldbe explained by the fact that each type of marker evalu-ates polymorphisms at different scales. AFLPs evaluatedifferences distributed along the whole genome andthose differences must be located in recognition sitesfor restriction enzymes [34]. Detection of polymor-phisms in AFLPs is highly influenced by the combin-ation of restriction enzymes and selective primers usedin this technique [44]. In contrast, VNTRs evaluate thevariation in restricted genomic areas, where short tandemrepeats are located. These repetitive genomic regionspromote the Slipped-strand mispairing phenomenonduring DNA replication, producing a change in thenumber of repetitive elements and increasing the muta-tion rate in a specific locus [21,45,46]. In addition,VNTRs could present homoplasy events that could beinfluencing the clustering process. However, the use ofreasonable number of VNTR loci reduces this effect[47]. Because both AFLPs and VNTRs are evolving atdifferent rates and each detects variation at differentgenomic scales, it is not surprising that the patternof composition of the inner clusters could differ, asobserved at the Figure 3.Additionally, AFLPs and VNTRs showed discrepancies
when the optimal number of genetic clusters was esti-mated. The optimal K clusters for VNTRs (k = 5) waslarger than that for AFLPs (k = 2). This finding suggeststhat VNTRs were able to detect a more detailed struc-turing of Xam population that was not detected byAFLPs. However, three of the genetic clusters generatedby VNTRs presented considerably lower FST indices in-dicating a high genetic flow among them (Figure 4).These genetic clusters with a high genetic flow could beconsidered as part of a bigger population when the othermolecular marker is implemented. In our case, STRUC-TURE could assume that those three genetic clusterswith high genetic flow could be encrypted when theclusters were estimated using AFLP markers. On theother hand, although K clusters presented considerabledifferences in FST values, both techniques confirmed thegenetic flow between geographically distant locations,such as La Libertad and Orocué, which are separated byapproximately 250 km. This process of genetic flowwas also documented between distant locations even
when locations were located in very distant regions ofColombia. For example, between the Caribbean and theEastern Plains regions, there is a geographic distance ofmore than 500 km [8,14,15].If we compare the current populations from the
Caribbean and the Eastern Plains, it is evident that thepathogen is more diverse in the Caribbean. A total of57 AFLP haplotypes were detected among 160 isolatesfrom the Caribbean region, when using 80% similarityas a threshold. [15]. In the Eastern Plains region, 28haplotypes were detected among 111 isolates, withhaplotype assignment at 80% similarity (data not shown).These observations are in contrast to what was reportedfor Colombian populations in the nineties, where thepathogen was more diverse in the Eastern Plains than inthe Caribbean region [8,9,14]. This could be related to thelimited number of samples collected in the Eastern Plainsbecause of the low CBB incidence encountered in someof the sampled locations at this region. The decrease inincidence could be explained by the reduction in thearea dedicated to cassava cultivation in Meta in recentyears [48].In contrast to the locations at the Eastern Plains,
most of the Caribbean populations did not display ageographically-dependent genetic differentiation [15].These differences could be a consequence of the modeof cultivation of cassava in the two regions. Cassavacropping in the Caribbean is considerably more inten-sive and extensive than it is in the Eastern Plains [48],something that could reduce geographical isolation ofXam populations. In contrast, the geographical differ-entiation detected at the Eastern Plains populationscould also be associated with the fact that growers inOrocué are indigenous people who do not move overlarge geographical distances. This phenomenon couldreduce the exchange of propagative material infectedwith Xam, hence enhancing genetic differentiationbetween Eastern Plain locations.In this study, we were able to assess the usefulness of
VNTRs for the study of Xam populations. Remarkably,only 5 VNTR loci offered a very similar panorama of thepathogen populations to that obtained by 57 AFLP loci.This finding is relevant for further studies on the popu-lation dynamics of Xam, because VNTR markers providea faster and less expensive characterization of bacterialisolates, as has been reported for several pathogenicmicroorganisms [22,24,25,49]. The fact that amplifica-tion of VNTRs requires neither a complex DNA extrac-tion procedure, nor compounds different from thoseused in a regular PCR, makes VNTRs ideal when a largenumber of isolates are considered and when funding islimiting. Moreover, sharing information between labora-tories would be considerably more straightforward withVNTRs than with AFLPs, because results from VNTRs
Trujillo et al. BMC Microbiology 2014, 14:161 Page 12 of 14http://www.biomedcentral.com/1471-2180/14/161
can be more easily coded [17]. For future Xam surveystudies we recommend the use of VNTRs. The risingnumber of sequenced genomes available nowadays, pro-vides an additional advantage to identify new VNTR loci,hence improving the characterization of several pathogens[19,21,50,51]. Recently, 65 partial genomes of Xam strainshave been released [52], providing a valuable opportunityto detect VNTRs with high discriminatory power.Currently, we are focusing on the prediction and evalu-ation of new VNTR loci into a core of the representa-tive Xam strains using the information obtained fromthe 65 draft genome sequences. Our goal is to obtain asmall sets of VNTRs with a high discriminatory power,aiming to implement them in studies that involve alarge number of isolates to provide a more accuratedescription of evolving processes taking place in Xampopulations.
ConclusionsThis study represents the first attempt to type popula-tions of Xam using VNTRs as molecular markers. Herewe demonstrated that a small number of VNTR locicould offer a similar panorama of the status of thepathogen to that offered by AFLPs markers. BecauseVNTRs represent a fast and simple tool to type Xampopulations, their implementation will allow a constantand adequate surveillance of the pathogen, which couldprovide information to improve the efficiency of strat-egies for disease control, such as the deployment ofresistant varieties.
Availability of supporting dataThe data sets supporting the results of this article are avail-able in the Dryad Digital Repository: http://doi.org/10.5061/dryad.t173v.DNA sequences are available in Genbank database:
(Accession numbers XaG1_02: KJ736838 - KJ736944;XaG1_29: KJ736945 - KJ737053; XaG2_52: KJ737163 -KJ737268; XaG1_67: KJ737269 - KJ737369; XaG1_73:KJ737054 - KJ737162).
Ethics statementThis study did not involve any human material, or humandata. No experimental procedure was performed invertebrate or invertebrate animals for the developmentof this research.
Additional file
Additional file 1: Primers used for the AFLP amplification and VNTRamplification and sequencing.
Competing interestsThe authors declare that they have no competing interests.
Authors’ contributionsCT was involved in the conception and design of the study, sampling,bacterial isolation, molecular characterization using AFLPs and VNTRs, dataanalyses and who wrote the manuscript. NAR performed DNA extraction, theevaluation of 3 VNTR loci, VNTR data analyses and drafting of the manuscript.LP contributed in the evaluation 3 VNTR loci, VNTR data analyses and drafting ofthe manuscript. CM carried the sampling and data acquisition. AT participatedin the data acquisition and revised the content of the manuscript. SR wasinvolved in the conception and design of the study, drafting and revising themanuscript. RK was involved in the conception and design of the study and thedesign of the VNTR strategy. AB participated in the conception and design ofthe project, funding acquisition, editing and revisiting of manuscript. All authorsread and approved the final manuscript.
AcknowledgementsThe authors would like to thank to the Faculty of Sciences from Universidadde los Andes, the Evaluation-orientation de la Coopération Scientifique (ECOSproject No. C11A02) and the National Science Foundation/BREAD (BasicResearch to Enable Agricultural Development) grant (Award 0965418) forfunding this study. We also thank the International Center for TropicalAgriculture (CIAT) for enabling the sampling at their experimental cassavafield located in Corpoica (La Libertad, Meta). We also thank Daniela Osoriofor help in the edition of manuscript style. Finally we thank Estefanía Luengasfor help in figure editing.
Author details1Laboratorio de Micología y Fitopatología Uniandes (LAMFU), Universidad deLos Andes, Bogotá, Colombia. 2Institut de Recherche pour le Développement(IRD), UMR Résistance des Plantes aux Bioaggresseurs, Montpellier, France.3Corporación Colombiana de Investigación Agropecuaria (CORPOICA), LaLibertad, Villavicencio, Colombia.
Received: 8 October 2013 Accepted: 10 June 2014Published: 19 June 2014
References1. Lannou C, Hubert P, Gimeno C: Competition and interactions among
stripe rust pathotypes in wheat-cultivar mixtures. Plant Pathol 2005,54(5):699–712.
2. Mundt CC: Use of multiline cultivars and cultivar mixtures for diseasemanagement. Annu Rev Phytopathol 2002, 40:381–410.
3. McDonald BA, Linde C: Pathogen population genetics, evolutionarypotential, and durable resistance. Annu Rev Phytopathol 2002,40:349–379.
4. Stukenbrock EH, McDonald BA: The origins of plant pathogens inagro-ecosystems. Annu Rev Phytopathol 2008, 46:75–100.
5. Barrett LG, Thrall PH, Burdon JJ, Linde CC: Life history determines geneticstructure and evolutionary potential of host-parasite interactions. TrendsEcol Evol 2008, 23(12):678–685.
6. Maraite H: Xanthomonas campestris pathovars on cassava: cause ofbacterial blight and bacterial necrosis. In Xanthomonas. Edited by SwingsJG, Civerolo EL. London: Chapman and Hall; 1993:18–24.
7. Lozano J: Cassava bacterial blight: a manageable disease. Plant Dis 1986,70:1089–1093.
8. Restrepo S, Velez CM, Duque MC, Verdier V: Genetic structure andpopulation dynamics of Xanthomonas axonopodis pv. manihotis inColombia from 1995 to 1999. Appl Environ Microb 2004, 70(1):255–261.
9. Restrepo S, Velez CM, Verdier V: Measuring the genetic diversity ofXanthomonas axonopodis pv. manihotis within different fields inColombia. Phytopathology 2000, 90(7):683–690.
10. Ogunjobi AA, Fagade OE, Dixon AG: Comparative analysis of geneticvariation among Xanthomonas axonopodis pv manihotis isolated fromthe western states of Nigeria using RAPD and AFLP. Indian J Microbiol2010, 50(2):132–138.
11. Verdier V, Boher B, Maraite H, Geiger JP: Pathological and molecularcharacterization of Xanthomonas campestris isolates causingdiseases of cassava (Manihot esculenta). Appl Environ Microb 1994,60:4478–4486.
12. Verdier V, Dongo P, Boher B: Assessment of genetic diversity amongstrains of Xanthomonas campestris pv manihotis. J Gen Microbiol 1993,139:2591–2601.

Trujillo et al. BMC Microbiology 2014, 14:161 Page 13 of 14http://www.biomedcentral.com/1471-2180/14/161
13. Verdier V, Restrepo S, Mosquera G, Duque MC, Gerstl A, Laberry R: Geneticand pathogenic variation of Xanthomonas axonopodis pv. manihotis inVenezuela. Plant Pathol 1998, 47:601–608.
14. Restrepo S, Verdier V: Geographical differentiation of the population ofXanthomonas axonopodis pv. manihotis in Colombia. Appl Environ Microb1997, 63(11):4427–4434.
15. Trujillo CA, Ochoa JC, Mideros MF, Restepo S, López C, Bernal A: A complexpopulation structure of the Cassava Pathogen Xanthomonas axonopodispv. manihotis in recent years in the Caribbean Region of Colombia.Microb Ecol 2014, 67(4). doi:10.1007/s00248-014-0411-8.
16. Restrepo S, Du que M, Tohme J, Verdier V: AFLP fingerprinting: an efficienttechnique for detecting genetic variation of Xanthomonas axonopodispv. manihotis. Microbiology 1999, 145(Pt 1):107–114.
17. Fillo S, Giordani F, Anniballi F, Gorge O, Ramisse V, Vergnaud G, Riehm JM,Scholz HC, Splettstoesser WD, Kieboom J, Olsen JS, Fenicia L, Lista F:Clostridium botulinum group I strain genotyping by 15-locus multilocusvariable-number tandem-repeat analysis. J Clin Microbiol 2011,49(12):4252–4263.
18. Blears MJ, De Grandis SA, Lee H, Trevors JT: Amplified fragment lengthpolymorphism (AFLP): a review of the procedure and its applications.J Ind Microbiol Biot 1998, 21:99–114.
19. Chiou CS: Multilocus variable-number tandem repeat analysis as amolecular tool for subtyping and phylogenetic analysis of bacterialpathogens. Expert Rev Mol Diagn 2010, 10(1):5–7.
20. Garcia-Yoldi D, Le Fleche P, De Miguel MJ, Munoz PM, Blasco JM,Cvetnic Z, Marin CM, Vergnaud G, Lopez-Goni I: Comparison ofmultiple-locus variable-number tandem-repeat analysis with otherPCR-based methods for typing Brucella suis isolates. J Clin Microbiol2007, 45(12):4070–4072.
21. Van Belkum A: Tracing isolates of bacterial species by multilocus variablenumber of tandem repeat analysis (MLVA). FEMS Immunol Med Mic 2007,49(1):22–27.
22. Mazars E, Lesjean S, Banuls AL, Gilbert M, Vincent V, Gicquel B, Tibayrenc M,Locht C, Supply P: High-resolution minisatellite-based typing as a portableapproach to global analysis of Mycobacterium tuberculosis molecularepidemiology. Proc Natl Acad Sci U S A 2001, 98(4):1901–1906.
23. Roring S, Scott A, Brittain D, Walker I, Hewinson G, Neill S, Skuce R:Development of variable-number tandem repeat typing ofMycobacterium bovis: comparison of results with those obtained byusing existing exact tandem repeats and spoligotyping. J Clin Microbiol2002, 40(6):2126–2133.
24. Keim P, Price LB, Klevytska AM, Smith KL, Schupp JM, Okinaka R, Jackson PJ,Hugh-Jones ME: Multiple-locus variable-number tandem repeat analysisreveals genetic relationships within Bacillus anthracis. J Bacteriol 2000,182(10):2928–2936.
25. Melles DC, Schouls L, Francois P, Herzig S, Verbrugh HA, van Belkum A,Schrenzel J: High-throughput typing of Staphylococcus aureus by amplifiedfragment length polymorphism (AFLP) or multi-locus variable number oftandem repeat analysis (MLVA) reveals consistent strain relatedness. Eur JClin Microbiol Infect Dis 2009, 28(1):39–45.
26. Coletta-Filho HD, Takita MA, de Souza AA, Aguilar-Vildoso CI, MachadoMA: Differentiation of strains of Xylella fastidiosa by a variablenumber of tandem repeat analysis. Appl Environ Microb 2001,67(9):4091–4095.
27. Ngoc LB, Verniere C, Vital K, Guerin F, Gagnevin L, Brisse S, Ah-You N,Pruvost O: Development of 14 minisatellite markers for the citruscanker bacterium, Xanthomonas citri pv. citri. Mol Ecol Resour 2009,9(1):125–127.
28. N’Guessan CA, Brisse S, Le Roux-Nio AC, Poussier S, Kone D, Wicker E:Development of variable number of tandem repeats typing schemesfor Ralstonia solanacearum, the agent of bacterial wilt, bananaMoko disease and potato brown rot. J Microbiol Meth 2013,92(3):366–374.
29. Zhao S, Poulin L, Rodriguez RL, Serna NF, Liu SY, Wonni I, Szurek B,Verdier V, Leach JE, He YQ, Feng JX, Koebnik R: Development of avariable number of tandem repeats typing scheme for the bacterialrice pathogen Xanthomonas oryzae pv. oryzicola. Phytopathology 2012,102(10):948–956.
30. Stevenson K, Alvarez J, Bakker D, Biet F, de Juan L, Denham S, Dimareli Z,Dohmann K, Gerlach GF, Heron I, Kopecna M, May L, Pavlik I, Sharp JM,Thibault VC, Willemsen P, Zadoks RN, Greig A: Occurrence of
Mycobacterium avium subspecies paratuberculosis across host speciesand European countries with evidence for transmission between wildlifeand domestic ruminants. BMC Microbiol 2009, 9:212.
31. Pourcel C, Visca P, Afshar B, D’Arezzo S, Vergnaud G, Fry NK: Identificationof variable-number tandem-repeat (VNTR) sequences in Legionellapneumophila and development of an optimized multiple-locus VNTRanalysis typing scheme. J Clin Microbiol 2007, 45(4):1190–1199.
32. Castiblanco LF, Gil J, Rojas A, Osorio D, Gutierrez S, Munoz-Bodnar A,Perez-Quintero AL, Koebnik R, Szurek B, Lopez C, Restrepo S, Verdier V,Bernal AJ: TALE1 from Xanthomonas axonopodis pv. manihotis acts as atranscriptional activator in plant cells and is important for pathogenicityin cassava plants. Mol Plant Pathol 2013, 14(1):84–95.
33. Verdier V, Mosquera G, Assigbétsé K: Detection of the Cassava bacterialblight pathogen, Xanthomonas axonopodis pv. manihotis, by Polymerasechain reaction. Plant Dis 1998, 82(1):79–83.
34. Vos P, Hogers R, Bleeker M, Reijans M, van de Lee T, Hornes M, Frijters A,Pot J, Peleman J, Kuiper M, Zabeau M: AFLP: a new technique for DNAfingerprinting. Nucleic Acids Res 1995, 23(21):4407–4414.
35. Hunter PR, Gaston MA: Numerical index of the discriminatory ability oftyping systems: an application of Simpson’s index of diversity. J ClinMicrobiol 1988, 26(11):2465–2466.
36. Arrieta-Ortiz ML, Rodriguez-R LM, Pérez AL, Poulin L, Díaz AC, Arias Rojas N,Trujillo C, Restrepo-Benavides M, Bart R, Boch J, Boureau T, Darrasse A, DavidP, Bernonville TD, Fontanilla P, Gagnevin L, Guérin F, Jacques MA, Lauber E,Lefeuvre P, Medina C, Medina E, Montenegro N, Muñoz-Bodnar A, Noël L,Ortiz-Quiñones JF, Osorio D, Pardo C, Patil PB, Poussier S, et al: Genomicsurvey of pathogenicity determinants and VNTR markers in the cassavabacterial pathogen Xanthomonas axonopodis pv. manihotis strainCIO151. PLoS One 2013, 8(11):e79704.
37. Edgar RC: MUSCLE: multiple sequence alignment with high accuracy andhigh throughput. Nucleic Acids Res 2004, 32(5):1792–1797.
38. Peakall R, Smouse PE: GenAlEx 6.5: genetic analysis in Excel: populationgenetic software for teaching and research–an update. Bioinformatics2012, 28(19):2537–2539.
39. Meirmans PG, Van-Tienderen PH: GENOTYPE and GENODIVE: two programsfor the analysis of genetic diversity of asexual organisms. Mol Ecol Notes2004, 4:792–794.
40. Huson DH, Bryant D: Application of phylogenetic networks in evolutionarystudies. Mol Biol Evol 2006, 23(2):254–267.
41. Pritchard JK, Stephens M, Donnelly P: Inference of population structureusing multilocus genotype data. Genetics 2000, 155(2):945–959.
42. Evanno G, Regnaut S, Goudet J: Detecting the number of clusters ofindividuals using the software STRUCTURE: a simulation study. Mol Ecol2005, 14(8):2611–2620.
43. Wright S: Genetical structure of populations. Nature 1950,166(4215):247–249.
44. Bachem CW, van der Hoeven RS, de Bruijn SM, Vreugdenhil D, Zabeau M,Visser RG: Visualization of differential gene expression using a novelmethod of RNA fingerprinting based on AFLP: analysis of geneexpression during potato tuber development. Plant J 1996,9(5):745–753.
45. Levinson G, Gutman GA: Slipped-strand mispairing: a major mechanismfor DNA sequence evolution. Mol Biol Evol 1987, 4(3):203–221.
46. Torres-Cruz J, van der Woude MW: Slipped-strand mispairing can functionas a phase variation mechanism in Escherichia coli. J Bacteriol 2003,185(23):6990–6994.
47. Comas I, Homolka S, Niemann S, Gagneux S: Genotyping of geneticallymonomorphic bacteria: DNA sequencing in Mycobacterium tuberculosishighlights the limitations of current methodologies. PLoS One 2009,4(11):e7815.
48. Aguilera Díaz M: La yuca en el Caribe colombiano: De cultivo ancestral aagroindustrial. In Documentos de trabajo sobre economía regional;http://www.banrep.gov.co/sites/default/files/publicaciones/archivos/dtser_158.pdf: Banco de la República de Colombia 2012.
49. Lindstedt BA: Multiple-locus variable number tandem repeats analysis forgenetic fingerprinting of pathogenic bacteria. Electrophoresis 2005,26(13):2567–2582.
50. Ramisse V, Houssu P, Hernandez E, Denoeud F, Hilaire V, Lisanti O, Ramisse F,Cavallo JD, Vergnaud G: Variable number of tandem repeats in Salmonellaenterica subsp. enterica for typing purposes. J Clin Microbiol 2004,42(12):5722–5730.

Trujillo et al. BMC Microbiology 2014, 14:161 Page 14 of 14http://www.biomedcentral.com/1471-2180/14/161
51. Chang CH, Chang YC, Underwood A, Chiou CS, Kao CY: VNTRDB: a bacterialvariable number tandem repeat locus database. Nucleic Acids Res 2007,35(Database issue):D416–D421.
52. Bart R, Cohn M, Kassen A, McCallum EJ, Shybut M, Petriello A, Krasileva K,Dahlbeck D, Medina C, Alicai T, Kumar L, Moreira LM, Rodrigues-Neto J,Verdier V, Santana MA, Kositcharoenkul N, Vanderschuren H, Gruissem W,Bernal A, Staskawicz BJ: High-throughput genomic sequencing ofcassava bacterial blight strains identifies conserved effectors totarget for durable resistance. Proc Natl Acad Sci U S A 2012,109(28):E1972–E1979.
doi:10.1186/1471-2180-14-161Cite this article as: Trujillo et al.: Population typing of the causal agentof cassava bacterial blight in the Eastern Plains of Colombia using twotypes of molecular markers. BMC Microbiology 2014 14:161.
Submit your next manuscript to BioMed Centraland take full advantage of:
• Convenient online submission
• Thorough peer review
• No space constraints or color figure charges
• Immediate publication on acceptance
• Inclusion in PubMed, CAS, Scopus and Google Scholar
• Research which is freely available for redistribution
Submit your manuscript at www.biomedcentral.com/submit


![arboricola pv. pruni, the Causal Agent of · Xantomonas arboricola pv. pruni [3] (synonym, Xanthomonas campestris pv. pruni Smith) is the causal agent of bacterial spot disease of](https://static.fdocuments.net/doc/165x107/60fe0186f1d88f071f0d69ce/arboricola-pv-pruni-the-causal-agent-of-xantomonas-arboricola-pv-pruni-3-synonym.jpg)
