Population Structure and Its Effect on Haplotype Diversity
12
Copyright 2003 by the Genetics Society of America Population Structure and Its Effect on Haplotype Diversity and Linkage Disequilibrium Surrounding the xa5 Locus of Rice (Oryza sativa L.) Amanda J. Garris, Susan R. McCouch and Stephen Kresovich 1 Institute for Genomic Diversity and Department of Plant Breeding, Cornell University, Ithaca, New York 14853 Manuscript received February 10, 2003 Accepted for publication May 16, 2003 ABSTRACT To assess the usefulness of linkage disequilibrium mapping in an autogamous, domesticated species, we have characterized linkage disequilibrium in the candidate region for xa5, a recessive gene conferring race-specific resistance to bacterial blight in rice. This trait and locus have good mapping information, a tractable phenotype, and available sequence data, but no cloned gene. We sampled 13 short segments from the 70-kb candidate region in 114 accessions of Oryza sativa. Five additional segments were sequenced from the adjacent 45-kb region in resistant accessions to estimate the distance at which linkage disequilib- rium decays. The data show significant linkage disequilibrium between sites 100 kb apart. The presence of the xa5 resistant reaction in two ecotypes and in accessions with different haplotypes in the candidate region may indicate multiple origins or genetic heterogeneity for resistance. In addition, genetic differentia- tion between ecotypes emphasizes the need for controlling for population structure in the design of linkage disequilibrium studies in rice. T HE ability to interpret patterns of molecular ge- Recent studies in maize and Arabidopsis have pro- netic diversity and to relate them to phenotypic vided contrasting results for the utility of linkage dis- variation will enhance the use of diverse genetic resource equilibrium for fine mapping genes in plants on the collections in crop improvement. Recently, a primary basis of divergent estimates for the extent of linkage goal in genetic resource management has been to char- disequilibrium in these two plant genomes. In maize, an acterize the structure of diversity within a crop species outcrossing species, significant linkage disequilibrium (Brown 1989). Increasingly, the focus is shifting to dis- was detected only within a range from 100 bp to 7 kb secting and understanding diversity in relation to genes on the basis of analysis of several genic regions (Reming- underlying agronomic traits (Buckler and Thorns- ton et al. 2001; Tenaillion et al. 2001; Thornsberry et berry 2002; Rafalski 2002). al. 2001); in the autogamous species Arabidopsis thaliana, One possible approach to building the connection significant linkage disequilibrium persisted for 250 kb from genetic diversity to phenotype is linkage disequilib- in a single region (Hagenblad and Nordborg 2002). rium (LD) mapping, recently proposed as an alternative Unlike maize, rice is predominantly autogamous, which to traditional methods for mapping traits in plants is predicted to result in more extensive linkage disequi- (Buckler and Thornsberry 2002; Nordborg and librium, perhaps even genome-wide linkage disequilib- Tavare ´ 2002). Linkage disequilibrium is defined as the rium. But in contrast to Arabidopsis, the domestication nonrandom association of alleles, and it can result from history of rice has presumably introduced numerous population structure, selection, drift, or physical link- bottlenecks as well as diverse hybridization events fol- age. The physical extent of linkage disequilibrium lowed by generations of selection for performance in around a gene determines the effectiveness of this ap- diverse agricultural environments. Because many of the proach, and it is the result of many factors, including world’s major crop species are autogamous, including the rate of outcrossing, the degree of artificial or natural many cereals, legumes, and Solanaceous species, the selection on the gene or region of the genome, the understanding of linkage disequilibrium in rice may recombination rate, chromosomal location, population assist in evaluating the utility of linkage disequilibrium size and structure, and the age of the allele under study. mapping in other autogamous species. In cultivated species, the extent of linkage disequilib- In this article we provide an analysis of linkage dis- rium will also be shaped by human selection and the equilibrium in the genomic region containing xa5,a bottlenecks associated with crop dispersal beyond the bacterial blight resistance allele whose identity is still center of origin. unknown. The gene was first reported by Petpisit et al. (1977) and is a recessive gene conferring race-specific resistance to Xanthomonas oryzae pv. oryzae. After its iden- 1 Corresponding author: Institute for Genomic Diversity, 158 Biotech- tification, subsequent screening of the genetic resources nology Bldg., Cornell University, Ithaca, NY 14853. E-mail: [email protected] collection by the International Rice Research Institute Genetics 165: 759–769 (October 2003) Downloaded from https://academic.oup.com/genetics/article/165/2/759/6050338 by guest on 25 December 2021
Transcript of Population Structure and Its Effect on Haplotype Diversity
Copyright 2003 by the Genetics Society of America
Population Structure and Its Effect on Haplotype Diversity and LinkageDisequilibrium Surrounding the xa5 Locus of Rice (Oryza sativa L.)
Amanda J. Garris, Susan R. McCouch and Stephen Kresovich1
Institute for Genomic Diversity and Department of Plant Breeding, Cornell University, Ithaca, New York 14853
Manuscript received February 10, 2003Accepted for publication May 16, 2003
ABSTRACTTo assess the usefulness of linkage disequilibrium mapping in an autogamous, domesticated species,
we have characterized linkage disequilibrium in the candidate region for xa5, a recessive gene conferringrace-specific resistance to bacterial blight in rice. This trait and locus have good mapping information, atractable phenotype, and available sequence data, but no cloned gene. We sampled 13 short segmentsfrom the 70-kb candidate region in 114 accessions of Oryza sativa. Five additional segments were sequencedfrom the adjacent 45-kb region in resistant accessions to estimate the distance at which linkage disequilib-rium decays. The data show significant linkage disequilibrium between sites 100 kb apart. The presenceof the xa5 resistant reaction in two ecotypes and in accessions with different haplotypes in the candidateregion may indicate multiple origins or genetic heterogeneity for resistance. In addition, genetic differentia-tion between ecotypes emphasizes the need for controlling for population structure in the design oflinkage disequilibrium studies in rice.
THE ability to interpret patterns of molecular ge- Recent studies in maize and Arabidopsis have pro-netic diversity and to relate them to phenotypic vided contrasting results for the utility of linkage dis-
variation will enhance the use of diverse genetic resource equilibrium for fine mapping genes in plants on thecollections in crop improvement. Recently, a primary basis of divergent estimates for the extent of linkagegoal in genetic resource management has been to char- disequilibrium in these two plant genomes. In maize, anacterize the structure of diversity within a crop species outcrossing species, significant linkage disequilibrium(Brown 1989). Increasingly, the focus is shifting to dis- was detected only within a range from 100 bp to 7 kbsecting and understanding diversity in relation to genes on the basis of analysis of several genic regions (Reming-underlying agronomic traits (Buckler and Thorns- ton et al. 2001; Tenaillion et al. 2001; Thornsberry etberry 2002; Rafalski 2002). al. 2001); in the autogamous species Arabidopsis thaliana,
One possible approach to building the connection significant linkage disequilibrium persisted for 250 kbfrom genetic diversity to phenotype is linkage disequilib- in a single region (Hagenblad and Nordborg 2002).rium (LD) mapping, recently proposed as an alternative Unlike maize, rice is predominantly autogamous, whichto traditional methods for mapping traits in plants is predicted to result in more extensive linkage disequi-(Buckler and Thornsberry 2002; Nordborg and librium, perhaps even genome-wide linkage disequilib-Tavare 2002). Linkage disequilibrium is defined as the rium. But in contrast to Arabidopsis, the domesticationnonrandom association of alleles, and it can result from history of rice has presumably introduced numerouspopulation structure, selection, drift, or physical link- bottlenecks as well as diverse hybridization events fol-age. The physical extent of linkage disequilibrium lowed by generations of selection for performance inaround a gene determines the effectiveness of this ap- diverse agricultural environments. Because many of theproach, and it is the result of many factors, including world’s major crop species are autogamous, includingthe rate of outcrossing, the degree of artificial or natural many cereals, legumes, and Solanaceous species, theselection on the gene or region of the genome, the understanding of linkage disequilibrium in rice mayrecombination rate, chromosomal location, population assist in evaluating the utility of linkage disequilibriumsize and structure, and the age of the allele under study. mapping in other autogamous species.In cultivated species, the extent of linkage disequilib- In this article we provide an analysis of linkage dis-rium will also be shaped by human selection and the equilibrium in the genomic region containing xa5, abottlenecks associated with crop dispersal beyond the bacterial blight resistance allele whose identity is stillcenter of origin. unknown. The gene was first reported by Petpisit et al.
(1977) and is a recessive gene conferring race-specificresistance to Xanthomonas oryzae pv. oryzae. After its iden-
1Corresponding author: Institute for Genomic Diversity, 158 Biotech- tification, subsequent screening of the genetic resourcesnology Bldg., Cornell University, Ithaca, NY 14853.E-mail: [email protected] collection by the International Rice Research Institute
Genetics 165: 759–769 (October 2003)
Dow
nloaded from https://academ
ic.oup.com/genetics/article/165/2/759/6050338 by guest on 25 D
ecember 2021

760 A. J. Garris, S. R. McCouch and S. Kresovich
1977; Sidhu et al. 1978; Singh et al. 1983); see Table 1. Plants(IRRI) resulted in a group of accessions with the xa5were grown in a greenhouse and genomic DNA was extractedreaction profile to a panel of isolates, which was desig-using a cetyltrimethylammonium bromide protocol (Colosi
nated the “DZ192 group,” named for the original donor and Schaal 1993).of xa5 (DZ192) to breeding lines such as IR1545 and Bacterial blight inoculation and evaluation: Accessions were
evaluated for their disease response at 60 days after sowingisoline IRBB5 developed at IRRI. The gene has beenfollowing inoculation with X. oryzae pv. oryzae (Xoo) isolatesmapped to the short arm of chromosome 5 (Yoshimurarepresenting Philippine races one (PXO61), two (PXO86),et al. 1984) and was subsequently localized to a bacterialand four (PXO71; Mew 1987). The inoculum was prepared
artificial chromosome of �136 kb (Yang et al. 1998) as in Blair et al. (2003), except that the bacteria were culturedand to a region of �70 kb (Blair et al. 2003). for 4 days on modified Wakimoto’s medium. Inoculation was
performed using the leaf-clipping method (Kauffmann et al.The xa5 resistance allele may be associated with only1973). Three leaves were inoculated for each race, and differ-certain ecotypes of rice. Rice ecotypes are the result ofent bacterial isolates were inoculated on separate tillers. IR24intraspecific differentiation of Orzya sativa L. for diverseand IRBB5 were included as susceptible and resistant controls,
environmental conditions during the past 10,000 years respectively. Plants were maintained in growth chambers withsince domestication (Khush 1997). Broad classification 11 hr of daylight, night temperatures of 28�, and day tempera-
tures of 32�. Lesions were measured 14 days after inoculation.of rice into the subspecies indica and japonica fails toLesion lengths generally showed a bimodal distribution, andcapture these evolutionarily distinct subgroups. For ex-this distribution was used as the basis for defining resistantample, indica rices have traditionally included the aus,and susceptible reactions. For typing of disease response, each
aman, and boro rices of Bangladesh as well as the tjereh plant was classified as resistant if the mean lesion length wasrices of Indonesia. Within the japonica subspecies are between 0 and 3 cm. Plants with mean lesion lengths �6 cm
were classified qualitatively as susceptible. Plants with lesionthe Japanese ecotype nuda and the Indonesian ecotypelengths intermediate to these two classes were classified asbulu (Takahashi 1997). Allelism tests that showed xa5moderately resistant.to be in higher frequency in rice accessions from Bangla-
Markers: Twenty-one simple sequence repeats (SSRs) dis-desh and Nepal than from other Asian countries also tributed on the 12 chromosomes of rice were employed tosuggested that xa5 might be associated specifically with analyze population structure (RM11, RM14, RM105, RM109,the aus and boro ecotypes (Busto et al. 1990). The diver- RM152, RM174, RM202, RM206, RM215, RM225, RM228,
RM230, RM232, RM235, RM259, RM317, RM335, RM400,gence among the aus, boro, and aman ecotypes of Bangla-RM481, RM467, and RM415; as summarized in Chen et al.desh has been shaped by the wet and dry cycles of1997; Temnykh et al. 2000, 2001; http://www.gramene.org).the growing season (Khush 1997). Although the xa5 This number of markers seemed reasonable because it has
resistance allele was found primarily in aus and boro been shown that 15–20 unlinked SSRs are sufficient to detectecotypes, the presence of the resistance allele was not population stratification in humans (Pritchard and Rosen-
berg 1999). In addition, 13 amplicons were analyzed for singleassessed in light of a molecular genetic definition ofnucleotide polymorphisms (SNPs) and used for haplotype andecotype that would provide the more precise evolution-linkage disequilibrium analysis using primer pairs describedary characterization required for statistical analysis. As by Blair et al. (2003) and summarized in Table 2.
noted previously, population structure resulting from PCR amplification: The SSRs and SNP amplicons were gen-ecotypic differentiation is critical because it could result erated using the following PCR conditions: 95� for 4 min; 30
cycles of 94� for 1 min, 55� for 2 min, 72� for 2 min; and ain spurious associations in linkage disequilibrium analysis.1-hr extension at 72� to promote nontemplate addition ofThe objective of this research is to describe the diver-adenine by Taq.sity and the decay of linkage disequilibrium in one re- Genotyping: PCR products were size separated on 4% poly-
gion of the rice genome. This region consists of a small acrylamide gels using an ABI Prism 377 DNA analyzer (Appliedtelomeric area on the short arm of chromosome 5 that Biosystems, Foster City, CA). SSRs were analyzed with GenScan
3.1.2 software (Applied Biosystems) and scored with Geno-harbors xa5. Our goals were (1) to characterize thetyper 2.5 software (Applied Biosystems).extent of linkage disequilibrium in the region con-
DNA sequencing: A total of 10 �l of quantified PCR producttaining xa5 in resistant accessions and to determine if was treated with 10 units exonuclease I and 2 units shrimpit is possible to reduce the number of candidate genes, alkaline phosphatase and incubated at 37� for 15 min followed(2) to analyze haplotype diversity in the context of popu- by 80� for 15 min. Single-pass sequencing was performed by
automated sequencing using an ABI Prism 3700 DNA analyzerlation structure to determine the distribution of the(Applied Biosystems) at the Cornell BioResource Center (Ith-resistance allele among ecotypes, and (3) to make pre-aca, NY). Because rice is a diploid, predominantly selfing spe-dictions about the allelic diversity underlying the xa5 cies and therefore predominantly homozygous, direct se-
phenotype. quencing of PCR products resulted in a monomorphicsequence. Sequences were aligned using Sequencher 4.0.5(Gene Codes, Ann Arbor, MI) for base calling and CLUSTALW (Thompson et al. 1994) with manual quality control forMATERIALS AND METHODSinsertion/deletions. The ends of fragments were trimmed toremove low-quality sequence. The resulting sequences arePlant material: The 114 rice accessions used in this study
(listed in Table 1) were obtained from the IRRI in the Philip- listed in Table 2, along with the putative gene content of eachfragment on the basis of TIGR annotation (http://www.tigr.pines and from the National Plant Germplasm System Small
Grains Collection in Aberdeen, Idaho. A subset of the sample org). Singletons, SSRs, and polymorphisms resulting from theexpansion/contraction of polyA and polyTs were eliminatedhad previously been allele tested for xa5 (Olufowote et al.
Dow
nloaded from https://academ
ic.oup.com/genetics/article/165/2/759/6050338 by guest on 25 D
ecember 2021

761Population Structure and Its Effect
TABLE 1
Rice accessions studied
Ecotype from IRGC no. orAccession name passport data Country of origin USDA no. (PI)
ARC5756a,b Unknown India IRGC 20220Ashmber Aman Bangladesh IRGC 27522Aus 449a,b Unknown Bangladesh IRGC 29230Aus251a,b Unknown Bangladesh IRGC 29043Aus32a,b Unknown Bangladesh IRGC 28895Ausha Boro Boro Bangladesh IRGC 27508Badal 1b Aus Bangladesh IRGC 37362Bageria,b Unknown Nepal IRGC 16193Bangaluwaa,b Unknown Nepal IRGC 16268Bashiraj Aman Bangladesh IRGC 26298Battiboro Boro Bangladesh IRGC 37005Beri Aus Bangladesh IRGC 25841Bhim Dhan Unknown Nepal PI 596818Biolam Aman Bangladesh IRGC 49070BJ1b,c Unknown India IRGC 27526Boro Boro Bangladesh IRGC 27511Boro Aus and Boro Bangladesh IRGC 49159Burimural Aus Bangladesh IRGC 49164Chandra Har Aman Bangladesh IRGC 31754Chikon Shonib Aus Bangladesh IRGC 64771Chinsurah Boro IId UnknownCut Keureusek Unknown Indonesia IRGC 66540DB3a,b Unknown Bangladesh IRGC 8631Devarasia,b Unknown Nepal IRGC 16173DF1a,b Unknown Bangladesh IRGC 8365Dhan Unknown Nepal PI 549215Dhariab Aus Bangladesh IRGC 64773Dholai Moni Boro Bangladesh IRGC 53492Dholi Boro Boro Bangladesh IRGC 27513DL5a,b Unknown Bangladesh IRGC 8593DNJ142a,b Unknown Bangladesh IRGC 8426Dudhia,b Unknown Nepal IRGC 16256Dumpja Kaap Unknown Bhutan IRGC 64890DV139a,b Unknown Bangladesh IRGC 8870DV29a,b Unknown Bangladesh IRGC 8816DV32a,b Unknown Bangladesh IRGC 8818DV85a,b Unknown Bangladesh IRGC 8839DV86a,b Unknown Bangladesh IRGC 8840DZ192b Unknown Bangladesh PI 403366DZ78a,b Unknown Bangladesh IRGC 8555Gariab Aus Bangladesh IRGC 25854Ghuni Boro Boro Bangladesh IRGC 27515Girresa Unknown Sri Lanka IRGC 66512Gokhue Saier Unknown Nepal IRGC 16195Janeri Unknown Nepal PI 400662Jumli Marshi Unknown Nepal PI 596816Jumula 2b Unknown Nepal PI 400021Kal Shonib Aus Bangladesh IRGC 64780Kaliboro 600a,b Unknown Bangladesh IRGC 29367Kalo Unknown Nepal PI 596824Karar Vadui Aus Bangladesh IRGC 53527Katar Vadui Aus Bangladesh IRGC 53527Kathmandu Valley no. 1 selection Unknown Nepal PI 400718Kaun Kaek Unknown Cambodia IRGC 22894Khagrai Digha Aman Bangladesh IRGC 53530Koimuralib Aus Bangladesh IRGC 49222Kumri Boro Boro Bangladesh IRGC 27518
(continued)
Dow
nloaded from https://academ
ic.oup.com/genetics/article/165/2/759/6050338 by guest on 25 D
ecember 2021
762 A. J. Garris, S. R. McCouch and S. Kresovich
TABLE 1
(Continued)
Ecotype from IRGC no. orAccession name passport data Country of origin USDA no. (PI)
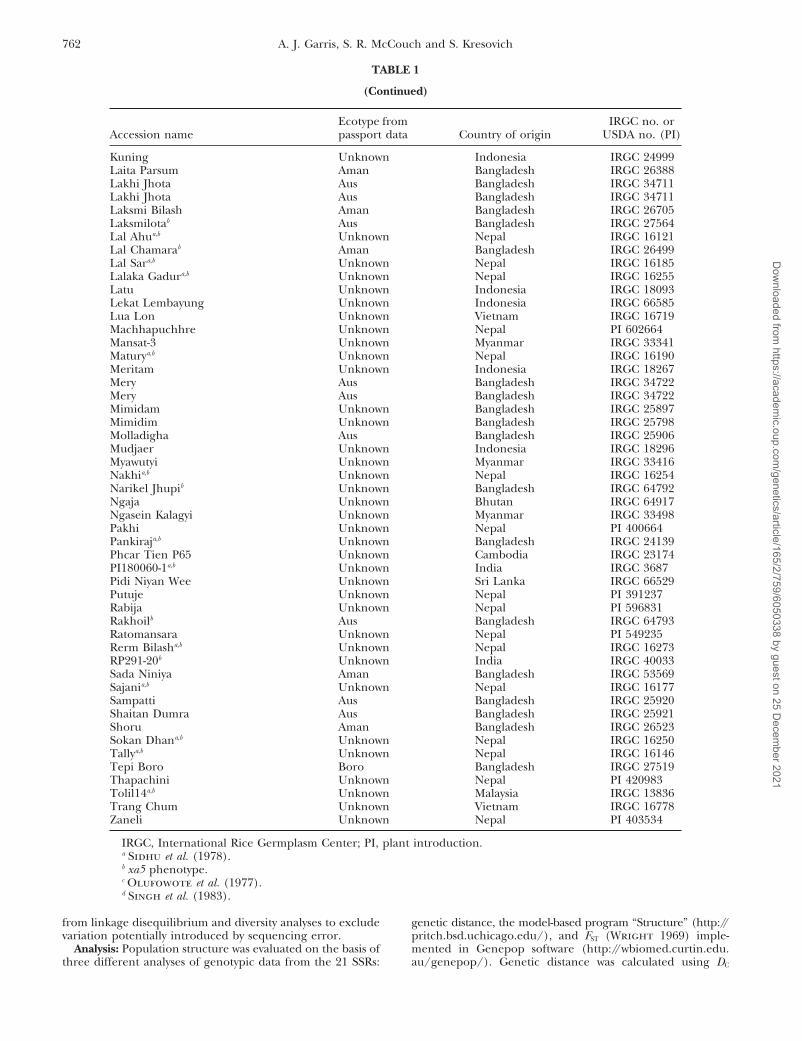
Kuning Unknown Indonesia IRGC 24999Laita Parsum Aman Bangladesh IRGC 26388Lakhi Jhota Aus Bangladesh IRGC 34711Lakhi Jhota Aus Bangladesh IRGC 34711Laksmi Bilash Aman Bangladesh IRGC 26705Laksmilotab Aus Bangladesh IRGC 27564Lal Ahua,b Unknown Nepal IRGC 16121Lal Chamarab Aman Bangladesh IRGC 26499Lal Sara,b Unknown Nepal IRGC 16185Lalaka Gadura,b Unknown Nepal IRGC 16255Latu Unknown Indonesia IRGC 18093Lekat Lembayung Unknown Indonesia IRGC 66585Lua Lon Unknown Vietnam IRGC 16719Machhapuchhre Unknown Nepal PI 602664Mansat-3 Unknown Myanmar IRGC 33341Maturya,b Unknown Nepal IRGC 16190Meritam Unknown Indonesia IRGC 18267Mery Aus Bangladesh IRGC 34722Mery Aus Bangladesh IRGC 34722Mimidam Unknown Bangladesh IRGC 25897Mimidim Unknown Bangladesh IRGC 25798Molladigha Aus Bangladesh IRGC 25906Mudjaer Unknown Indonesia IRGC 18296Myawutyi Unknown Myanmar IRGC 33416Nakhia,b Unknown Nepal IRGC 16254Narikel Jhupib Unknown Bangladesh IRGC 64792Ngaja Unknown Bhutan IRGC 64917Ngasein Kalagyi Unknown Myanmar IRGC 33498Pakhi Unknown Nepal PI 400664Pankiraja,b Unknown Bangladesh IRGC 24139Phcar Tien P65 Unknown Cambodia IRGC 23174PI180060-1a,b Unknown India IRGC 3687Pidi Niyan Wee Unknown Sri Lanka IRGC 66529Putuje Unknown Nepal PI 391237Rabija Unknown Nepal PI 596831Rakhoilb Aus Bangladesh IRGC 64793Ratomansara Unknown Nepal PI 549235Rerm Bilasha,b Unknown Nepal IRGC 16273RP291-20b Unknown India IRGC 40033Sada Niniya Aman Bangladesh IRGC 53569Sajania,b Unknown Nepal IRGC 16177Sampatti Aus Bangladesh IRGC 25920Shaitan Dumra Aus Bangladesh IRGC 25921Shoru Aman Bangladesh IRGC 26523Sokan Dhana,b Unknown Nepal IRGC 16250Tallya,b Unknown Nepal IRGC 16146Tepi Boro Boro Bangladesh IRGC 27519Thapachini Unknown Nepal PI 420983Tolil14a,b Unknown Malaysia IRGC 13836Trang Chum Unknown Vietnam IRGC 16778Zaneli Unknown Nepal PI 403534
IRGC, International Rice Germplasm Center; PI, plant introduction.a Sidhu et al. (1978).b xa5 phenotype.c Olufowote et al. (1977).d Singh et al. (1983).
from linkage disequilibrium and diversity analyses to exclude genetic distance, the model-based program “Structure” (http://pritch.bsd.uchicago.edu/), and FST (Wright 1969) imple-variation potentially introduced by sequencing error.
Analysis: Population structure was evaluated on the basis of mented in Genepop software (http://wbiomed.curtin.edu.au/genepop/). Genetic distance was calculated using DCthree different analyses of genotypic data from the 21 SSRs:
Dow
nloaded from https://academ
ic.oup.com/genetics/article/165/2/759/6050338 by guest on 25 D
ecember 2021

763Population Structure and Its Effect
TABLE 2
Amplicon names, lengths, and matches to genes in the TIGR gene index
Marker name Length Gene Score Function
RS1 148 NoneRS2 345 NoneRS4 283 NoneRS5 139 NoneRS6 254 NoneRS7 334 NoneRS8 250 NoneRS9 180 NoneRS11 321 BE039874 245 8.5e-06 UnknownRS12 243 NoneRS13 363 NoneRS14 225 NoneRS15 367 TC84724 261 2.1e-06 Putative tRNA synthaseRS16 233 TC92643 438 1.3e-14 UnknownRS17 217 NoneRS18 237 TC93981 491 1.1e-17 UnknownRS19 239 NoneRS21 347 BI807280 239 5.6e-06 Unknown
(Cavalli-Sforza and Edwards 1967). Phylogenetic recon- a model with three populations. These results providedstruction was based on the neighbor-joining method (Saitou evidence for substructure within the indica group, for-and Nei 1987) implemented in PowerMarker, a free genetic
malizing the subclusters into two populations: one con-analysis software package distributed by Kejun Liu (kliu2@sisting mainly of aman ecotypes and another consistingunity.ncsu.edu). Linkage disequilibrium, diversity, and recom-
bination analyses of sequence data were performed using of Nepali breeding lines. The third model-derived popu-SITES (http://lifesci.rutgers.edu/heylab/ProgramsandData/ lation corresponded to the aus-boro group of the dis-Programs/SITES/SITES_Documentation.htm) and dipdat tance-based analysis. Only four accessions differed insoftware (http://home.uchicago.edu/rhudson1/source/misc/
their population assignment by the two approaches;dipld/). Linkage disequilibrium was plotted as the squaredthese were individuals that clustered with the indica’scorrelation coefficient r 2. The minimum set of recombination
intervals was calculated as in Hudson and Kaplan (1985). in the genetic distance analysis but were assigned to theAssociation tests were performed using Strat software (http:// aus-boro group in the model-based analysis.pritch.bsd.uchicago.edu/). When FST values were computed using the model-
based population subdivisions for two and three popula-tions (Table 3), they showed a high degree of popula-
RESULTStion structure (overall FST for two populations � 0.89;
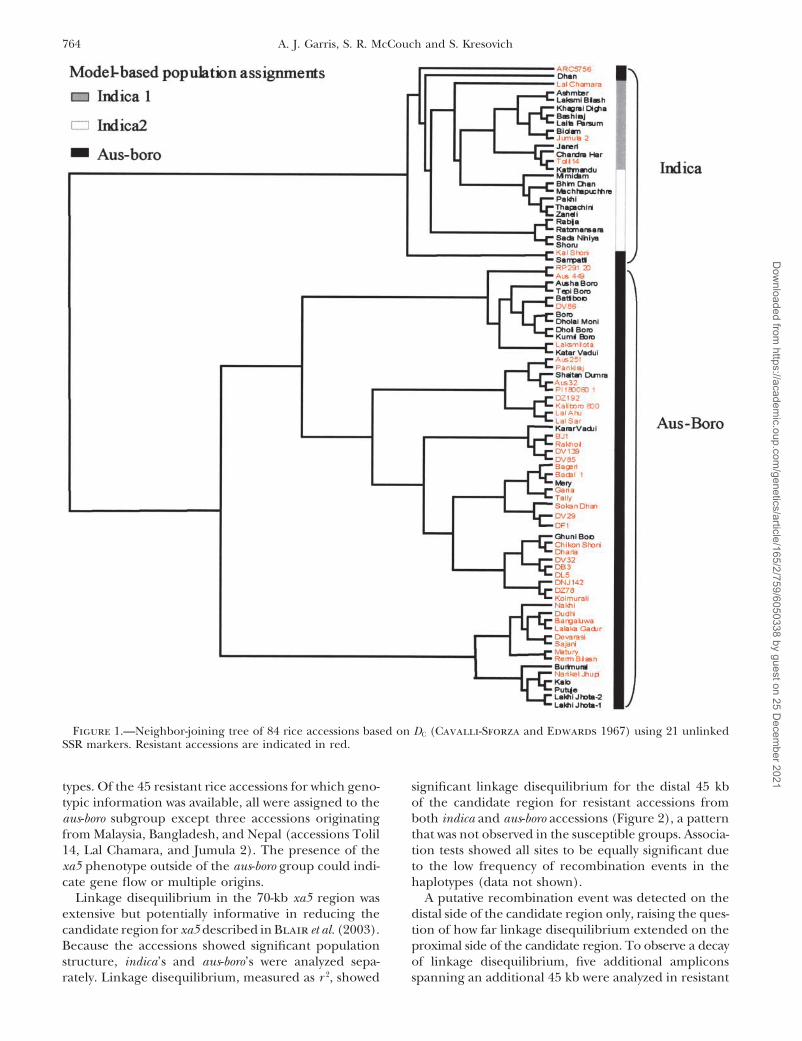
Significant divergence among ecotypes was found by overall FST for three populations � 0.85). There was ausing all measures for population structure. Distance- higher FST for the pairwise comparison of the aus-borobased analysis of 84 accessions detected two major clus- group with the indica group than between the two indicaters, as illustrated in Figure 1. Although ecotypic des- groups, indicating that the aus-boro subgroup was moreignation was not available for all accessions, enough differentiated from the indica groups than either wassamples of aus, boro, and aman ecotypes were available from the other. Because the sample size was small for theto anchor the ecotype identities of the clusters (Table indica group and because several samples were breeding1). The first group consisted of the Bangladeshi indica lines that were closely related, these two groups wererice ecotype called aman, breeding lines and landraces treated as one for the remaining analyses. The popula-from Nepal of unknown ecotype, and a single accession tion structure data support a hypothesis of hierarchicalfrom Malaysia, hereafter referred to as indica. The sec- levels of divergence within rice, with greater divergenceond group was populated by aus and boro ecotypes, between the indica and aus-boro groups and no detect-mainly from Bangladesh and Nepal, as well as accessions able divergence between the aus and boro ecotypes atof unknown ecotype. this level of genomic resolution. This suggests that the
Results from model-based analysis generally concur divergence between the indica and aus-boro ecotypes iswith the relationships determined by genetic distance more ancient than that between the aus and boro ecotypes.analysis. In this study, the model-based analysis gave Analysis of the xa5 phenotype in relation to popula-high significance levels for several theoretical popula- tion structure analysis of the accessions confirmed the
presence of xa5 in the Bangladeshi aus and boro eco-tion sizes, but the highest posterior probability was for
Dow
nloaded from https://academ
ic.oup.com/genetics/article/165/2/759/6050338 by guest on 25 D
ecember 2021
764 A. J. Garris, S. R. McCouch and S. Kresovich
Figure 1.—Neighbor-joining tree of 84 rice accessions based on DC (Cavalli-Sforza and Edwards 1967) using 21 unlinkedSSR markers. Resistant accessions are indicated in red.
types. Of the 45 resistant rice accessions for which geno- significant linkage disequilibrium for the distal 45 kbof the candidate region for resistant accessions fromtypic information was available, all were assigned to the
aus-boro subgroup except three accessions originating both indica and aus-boro accessions (Figure 2), a patternthat was not observed in the susceptible groups. Associa-from Malaysia, Bangladesh, and Nepal (accessions Tolil
14, Lal Chamara, and Jumula 2). The presence of the tion tests showed all sites to be equally significant dueto the low frequency of recombination events in thexa5 phenotype outside of the aus-boro group could indi-
cate gene flow or multiple origins. haplotypes (data not shown).A putative recombination event was detected on theLinkage disequilibrium in the 70-kb xa5 region was
extensive but potentially informative in reducing the distal side of the candidate region only, raising the ques-tion of how far linkage disequilibrium extended on thecandidate region for xa5 described in Blair et al. (2003).
Because the accessions showed significant population proximal side of the candidate region. To observe a decayof linkage disequilibrium, five additional ampliconsstructure, indica’s and aus-boro’s were analyzed sepa-
rately. Linkage disequilibrium, measured as r 2, showed spanning an additional 45 kb were analyzed in resistant
Dow
nloaded from https://academ
ic.oup.com/genetics/article/165/2/759/6050338 by guest on 25 D
ecember 2021

765Population Structure and Its Effect
TABLE 3
Overall and pairwise estimates of FST for 21 SSR loci, usingmodel-based population subdivisions
Subdivision Indica Overall
Aus-Boro 0.2103 —Combined — 0.8914
Subdivision Indica 1 Indica 2 Overall
Figure 3.—The decay of linkage disequilibrium betweenIndica 2 0.1762 — —all pairs of SNP loci in the region, shown as a function ofAus-Boro 0.2654 0.2462 —the distance between the loci. Linkage disequilibrium wasCombined — — 0.8483 measured as r 2.
ple origins or is genetically heterogeneous. Sequenceaccessions and added to the previous data set. Resultsdiversity and haplotype structure were assessed in aconfirmed that extensive linkage disequilibrium waslarger sample of 114 accessions at 13 amplicons in thepresent; r 2 approaches 0.1 only after 100 kb (Figure 3).xa5 candidate region. Additional accessions not ana-Analysis of haplotype diversity for xa5 indicates that
the xa5 resistance phenotype either derives from multi- lyzed previously were included for two purposes: to serve
Figure 2.—Pairwise value for r 2 between all pairs of SNP loci, analyzed by population and phenotype: (A) aus-boro resistant.(B) aus-boro susceptible. (C) Non-aus-boro resistant. (D) Non-aus-boro susceptible. The shade of blue indicates the value for r 2.The position of each site in the candidate region is indicated by lines that connect the loci with a chromosomal segment, labeledwith physical distance measured in kilobase pairs. Candidate genes, represented by numbered boxes below the chromosomesegment, are 1, putative ABC transporter; 2, putative TFIIa small subunit; 3, putative 23.6-kD protein; 4, putative tRNA synthase;5, putative 46.2-kD protein; 6, putative 61.5-kD kinase; 7, hypothetical 33.3-kD protein; 8, putative cysteine protease. Arrowsindicate the direction of transcription.
Dow
nloaded from https://academ
ic.oup.com/genetics/article/165/2/759/6050338 by guest on 25 D
ecember 2021

766 A. J. Garris, S. R. McCouch and S. Kresovich
Figure 4.—Illustration of the 26 SNP haplotypes in the 70-kb candidate region for xa5. For each site, a dash represents themore common nucleotide, and a circle represents the more rare nucleotide. The vertical lines below indicate the predictedrecombination intervals (Hudson and Kaplan 1985). The haplotypes are arranged in order of the tips of a neighbor-joiningtree, so that more similar haplotypes are clustered. Numbers in parentheses indicate the number of accessions containing thathaplotype. The phenotypes (R, all resistant; S, all susceptible; R/S, both resistant and susceptible accessions; RR2, resistant toXoo race 2 only; RR3 resistant to Xoo race 3 only; MRR1, moderately resistant to Xoo race 1 only), the populations, and thecountries of origin are listed to the right of the haplotypes. An asterisk indicates a haplotype present in accessions that had beenallele tested.
as indica outgroups and to allow examination of possible bor-joining diagram. At total of 10 different haplotypeswere present in resistant accessions. Haplotypes associ-additional sources of xa5. To this end, 12 accessions
from Southeast Asia (Cambodia, Vietnam, Indonesia, ated with resistance in the aus-boro ecotypes were verydifferent from haplotypes associated with resistance inand Myanmar) were included; all exhibited the xa5 phe-
notype reaction profile and had previously been identi- the indica ecotypes (Figure 4). A set of 4 highly similarhaplotypes predominated in the aus-boro accessions thatfied as members of the DZ192 varietal group by IRRI.
However, these accessions had not been allele tested had been allele tested for xa5. This cluster of highlysimilar haplotypes (numbers 23, 24, 25, and 26) formedfor xa5.
Sixty-six variable sites (with insertion-deletions counted the bulk of xa5-containing accessions in the sample andincludes DZ192, the original donor of xa5. A putativeas a single site) in the 4725 bp of sequence from 13
amplicons in the xa5 region were observed, resulting recombination event in haplotype 23, with a haplotypein higher frequency in susceptible accessions, suggestsin a frequency of one SNP per 100 bp. The 66 variable
sites were organized into 26 distinct haplotypes in the that the distal side of the candidate region is not in-volved in resistance. However, the possibility of recombi-70-kb candidate region (Figure 4). Because of the great
divergence between haplotypes and the absence of an nation with the resistant (but not allele tested) haplo-type 11 or of double recombination cannot be excluded.outgroup to determine ancestral polymorphisms, it was
not possible to build a single haplotype network to in- Furthermore, there were distinctive haplotypes in twoallele-tested accessions, one from Malaysia and the otherclude them all (data not shown). Figure 4 displays the
haplotypes in the order in which they appear in a neigh- from Bangladesh. In addition to the major cluster of
Dow
nloaded from https://academ
ic.oup.com/genetics/article/165/2/759/6050338 by guest on 25 D
ecember 2021

767Population Structure and Its Effect
resistant haplotypes in the aus-boro group, allele-tested tected by SSRs in the present study had been observed inprevious studies employing isozymes (15 loci), amplifiedaccession Aus 449 had a haplotype that was distinct from
the others, and it was very similar (1/66 sites differed) fragment length polymorphisms (AFLPs; 179 bands),and randomly amplified polymorphic DNAs (RAPDs;to a haplotype found in accessions showing complete
susceptibility or moderate resistance to Xoo race 1. With- 35 bands; Glaszmann 1987; Zhu et al. 1998; Parsonset al. 1999). The mixing of aus and boro genotypes wasin phenotypically resistant non-aus-boro accessions that
had not been allele tested for xa5, there were 4 addi- noted in the isozyme and RAPD studies, but was notaddressed in the AFLP analysis. The fact that 21 SSRtional related haplotypes, but there they are not sup-
ported by accessions that were allele tested for xa5, so markers give similar results to the other marker systemsattests to the utility of multi-allelic, highly variable SSRthis may indicate genetic heterogeneity for resistance.
In general, each haplotype was found in a single sub- markers for detecting population differentiation as wellthe depth of population structure in rice. It contrastspopulation, and frequently several closely related haplo-
types were found in the same subpopulation. Haplo- with an outcrossing species such as maize, with a differ-ent evolutionary history, where a greater number oftypes 1–9, 11, 15, 16, and 20–22 were found in indica
ecotypes. Aus-boro accessions contained haplotypes 10, markers may be required to detect population structure.It is interesting to note that the differentiation between12, 13, 14, and 23–26. The apparent restriction of a
haplotype to a specific, genetically defined subpopula- aus and boro rices, which is meaningful in the farmingsystem, is invisible with this low genomic resolution.tion did not preclude a wide geographical distribution.
The detection of the global distribution of haplotypes This could indicate a recent divergence between ausand boro rices or continuing gene flow between them.was hindered because of the strategy to sample acces-
sions from Bangladesh and Nepal, where the resistance The frequency of nucleotide polymorphisms in thissample was 1 SNP per 100 bp. This is lower than thatallele was expected to be in highest frequency. However,
the example of haplotype 3, which was present in rice of maize, where the frequency of SNP polymorphismin US elite inbred germplasm was 1 SNP per 48 bp incollected from Vietnam, Cambodia, Indonesia, My-
anmar, and Bangladesh, attests to the global spread of noncoding regions and 1 SNP per 131 bp in codingregions (Bhattramakki et al. 2002). The estimate forcertain haplotypes and suggests that geographic origin
may be a poor indicator of genetic distance. SNP frequency in rice in this study is more similar topreliminary data from sorghum, which, like rice, hasThe data showed a high-enough level of diversity both
within and between populations for effective mapping low outcrossing rates (Pedersen et al. 1998), where theestimated frequency is 1 SNP per 102 bp (average n �and indicated a higher role for mutation than for recom-
bination in generating the observed haplotype diversity. 25.45; M. Hamblin, personal communication). How-ever, because this study included only a few indica’s fromThe sequenced amplicons containing the 66 variable
sites were predominantly noncoding, although parts of outside of Bangladesh, and therefore represents a smallsampling of their wide geographic range and no tropicalfive amplicons had significant matches to genes in the
TIGR gene index (Table 2). Of the variable sites, 4 were or temperate japonicas or aromatic rices, the accessionsincluded in this study do not represent the full diversityinsertion-deletions ranging in length from 1 to 33 bp
and 62 were SNPs. of rice. It is possible that different genomic regions andsampling will offer different views of both the frequencyVariation in the xa5 region was similarly distributed
between the indica and aus-boro ecotypes, despite the and the distribution of polymorphism and recombination.Estimates of linkage disequilibrium are important asmuch larger sample size for the aus-boro’s. Specifically,
50 sites varied within the aus-boro subpopulation and 53 an indicator of how useful linkage-disequilibrium-basedtrait mapping approaches may be compared to othersites within the indica’s. The 13 additional variable sites
were found in outgroups and nonallele-tested acces- available methods on the basis of the tradeoff betweenpopulation size and informativeness. If linkage disequi-sions of xa5. Many haplotypes (n � 11) differ from their
most similar haplotype by a single site, indicating an librium declines rapidly, genome scans will require anexcessive marker density, but the testing of candidateimportant role for mutation in generating haplotype
diversity. In contrast, the minimum set of recombination genes is feasible. If linkage disequilibrium is too large,resolution may be low, but genome scans are viable.intervals is four, indicated in Figure 4. There is evidence
for recombination only in haplotypes 7, 17, and 23. The linkage disequilibrium decay at 100 kb observed inthis study would require an average of one marker percentimorgan (1 cM � 200–300 kb; Feng et al. 2002;
DISCUSSIONSasaki et al. 2002), and these results suggest that link-age disequilibrium mapping strategies could provideThe analysis of population structure underscores the
need for genetic analysis of ecotypic differentiation if greater resolution (because of the higher recombina-tion rate) than primary quantitative trait locus (QTL)linkage disequilibrium and association mapping ap-
proaches are to be of value in rice improvement. The mapping, where populations with 200–300 individualsare typically surveyed with 150–200 markers and resultdivergence between indica and aus-boro ecotypes de-
Dow
nloaded from https://academ
ic.oup.com/genetics/article/165/2/759/6050338 by guest on 25 D
ecember 2021
768 A. J. Garris, S. R. McCouch and S. Kresovich
in QTL typically 10–20 cM in size. However, to generate locus, because the Philippine Xoo races contain multipleavirulence (avr) proteins, which could interact with suscep-a whole-genome scan that captures the resolution of-
fered by LD mapping, such a study would require the tibility alleles at other loci in the rice genome.More evidence for genetic heterogeneity is that someuse of �1500 well-distributed markers. Thus, most appli-
cations of LD mapping are likely to be limited to regions non-allele-tested, resistant accessions from the pre-sumed indica group originating in Southeast Asia havepreviously delimited by QTL analysis or by candidate
gene studies. In these cases, association mapping offers a haplotype that differs from the aus-boro resistant haplo-type and is identical to some susceptible accessions.the advantage of exploring the relationship between
phenotype and a broad array of genotypic variants at a Because these accessions were not allele tested, it ispossible that another locus confers the phenotype, afavorable level of resolution in a specified target region.
Because linkage disequilibrium is likely to extend be- hypothesis that could be confirmed by genetic mapping.Alternately, it could be a different resistance allele atyond a single gene in rice, the application differs greatly
from maize where genes already known to be associated this locus; if the recessive nature of the gene is indica-tive of a knock-out mutation, the phenotype could bewith a trait can be tested to identify the functional nucle-
otide polymorphisms (Thornsberry et al. 2001). More achieved by many possible nucleotide changes. Onceagain, it is also possible that the relevant mutation couldstudies will be required to determine if the extent of
linkage disequilibrium reported here is typical of other be so recent that recombination has not occurred tosufficiently reduce linkage disequilibrium.subpopulations and loci in rice.
In this sample, significant linkage disequilibrium Genetic heterogeneity for a trait would require care-ful sampling if linkage disequilibrium and association(r 2 � 0.1) persisted between sites up to 100 kb apart.
This is the same order of magnitude as linkage disequi- mapping were to be employed. If alleles in rice havearisen after the diversification into subpopulations andlibrium observed at the FRIGIDA flowering time locus
in A. thaliana, where significant linkage disequilibrium their isolation has been enforced by limited gene flow,this situation would represent a violation of the commonwas detected between pairs of sites up to 250 kb apart
(Hagenblad and Nordborg 2002; Nordborg et al. assumption for association mapping, the common dis-ease common variant hypothesis, which proposes that2002). As expected, these estimates differ greatly from
the limited linkage disequilibrium observed in outcross- common variants are responsible for the genetic riskfor certain diseases (Lander 1996). This would reduceing species like maize where linkage disequilibrium fre-
quently decays at distances between 100 bp and 1.5 kb the power to detect the association between genotypeand phenotype and suggests that larger sample sizes(Remington et al. 2001; Tenaillon et al. 2001; Thorns-
berry et al. 2001). In addition, it is possible that the could be necessary. At this time, little information isavailable on the distribution of alleles in subpopulationsxa5 locus is under selection and would therefore be
predicted to have more extensive linkage disequilibrium of rice. In a study of the haplotype at the waxy locusthat confers glutinous texture to rice, the glutinous hap-than a locus evolving neutrally.
The resolution of the origin of xa5 and the allelic lotype was found mainly in temperate and tropical japon-ica’s and in only a few indica accessions (Olsen anddiversity for resistance was not possible with this data set.
The xa5 phenotype was found predominantly within the Purugganan 2002). This trait would be expected to beunder strong selection due to cultural preference, sogenetically defined aus-boro subpopulation. However,
the presence of the phenotype in a few accessions in one might expect limited gene flow. It is not knownhow this would differ for traits affecting biotic or abioticthe indica group raises the possibility of independent
origins of this phenotype in different subpopulations, stress resistance.A similar example of genetic heterogeneity was foundparticularly when haplotypic data are considered. Within
the aus-boro subpopulation one very common haplotype for the early flowering FRIGIDA locus in Arabidopsis.The early flowering haplotype in Central Asia differswas associated with the xa5 reaction profile; however,
very different haplotypes were associated with resistance from that found in the rest of the early-flowering acces-sions (Hagenblad and Nordborg 2002), and eightin indica ecotypes.
Several lines of evidence suggest genetic heterogene- independent loss-of-function mutations at this locusconferring early flowering have been identified (Leity for the resistance phenotype. For instance, some
resistant, allele-tested accessions had haplotypes highly Corre et al. 2002). Both rice and Arabidopsis are pre-dominantly autogamous, and therefore the expectationsimilar to susceptible accessions (compare haplotype 18
to 19 and haplotype 6 to 7). It is possible that the relevant of a single origin of a phenotype that occurs acrosssubpopulations may be less plausible than in outcrossingdifferences lie in unsequenced regions and that recom-
bination has not broken the linkage. These pairs of species. This has implications for sampling in futurelinkage disequilibrium or association studies. Isolatedhaplotypes could be useful for examining candidate
genes for evidence of mutations because they would be populations, employed in the study of human diseases,may find their plant counterpart in the subpopulationsexpected to be highly similar at most positions. Another
possibility is that susceptibility is being caused by another of autogamous crop species, which can have the advan-
Dow
nloaded from https://academ
ic.oup.com/genetics/article/165/2/759/6050338 by guest on 25 D
ecember 2021
769Population Structure and Its Effect
et al., 2002 The extent of linkage disequilibrium in Arabidopsistage of a greater likelihood of having a single origin forthaliana. Nat. Genet. 30: 190–193.
a phenotype (Shifman and Darvasi 2001). However, Olsen, K. M., and M. D. Purugganan, 2002 Molecular evidence onthe origin and evolution of glutinous rice. Genetics 162: 941–950.because linkage disequilibrium may extend beyond a
Olufowote, J. O., G. S. Khush and H. E. Kauffman, 1977 Inheri-single gene, studies will require large sample sizes totance of bacterial blight resistance in rice. Phytopathology 67:
capture rare recombination events. 771–775.Parsons, B. J., H. J. Newbury, M. T. Jackson and B. V. Ford-Lloyd,The authors thank the International Rice Research Institute for
1999 The genetic structure and conservation of aus, aman andproviding rice accessions; Fumio Onishi for growth chamber assis-boro rices from Bangladesh. Genet. Res. Crop Evol. 46: 587–598.
tance; two anonymous reviewers for valuable comments; Sharon Pedersen, J. F., J. J. Toy and B. Johnson, 1998 Natural outcrossingMitchell, Matthew Blair, Anjali Iyer, Alexandra Casa, Julie Ho, Martha of sorghum and sudangrass in the central great plains. Crop Sci.Hamblin, Rebecca Nelson, and Ed Buckler for useful discussions; and 38: 937–939.Lois Swales for assistance with formatting the manuscript. A. Garris Petpisit, V., G. S. Khush and H. E. Kauffman, 1977 Inheritance
of resistance to bacterial blight in rice. Crop Sci. 17: 551–554.was supported by U.S. Department of Agriculture/Cooperative StatePritchard, J. K., and N. A. Rosenberg, 1999 Use of unlinked ge-Research Service competitive grant 97-35300-5101, representing Food
netic markers to detect population stratification in associationand Agricultural Sciences National Needs Graduate Fellowship instudies. Am. J. Hum. Genet. 65: 220–228.Plant Biotechnology.
Rafalski, A., 2002 Applications of single nucleotide polymorphismsin crop genetics. Curr. Opin. Plant Biol. 5: 107–111.
Remington, D. L., J. M. Thornsberry, Y. Matsuoka, L. M. Wilson,LITERATURE CITEDS. R. Whitt et al., 2001 Structure of linkage disequilibrium andphenotypic associations in the maize genome. Proc. Natl. Acad.Bhattramakki, D., M. Dolan, M. Hanafey, R. Wineland, D. VaskeSci. USA 98: 11479–11484.et al., 2002 Insertion-deletion polymorphisms in 3� regions of
Saitou, N., and M. Nei, 1987 The neighbor-joining method: a newmaize genes occur frequently and can be used as highly informa-method for reconstructing phylogenetic trees. Mol. Biol. Evol.tive markers. Plant Mol. Biol. 48: 539–547.4: 406–425.Blair, M. W., A. J. Garris, A. S. Ayer, B. Chapman, S. Kresovich
Sasaki, T., T. Matsumoto, K. Yamamoto, K. Sakata, T. Baba et al.,et al., 2003 High resolution genetic mapping and candidate2002 The genomic sequence and structure of rice chromosomegene identification at the xa5 locus for bacterial blight resistance1. Nature 420: 312–316.in rice (Oryza sativa L.) Theor. Appl. Genet. 107: 62–73.
Shifman, S., and A. Darvasi, 2001 The value of isolated populations.Brown, A. H. D., 1989 Core collections: a practical approach toNat. Genet. 28: 309–310.genetic resources management. Genome 31: 818–824.
Sidhu, G. S., G. S. Khush and T. W. Mew, 1978 Genetic analysisBuckler, E. S., and J. M. Thornsberry, 2002 Plant molecular diver-of resistance to bacterial blight in seventy cultivars of rice, Oryzasity and applications to genomics. Curr. Opin. Plant Biol. 5:sativa L. Theor. Appl. Genet. 53: 105–111.107–111.
Singh, R. J., G. S. Khush and T. W. Mew, 1983 A new gene forBusto, G. A., T. Ogawa, N. Endo, R. E. Tabien and R. Ikeda, 1990resistance to bacterial blight in rice. Crop Sci 23: 558–560.Distribution of genes for resistance to bacterial blight of rice in
Takahashi, N., 1997 Differentiation of ecotypes in cultivated rice.Asian countries. Rice Genet. Newsl. 7: 127.1. Adaptation to environments and ecotypic differentiation, pp.Cavalli-Sforza, L. L., and A. W. F. Edwards, 1967 Phylogenetic112–118 in Science of the Rice Plant, Vol. 3, Genetics, edited byanalysis: models and estimation procedures. Am. J. Hum. Genet.T. Matsuo and K. Hoshikawa. Food and Agriculture Policy19: 233–257.Research Center, Tokyo.Chen, X., S. Temnykh, Y. Xu, Y. G. Cho and S. R. McCouch, 1997
Temnykh, S., W. D. Park, N. Ayres, S. Cartinhour, N. Hauck et al.,Development of a microsatellite framework map providing ge-2000 Mapping and genome organization of microsatellite se-nome-wide coverage in rice, Oryza sativa L. Theor. Appl. Genet.quences in rice, Oryza sativa L. Theor. Appl. Genet. 100: 697–712.95: 553–567.
Temnykh, S., G. DeClerck, A. Lukashova, L. Lipovich, S. Cartin-Colosi, J. C., and B. A. Schaal, 1993 Tissue grinding with ball-hour et al., 2001 Computational and experimental analysis ofbearings and vortex mixer for DNA extraction. Nucleic Acidsmicrosatellites in rice (Oryza sativa L.): frequency, length varia-Res. 21: 1051–1052.tion, transposon associations, and genetic marker potential.Feng, Q., Y. Zhang, P. Hao, S. Wang, G. Fu et al., 2002 SequenceGenet. Res. 11: 1441–1452.and analysis of rice chromosome 4. Nature 420: 316–320.
Tenaillon, M. I., M. C. Sawkins, A. D. Long, R. L. Gaut, J. F.Glaszmann, J. C., 1987 Isozymes and classification of Asian riceDoebley et al., 2001 Patterns of DNA sequence polymorphismvarieties. Theor. Appl. Genet. 74: 21–30.
Hagenblad, J., and M. Nordborg, 2002 Sequence variation and along chromosome 1 of maize (Zea mays ssp. mays L.) Proc. Natl.haplotype structure surrounding the flowering time locus FRI in Acad. Sci. USA 98: 9161–9166.Arabidopsis thaliana. Genetics 161: 289–298. Thompson, J. D., D. G. Higgins and T. J. Gibson, 1994 CLUSTAL
Hudson, R. R., and N. L. Kaplan, 1985 Statistical properties of the W: improving the sensitivity of progressive multiple sequencenumber of recombination events in the history of a sample of alignment through sequence weighting, position specific gap pen-DNA sequences. Genetics 111: 147–164. alties and weight matrix choice. Nucleic Acids Res. 22: 4673–4680.
Kauffmann, H., A. P. K. Reddy, S. P. Y. Hsieh and S. D. Merca, Thornsberry, J. M., M. M. Goodman, J. Doebley, S. Kresovich,1973 An improved technique for evaluating resistance of rice D. Nielsen et al., 2001 Dwarf8 polymorphisms associate withvarieties to Xanthomonas oryzae. Plant Disease Rep. 57: 537–541. variation in flowering time. Nat. Genet. 28: 286–289.
Khush, G. S., 1997 Origin, dispersal, cultivation and variation of Wright, S., 1969 Evolution and the Genetics of Populations, Vol. 2.rice. Plant Mol. Biol. 35: 25–34. University of Chicago Press, Chicago.
Lander, E. S., 1996 The new genomics: global views of biology. Yang, D., A. Sanchez, G. S. Khush, Y. Zhu and N. Huang, 1998Science 274: 536–539. Construction of a BAC contig containing the xa5 locus in rice.
Le Corre, V. L., F. Roux and X. Reboud, 2002 DNA polymorphisms Theor. Appl. Genet. 97: 1120–1124.at the FRIGIDA gene in Arabidosis thaliana: extensive nonsynony- Yoshimura, A., T. W. Mew, G. S. Khush and T. Omura, 1984 Genet-mous variation is consistent with local selection for flowering ics of bacterial blight resistance in a breeding line of rice. Phytopa-time. Mol. Biol. Evol. 19: 1261–1271. thology 74: 773–777.
Mew, T. W., 1987 Current status and future prospects on bacterial Zhu, J., M. D. Gale, S. Quarrie, M. T. Jackson and G. J. Bryan,blight of rice. Annu. Rev. Phytopathol. 25: 359–382. 1998 AFLP markers for the study of rice biodiversity. Theor.
Nordborg, M., and S. Tavare, 2002 Linkage disequilibrium: what Appl. Genet. 96: 602–611.history has to tell us. Trends Genet. 18: 83–90.
Nordborg, M., J. O. Borevitz, J. Bergelson, C. C. Berry, J. Chory Communicating editor: H. Ochman
Dow
nloaded from https://academ
ic.oup.com/genetics/article/165/2/759/6050338 by guest on 25 D
ecember 2021

Dow
nloaded from https://academ
ic.oup.com/genetics/article/165/2/759/6050338 by guest on 25 D
ecember 2021