Population Pharmacokinetics and Pharmacodynamics of ... · ORIGINAL RESEARCH ARTICLE Population...
14
ORIGINAL RESEARCH ARTICLE Population Pharmacokinetics and Pharmacodynamics of Linagliptin in Patients with Type 2 Diabetes Mellitus Silke Retlich • Vincent Duval • Ulrike Graefe-Mody • Christian Friedrich • Sanjay Patel • Ulrich Jaehde • Alexander Staab Published online: 31 January 2015 Ó The Author(s) 2015. This article is published with open access at Springerlink.com Abstract Background and Objectives Linagliptin is a dipeptidyl peptidase (DPP)-4 inhibitor, used to treat type 2 diabetes mel- litus (T2DM). Population pharmacokinetic and pharmacody- namic analyses were performed to characterize the impact of clinically relevant intrinsic/extrinsic factors (covariates) on lina- gliptin exposure and DPP-4 inhibition in patients with T2DM. Methods Linagliptin plasma concentrations and DPP-4 activities were obtained from four studies (two phase 1, two phase 2b). Non-linear mixed-effects modelling techniques were implemented using NONMEM software. The covari- ates that were studied comprised demographic information and laboratory values, including liver enzyme levels and creatinine clearance, as well as study-related factors such as metformin co-treatment. Covariate effects on parameters describing the pharmacokinetics and pharmacokinetic/ pharmacodynamic relationship were investigated using stepwise forward inclusion/backward elimination. Results The pharmacokinetic analysis included 6,907 measurements of plasma linagliptin concentrations from 462 patients; the pharmacokinetic/pharmacodynamic analysis included 9,674 measurements of plasma DPP-4 activity and linagliptin plasma concentrations from 607 patients. The non-linear pharmacokinetics were described by a target- mediated drug disposition model accounting for the con- centration-dependent binding of linagliptin to its target, DPP-4. The difference in exposure between the 5th and 95th percentiles of the covariate distributions and median was \ 20 % for each single covariate. Likewise, the impact of the covariates on both the half-maximum effect (EC 50 ) and the concentration leading to 80 % DPP-4 inhibition was\ 20 %. Conclusion These analyses show that the investigated factors do not alter the pharmacokinetics and DPP-4 inhibitory activity of linagliptin to a clinically relevant extent and that dose adjustment is not necessary on the basis of factors including age, sex and weight. Key Points These analyses, reporting previously unpublished data on the pharmacokinetic and pharmacodynamic profile of linagliptin, show that factors including age, sex and weight do not alter the pharmacokinetics and dipeptidyl peptidase-4 inhibitory activity of linagliptin to a clinically relevant extent. These findings indicate there is no need for linagliptin dose adjustment on the basis of age, sex or weight, and they extend the findings of previous research that has shown that linagliptin does not require dose adjustment in patients with renal or hepatic impairment. Electronic supplementary material The online version of this article (doi:10.1007/s40262-014-0232-4) contains supplementary material, which is available to authorized users. S. Retlich (&) V. Duval C. Friedrich A. Staab Boehringer Ingelheim Pharma GmbH & Co. KG, Biberach, Germany e-mail: [email protected] U. Graefe-Mody Boehringer Ingelheim Pharma GmbH & Co. KG, Ingelheim, Germany S. Patel Boehringer Ingelheim Ltd., Bracknell, Berkshire, UK U. Jaehde Institute of Pharmacy, Clinical Pharmacy, University of Bonn, Bonn, Germany Clin Pharmacokinet (2015) 54:737–750 DOI 10.1007/s40262-014-0232-4
Transcript of Population Pharmacokinetics and Pharmacodynamics of ... · ORIGINAL RESEARCH ARTICLE Population...

ORIGINAL RESEARCH ARTICLE
Population Pharmacokinetics and Pharmacodynamicsof Linagliptin in Patients with Type 2 Diabetes Mellitus
Silke Retlich • Vincent Duval • Ulrike Graefe-Mody •
Christian Friedrich • Sanjay Patel •
Ulrich Jaehde • Alexander Staab
Published online: 31 January 2015
� The Author(s) 2015. This article is published with open access at Springerlink.com
Abstract
Background and Objectives Linagliptin is a dipeptidyl
peptidase (DPP)-4 inhibitor, used to treat type 2 diabetes mel-
litus (T2DM). Population pharmacokinetic and pharmacody-
namic analyses were performed to characterize the impact of
clinically relevant intrinsic/extrinsic factors (covariates) on lina-
gliptin exposure and DPP-4 inhibition in patients with T2DM.
Methods Linagliptin plasma concentrations and DPP-4
activities were obtained from four studies (two phase 1, two
phase 2b). Non-linear mixed-effects modelling techniques
were implemented using NONMEM software. The covari-
ates that were studied comprised demographic information
and laboratory values, including liver enzyme levels and
creatinine clearance, as well as study-related factors such as
metformin co-treatment. Covariate effects on parameters
describing the pharmacokinetics and pharmacokinetic/
pharmacodynamic relationship were investigated using
stepwise forward inclusion/backward elimination.
Results The pharmacokinetic analysis included 6,907
measurements of plasma linagliptin concentrations from 462
patients; the pharmacokinetic/pharmacodynamic analysis
included 9,674 measurements of plasma DPP-4 activity and
linagliptin plasma concentrations from 607 patients. The
non-linear pharmacokinetics were described by a target-
mediated drug disposition model accounting for the con-
centration-dependent binding of linagliptin to its target,
DPP-4. The difference in exposure between the 5th and 95th
percentiles of the covariate distributions and median was
\20 % for each single covariate. Likewise, the impact of the
covariates on both the half-maximum effect (EC50) and the
concentration leading to 80 %DPP-4 inhibition was\20 %.
Conclusion These analyses show that the investigated
factors do not alter the pharmacokinetics and DPP-4
inhibitory activity of linagliptin to a clinically relevant
extent and that dose adjustment is not necessary on the
basis of factors including age, sex and weight.
Key Points
These analyses, reporting previously unpublished
data on the pharmacokinetic and pharmacodynamic
profile of linagliptin, show that factors including age,
sex and weight do not alter the pharmacokinetics and
dipeptidyl peptidase-4 inhibitory activity of linagliptin
to a clinically relevant extent.
These findings indicate there is no need for
linagliptin dose adjustment on the basis of age, sex
or weight, and they extend the findings of previous
research that has shown that linagliptin does not
require dose adjustment in patients with renal or
hepatic impairment.
Electronic supplementary material The online version of thisarticle (doi:10.1007/s40262-014-0232-4) contains supplementarymaterial, which is available to authorized users.
S. Retlich (&) � V. Duval � C. Friedrich � A. StaabBoehringer Ingelheim Pharma GmbH & Co. KG, Biberach,
Germany
e-mail: [email protected]
U. Graefe-Mody
Boehringer Ingelheim Pharma GmbH & Co. KG, Ingelheim,
Germany
S. Patel
Boehringer Ingelheim Ltd., Bracknell, Berkshire, UK
U. Jaehde
Institute of Pharmacy, Clinical Pharmacy, University of Bonn,
Bonn, Germany
Clin Pharmacokinet (2015) 54:737–750
DOI 10.1007/s40262-014-0232-4
1 Introduction
Linagliptin (trade name: Trajenta�) is a dipeptidyl pepti-
dase (DPP)-4 inhibitor, which is approved by the US Food
and Drug Administration (FDA) and the European Medi-
cines Agency (EMA) for treatment of type 2 diabetes
mellitus (T2DM). Linagliptin has a unique pharmacokinetic
and pharmacodynamic profile within the DPP-4 inhibitor
class [1–4]. The pharmacokinetics and pharmacodynamics
of linagliptin have been evaluated in healthy subjects [5–7]
and in patients with T2DM [3]. Because of the high affinity
and saturable binding of linagliptin to DPP-4, and the
slow dissociation from the resulting enzyme–drug complex,
linagliptin shows concentration-dependent protein binding
in the therapeutic plasma concentration range, with the
unbound fraction of linagliptin rising with increasing total
linagliptin concentrations [4]. As a result, linagliptin shows
non-linear pharmacokinetics after both oral and intravenous
administration, with a less than dose-proportional increase
in plasma concentrations in the dose range of 1–10 mg [1, 3,
5]. Unlike other DPP-4 inhibitors, linagliptin is predomi-
nantly excreted unchanged in the faeces, with renal excre-
tion being only a minor elimination route [5, 7]. The
excretion of linagliptin in the faeces is thought to result
from both biliary excretion and direct P-glycoprotein-
mediated efflux into the gut [8]. These pharmacological
characteristics allow once-daily dosing of linagliptin 5 mg,
with no requirement for dose adjustment in patients with
renal impairment. At present, the linagliptin clinical trials
programme includes more than 4,000 patients from over 40
countries worldwide. Linagliptin 5 mg once daily has been
shown to improve glycaemic control, significantly reducing
glycated haemoglobin (HbA1c), fasting plasma glucose
(FPG) and postprandial glucose (PPG) levels from baseline,
compared with placebo [9–12].
To characterize the impact of clinically relevant covar-
iates on the pharmacokinetics of linagliptin and its inhi-
bition of plasma DPP-4 activity in patients with T2DM,
two investigations were performed: (1) a population phar-
macokinetic analysis; and (2) a population pharmacoki-
netic/pharmacodynamic analysis. The covariates weight,
sex and age were of particular interest, as no dedicated
phase 1 studies to investigate their effects on the pharma-
cokinetics/pharmacodynamics of linagliptin have been
conducted.
2 Methods
2.1 Study Design
Data were obtained from four studies performed in patients
with T2DM: two phase 1 studies (studies 1 and 2) and two
phase 2b studies (studies 3 and 4) [13, 14] (Table 1). In the
phase 1 studies, a full pharmacokinetic and DPP-4 activity
profile was taken on the first and last days of treatment,
with trough values measured during treatment, as indicated
in Table 1. In the phase 2b studies, plasma concentrations
and plasma DPP-4 activity were measured at trough and at
about 1 and 2 h after linagliptin administration at four
visits (at the visit when linagliptin was first administered,
then at three subsequent visits 4–5 weeks apart) and at the
follow-up visit (2–3 weeks after the final linagliptin
administration).
2.2 Data Analysis
For both population analyses, non-linear mixed-effects
modelling techniques were implemented using NONMEM
software (version V, level 1.1; GloboMax LLC, Hanover,
MD, USA). Investigation of the covariate effects on the
parameters describing the pharmacokinetics and the phar-
macokinetic/pharmacodynamic relationship was under-
taken using the stepwise forward inclusion/backward
elimination approach. Population modelling for the phar-
macokinetic and pharmacokinetic/pharmacodynamic anal-
yses are described separately below.
2.3 Population Pharmacokinetic Analysis
2.3.1 Base Model Development
A previously developed population pharmacokinetic model
for linagliptin (based on the two phase 1 studies) was used
as a starting point for the current analysis [15]. In the
previous analysis, linagliptin plasma concentrations were
best described by a two-compartment model, including
concentration-dependent protein binding in the central and
peripheral compartments. This prior model was tested and
was found to be suitable for describing the linagliptin
plasma concentrations obtained in the two phase 2b studies,
which were not included in the previous analysis. The
structural model used in the population pharmacokinetic
analysis is shown in Fig. 1.
2.3.2 Covariate Model Development
The covariates that were investigated were age, weight,
height, body surface area, sex, ethnic origin, smoking sta-
tus, alcohol consumption status, creatinine clearance
(CLCR), metformin co-medication, formulation, DPP-4
activity at baseline and levels of serum creatinine, alanine
transaminase (ALT), aspartate transaminase (AST), alka-
line phosphatase, gamma-glutamyl transferase (GGT), total
bilirubin, urea, creatine kinase, cholesterol, C-reactive
protein, triglycerides (TG) and FPG (Table 2).
738 S. Retlich et al.

Table 1 Summary of important design characteristics of the included studies
Study
1 2 3 4
Phase 1 1 2b 2b
Formulation Powder in bottle Tablet formulation 1 Tablet
formulation 2
Tablet
formulation 2
Linagliptin doses (mg) 1, 2.5, 5, 10 2.5, 5, 10 0.5, 2.5, 5 1, 5, 10
Duration 12 days 4 weeks 12 weeks 12 weeks
Number of patients on
linagliptin
35 61 170 196
Add-on to metformin No No No Yes
Sampling schemes for linagliptin plasma concentrations and plasma DPP-4 activity
Single-dose profile Day 1
Before and 0.5, 1, 1.5, 2, 3, 4, 6, 8 and 12 h after the first administration
Before and 1 and 2 h after the first
linagliptin administration
Ctrough during treatment Days 2–11 Days 2, 6, 12, 19, 26 and 27 At three subsequent visits 4–5 weeks
apart
Before linagliptin administration
Before linagliptin administration
Overnight sample Day 11
18 h after drug administration on
day 10
Day 28
18 h after drug administration on
day 27
–
Steady-state profile Day 12 Day 28 At three visits 4–5 weeks apart
1 and 2 h after linagliptin
administration
Before and 0.5, 1, 1.5, 2, 3, 4, 6, 8 and 12 h after administration
Samples after last dose Days 13, 14, 16, 18 and 20 Days 29, 30, 33, 36, 39, 41 and
43
At one visit, one sample 2–3 weeks
after the final linagliptin
administrationIn the morning
Ctrough trough plasma concentration, DPP-4 dipeptidyl peptidase-4
Fig. 1 Model structure of the population pharmacokinetic model.
Amax,P number of binding sites in the peripheral compartment, Bmax,C
concentration of binding sites in the central compartment, CL
clearance, conc. concentration, F bioavailability, Ka absorption rate
constant, Kd affinity constant, QP inter-compartmental clearance
between the central and peripheral compartments, VC central volume
of distribution, VP peripheral volume of distribution
Population PK/PD of Linagliptin in Type 2 Diabetes 739

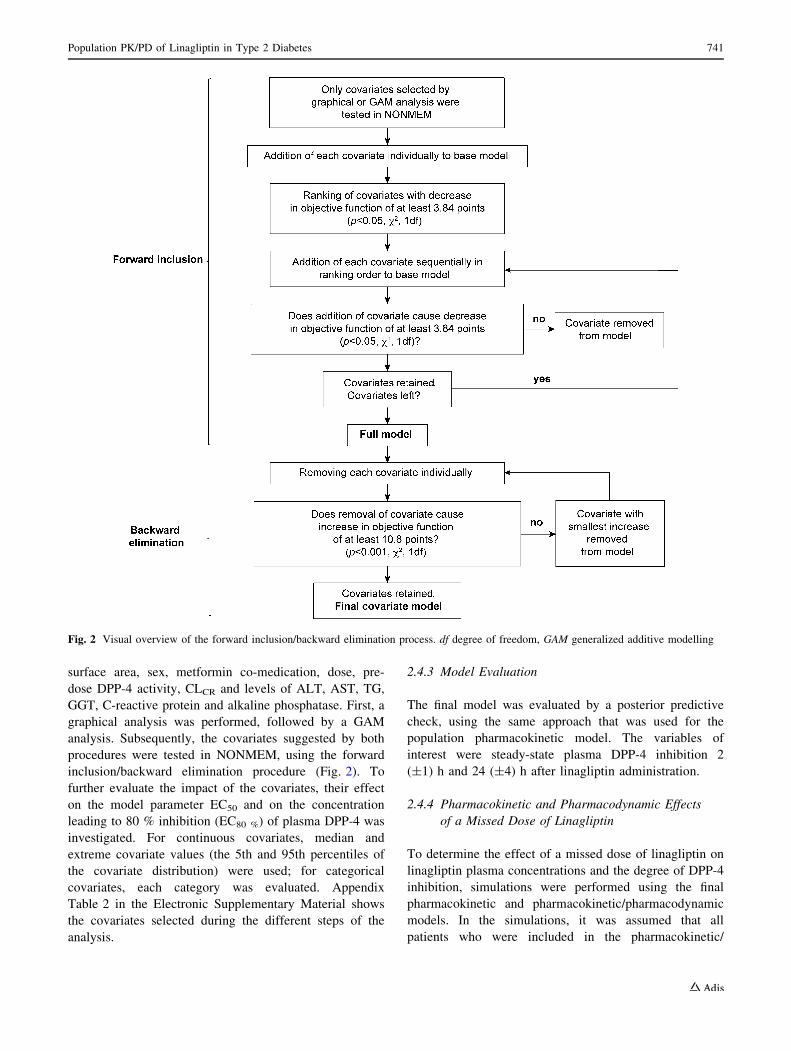
A graphical and a generalized additive modelling
(GAM) analysis was carried out using SPlus software
(version 7; Insightful Corporation, Seattle, WA, USA) to
select the covariates to be tested in the forward inclusion/
backward elimination approach, performed in NONMEM
(Fig. 2). Certain covariates were predefined on the basis
of physiological considerations to be tested in the forward
inclusion/backward elimination approach, independently
of the results of the graphical and GAM analyses. The
predefined covariates were age, sex and weight, since
these were of special interest, as no dedicated phase 1
studies have yet been performed for these, as well as
levels of liver enzymes (ALT and GGT) and CLCR.
Because of the extensive run times and high g-shrinkage(27 % bioavailability [F], 35 % clearance [CL], 22 %
absorption rate constant [Ka], 24 % concentration of
binding sites in the central compartment [Bmax,C] and
58 % central volume of distribution [VC]), the forward
inclusion/backward elimination approach [16] was adap-
ted: (1) a stricter inclusion criterion (p = 0.01 instead of
0.05, v2, 1 degree of freedom [df]) was applied; (2) major
parts of the analysis were conducted separately per model
parameter; i.e. only the typical pharmacokinetic parame-
ter, its inter- and intra-individual variability (where
applicable) and the covariate effects for the parameter of
interest were estimated, all other parameters remained
fixed to the base model values (for further detail on the
covariate selection process, see Appendix Table 1 in the
Electronic Supplementary Material). For the final step, the
impact of the statistically significant covariates on the
area under the plasma concentration–time curve (AUC) at
steady state during one dosing interval (AUCs,ss) with
linagliptin 5 mg was investigated (using Berkeley
Madonna software version 8.0.4; University of California,
Berkeley, CA, USA) to evaluate the clinical relevance of
the covariates.
2.3.3 Model Evaluation
Standard goodness-of-fit plots were performed to investi-
gate the description of the plasma concentrations. Fur-
thermore, the base model was evaluated by a visual
predictive check and the final model by posterior predictive
checks for the maximum and minimum plasma concen-
trations (Cmax and Cmin) of linagliptin. In the posterior
predictive check, the inter-individual, intra-individual and
residual variabilities were taken into account, but not the
uncertainty in the parameter estimates.
2.4 Population Pharmacokinetic/Pharmacodynamic
Analysis
2.4.1 Base Model Development
The initial plan was to simultaneously analyse linagliptin
plasma concentrations and DPP-4 activity. However, this
was not possible because of extensive run time ([5 days)
of the population pharmacokinetic model. As linagliptin
plasma concentrations and plasma DPP-4 activity were
measured at the same time points, and because of the direct
relationship between both measurements, with no hyster-
esis (data not shown), it was possible to correlate lina-
gliptin plasma concentrations directly to DPP-4 activity
without use of a pharmacokinetic model. To describe the
correlation between linagliptin plasma concentrations and
DPP-4 activity, a simple maximum effect (Emax) model and
a sigmoid Emax model were tested. Inter-individual vari-
ability was investigated for all typical parameters.
2.4.2 Covariate Model Development
The covariates investigated on parameters with inter-
individual variability were age, height, weight, body
Table 2 Covariates investigated by graphical and generalized additive modelling (GAM) analysis to select those to be tested in the forward
inclusion/backward elimination approach performed in NONMEM
Pharmacokinetic model parameter Covariate
All model parameters with inter-individual variability Demographic information: age, weight, height, body surface area, sex, ethnic
origin, smoking status and alcohol consumption status
Dose group
Absorption parameters with inter-individual variability Formulation
Distribution and elimination parameters with inter-
individual variability (including binding parameters)
Laboratory values: creatinine clearance and levels of serum creatinine, urea,
alanine transaminase, aspartate transaminase, alkaline phosphatase, gamma-
glutamyl transferase, total bilirubin, creatine kinase, cholesterol, C-reactive
protein, triglyceride and fasting plasma glucose
Metformin treatment, baseline DPP-4 activity in relative fluorescence units
DPP-4 dipeptidyl peptidase-4
740 S. Retlich et al.
surface area, sex, metformin co-medication, dose, pre-
dose DPP-4 activity, CLCR and levels of ALT, AST, TG,
GGT, C-reactive protein and alkaline phosphatase. First, a
graphical analysis was performed, followed by a GAM
analysis. Subsequently, the covariates suggested by both
procedures were tested in NONMEM, using the forward
inclusion/backward elimination procedure (Fig. 2). To
further evaluate the impact of the covariates, their effect
on the model parameter EC50 and on the concentration
leading to 80 % inhibition (EC80 %) of plasma DPP-4 was
investigated. For continuous covariates, median and
extreme covariate values (the 5th and 95th percentiles of
the covariate distribution) were used; for categorical
covariates, each category was evaluated. Appendix
Table 2 in the Electronic Supplementary Material shows
the covariates selected during the different steps of the
analysis.
2.4.3 Model Evaluation
The final model was evaluated by a posterior predictive
check, using the same approach that was used for the
population pharmacokinetic model. The variables of
interest were steady-state plasma DPP-4 inhibition 2
(±1) h and 24 (±4) h after linagliptin administration.
2.4.4 Pharmacokinetic and Pharmacodynamic Effects
of a Missed Dose of Linagliptin
To determine the effect of a missed dose of linagliptin on
linagliptin plasma concentrations and the degree of DPP-4
inhibition, simulations were performed using the final
pharmacokinetic and pharmacokinetic/pharmacodynamic
models. In the simulations, it was assumed that all
patients who were included in the pharmacokinetic/
Fig. 2 Visual overview of the forward inclusion/backward elimination process. df degree of freedom, GAM generalized additive modelling
Population PK/PD of Linagliptin in Type 2 Diabetes 741

pharmacodynamic data set received 5 mg linagliptin once
daily. After reaching steady state, the effect of a single
missed dose at a certain time was simulated.
3 Results
3.1 Data Set Description
The final data set of the pharmacokinetic analysis inclu-
ded 6,907 measurements of plasma linagliptin concen-
trations from 462 patients with T2DM. In general, the
plasma concentration–time profiles in the phase 2b studies
showed higher variability than those in the phase 1
studies. In addition, the linagliptin plasma concentrations
were apparently higher in study 4. The final data set of
the population pharmacokinetic/pharmacodynamic ana-
lysis included 9,674 measurements of plasma DPP-4
activity and corresponding linagliptin plasma concentra-
tions from 607 patients (receiving active treatment and
placebo). Baseline demographic and laboratory data from
the four included studies are shown in Table 3, as well as
the numbers of patients from each trial included in the
data set.
3.2 Population Pharmacokinetic Analysis
The linagliptin plasma concentrations in all included
studies were adequately described by the initial model
structure, which takes into account the binding of lina-
gliptin to its target, DPP-4. The higher variability in the
phase 2b studies was accounted for by different residual
variability estimates dependent on the study type (DOBJF-2,257). The higher exposure in study 4 was best descri-
bed by higher relative bioavailability in this study (DOBJF-65).
In addition to higher bioavailability estimated for the
add-on to metformin study 4, the covariate analysis iden-
tified the following covariates as having a statistically
significant impact on linagliptin pharmacokinetics
(Table 4):
• The relative bioavailability was found to decrease with
increasing weight (DOBJF 15).
• The rate of absorption was dependent on the dose
(DOBJF 27) and study/formulation (DOBJF 34). The
typical rate of absorption in study 1 (powder in the
bottle formulation) was 0.933 1/h, compared with a
lower rate with both tablet formulations (0.795 1/h [in
study 2] and 0.441 1/h [in studies 3 and 4]).
• Bmax,C, estimated by the model, which was likely to be
a reflection of the plasma DPP-4 concentration,
correlated with the pre-dose DPP-4 activity (DOBJF68), dose (DOBJF 69) and age (DOBJF 14).
In comparison to the base model, the inter-individual
variability decreased only for Ka (76.4 versus 87.6 %) and
Bmax,C (15.0 versus 29.6 %) and was in the same range for
bioavailability (F), CL and VC, indicating that only a small
part of the inter-individual variability was accounted for by
the investigated covariates.
Apart from some slightmodelmisspecification around the
Cmax value, the goodness-of-fit plots showed agreement
between the observed plasma concentrations and the model
predictions, indicating that the model performed adequately
(see Appendix Fig. 1 in the Electronic Supplementary
Material), as did the visual predictive checks for the base
model (seeAppendix Fig. 2 in the Electronic Supplementary
Material). Posterior predictive checks showed that the final
model provided an adequate description of the trough plasma
concentration (Ctrough) and Cmax values (except for the Cmax
values of the lowest [0.5 mg] and highest [10 mg] dose
groups, which were slightly outside the 90 % confidence
interval, although showing only a small absolute difference;
for further detail, see Appendix Fig. 3 in the Electronic
Supplementary Material).
Table 3 Baseline demographic and laboratory information
Pharmacokinetics
(n = 462)
Pharmacokinetics/
pharmacodynamics
(n = 607)
Number of patients in data set
Study 1 35 47
Study 2 61 77
Study 3 170 216
Study 4 196 267
Male, n (%) 302 (65.4) 401 (66.1)
Ethnic origin, n (%)
Caucasian 429 (92.9) 559 (92.1)
Black 8 (1.7) 15 (2.5)
Asian 7 (1.5) 11 (1.8)
Hispanic 18 (3.9) 22 (3.6)
Age, years 60 (30–78) 60 (30–78)
Weight, kg 89 (57–132) 89 (55–138)
Body mass index, kg/m2 30.6 (20.4–42.2) 30.6 (20.4–42.2)
Fasting plasma glucose,
mmol/L
9.9 (5.1–20.0) 9.9 (5.1–20.0)
Add-on to metformin
No 266 (57.6) 340 (56.0)
Yes 196 (42.4) 267 (44.0)
The data are expressed as median (range [minimum–maximum])
unless specified otherwise
742 S. Retlich et al.
3.3 Impact of Significant Covariates on Exposure
(AUCs,ss)
The impact of the statistically significant covariates on the
exposure to linagliptin (AUCs,ss) after once-daily
administration of linagliptin was\20 % for each covariate
(Fig. 3). The impact of weight, age and sex, the covariates
of most interest, was very small compared with the overall
variability in the plasma concentration–time profiles
(Fig. 4). Using the 5th and 95th percentiles of the covariate
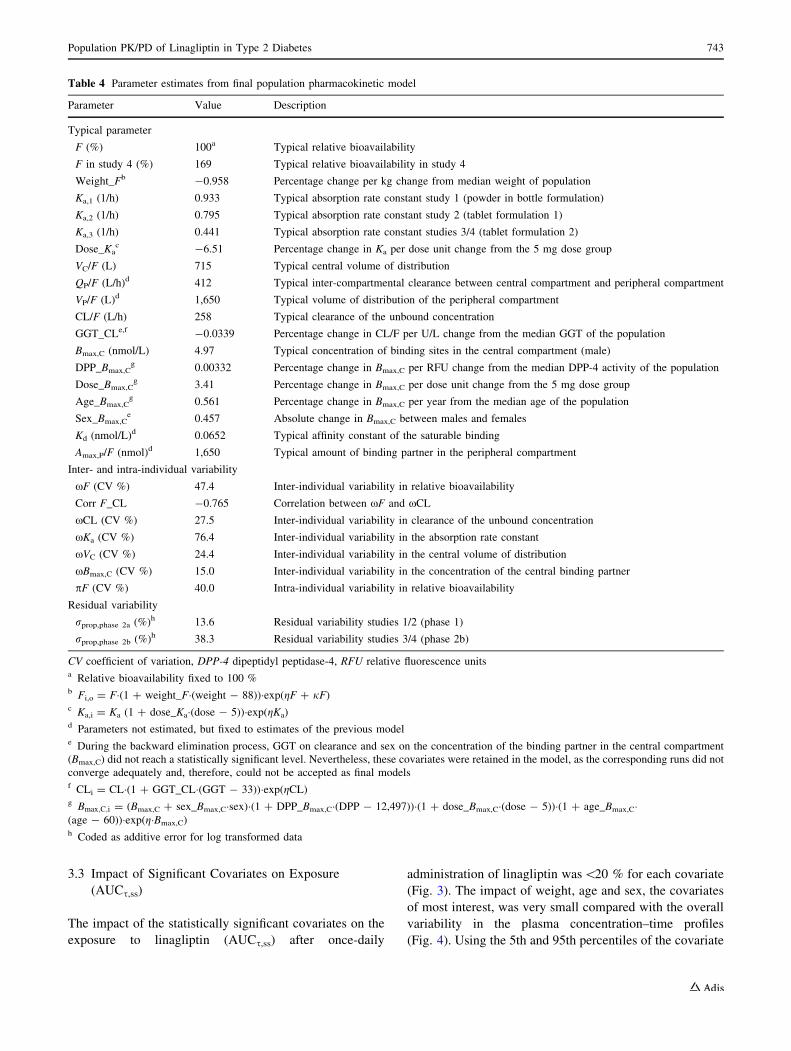
Table 4 Parameter estimates from final population pharmacokinetic model
Parameter Value Description
Typical parameter
F (%) 100a Typical relative bioavailability
F in study 4 (%) 169 Typical relative bioavailability in study 4
Weight_Fb -0.958 Percentage change per kg change from median weight of population
Ka,1 (1/h) 0.933 Typical absorption rate constant study 1 (powder in bottle formulation)
Ka,2 (1/h) 0.795 Typical absorption rate constant study 2 (tablet formulation 1)
Ka,3 (1/h) 0.441 Typical absorption rate constant studies 3/4 (tablet formulation 2)
Dose_Kac -6.51 Percentage change in Ka per dose unit change from the 5 mg dose group
VC/F (L) 715 Typical central volume of distribution
QP/F (L/h)d 412 Typical inter-compartmental clearance between central compartment and peripheral compartment
VP/F (L)d 1,650 Typical volume of distribution of the peripheral compartment
CL/F (L/h) 258 Typical clearance of the unbound concentration
GGT_CLe,f -0.0339 Percentage change in CL/F per U/L change from the median GGT of the population
Bmax,C (nmol/L) 4.97 Typical concentration of binding sites in the central compartment (male)
DPP_Bmax,Cg 0.00332 Percentage change in Bmax,C per RFU change from the median DPP-4 activity of the population
Dose_Bmax,Cg 3.41 Percentage change in Bmax,C per dose unit change from the 5 mg dose group
Age_Bmax,Cg 0.561 Percentage change in Bmax,C per year from the median age of the population
Sex_Bmax,Ce 0.457 Absolute change in Bmax,C between males and females
Kd (nmol/L)d 0.0652 Typical affinity constant of the saturable binding
Amax,P/F (nmol)d 1,650 Typical amount of binding partner in the peripheral compartment
Inter- and intra-individual variability
xF (CV %) 47.4 Inter-individual variability in relative bioavailability
Corr F_CL -0.765 Correlation between xF and xCL
xCL (CV %) 27.5 Inter-individual variability in clearance of the unbound concentration
xKa (CV %) 76.4 Inter-individual variability in the absorption rate constant
xVC (CV %) 24.4 Inter-individual variability in the central volume of distribution
xBmax,C (CV %) 15.0 Inter-individual variability in the concentration of the central binding partner
pF (CV %) 40.0 Intra-individual variability in relative bioavailability
Residual variability
rprop,phase 2a (%)h 13.6 Residual variability studies 1/2 (phase 1)
rprop,phase 2b (%)h 38.3 Residual variability studies 3/4 (phase 2b)
CV coefficient of variation, DPP-4 dipeptidyl peptidase-4, RFU relative fluorescence unitsa Relative bioavailability fixed to 100 %b Fi,o = F�(1 ? weight_F�(weight - 88))�exp(gF ? jF)c Ka,i = Ka (1 ? dose_Ka�(dose - 5))�exp(gKa)d Parameters not estimated, but fixed to estimates of the previous modele During the backward elimination process, GGT on clearance and sex on the concentration of the binding partner in the central compartment
(Bmax,C) did not reach a statistically significant level. Nevertheless, these covariates were retained in the model, as the corresponding runs did not
converge adequately and, therefore, could not be accepted as final modelsf CLi = CL�(1 ? GGT_CL�(GGT - 33))�exp(gCL)g Bmax;C;i = (Bmax,C ? sex_Bmax,C�sex)�(1 ? DPP_Bmax,C�(DPP - 12,497))�(1 ? dose_Bmax,C�(dose - 5))�(1 ? age_Bmax,C�(age - 60))�exp(g�Bmax,C)h Coded as additive error for log transformed data
Population PK/PD of Linagliptin in Type 2 Diabetes 743

distributions (numbers shown in parentheses), the data
demonstrated that even a combination of covariate effects
resulted in only a moderate impact on linagliptin exposure;
i.e. the exposure changed by only ?63 % or -26 %,
respectively, for (a) an elderly (73-year-old) female patient
of low weight (67 kg), with a high GGT level (158 U/L)
and high pre-dose DPP-4 activity (18,623 relative fluores-
cence units [RFU]), on concomitant metformin therapy; or
(b) a young (42-year-old), relatively heavy (117 kg) male
patient, with a low GGT level (9.4 U/L) and low pre-dose
DPP-4 activity (8,025 RFU).
3.4 Population Pharmacokinetic/Pharmacodynamic
Analysis
DPP-4 activity correlated well with linagliptin plasma
concentrations (Fig. 5). A sigmoid Emax model performed
significantly better to describe this correlation than a sim-
ple Emax model (DOBJF -6,399).
The individual baseline DPP-4 activities and EC50 val-
ues were correlated, an observation that is physiologically
plausible: the more DPP-4 molecules that are available, the
higher the baseline DPP-4 activity is and the more lina-
gliptin molecules are needed to reduce 50 % of the DPP-4
activity. Thus, the correlation between baseline DPP-4
activity and the concentration resulting in the half-maxi-
mum effect (EC50) was implemented as follows:
EC50;i ¼ EC50 � ð1 þ BSL EC50 � ðBSLi � 11;600ÞÞ� expðgEC50Þ
The individual EC50 parameter (EC50,i) depends on the
typical EC50 parameter, the typical covariate effect
parameter BSL_EC50, the difference between the individ-
ual predicted baseline estimate (BSLi) and the median
baseline value of 11,600 RFU, as well as the inter-indi-
vidual variability of EC50 (gEC50). This implementation of
the correlation was significantly superior to estimates of a
correlation between BSL and EC50, using the block option
(DOBJF -76).
The final model took into account the covariate effects
of GGT (DOBJF 108), ALT (DOBJF 25), FPG (DOBJF250), TG (DOBJF 155), cholesterol (DOBJF 35) and sex
Fig. 3 Influence of statistically significant covariates (study/formu-
lation, metformin co-medication, weight, age and baseline dipeptidyl
peptidase [DPP]-4 activity) on the area under the plasma concentra-
tion–time curve (AUC) after administration of linagliptin 5 mg
Fig. 4 Impact of weight, age and sex on linagliptin plasma concen-
tration–time profiles after administration of linagliptin 5 mg. The
overall variability was determined as the 90 % prediction interval of
1,000 simulated concentration–time profiles based on the base
population pharmacokinetic model (grey shaded area)
744 S. Retlich et al.

(DOBJF 18) on the baseline DPP-4 activity, in addition to
the effect of TG on the EC50 parameter (DOBJF 29)
(Table 5). Compared with the base model, inter-individual
variability for BSL and EC50 was reduced (16.9 versus
21.6 % and 15.4 versus 18.4 %, respectively). In addition,
the residual variability of the final model was estimated to
be smaller compared with the base model (14.8 versus
15.7 %, respectively). The goodness-of-fit plots indicated
that the model provides an adequate description of the
DPP-4 activity values (except for two extreme DPP-4
activity data points) (for further detail, see the Appendix
and Appendix Fig. 4 in the Electronic Supplementary
Material). The final model was evaluated by a posterior
predictive check; the variables of interest were steady-state
plasma DPP-4 inhibition at 2 and 24 h after linagliptin
administration. The differences between the observed and
predicted median DPP-4 inhibition were small (the maxi-
mum was a difference of 5 % in the 24 h DPP-4 inhibition
in the 2.5 mg dose group) (see Appendix Table 3 in the
Electronic Supplementary Material).
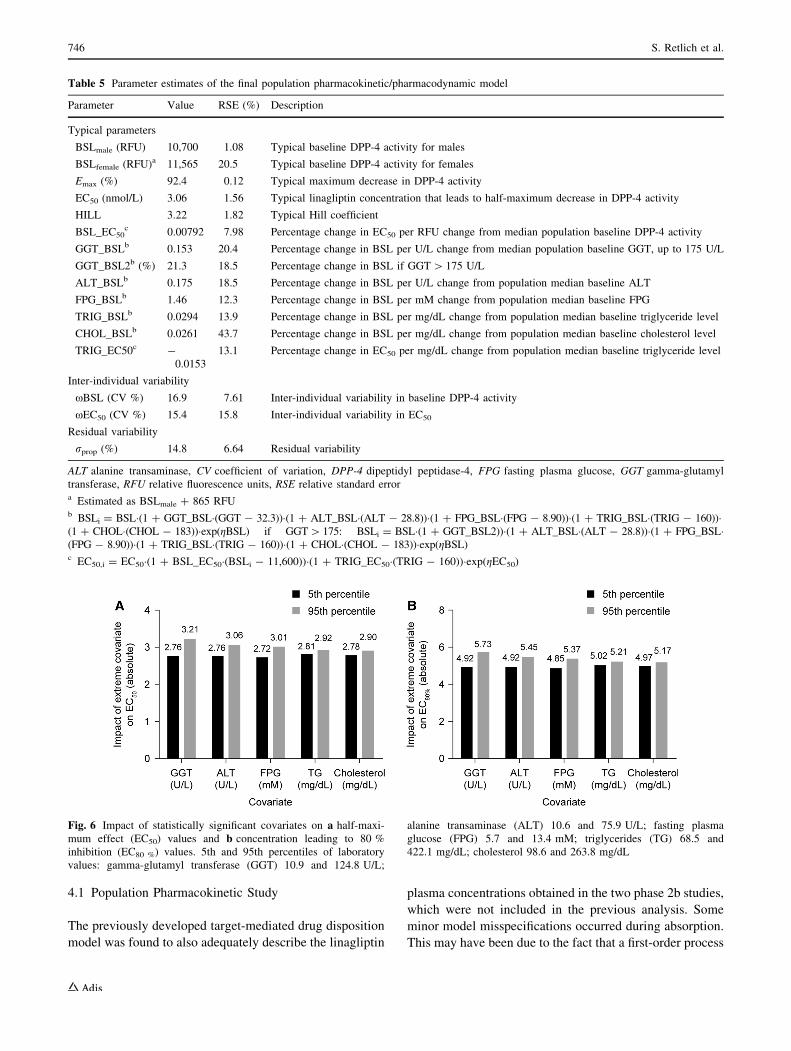
The statistically significant covariates were evaluated
for their influence on the EC50 and EC80 % (Fig. 6). With
use of the 5th and 95th percentiles of the covariate distri-
butions (numbers shown in parentheses), the data demon-
strated that the combination of covariate effects led to a
maximum EC50 value of 4.13 nM and a minimum EC50
value of 2.49 nM (EC80 % maximum 7.38 nM and mini-
mum 4.44 nM), respectively, for (a) female sex and high
levels of GGT (124.8 U/L), ALT (75.9 U/L), FPG
(13.4 mM), TG (422.1 mg/dL) and cholesterol (263.8 mg/
dL); or (b) male sex and low levels of GGT (10.9 U/L),
ALT (10.6 U/L), FPG (5.7 mM), TG (68.5 mg/dL) and
cholesterol (98.6 mg/dL).
3.5 Pharmacokinetic and Pharmacodynamic Effects
of a Missed Dose of Linagliptin
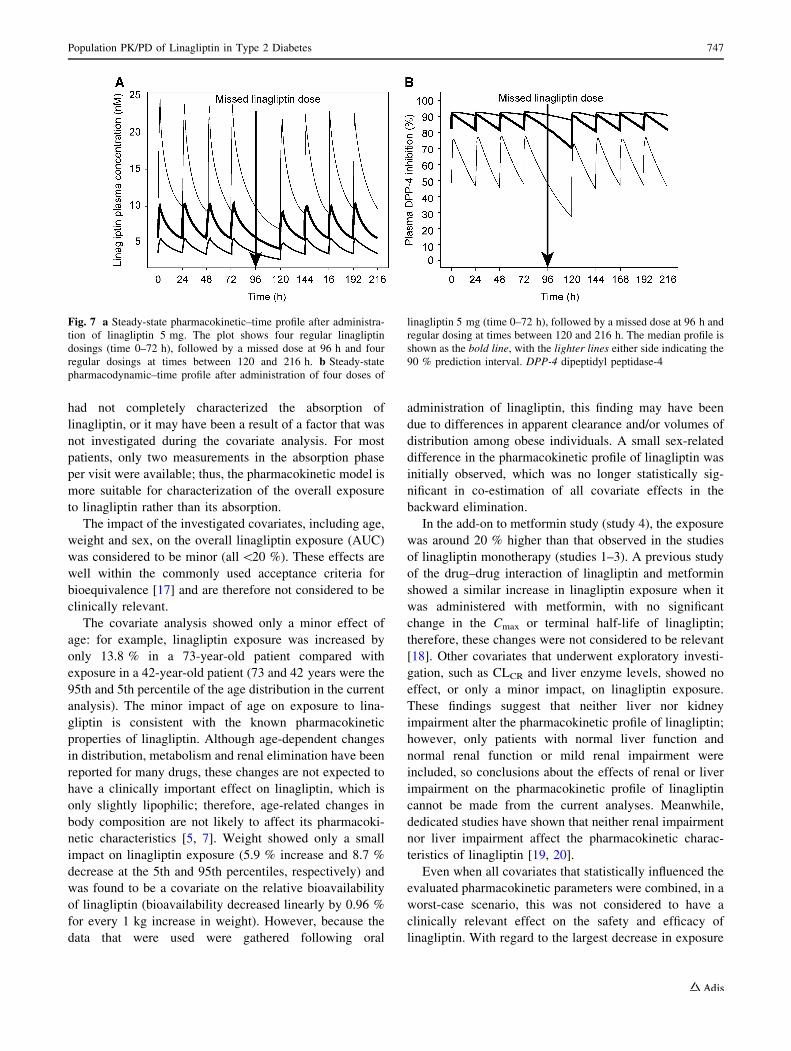
The simulations showed that when a linagliptin dose is
missed, 48 h after the last dose, the median linagliptin
plasma concentration is 4.21 nM (90 % prediction interval
2.65–6.86), compared with 5.58 nM (3.55–9.69) 24 h after
dosing (Fig. 7a). The corresponding data for DPP-4 inhi-
bition, following a missed dose, show that 48 h after the
last linagliptin dose, enzyme inhibition remains at a median
level of 69.6 % (27.0–87.1), compared with 81.7 %
(47.5–90.5) 24 h after dosing. The simulations show that
when a dose of linagliptin is taken after a missed dose, the
linagliptin plasma concentration and the degree of DPP-4
inhibition are only slightly reduced after this dose com-
pared with the dosing intervals before the missed dose, and
the degree of DPP-4 inhibition remains above 80 %
(median linagliptin Ctrough 5.29 nM [3.38–8.82]; median
trough DPP-4 inhibition 80.3 % [44.3–90.1]) (Fig. 7b).
4 Discussion
The current population analyses were performed to inves-
tigate the impact of clinically relevant covariates on the
pharmacokinetics of linagliptin and their effects on DPP-4
inhibition. These analyses extend the findings of a previous
population analysis, which showed that the non-linear
pharmacokinetic profile of linagliptin is appropriately
characterized by a target-mediated drug disposition model
accounting for concentration-dependent binding of lina-
gliptin to its target, DPP-4, in plasma and tissues [15].
Plasma DPP-4 activity was included in this model in a semi-
mechanistic way by relating it to the model-calculated
plasma DPP-4 occupancy with linagliptin. The description
of DPP-4 inhibition by this semi-mechanistic occupancy
model was comparable to a sigmoid Emax model, and thus
the more mechanistic model was preferred. In the current
analysis, however, the number of analysed data, together
with the complexity of the pharmacokinetic model, led to
extensively long run times of more than 5 days for the
pharmacokinetic model alone. Therefore, pharmacokinetics
and pharmacokinetics/pharmacodynamics were not ana-
lysed simultaneously, but two separate covariate analyses
were performed, one for pharmacokinetics and one for
pharmacokinetics/pharmacodynamics. For the population
pharmacokinetic analysis, the target-mediated drug dispo-
sition model was used, and baseline DPP-4 activity was
included as a covariate on the model parameter that reflects
plasma DPP-4 concentrations (Bmax,C) (Fig. 3) to account
for the close relationship between the pharmacokinetics of
linagliptin and DPP-4 activity. In the population pharma-
cokinetic/pharmacodynamic analysis, linagliptin plasma
concentrations were directly correlated with DPP-4 activity,
using a descriptive sigmoid Emax model.
Fig. 5 Correlation of linagliptin plasma concentrations and plasma
dipeptidyl peptidase (DPP)-4 activity in studies 1–4. Placebo and pre-
dose observations are not shown because of the logarithmic scale.
RFU relative fluorescence units
Population PK/PD of Linagliptin in Type 2 Diabetes 745
4.1 Population Pharmacokinetic Study
The previously developed target-mediated drug disposition
model was found to also adequately describe the linagliptin
plasma concentrations obtained in the two phase 2b studies,
which were not included in the previous analysis. Some
minor model misspecifications occurred during absorption.
This may have been due to the fact that a first-order process
Table 5 Parameter estimates of the final population pharmacokinetic/pharmacodynamic model
Parameter Value RSE (%) Description
Typical parameters
BSLmale (RFU) 10,700 1.08 Typical baseline DPP-4 activity for males
BSLfemale (RFU)a 11,565 20.5 Typical baseline DPP-4 activity for females
Emax (%) 92.4 0.12 Typical maximum decrease in DPP-4 activity
EC50 (nmol/L) 3.06 1.56 Typical linagliptin concentration that leads to half-maximum decrease in DPP-4 activity
HILL 3.22 1.82 Typical Hill coefficient
BSL_EC50c 0.00792 7.98 Percentage change in EC50 per RFU change from median population baseline DPP-4 activity
GGT_BSLb 0.153 20.4 Percentage change in BSL per U/L change from median population baseline GGT, up to 175 U/L
GGT_BSL2b (%) 21.3 18.5 Percentage change in BSL if GGT[ 175 U/L
ALT_BSLb 0.175 18.5 Percentage change in BSL per U/L change from population median baseline ALT
FPG_BSLb 1.46 12.3 Percentage change in BSL per mM change from population median baseline FPG
TRIG_BSLb 0.0294 13.9 Percentage change in BSL per mg/dL change from population median baseline triglyceride level
CHOL_BSLb 0.0261 43.7 Percentage change in BSL per mg/dL change from population median baseline cholesterol level
TRIG_EC50c -
0.0153
13.1 Percentage change in EC50 per mg/dL change from population median baseline triglyceride level
Inter-individual variability
xBSL (CV %) 16.9 7.61 Inter-individual variability in baseline DPP-4 activity
xEC50 (CV %) 15.4 15.8 Inter-individual variability in EC50
Residual variability
rprop (%) 14.8 6.64 Residual variability
ALT alanine transaminase, CV coefficient of variation, DPP-4 dipeptidyl peptidase-4, FPG fasting plasma glucose, GGT gamma-glutamyl
transferase, RFU relative fluorescence units, RSE relative standard errora Estimated as BSLmale ? 865 RFUb BSLi = BSL�(1 ? GGT_BSL�(GGT - 32.3))�(1 ? ALT_BSL�(ALT - 28.8))�(1 ? FPG_BSL�(FPG - 8.90))�(1 ? TRIG_BSL�(TRIG - 160))�(1 ? CHOL�(CHOL - 183))�exp(gBSL) if GGT[175: BSLi = BSL�(1 ? GGT_BSL2))�(1 ? ALT_BSL�(ALT - 28.8))�(1 ? FPG_BSL�(FPG - 8.90))�(1 ? TRIG_BSL�(TRIG - 160))�(1 ? CHOL�(CHOL - 183))�exp(gBSL)c EC50,i = EC50�(1 ? BSL_EC50�(BSLi - 11,600))�(1 ? TRIG_EC50�(TRIG - 160))�exp(gEC50)
Fig. 6 Impact of statistically significant covariates on a half-maxi-
mum effect (EC50) values and b concentration leading to 80 %
inhibition (EC80 %) values. 5th and 95th percentiles of laboratory
values: gamma-glutamyl transferase (GGT) 10.9 and 124.8 U/L;
alanine transaminase (ALT) 10.6 and 75.9 U/L; fasting plasma
glucose (FPG) 5.7 and 13.4 mM; triglycerides (TG) 68.5 and
422.1 mg/dL; cholesterol 98.6 and 263.8 mg/dL
746 S. Retlich et al.
had not completely characterized the absorption of
linagliptin, or it may have been a result of a factor that was
not investigated during the covariate analysis. For most
patients, only two measurements in the absorption phase
per visit were available; thus, the pharmacokinetic model is
more suitable for characterization of the overall exposure
to linagliptin rather than its absorption.
The impact of the investigated covariates, including age,
weight and sex, on the overall linagliptin exposure (AUC)
was considered to be minor (all\20 %). These effects are
well within the commonly used acceptance criteria for
bioequivalence [17] and are therefore not considered to be
clinically relevant.
The covariate analysis showed only a minor effect of
age: for example, linagliptin exposure was increased by
only 13.8 % in a 73-year-old patient compared with
exposure in a 42-year-old patient (73 and 42 years were the
95th and 5th percentile of the age distribution in the current
analysis). The minor impact of age on exposure to lina-
gliptin is consistent with the known pharmacokinetic
properties of linagliptin. Although age-dependent changes
in distribution, metabolism and renal elimination have been
reported for many drugs, these changes are not expected to
have a clinically important effect on linagliptin, which is
only slightly lipophilic; therefore, age-related changes in
body composition are not likely to affect its pharmacoki-
netic characteristics [5, 7]. Weight showed only a small
impact on linagliptin exposure (5.9 % increase and 8.7 %
decrease at the 5th and 95th percentiles, respectively) and
was found to be a covariate on the relative bioavailability
of linagliptin (bioavailability decreased linearly by 0.96 %
for every 1 kg increase in weight). However, because the
data that were used were gathered following oral
administration of linagliptin, this finding may have been
due to differences in apparent clearance and/or volumes of
distribution among obese individuals. A small sex-related
difference in the pharmacokinetic profile of linagliptin was
initially observed, which was no longer statistically sig-
nificant in co-estimation of all covariate effects in the
backward elimination.
In the add-on to metformin study (study 4), the exposure
was around 20 % higher than that observed in the studies
of linagliptin monotherapy (studies 1–3). A previous study
of the drug–drug interaction of linagliptin and metformin
showed a similar increase in linagliptin exposure when it
was administered with metformin, with no significant
change in the Cmax or terminal half-life of linagliptin;
therefore, these changes were not considered to be relevant
[18]. Other covariates that underwent exploratory investi-
gation, such as CLCR and liver enzyme levels, showed no
effect, or only a minor impact, on linagliptin exposure.
These findings suggest that neither liver nor kidney
impairment alter the pharmacokinetic profile of linagliptin;
however, only patients with normal liver function and
normal renal function or mild renal impairment were
included, so conclusions about the effects of renal or liver
impairment on the pharmacokinetic profile of linagliptin
cannot be made from the current analyses. Meanwhile,
dedicated studies have shown that neither renal impairment
nor liver impairment affect the pharmacokinetic charac-
teristics of linagliptin [19, 20].
Even when all covariates that statistically influenced the
evaluated pharmacokinetic parameters were combined, in a
worst-case scenario, this was not considered to have a
clinically relevant effect on the safety and efficacy of
linagliptin. With regard to the largest decrease in exposure
Fig. 7 a Steady-state pharmacokinetic–time profile after administra-
tion of linagliptin 5 mg. The plot shows four regular linagliptin
dosings (time 0–72 h), followed by a missed dose at 96 h and four
regular dosings at times between 120 and 216 h. b Steady-state
pharmacodynamic–time profile after administration of four doses of
linagliptin 5 mg (time 0–72 h), followed by a missed dose at 96 h and
regular dosing at times between 120 and 216 h. The median profile is
shown as the bold line, with the lighter lines either side indicating the
90 % prediction interval. DPP-4 dipeptidyl peptidase-4
Population PK/PD of Linagliptin in Type 2 Diabetes 747

(-26 %) for the 5 mg dose, this would still be regarded as
effective therapy, as the linagliptin exposure is within the
range of the 2.5 mg dose group. The largest increase in
exposure (?63 %) for the 5 mg dose can still be regarded
as having acceptable safety on the basis of the currently
available safety data, including a single rising-dose study
of healthy volunteers, where a single dose of linagliptin
was shown to be well tolerated up to a dose of 600 mg [5].
These findings indicate that the evaluated covariates do not
affect the pharmacokinetic characteristics of linagliptin in a
clinically important manner and that no dose adjustment is
needed on the basis of age, sex or weight.
As a result of extensive run times and high g-shrinkage,the covariate selection process [16] was adapted (see the
‘Covariate Model Development’ section for details). In
order to ensure that no covariate with a major impact on
pharmacokinetics was missed, several covariates were
predefined on the basis of physiological considerations to
be tested in the forward inclusion/backward elimination
approach; these included age, sex and weight, as well as
levels of liver enzymes (ALT and GGT) and CLCR.
Moreover, graphical analysis of the correlation between the
measured linagliptin concentrations and the investigated
covariates for patients receiving linagliptin 5 mg (data not
shown) confirmed the results of the model-based covariate
analysis, demonstrating that none of the tested covariates
had a major impact on the Ctrough or Cmax values.
4.2 Population Pharmacokinetic/Pharmacodynamic
Study
The relationship between linagliptin plasma concentrations
and plasma DPP-4 activity was best described by a sigmoid
Emax model with typical EC50 values of 2.84 nM for males
and 3.05 nM for females, and a typical Hill coefficient of
3.22. A correlation between EC50 and baseline DPP-4
activity was accounted for in the model. Thus, covariates
affecting baseline DPP-4 activity also affect the EC50
value. The rationale for this is based on the premise that a
higher DPP-4 plasma concentration, represented by higher
DPP-4 baseline activity, necessitates a higher linagliptin
concentration for half-maximum DPP-4 inhibition to be
reached.
Individually, the investigated covariates, including age,
sex and weight, had only a small impact on the baseline
DPP-4 activity, the EC50 and the EC80 %. Age had no
impact on DPP-4 activity, an observation that is consistent
with previous findings [21], although some studies have
shown a correlation [22, 23], suggesting that the impact of
age on DPP-4 activity, if it exists, is minor. Neither weight
nor body mass index were shown to affect DPP-4 activity,
which is in accordance with the findings of previous
research [22, 24]. Baseline DPP-4 activity, and thus the
EC50, was slightly higher in females than in males in the
present analysis (11,565 versus 10,700 RFU). In contrast,
previous studies have suggested slightly lower DPP-4
activity in females than in males [24], or no influence of
sex on DPP-4 activity [21]. Baseline DPP-4 activity was
correlated with the levels of the liver enzymes GGT, ALT
and AST, a finding that is consistent with previous obser-
vations [24]. Baseline DPP-4 activity was also correlated
with FPG levels, a finding that is consistent with the
knowledge that DPP-4 inhibition is linked to glucose-
lowering efficacy [25] and is correlated with HbA1c and
FPG levels in patients with T2DM [22, 23].
Even the combined influence of all significant covari-
ates, in a worst-case scenario, only changed the EC50 from
a minimum of 2.49 nM to a maximum of 4.13 nM, and
changed the EC80 % from a minimum of 4.44 nM to a
maximum of 7.38 nM. In view of this finding, and the high
variability in the DPP-4 inhibition/HbA1c relationship, the
investigated covariates, including weight, sex and age, are
not considered to be clinically important. Moreover, a
scenario leading to higher baseline DPP-4 activity, and thus
higher EC50 or EC80 % values, would lead to an increase in
linagliptin concentrations, since baseline DPP-4 activity
was shown to be one of the main factors influencing
linagliptin exposure.
The populations that were evaluated contained mostly
Caucasian patients, with insufficient numbers of patients of
black or Asian ethnicity to be included in the analyses.
However, recent studies of linagliptin in Asian (Japanese)
[26] and black subjects [27] reported that it exhibited
pharmacokinetic/pharmacodynamic profiles similar to
those observed in Caucasian subjects.
4.3 Simulation
The simulations of steady-state pharmacokinetic and phar-
macodynamic–time profiles after administration of lina-
gliptin showed that 24 h after a dose of linagliptin is missed,
the median DPP-4 inhibition remains at about 70 %, sug-
gesting that most patients will continue to experience glu-
cose-lowering efficacy after a missed dose of linagliptin
5 mg. This pharmacological attribute may translate into
clinical benefits for patients with poor adherence who might
sometimes miss a dose, suggesting that this would have a
minimal impact on the long-term efficacy of therapy. How-
ever, this has not been confirmed in longer-term prospective
clinical studies in patients with T2DM.
5 Conclusion
The findings of these analyses, reporting previously
unpublished data on the pharmacokinetic and
748 S. Retlich et al.

pharmacodynamic profile of linagliptin, show that factors
including age, sex and weight do not significantly alter the
pharmacokinetics and DPP-4 inhibitory activity of lina-
gliptin. These findings are consistent with clinical data on
the analysed covariates, which have shown that factors
such as weight, sex, race and age do not significantly alter
the efficacy and safety of linagliptin [28–31]. These results
also indicate that there is no need for linagliptin dose
adjustment on the basis of age, sex or weight, and they
extend the findings of previous research showing that
linagliptin does not require dose adjustment in patients
with renal or hepatic impairment [19, 20].
Acknowledgments The main results of this population analysis
have been published previously [28]. The authors were fully
responsible for all content and editorial decisions, were involved in all
stages of manuscript development and approved the final version.
Medical writing assistance, supported financially by Boehringer In-
gelheim, was provided by Jennifer Edwards MB BS of Envision
Scientific Solutions during the preparation of this manuscript.
Conflicts of interest At the time of the analysis performed in this
study, S. R. was a Ph.D. student at the University of Bonn and
received a grant from Boehringer Ingelheim; she is now an employee
of Boehringer Ingelheim. U. G. M., S. P. and A. S. are all employees
of Boehringer Ingelheim. V. D. was an employee of Boehringer
Ingelheim at the time of the analysis; he is now an employee of
Novartis. C. F. was an employee of Boehringer Ingelheim while
the study took place; he is now an employee of Bayer Healthcare.
U. J. has received research Grants from Boehringer Ingelheim
(between 2006 and 2011) and received a research Grant from
Boehringer Ingelheim for the present study.
Open Access This article is distributed under the terms of the
Creative Commons Attribution Noncommercial License which per-
mits any noncommercial use, distribution, and reproduction in any
medium, provided the original author(s) and the source are credited.
References
1. Deacon CF, Holst JJ. Linagliptin, a xanthine-based dipeptidyl
peptidase-4 inhibitor with an unusual profile for the treatment of
type 2 diabetes. Expert Opin Investig Drugs. 2010;19(1):133–40.
2. Fuchs H, Binder R, Greischel A. Tissue distribution of the novel
DPP-4 inhibitor BI 1356 is dominated by saturable binding to its
target in rats. Biopharm Drug Dispos. 2009;30(5):229–40.
3. Heise T, Graefe-Mody EU, Huttner S, Ring A, Trommeshauser
D, Dugi KA. Pharmacokinetics, pharmacodynamics and tolera-
bility of multiple oral doses of linagliptin, a dipeptidyl peptidase-
4 inhibitor in male type 2 diabetes patients. Diabetes Obes Metab.
2009;11(8):786–94.
4. Thomas L, Eckhardt M, Langkopf E, Tadayyon M, Himmelsbach
F, Mark M. (R)-8-(3-Amino-piperidin-1-yl)-7-but-2-ynyl-3-
methyl-1-(4-methyl-quinazoli n-2-ylmethyl)-3,7-dihydro-purine-
2,6-dione (BI 1356), a novel xanthine-based dipeptidyl peptidase
4 inhibitor, has a superior potency and longer duration of action
compared with other dipeptidyl peptidase-4 inhibitors. J Pharma-
col Exp Ther. 2008;325(1):175–82.
5. Huttner S, Graefe-Mody EU, Withopf B, Ring A, Dugi KA.
Safety, tolerability, pharmacokinetics, and pharmacodynamics of
single oral doses of BI 1356, an inhibitor of dipeptidyl peptidase
4, in healthy male volunteers. J Clin Pharmacol. 2008;48(10):
1171–8.
6. Retlich S, Duval V, Ring A, Staab A, Huttner S, Jungnik A, et al.
Pharmacokinetics and pharmacodynamics of single rising intra-
venous doses (0.5 mg–10 mg) and determination of absolute
bioavailability of the dipeptidyl peptidase-4 inhibitor linagliptin
(BI 1356) in healthy male subjects. Clin Pharmacokinet.
2010;49(12):829–40.
7. Blech S, Ludwig-Schwellinger E, Grafe-Mody EU, Withopf B,
Wagner K. The metabolism and disposition of the oral dipeptidyl
peptidase-4 inhibitor, linagliptin, in humans. Drug Metab Dispos.
2010;38(4):667–78.
8. Fuchs H, Runge F, Held HD. Excretion of the dipeptidyl pepti-
dase-4 inhibitor linagliptin in rats is primarily by biliary excretion
and P-gp-mediated efflux. Eur J Pharm Sci. 2012;45(5):533–8.
9. Del Prato S, Barnett AH, Huisman H, Neubacher D, Woerle HJ,
Dugi KA. Effect of linagliptin monotherapy on glycaemic control
and markers of beta-cell function in patients with inadequately
controlled type 2 diabetes: a randomized controlled trial. Diabetes
Obes Metab. 2011;13(3):258–67.
10. Owens DR, Swallow R, Dugi KA, Woerle HJ. Efficacy and safety
of linagliptin in persons with type 2 diabetes inadequately con-
trolled by a combination of metformin and sulphonylurea: a
24-week randomized study. Diabet Med. 2011;28(11):1352–61.
11. Taskinen MR, Rosenstock J, Tamminen I, Kubiak R, Patel S,
Dugi KA, et al. Safety and efficacy of linagliptin as add-on
therapy to metformin in patients with type 2 diabetes: a ran-
domized, double-blind, placebo-controlled study. Diabetes Obes
Metab. 2011;13(1):65–74.
12. Forst T, Uhlig-Laske B, Ring A, Ritzhaupt A, Graefe-Mody U,
Dugi KA. The oral DPP-4 inhibitor linagliptin significantly
lowers HbA1c after 4 weeks of treatment in patients with type 2
diabetes mellitus. Diabetes Obes Metab. 2011;13(6):542–50.
13. Singh-Franco D, McLaughlin-Middlekauff J, Elrod S, Harrington
C. The effect of linagliptin on glycaemic control and tolerability
in patients with type 2 diabetes mellitus: a systematic review and
meta-analysis. Diabetes Obes Metab. 2012;14(8):694–708.
14. Forst T, Uhlig-Laske B, Ring A, Graefe-Mody U, Friedrich C,
Herbach K, et al. Linagliptin (BI 1356), a potent and selective
DPP-4 inhibitor, is safe and efficacious in combination with
metformin in patients with inadequately controlled type 2 dia-
betes. Diabet Med. 2010;27(12):1409–19.
15. Retlich S, Duval V, Graefe-Mody U, Jaehde U, Staab A. Impact
of target-mediated drug disposition on linagliptin pharmacoki-
netics and DPP-4 inhibition in type 2 diabetic patients. J Clin
Pharmacol. 2010;50(8):873–85.
16. Savic RM, Karlsson MO. Evaluation of an extended grid method
for estimation using nonparametric distributions. AAPS J.
2009;11(3):615–27.
17. US Department of Health and Human Services, Food and Drug
Administration, Center for Drug Evaluation and Research
(CDER). Guidance for industry: bioavailability and bioequiva-
lence studies for orally administered drug products—general
considerations. 2003. http://www.fda.gov/downloads/Drugs/…/
Guidances/ucm070124.pdf. Accessed 10 Sep 2013.
18. Graefe-Mody EU, Padula S, Ring A, Withopf B, Dugi KA.
Evaluation of the potential for steady-state pharmacokinetic and
pharmacodynamic interactions between the DPP-4 inhibitor li-
nagliptin and metformin in healthy subjects. Curr Med Res Opin.
2009;25(8):1963–72.
19. Graefe-Mody U, Rose P, Retlich S, Ring A, Waldhauser L, Cinca
R, et al. Pharmacokinetics of linagliptin in subjects with hepatic
impairment. Br J Clin Pharmacol. 2012;74(1):75–85.
20. Graefe-Mody U, Friedrich C, Port A, Ring A, Retlich S, Heise T,
et al. Effect of renal impairment on the pharmacokinetics of the
Population PK/PD of Linagliptin in Type 2 Diabetes 749

dipeptidyl peptidase-4 inhibitor linagliptin. Diabetes Obes Metab.
2011;13(10):939–46.
21. Cordero OJ, Ayude D, Nogueira M, Rodriguez-Berrocal FJ, de la
Cadena MP. Preoperative serum CD26 levels: diagnostic effi-
ciency and predictive value for colorectal cancer. Br J Cancer.
2000;83(9):1139–46.
22. Mannucci E, Pala L, Ciani S, Bardini G, Pezzatini A, Sposato I,
et al. Hyperglycaemia increases dipeptidyl peptidase IV activity
in diabetes mellitus. Diabetologia. 2005;48(6):1168–72.
23. Ryskjaer J, Deacon CF, Carr RD, Krarup T, Madsbad S, Holst J,
et al. Plasma dipeptidyl peptidase-IV activity in patients with
type-2 diabetes mellitus correlates positively with HbA1c levels,
but is not acutely affected by food intake. Eur J Endocrinol.
2006;155(3):485–93.
24. Durinx C, Neels H, Van der Auwera JC, Naelaerts K, Scharpe S,
De Meester I. Reference values for plasma dipeptidyl-peptidase
IV activity and their association with other laboratory parameters.
Clin Chem Lab Med. 2001;39(2):155–9.
25. Drucker DJ. Dipeptidyl peptidase-4 inhibition and the treatment
of type 2 diabetes: preclinical biology and mechanisms of action.
Diabetes Care. 2007;30(6):1335–43.
26. Horie Y, Kanada S, Watada H, Sarashina A, Taniguchi A, Hayashi
N, et al. Pharmacokinetic, pharmacodynamic, and tolerability
profiles of the dipeptidyl peptidase-4 inhibitor linagliptin: a 4-week
multicenter, randomized, double-blind, placebo-controlled phase
IIa study in Japanese type 2 diabetes patients. Clin Ther.
2011;33(7):973–89.
27. Friedrich C, Glund S, Lionetti D, Kissling CJ, Righetti J, Patel S,
et al. Pharmacokinetic and pharmacodynamic evaluation of
linagliptin in African American patients with type 2 diabetes
mellitus. Br J Clin Pharmacol. 2013;76(3):445–54.
28. Graefe-Mody U, Retlich S, Friedrich C. Clinical pharmacoki-
netics and pharmacodynamics of linagliptin. Clin Pharmacokinet.
2012;51(7):411–27.
29. Barnett AH, Huisman H, Jones R, von Eynatten M, Patel S,
Woerle HJ. Linagliptin for patients aged 70 years or older with
type 2 diabetes inadequately controlled with common antidiabe-
tes treatments: a randomised, double-blind, placebo-controlled
trial. Lancet. 2013;382(9902):1413–23.
30. Inagaki N, Watada H, Murai M, Kagimura T, Gong Y, Patel S,
et al. Linagliptin provides effective, well-tolerated add-on ther-
apy to pre-existing oral antidiabetic therapy over 1 year in Jap-
anese patients with type 2 diabetes. Diabetes Obes Metab.
2013;15(9):833–43.
31. Thrasher J, Ahmed A, Daniels K, Patel S, Whetteckey J. Ran-
domized, placebo-controlled, double-blind, 24-week study of
linagliptin 5 mg/day in black/African American patients with
type 2 diabetes. AACE 21st Annual Meeting and Clinical Con-
gress; 23–27 May 2012; Philadelphia, PA. Abstract 206.
750 S. Retlich et al.